March 2014 BofAML 2014 Brazil Conference - Fibria ... · 432 448 471+ 473 505 2009 (2) 2010 (2)...
38
BofAML 2014 Brazil Conference March 2014
Transcript of March 2014 BofAML 2014 Brazil Conference - Fibria ... · 432 448 471+ 473 505 2009 (2) 2010 (2)...

BofAML 2014 Brazil Conference March 2014

The information contained in this presentation may include statements which constitute forward-looking statements, within the meaning of Section 27A of the U.S. Securities Act of 1933, as amended, and Section 21E of the U.S. Securities Exchange Act of 1934, as amended. Such forward-looking statements involve a certain degree of risk and uncertainty with respect to business, financial, trend, strategy and other forecasts, and are based on assumptions, data or methods that, although considered reasonable by the company at the time, may turn out to be incorrect or imprecise, or may not be possible to realize. The company gives no assurance that expectations disclosed in this presentation will be confirmed. Prospective investors are cautioned that any such forward-looking statements are not guarantees of future performance and involve risks and uncertainties, and that actual results may differ materially from those in the forward-looking statements, due to a variety of factors, including, but not limited to, the risks of international business and other risks referred to in the company’s filings with the CVM and SEC. The company does not undertake, and specifically disclaims any obligation to update any forward-looking statements, which speak only for the date on which they are made.
Disclaimer
2
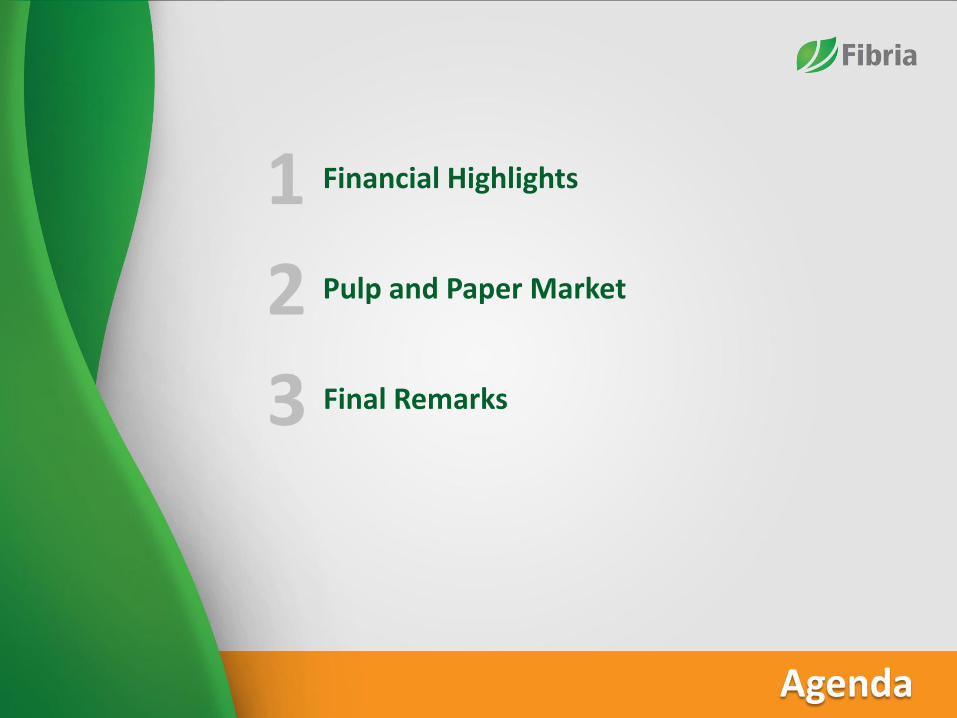
Agenda
Financial Highlights 1 Pulp and Paper Market 2 Final Remarks 3

Financial Highlights

1,370 1,347 1,358 1,510
1,301 1,441
4Q12 3Q13 4Q13
Production Sales
4Q13 Results
5
EBITDA (R$ million) and EBITDA Margin (%) Production Cash Cost (R$/t)
Pulp Production and Sales (‘000 t) Net Revenue (R$ million)
1,853 1,841 1,958
4Q12 3Q13 4Q13
Record
446
501 466
4Q12 3Q13 4Q13
+5% 41% 41% 42%
753 762
823
4Q12 3Q13 4Q13
Record

Indebtness
6
Net Debt (Million)
3.4 3.0 2.8
3.3 2.9 2.6
10,768 9,487 9,773
5,269 4,254 4,172
Dec/12 Sep/13 Dec/13
R$ US$
Debt Amortization Schedule (R$ million) – Dec./13 (1)
Gross Debt (Million)
7,745 8,240 7,849
6,946
3,790 3,695 3,351 2,965
Dec/12 Sep/13 Dec/13
R$ US$
Net Debt/EBITDA (US$) Net Debt/EBITDA (R$)
Dec/13 (Pro forma)
2.5
2.3
After Bond 2020
Repurchase
3,482
- 21% - 34%
1,471
903
1,924
4,298
1,474
834 830 1,256
976 762
2,169
1,441
26 5
Liquidity 2014 2015 2016 2017 2018 2019 2020 2021 2022 2023
Pre-Payment BNDES ECN Trade Finance (ST) Finnvera Bond
Revolver
Land sale (2)
Cash
(1) Does not consider the reclassification of the bond 2020 to the short term. (2) Pending payment related to the land sale.

Fibria delivered the most significant leverage reduction in the LTM
Net Debt/EBITDA (x)
3.9 3.6
2.9
3.2
4.2
4.8 5.2
4.7
4.5 3.4
3.1
3.3 3.0 2.8
4.7 4.7 5.0 5.1 5.1 5.2
2.4 2.6
2.9 3.0
2.8
3.7
3.1
3.8
Sep/10 Dec/10 Mar/11 Jun/11 Sep/11 Dec/11 Mar/12 Jun/12 Sep/12 Dec/12 Mar/13 Jun/13 Sep/13 Dec/13
Fibria Arauco CMPC Klabin Suzano
S&P BB+/Stable BBB-/Stable BBB/Negative BBB-/Stable BB/Negative
Moody’s Ba1/Positive Baa3/Negative Baa3/Negative - Ba2/Stable
Fitch BBB-/Stable BBB/Stable BBB+/Stable BBB-/Stable BB-/Positive
(1) 2013 projection by Citibank.
Ratings
7

Net Results (R$ million) – 4Q13
823 (444)
(185)
810
(5) (118)
(506)
(713) (32)
Adjusted EBITDA
Rev. (Exp.) non-recurring /
non-cash
Debt Exchange Variation /
MtM Hedge Debt
MtM Operational
Hedge
Net Interest Depreciation, amortization and depletion
IR/CS Other Net Profit (Loss)
Non-recurring impacts
(1) Include non-recurring expenses /non-cash, other exchange and currency variation and other financial incomes and expenditures.
(1)
∆
∆
Refis
Debt Hedge
Debt exchange variation
Excluding the non-recurring effects , profit would
reached approximately R$ 323 million at 4Q13.
8
9
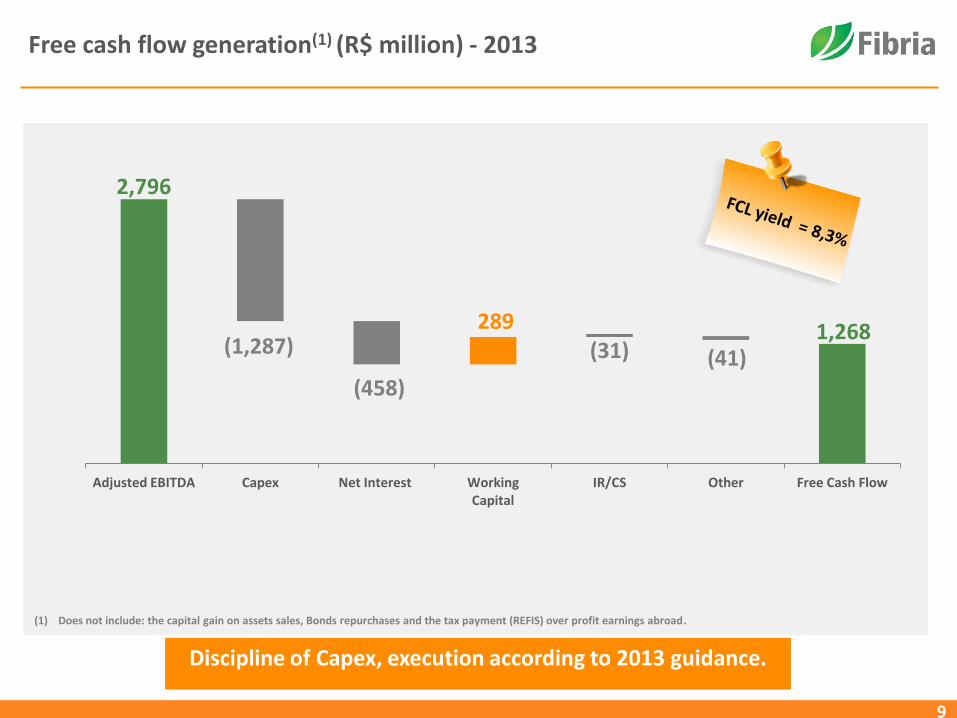
Free cash flow generation(1) (R$ million) - 2013
Discipline of Capex, execution according to 2013 guidance.
2,796
1,268 (1,287)
(458)
289 (31) (41)
Adjusted EBITDA Capex Net Interest Working Capital
IR/CS Other Free Cash Flow
(1) Does not include: the capital gain on assets sales, Bonds repurchases and the tax payment (REFIS) over profit earnings abroad.

Positive Free Cash Flow (1) (R$ million)
10
2013: R$ 1,268 million
230
-402
-149 -12
221 57 157
399
167 234
122
746
1Q11 2Q11 3Q11 4Q11 1Q12 2Q12 3Q12 4Q12 1Q13 2Q13 3Q13 4Q13
1.64 1.59 Average 1.80 1.77 2.03 2.06 2.28 2.07 1.96 2.00
FX(R$/US$)
2.28 1.67
2012: R$ 836 million 2011: R$ -333 million
(1) Does not include: the capital gain on assets sales, Bonds repurchases and the tax payment (REFIS) over profit earnings abroad.

538
244
(248) (-88)
56
(6) (8)
Adjusted EBITDA Capex Net Interest Working Capital
IR/CS Other Free Cash Flow
11
Free Cash Flow per ton
Fibria delivers one of the highest EBITDA/t and FCF/t of the industry
2013 Results (R$/ton)

2.00 1.76 1.67
1.95 2.16
562
844 810 751 791
FX and Pulp Price explain 80% of Fibria’s EBITDA Margin
12
Average Price FOEX (US$/t)
Exchange Rate Average (R$/US$)
EBITDA Margin
EBITDA (R$ million)
29%
40%
34% 36% 40%
1,522
2,526
1,964 2,253
2,796
2009 (1) 2010 (1) 2011 (1) 2012 2013
(1) Excludes Conpacel

0%
5%
10%
15%
20%
25%
30%
5% 10% 15% 20% 25%
Exp
ect
ed
Re
turn
(%
p.a
.)
Volatility (% a.a.)
Efficient Frontier (1) with and w/o BHKP
Com Minério de Ferro Com BHKP e Minério de Ferro (1) Since 2009 (2) Considering the expected return of a portfolio comprised of: DJ, Ibovespa Index , Oil, Copper, Niquel, Libor 3M in US Dollar and BHKP.
Without Pulp With pulp and others
Pulp vs Other Commodities
10%
0% -2%
14%
0%
2%
-3% -6% -5%
-20%
-10%
0%
10%
20%
30%
40%
50%
Ibovespa LME Metals
WTI Crude Oil
Iron Ore Sugar Soy Cattle CPI Brazil CPI US
38%
32% 30%
26% 25% 21%
16%
8%
0%
5%
10%
15%
20%
25%
30%
35%
40%
45%
50%
Sugar Iron Ore WTI Crude Oil
Soy LME Metals
Ibovespa Cattle FOEX PIX BHKP
Pulp price has the lowest historical volatility(1) among all commodities.
Considering pulp price in US$, a low correlation with hard commodities and traditional assets is observed.
With a low correlation the inclusion of BHKP in the portfolio expands the efficient frontier of a commodities portfolio(2).
Commodities Historical Volatility BHKP Correlation (USD)
13

Maintenance CAPEX (R$ Million)
1,416
1,078
1,287
1,520
2011 2012 2013 Land Deal:
Rural
Partnership
Non recurring
wood
purchase
Inflation FX Rate Modernization Others 2014E
Approx.
18% increase
14

Cash Production Cost saw an increase of 17% over the past 5 years
Cash Production Cost (1) (R$/ton)
432 448
471 473
505
2009 (2) 2010 (2) 2011 2012 2013
CAGR: + 17%
Inflation in the period : IPCA: +31%
Fibria’s Cash Cost: +17%
2014 Cash Production Cost:
• Wood costs will represent the main impact
• Non recurring increase mainly due to third party wood
• Operating excellence actions focused on keeping cash cost below inflation
• In 2015 the wood impact will be structurally eliminated
(1) Constant Currency (2) Excludes Conpacel
Target to have the cash cost increase below inflation
15

Fibria’s tax structure
Tax benefits (R$ million)
Fiscal - annual adjustment
Benefit Amount Maturity
Goodwill
(Aracruz
acquisition)
Annual tax deduction:
~R$85 million
Remaining Balance Dec./13:
R$ 1,35 billion (base)
2018
Forestry Capex in
Mato Grosso do
Sul state
2013’s tax deduction related
to depletion: R$29 million Undefined
Tax loss carry forward and tax credits
Benefit Amount
Tax loss
carryforward Balance up to Dec./13:
R$507 million (base)
Accumulated tax
credits
Balance Dec./2013:
-PIS/COFINS: R$542 million
- withholding tax (IR and
CSLL): R$226 million
Actual tax payment (cash basis)
16
2009 2010 2011 2012 2013
R$ 7 million R$ 16 million R$ 4 million R$ 15 million R$ 31 million

PULP
- Growth with discipline
- Best portfolio of projects
BIO-ENERGY
- Complementary to pulp
- Ensyn
INDUSTRY
CONSOLIDATION ?
OTHER OPPORTUNITIES
- Portocel
- Land and forest
Potential Growth
Prospects
17
Fibria is seeking value creation for its shareholders with capital discipline
Pulp and Paper Market

Today, according to public information, there will be a 9% increase
of the market pulp capacity between 2013 and 2015
(1) Source: PPPC Special Research Note November 2013 – does not include Sulphite and UKP (2) Projects included: Ilim Group (490kt)| Closures: Resolute Forest (75kt) ; Domtar (125kt) ; Rayonier (280kt); Sodra Tofte (240kt) (3) Projects included: Eldorado (1.5 mt); UPM Fray Bentos (100kt); Maranhão (1.5mt); Montes del Plata (1.3 mt); Oji Nantong (700kt); Guaíba II (1.3 mt) | Closures: Jari (410kt); Cellulose du
Maroc (140kt); Ilim Group (100kt); Double A (85kt); Sappi Cloquet (270kt); Sodra Tofte (180kt); April Rizhao (130kt)
SOFTWOOD(1)
25.0 MT
HARDWOOD(1)
30.3 MT
MARKET PULP(1)
55.3 MT + =
2013-2015(3):
• New capacities: 6.4 mt • Announced Closures: (1.3) mt
Net: 5.1 mt
2013-2015(2): • New capacities: 0.5 mt
• Announced Closures: (0.7) mt
Net: (0.2) mt
2013-2015:
• New capacities: 6.9 mt • Announced Closures: (2.0) mt
Net: 4.9 mt
19

Pulp Market
Shipments of Eucalyptus Pulp (1)
(1) Source: PPPC World 20 – December/2013
Sales Distribuition 2013 - Fibria
Producer Stocks – Hardwood(1)
(1) Source: PPPC World 20 – December/2013
NBSK vs. BHKP - Prices(1)
Europe 39%
North America
28%
Asia 25%
Others 9%
Per region
Tissue 53% Printing
& Writing 29%
Specialty 17%
Daily production
39 days
Nov/13: 40 days | Dec/12: 35 days
Per end use
400
500
600
700
800
900
1,000
1,100
0
50
100
150
200
250
jan
-08
mai
-08
set-
08
jan
-09
mai
-09
set-
09
jan
-10
mai
-10
set-
10
jan
-11
mai
-11
set-
11
jan
-12
mai
-12
set-
12
jan
-13
mai
-13
set-
13
Gap NBSK/BHKP Average Spread NBSK BHKP
Spread Dez/13: US$ 136
(1) Source: FOEX
Average Spread: US$ 88
0
10
20
30
40
50
60
05 06 07 08 09 10 11 12 13
20
6%
12%
-1%
23%
Total North America Western Europe China
+844kt
-37kt
+674kt
2013 vs. 2012
+196kt
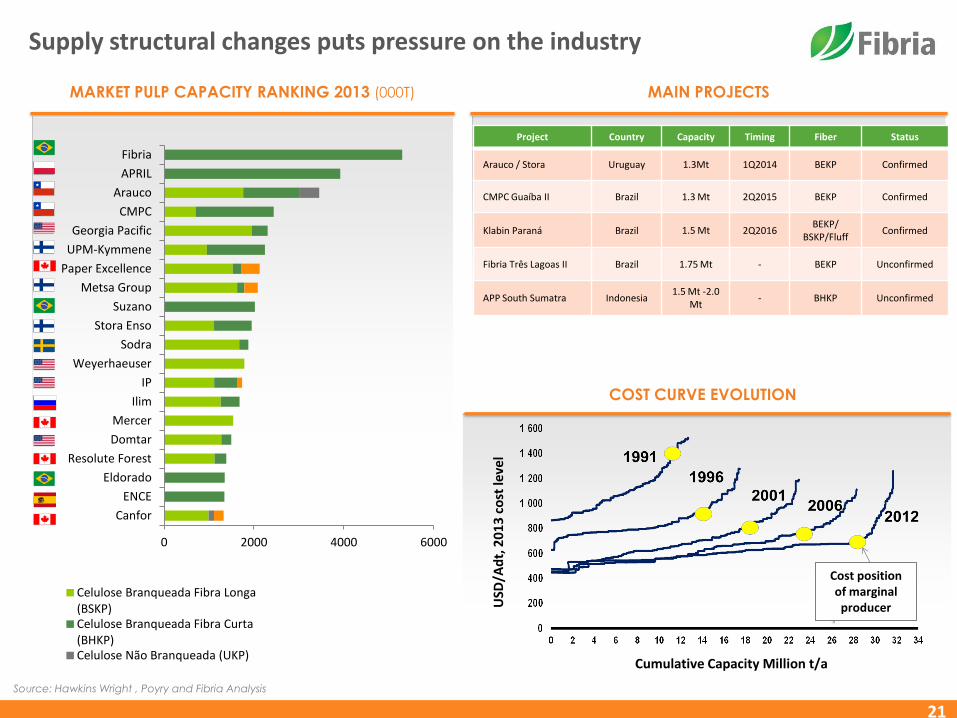
Supply structural changes puts pressure on the industry
21
MARKET PULP CAPACITY RANKING 2013 (000T) MAIN PROJECTS
Project Country Capacity Timing Fiber Status
Arauco / Stora Uruguay 1.3Mt 1Q2014 BEKP Confirmed
CMPC Guaíba II Brazil 1.3 Mt 2Q2015 BEKP Confirmed
Klabin Paraná Brazil 1.5 Mt 2Q2016 BEKP/
BSKP/Fluff Confirmed
Fibria Três Lagoas II Brazil 1.75 Mt - BEKP Unconfirmed
APP South Sumatra Indonesia 1.5 Mt -2.0
Mt - BHKP Unconfirmed
COST CURVE EVOLUTION
USD
/Ad
t, 2
01
3 c
ost
leve
l
Cumulative Capacity Million t/a
Cost position of marginal
producer
Source: Hawkins Wright , Poyry and Fibria Analysis
0 2000 4000 6000
Canfor
ENCE
Eldorado
Resolute Forest
Domtar
Mercer
Ilim
IP
Weyerhaeuser
Sodra
Stora Enso
Suzano
Metsa Group
Paper Excellence
UPM-Kymmene
Georgia Pacific
CMPC
Arauco
APRIL
Fibria
Celulose Branqueada Fibra Longa (BSKP) Celulose Branqueada Fibra Curta (BHKP) Celulose Não Branqueada (UKP)

-910
-85
-1260
-1180
-540 -500
-105
-1200
-1400
-1200
-1000
-800
-600
-400
-200
0
2006 2007 2008 2009 2010 2011 2012 2013-2015E
Capacity closures DO happen…
22
Source: PPPC and Fibria
Closures of Hardwood Capacity Worldwide 000 ton
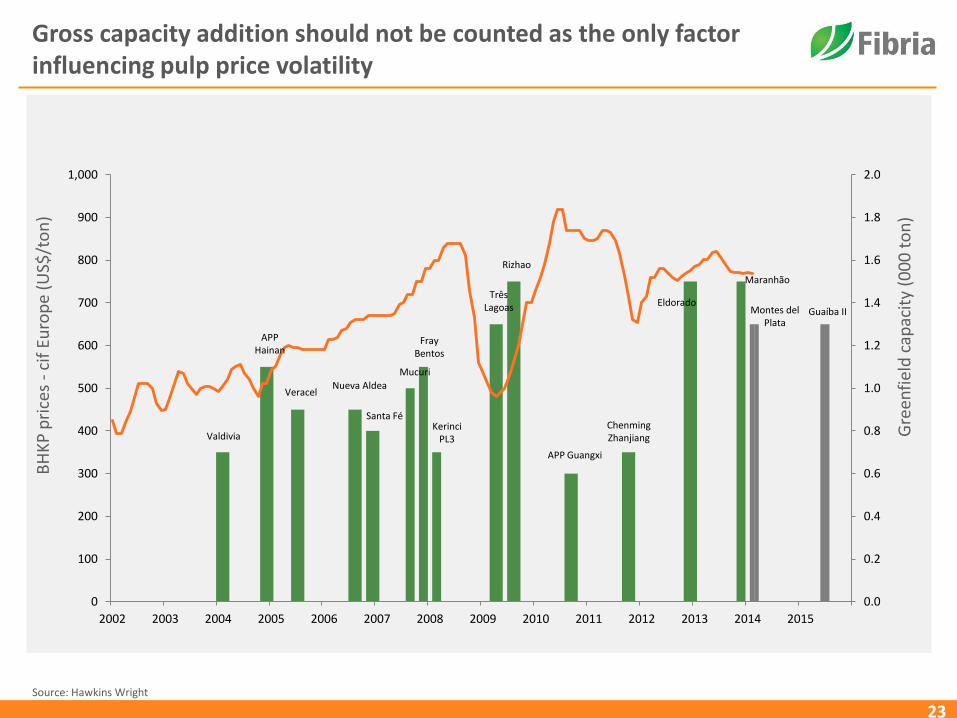
Gross capacity addition should not be counted as the only factor influencing pulp price volatility
Source: Hawkins Wright
BH
KP
pri
ces
- ci
f Eu
rop
e (U
S$/t
on
)
Gre
enfi
eld
cap
acit
y (0
00
to
n)
23
0.0
0.2
0.4
0.6
0.8
1.0
1.2
1.4
1.6
1.8
2.0
0
100
200
300
400
500
600
700
800
900
1,000
2002 2003 2004 2005 2006 2007 2008 2009 2010 2011 2012 2013 2014 2015
Valdivia
APP Hainan
Veracel Nueva Aldea
Santa Fé
Mucuri
Fray Bentos
Kerinci PL3
Três Lagoas
Rizhao
APP Guangxi
Chenming Zhanjiang
Eldorado Montes del
Plata
Maranhão
Guaíba II

Technical Age and Scale in the Market Pulp Industry Further closures are expected due to lack of adequate investments in the industry…
Hardwood (BHKP) Market Pulp Softwood (BSKP) Market Pulp
Source: Poÿry & Fibria
24
0
500
1,000
1,500
2,000
2,500
3,000
0 5 10 15 20 25 30
PM Capacity, 1000 t/a
Technical Age, years
STRONG
2013/IQ
Weighted average
technical age 14.2 years
Weighted average
capacity 1184 000 t/a
Aracruz
Três Lagoas
Veracel
Jacareí
0
500
1,000
1,500
2,000
2,500
3,000
0 5 10 15 20 25 30
PM Capacity, 1000 t/a
Technical Age, years
WEAK
STRONG Weighted average
technical age 21.2 years
Weighted average
capacity 503 000 t/a
2013/IQ
North American Pulp Mills Other Pulp Mills Closures Grade Switch On & Off

Total delivered cash cost will also have an influence on bottom prices
25
Total Cash Cost of BHKP
delivered to Europe
(US$/t)
458 532 498 487 484
475 449 426 403 359 324
301
308 262
234
134 58 76
55 52 57 81 97 41
62 56 71 59 88
69
55 6
115
41 26
Cash Cost (US$/t) Delivery (US$/t)
Source: Hawkins Wright (Outlook for Market Pulp, December 2013) | Fibria’s 2013 considering a FX of R$/US$2.16.
592 546
SG&A
Others
CAPEX
Interest Working Capital
Capacidade (k tons): 1.125 660 1.700 570 355 565 690 2.045 2.430 3625 11.385 = 30.300 365 945 3755

26
China: Paper capacities expansion continues to go on
China corresponds to 2/3 of global tissue capacity expansion
Ktons 2012 2013 2014E 2015E Total
P&W (woodfree) 720 -25 0 550 1,245
Tissue 1,540 1,184 1,518 903 5,145
Cartonboard 2,210 2,428 1,300 300 6,238
Total 4,470 3,587 2,818 1,753 12,628
Source: Fibria and Independent Consultants

Strong internal consumption will drive tissue demand in China
24.3
14.8 14.6
11.1
6.3 6.1 4.4
2.2 0.8 0.6
N. A
mer
ica
W. E
uro
pe
Jap
an
Oce
ania
E. E
uro
pe
L. A
mer
ica
Ch
ina
N&
M E
ast
Asi
a Fa
r Ea
st
Afr
ica
Kg/capita
Per Capita Consumption of Tissue by Region, 2012(1)
Growth Potential
0
5
10
15
20
25
30
35
1991 1996 2001 2006 2009 2010 2011 2012
N.America W.Europe E.Europe L.America Middle East
Japan China Asia FE Oceania Africa
Average Growth Rate
+3.5% p.a.
Million tons
World Tissue Consumption, 1991-2012(1)
27
(1) Source: RISI

Internal Consumption and Urbanization
China’s private consumption vs. exports (CNY trillion and annual % change) (1)
Chinese Urbanization Driver of Long-Term Growth
(UN Population Projections, Millions)(2)
28
Sources: (1) the Economist. (2) RISI China Pulp Market Study.
Shift from exports to private consumption;
Positive effects on households income and rising standards of living.

Different from other commodities, China accounts for 26% of hardwood demand compared to around 60% in other basic materials sectors
12% 15%
17%
19%
26%
20%
26% 25%
14% 15%
16%
18%
25%
21%
26% 26%
0
2,000
4,000
6,000
8,000
2005 2006 2007 2008 2009 2010 2011 2012
Eucalyptus ('000 t) Hardwood ('000 t)
Latin America is the main
supplier of pulp to China
(1) Source: PPPC Global 100 Report 2012
China’s Market Share of Market Pulp Shipments (%)(1)
29
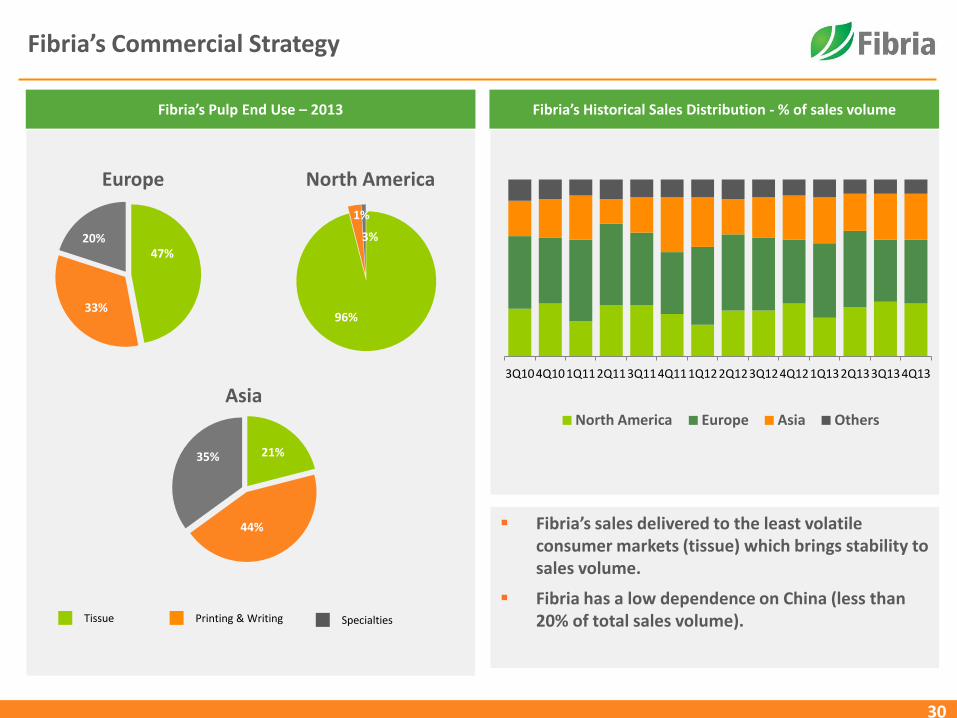
Fibria’s Commercial Strategy
30
47%
33%
20%
Fibria’s Pulp End Use – 2013 Fibria’s Historical Sales Distribution - % of sales volume
Europe
96%
3%
1%
21%
44%
35%
North America
Asia
Specialties Tissue Printing & Writing
3Q10 4Q10 1Q11 2Q11 3Q11 4Q11 1Q12 2Q12 3Q12 4Q12 1Q13 2Q13 3Q13 4Q13
North America Europe Asia Others
Fibria’s sales delivered to the least volatile consumer markets (tissue) which brings stability to sales volume.
Fibria has a low dependence on China (less than 20% of total sales volume).

Final Remarks
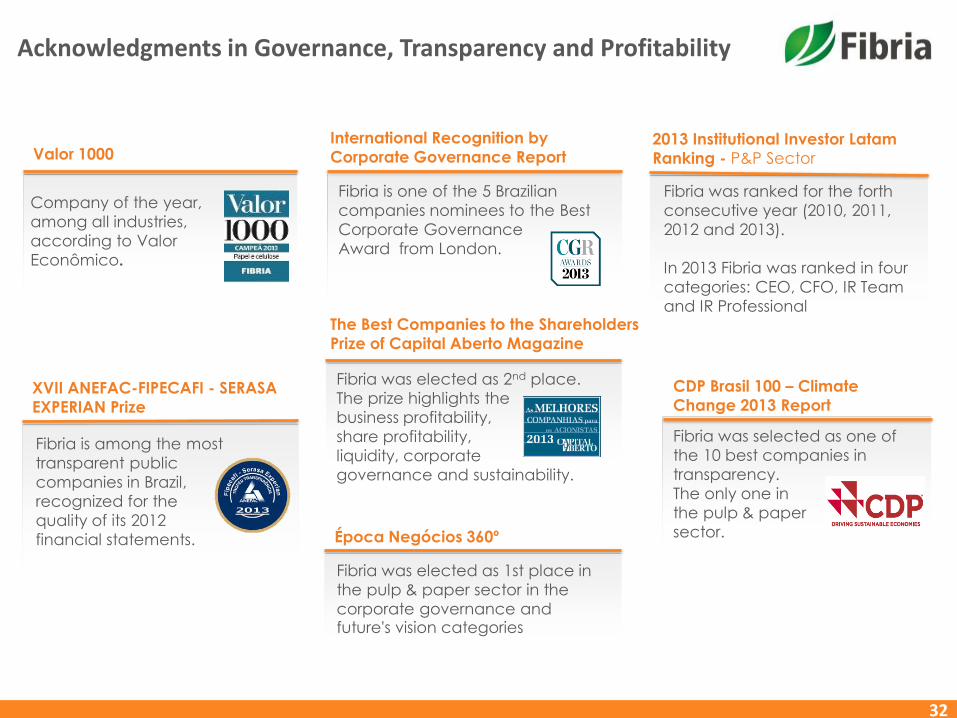
Fibria was elected as 1st place in
the pulp & paper sector in the
corporate governance and future's vision categories
Fibria is one of the 5 Brazilian
companies nominees to the Best
Corporate Governance
Award from London.
Acknowledgments in Governance, Transparency and Profitability
32
Company of the year,
among all industries,
according to Valor
Econômico.
Valor 1000
XVII ANEFAC-FIPECAFI - SERASA
EXPERIAN Prize
Fibria is among the most
transparent public
companies in Brazil,
recognized for the
quality of its 2012
financial statements.
Fibria was ranked for the forth
consecutive year (2010, 2011,
2012 and 2013).
In 2013 Fibria was ranked in four
categories: CEO, CFO, IR Team
and IR Professional
2013 Institutional Investor Latam
Ranking - P&P Sector
Fibria was selected as one of
the 10 best companies in
transparency.
The only one in
the pulp & paper
sector.
CDP Brasil 100 – Climate
Change 2013 Report
Época Negócios 360º
International Recognition by
Corporate Governance Report
Fibria was elected as 2nd place.
The prize highlights the
business profitability,
share profitability,
liquidity, corporate
governance and sustainability.
The Best Companies to the Shareholders
Prize of Capital Aberto Magazine

33
Fibria is the only Latin America company selected by RobecoSAM (responsible for DJSI) as one of the 10 worldwide leaders in SRI magazine’s “The 10
Game Changers – Changing the industry through sustainability”.
RobecoSAM - Sustainability Investing Magazine
Selected to Dow Jones World and Emerging Markets Sustainability Indices for 2013/14 as the industry leader of Forestry Resources and Paper sector.
DJSI World and DJSI Emerging Markets
Acknowledgments in Sustainability
Fibria was selected again to ISE, the corporate sustainability Index of BM&F Bovespa.
ISE – Corporate Sustainability Index (Bovespa)

THANK YOU
Investor Relations
E-mail: [email protected]
Phone: +55 11 2138-4565
Website: www.fibria.com.br/ir

Back up

Global Paper Consumption
1996 1997 1998 1999 2000 2001 2002 2003 2004 2005 2006 2007 2008 2009 2010 2011 2012 2013 2014 2015 2016
Developed Markets Emerging Markets
1996 1997 1998 1999 2000 2001 2002 2003 2004 2005 2006 2007 2008 2009 2010 2011 2012 2013 2014 2015 2016
Developed Markets Emerging Markets
CAGR 1996 – 2006 Developed Markets: + 1.7% Emerging Markets : + 6.0%
85,291
117,611
15,548
37,474
P&W Consumption (000 tons)(1)
Tissue Consumption (000 tons)(1)
114,507
CAGR 2007 – 2016 Developed Markets: - 4.0% Emerging Markets : + 4.1%
CAGR 1996 – 2006 Developed Markets: + 2.4% Emerging Markets : + 6.9%
CAGR 2007 – 2016 Developed Markets: + 1.4% Emerging Markets : + 6.7%
26,877
36
Source: RISI
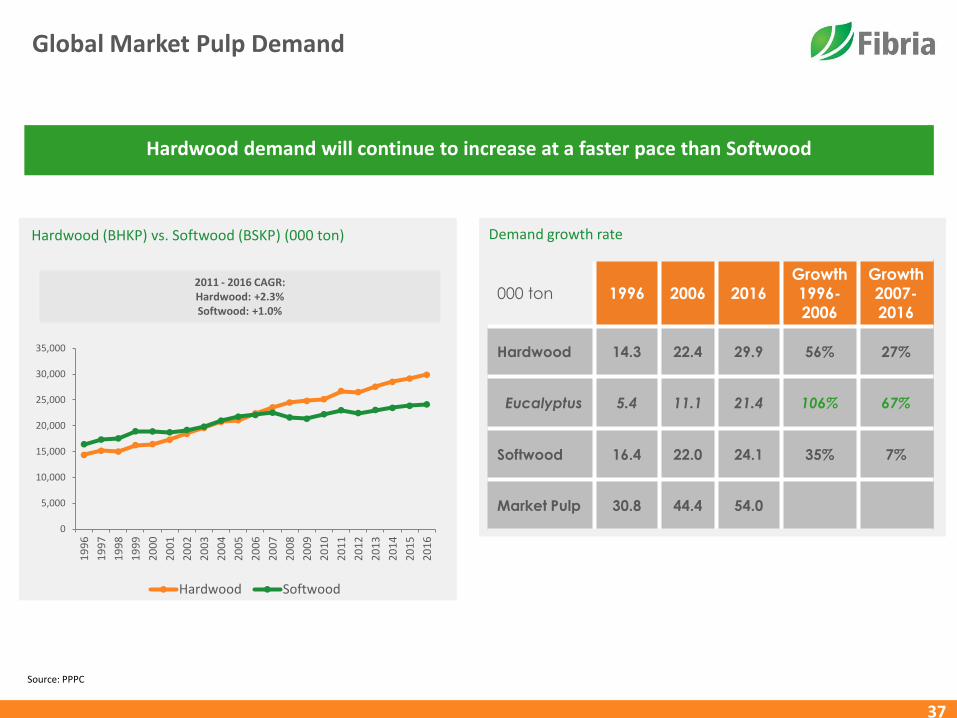
Global Market Pulp Demand
000 ton 1996 2006 2016
Growth
1996-
2006
Growth
2007-
2016
Hardwood 14.3 22.4 29.9 56% 27%
Eucalyptus 5.4 11.1 21.4 106% 67%
Softwood 16.4 22.0 24.1 35% 7%
Market Pulp 30.8 44.4 54.0
Demand growth rate Hardwood (BHKP) vs. Softwood (BSKP) (000 ton)
0
5,000
10,000
15,000
20,000
25,000
30,000
35,000
19
96
19
97
19
98
19
99
20
00
20
01
20
02
20
03
20
04
20
05
20
06
20
07
20
08
20
09
20
10
20
11
20
12
20
13
20
14
20
15
20
16
Hardwood Softwood
Hardwood demand will continue to increase at a faster pace than Softwood
2011 - 2016 CAGR: Hardwood: +2.3% Softwood: +1.0%
37
Source: PPPC

38
Pg. Slide
4 Financial Highlights
5 4Q13 Results
6 Indebtness
7 Fibria delivered the most significant leverage reduction in the LTM
8 Net Results (R$ million) – 4Q13
9 Free cash flow generation(1) (R$ million) - 2013
10 Positive Free Cash Flow (1) (R$ million)
11 Fibria delivers one of the highest EBITDA/t and FCF/t of the industry
12 FX and Pulp Price explain 80% of Fibria’s EBITDA Margin
13 Pulp vs Other Commodities
14 Maintenance CAPEX (R$ Million)
15 Cash Production Cost saw an increase of 17% over the past 5 years
16 Fibria’s tax structure
17 Fibria is seeking value creation for its shareholders with capital
18 Pulp and Paper Market
19 Today, according to public information, there will be a 9% increase of the market pulp capacity between 2013 and 2015
20 Pulp Market
21 Supply structural changes puts pressure on the industry
Pg. Slide
22 Capacity closures DO happen…
23 Gross capacity addition should not be counted as the only factor influencing pulp price volatility
24 Technical Age and Scale in the Market Pulp Industry
25 Total delivered cash cost will also have an influence on bottom prices
26 China: Paper capacities expansion continues to go on
27 Strong internal consumption will drive tissue demand in China
28 Internal Consumption and Urbanization
29 Different from other commodities, China accounts for 26% of hardwood demand compared to around 60% in other basic materials sectors
30 Fibria’s Commercial Strategy
31 Final Remarks
32 Acknowledgments in Governance, Transparency and Profitability
34 Acknowledgments in Sustainability
35 Back up
36 Global Paper Consumption
37 Global Market Pulp Demand