Fiscal sustainability report 2011 Robert Chote Chairman 13 July 2011.

Economic and fiscal outlookMarch 2012
Robert ChoteChairman

EFO coverage and process
•
Five year forecasts for the economy and public finances, plus assessment of progress against fiscal targets
•
Forecasts closed on March 7 bar impact of measures
•
Independent Budget Responsibility Committee
responsible for assumptions, judgements and conclusions
•
BRC helped by OBR staff and drawing on expertise in many Whitehall departments and other bodies
•
No political or official pressure to change anything

Overview
•
Economic outlook–
Little change since November
–
Budget measures broadly neutral over the forecast
•
Fiscal outlook–
Little underlying change since November
–
But Royal Mail pension transfer has big impact next year
•
Cutting the 50p income tax rate–
Looks inexpensive, but revenue forecast also revised down

GDP growth
% growth p.a.
NovemberEFO
MarchEFO
Change
2011 0.9 0.8 –0.1
2012 0.7 0.8 +0.1
2013 2.1 2.0 –0.1
2014 2.7 2.7 0
2015 3.0 3.0 0
2016 3.0 3.0 0

Level of GDP since the trough
100
104
108
112
116
2009 2010 2011 2012 2013 2014
20
09
Q2
= 1
00
Bank of EnglandOBROutside average
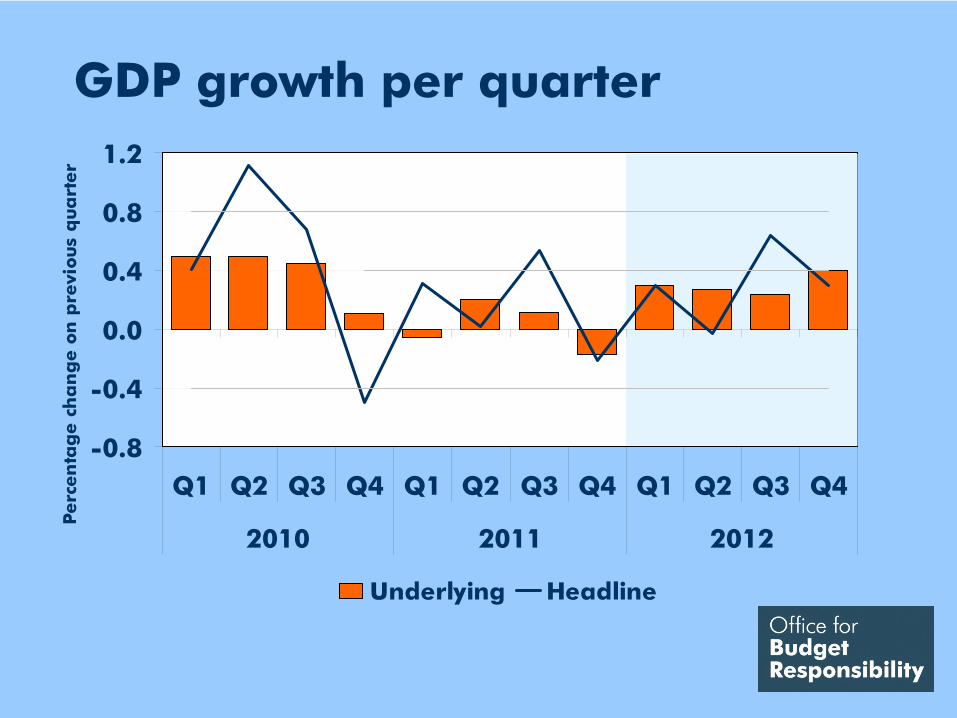
GDP growth per quarter
-0.8
-0.4
0.0
0.4
0.8
1.2
Q1 Q2 Q3 Q4 Q1 Q2 Q3 Q4 Q1 Q2 Q3 Q4
2010 2011 2012
Perc
en
tag
e c
ha
ng
e o
n p
revi
ous
qua
rter
Underlying Headline

Household consumption
% growth p.a. 2011 2012 2013 2014 2015 2016
New forecast -0.8 0.5 1.3 2.3 3.0 3.0
Change from Nov +0.2 +0.4 +0.1 +0.1 +0.3 +0.1
Memo: GDP 0.8 0.8 2.0 2.7 3.0 3.0
•
Consumption growth revised up slightly since November, thanks in part to PPI payouts and stronger asset prices
•
But continues to drag on the recovery until growth in real wages resumes in earnest in 2014

Business investment
•
Key driver of recovery –
rises as a share of GDP
•
Boosted slightly by Budget corporation tax cut
•
But revised down since November thanks to weak 2011Q4 data and assessment of corporate cash position
•
Forecast recovery weaker than in the 1990s
% growth p.a. 2011 2012 2013 2014 2015 2016
New forecast 0.2 0.7 6.4 8.9 10.2 10.1
Change from Nov +0.9 -6.9 -2.5 -0.5 -2.4 -2.3
Memo: GDP 0.8 0.8 2.0 2.7 3.0 3.0

Business investment: now & 90s
-15
-10
-5
0
5
10
15
20
1990 1992 1994 1996 1998 2008 2010 2012 2014 2016
Pe
rce
nta
ge
ch
an
ge
on
a y
ea
r e
arl
ier
Business investment growth Average

Other components of demand
•
Housing investment–
To revive as housing market returns to normal
•
Government spending and investment–
Slightly bigger contribution to growth than in November
–
Because cuts showing up more in prices than output
•
Net trade–
Positive but diminishing contribution
–
Slightly weaker than November thanks to export markets

Labour market
•
Little change to ILO (un)employment since November. Unemployment to rise from 8.4% to peak at 8.7% later this year
•
But claimant count unemployment revised down
•
Government employment projected to fall by 730,000 from Q1 2011 to 2017
•
20,000 more than in November
•
Outweighed by 1.7m rise in market sector employment
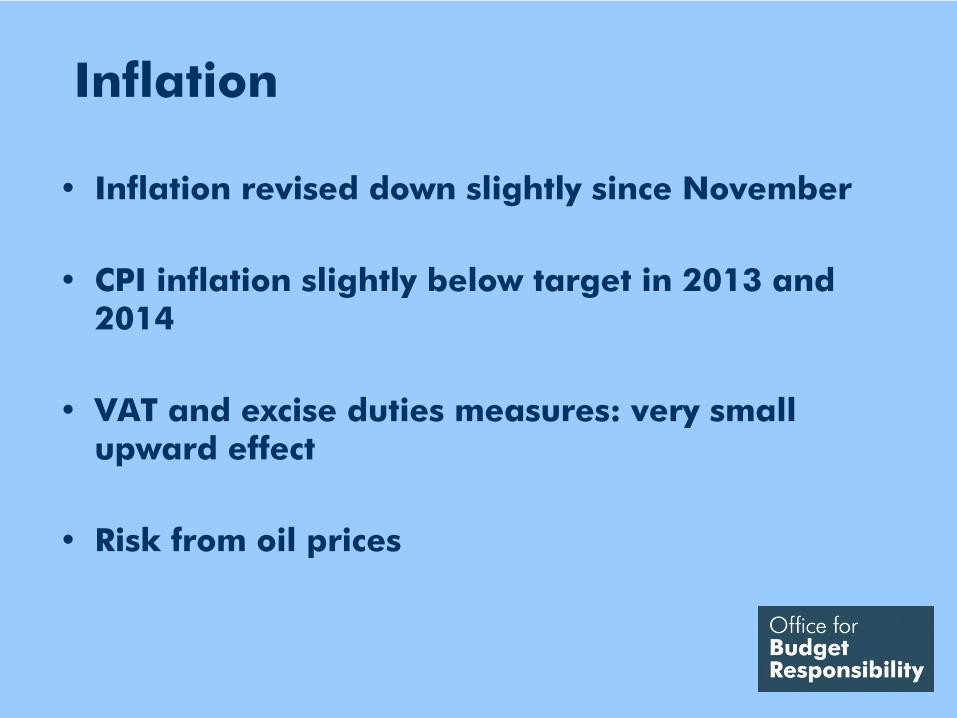
Inflation
•
Inflation revised down slightly since November
•
CPI inflation slightly below target in 2013 and 2014
•
VAT and excise duties measures: very small upward effect
•
Risk from oil prices

Potential output I
•
Business surveys and earnings growth suggest little change in spare capacity in Q4 despite weak GDP growth
•
Economy assumed to be running 2.5% below full potential in Q4 and 2.7% below potential for 2011 as a whole

Output gap in 2011
-5-4-3-2-10
NIESR Goldman SachsOECD EC Oxford EconomicsLombard StreetCBIIMFOBR Societe GeneraleBarclays CapitalCommerzbankBCCNomuraScotiabankFathomSchroders
Per cent of potential output

Potential output II
•
Growth in potential GDP assumed to recover to long-run average over next two years –
as in
November
•
Potential GDP in line with OECD and IMF estimates over the course of the forecast and somewhat higher than European Commission

Potential output forecasts
88
96
104
112
120
128
2003 2005 2007 2009 2011 2013 2015
20
09
= 1
00
OECD
OBR
IMF
European Commission
8%
11%

The public finances in 2011-12
•
Public sector net borrowing (PSNB) forecast at £126bn this year –
down £1.1bn since November
•
Government departments expected to underspend by £6bn against plans and by £5.5bn against November forecast
•
But tax revenues also expected to come in £5bn below November forecast –
mostly recent
weakness in self-assessment receipts

Public sector net borrowing
2011- 12
2012- 13
2013 -14
2014 -15
2015 -16
2016 -17
Cash (£bn) 126 92 98 75 52 21
Change from Nov -1.1 -28 -2 -4 -1 -2
Memo: % GDP 8.3 5.8 5.9 4.3 2.8 1.1
•
Very small deficit-reducing revisions since November
•
Only big change is in 2012-13: Royal Mail pension transfer

Royal Mail pension transfer
•
Government taking Royal Mail’s historic pension deficit –
plus associated pension fund assets –
onto public sector balance sheet on April 1
•
Impact:–
£28bn one-off cut in PSNB in 2012-13
–
£23bn cut in net debt from 2013-14 as assets sold–
£1.3-1.6bn increase in annual pension spending
•
Looks favourable short-term, but not long-term–
Present value of assets = £28bn
–
Present value of liabilities = £37.5bn

Receipts and spending
•
Little net change in either receipts or spending at the end of our forecast horizon
•
Receipts revised up £0.1bn in 2016-17–
Downward revisions from self assessment shortfall, lower oil production and weaker property market
–
Upward revisions from higher profits, lower investment, higher VAT and higher share prices
•
Spending revised down by £2.4 in 2016-17–
Lower interest rates
–
Afghanistan special reserve reduction–
Cap on potential costs of Universal Credit
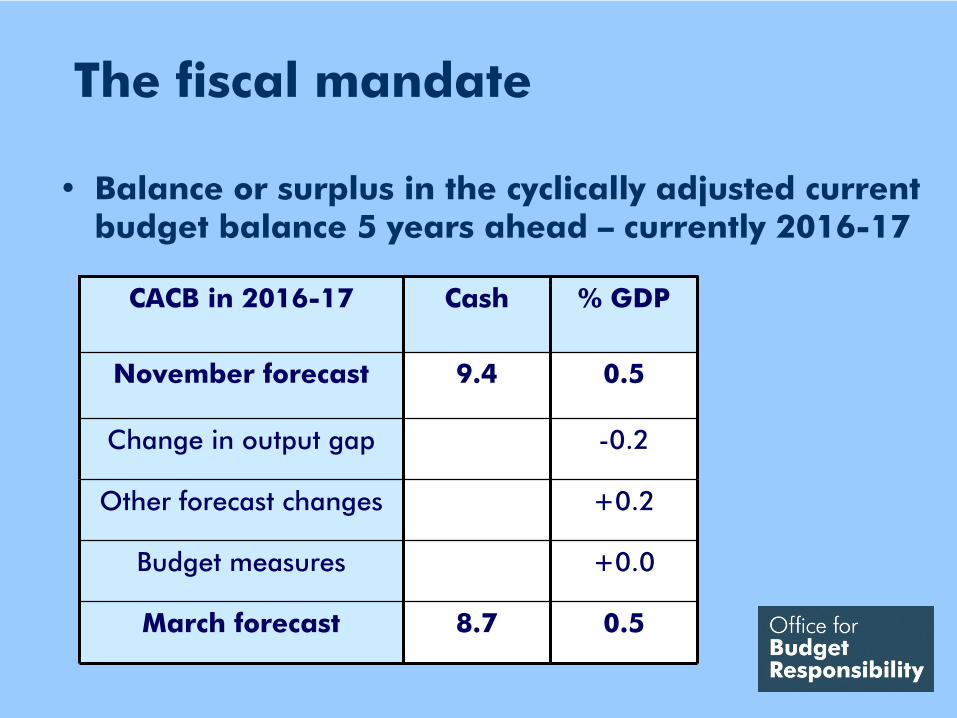
The fiscal mandate
•
Balance or surplus in the cyclically adjusted current budget balance 5 years ahead –
currently 2016-17
CACB in 2016-17 Cash % GDP
November forecast 9.4 0.5
Change in output gap -0.2
Other forecast changes +0.2
Budget measures +0.0
March forecast 8.7 0.5

Uncertainty and the mandate
•
Implies 60% chance of success
-6
-4
-2
0
2
4
2006-07 2008-09 2010-11 2012-13 2014-15 2016-17
Per
cen
t of
GD
P
March central forecast

The supplementary target
•
Change in PSND in 2015-16 stays at -0.3% GDP
50
60
70
80
2009-10 2011-12 2013-14 2015-16
Per
cen
t of
GD
P
March central forecast November central forecast
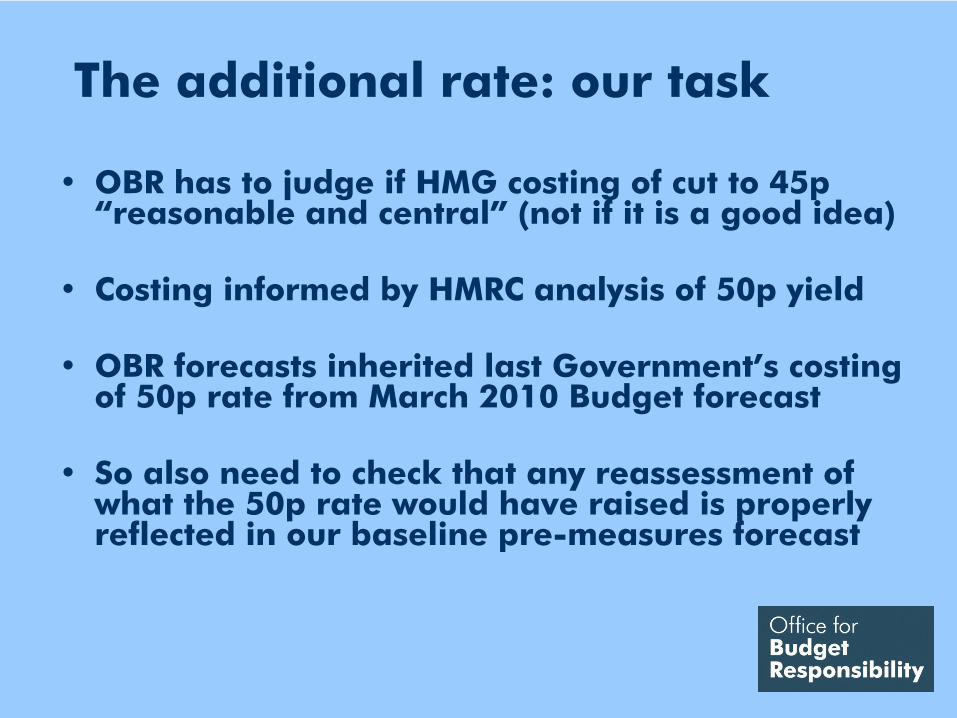
The additional rate: our task
•
OBR has to judge if HMG costing of cut to 45p “reasonable and central”
(not if it is a good idea)
•
Costing informed by HMRC analysis of 50p yield
•
OBR forecasts inherited last Government’s costing of 50p rate from March 2010 Budget forecast
•
So also need to check that any reassessment of what the 50p rate would have raised is properly reflected in our baseline pre-measures forecast

The original 50p costing
•
March 2010 Budget estimated that 50p rate would raise £2.7bn in 2012-13
•
300,000 people would pay £7.5bn more if they did not change their behaviour
•
But £4.9bn would never materialise because of:–
People working less, retiring early or leaving the country
–
More tax planning, avoidance and evasion
•
2008 study for IFS suggested bigger behavioural response and less revenue

New HMRC analysis
•
Based on 2010-11 self-assessment returns
•
Suggests people shifted at least £16bn of income into 2009-10 from future years to avoid 50p –
e.g
directors bringing forward dividend payments
•
Also suggests bigger underlying
behavioural response than the original costings –
at or above
level suggested by IFS study
•
Costing and forecast now assume behavioural response broadly in line with IFS study

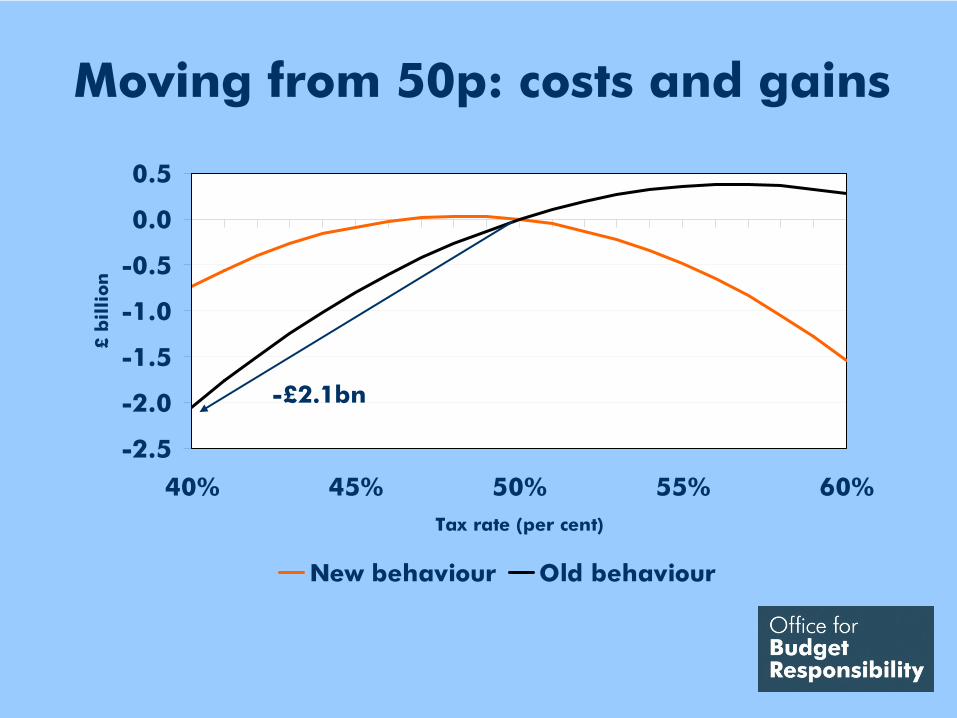
Moving from 50p: costs and gains
-2.5
-2.0
-1.5
-1.0
-0.5
0.0
0.5
40% 45% 50% 55% 60%Tax rate (per cent)
£ b
illi
on

Moving from 50p: costs and gains
-2.5
-2.0
-1.5
-1.0
-0.5
0.0
0.5
40% 45% 50% 55% 60%Tax rate (per cent)
£ b
illi
on
-£700m
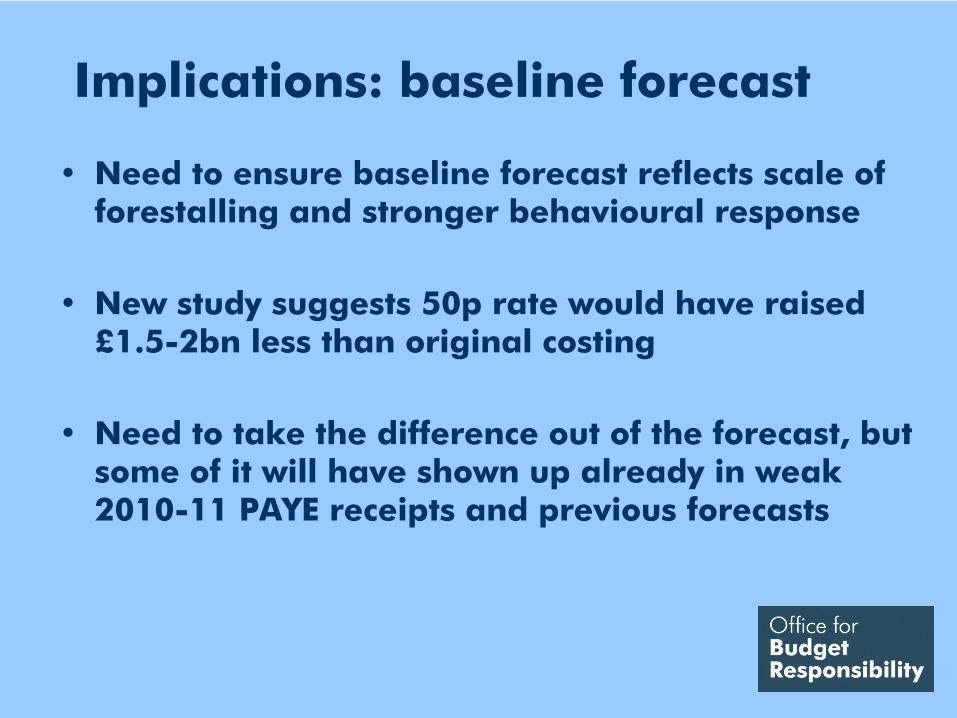
Implications: baseline forecast
•
Need to ensure baseline forecast reflects scale of forestalling and stronger behavioural response
•
New study suggests 50p rate would have raised £1.5-2bn less than original costing
•
Need to take the difference out of the forecast, but some of it will have shown up already in weak 2010-11 PAYE receipts and previous forecasts

Moving from 50p: costs and gains
-2.5
-2.0
-1.5
-1.0
-0.5
0.0
0.5
40% 45% 50% 55% 60%Tax rate (per cent)
£ b
illi
on

Moving from 50p: costs and gains
-2.5
-2.0
-1.5
-1.0
-0.5
0.0
0.5
40% 45% 50% 55% 60%Tax rate (per cent)
£ b
illi
on
-£50-100m

Moving from 50p: costs and gains
-2.5
-2.0
-1.5
-1.0
-0.5
0.0
0.5
40% 45% 50% 55% 60%Tax rate (per cent)
£ b
illi
on
New behaviour Old behaviour

Moving from 50p: costs and gains
-2.5
-2.0
-1.5
-1.0
-0.5
0.0
0.5
40% 45% 50% 55% 60%Tax rate (per cent)
£ b
illi
on
New behaviour Old behaviour
-£800m
Moving from 50p: costs and gains
-2.5
-2.0
-1.5
-1.0
-0.5
0.0
0.5
40% 45% 50% 55% 60%Tax rate (per cent)
£ b
illi
on
New behaviour Old behaviour
-£2.1bn

Implications: costings
50p to 45p 50p to 40p
New behaviour -£50-100m -£700m
Old behaviour -£800m -£2.1bn
•
New behavioural response looks reasonable and central
•
HMRC study might point to even bigger response, but data limited and potential asymmetry
•
Huge uncertainty around all such estimates and evidence likely to evolve further
•
Behaviour not fixed –
affected by policy choices