
March 2003 Mid-Term Financial Results · March 2003 Mid-Term Financial Results ... Operating...
34
March 2003 Mid March 2003 Mid - - Term Financia Term Financia ● Current business performance ● Management plans ● Update on main products Kyorin Pharmaceutical, Co., Ltd. Kyorin Pharmaceutical, Co., Ltd. November15, 2002
Transcript of March 2003 Mid-Term Financial Results · March 2003 Mid-Term Financial Results ... Operating...

KYORIN
March 2003 MidMarch 2003 Mid--Term Financial ResultsTerm Financial Results
● Current business performance
● Management plans
● Update on main products
Kyorin Pharmaceutical, Co., Ltd.Kyorin Pharmaceutical, Co., Ltd.
November15, 2002

KYORINFiscal term ending in March 2003 Interim Sales Situation (non-consolidated)
<Major issues for current medium term> ■ Sales: �31,164 million (up by �2.5 billion) <Prescription drugs for Japanese market> �26,212 million (up by �5.1 billion) =Positive factors= 0/01 9/02 ( Units: �billions ) New drugs:・launch of Gatiflo 0 → 1.9(+1.9)
* Only Kyorin's turnover is shown. ・Continuous increase in sales of Kipres 1.7 → 2.5(+0.8)・Other drugs 1.1 → 4.2(+3.1)
(Other positive factors) * Sales of Gatiflo to Dainippon Pharmaceutical and licensing fee installments =Negative factors= *Decline in wholesale prices as a result of revision of NHI price
(Price revision rate: 8.2%) ・Turnover for major products (already on the market) 18.3 → 17.6(▲0.7) ・Aplace 2.1 → 1.8(▲0.3) ・Rocaltrol 1.9 → 1.6(▲0.3)<Prescription drugs for overseas market>
�3,191 million (down by �2.8 billion)・Gatiflo 4.8 → 1.9(▲2.9)
*Substantial reduction in export of atifloxacin due to BMS' verstockin<Other products> (up by �0.2 billion ) ・Milton 1.4 → 1.6(+0.2)
■ Operating profit: �4,739 million (up by �1.0 billion) ・ Operating profit ratio: 15.2% (up by 2.0 points) Cost ratio: down by 2.0 points (31.9% → 29.9%) Sales management cost ratio: ±0 from the previous year (54.9% → 54.9%)
■ Current term profit: �1,319 million (up by �0.5 billion) ・Valuation loss of negotiable investment securities (about �0.3 billion) Depreciation of debt for pension plan (about �1.6 billion)
※ Last year of 3-year depreciation
■ Dividend : �7.5
( Units: ¥ millions)
1,319
4,626
4,739
1,759
3,191
26,212
31,164
9/02
867
3,874
3,788
1,595
5,984
21,116
28,695
9/01
Net profit
Rec profit
Op profit
Other
Pharm(Exp)
Pharm(Jpn)
Sales
1

KYORINFiscal term ending in March 2003 Sales Forecast (non-consolidated)
<Major issues for whole>■ Sales: �70,600 million (up by �9.5 billion) <Prescription drugs for Japanese market>
�59,500 million (up by �13.9 billion) =Positive factors= 0/01 9/02 ( Units: �billions )New drugs:・Launch of Gatiflo 0 → 8.5(+8.5) *The figure shows Kyorin's turnover only.
・ Continuous sales increase of Kipres 3.1 → 7.1(+4.0) ・ Other drugs 3.2 → 4.9(+1.7) (Other positive factors) *Sales of Gatiflo to Dainippon Pharmaceutical and licensing fee installments =Negative factors= *Decline in wholesale prices as a result of NHI price revision
(Price revision rate: 8.2%)Turnover for major products (already on the market)
39.3 → 39.0(▲0.3)・Baccidal 1.7 → 1.0(▲0.7)
・Aplace 4.3 → 3.4(▲0.9)(Ketas: 7.5 → 8.5 (+1.0), Pentasa: 4.5 → 5.4 (+0.9))
<Prescription drugs for overseas market>�7,500 million (down by �4.6 billion )
・Gatiflo 9.8 → 4.6(▲5.2) *Substantial reduction in export of gatifloxacin due to BMS' overstocking <Other products> (up by �0.2 billion ) ・Milton 2.9 → 3.1(+0.2)
■ Operating profit:�14,300 million (up by �2.4 billion) ・Operating profit ratio: 20.3% (up by 0.9 points)Both cost ratio and sales management costs are expected to decline.Factors for decline in cost ratio: Effects of Gatiflo: Full-scale production for domestic launch and reduced intermediate product costsFactors for decline in sales management costs: Increase in R&D costs and sales costs for launching new drugs are absorbed by increased sales.Reinforced management of other costs
■ Current term profit:�5,200 million (up by �1.4 billion) ・Depreciation of debt for pension plan (about �3.1 billion) ※Last year of 3-year depreciation
■ Dividend:�15.00 (whole term: divided increase)
(Units: ¥ millions)
5,200
14,000
14,300
3,600
7,500
59,500
70,600
9/02
3,785
11,816
11,865
3,378
12,127
45,626
61,131
9/01
Net profit
Rec profit
Op profit
Other
Pharm(Exp)
Pharm(Jpn)
Sales
2
KYORIN
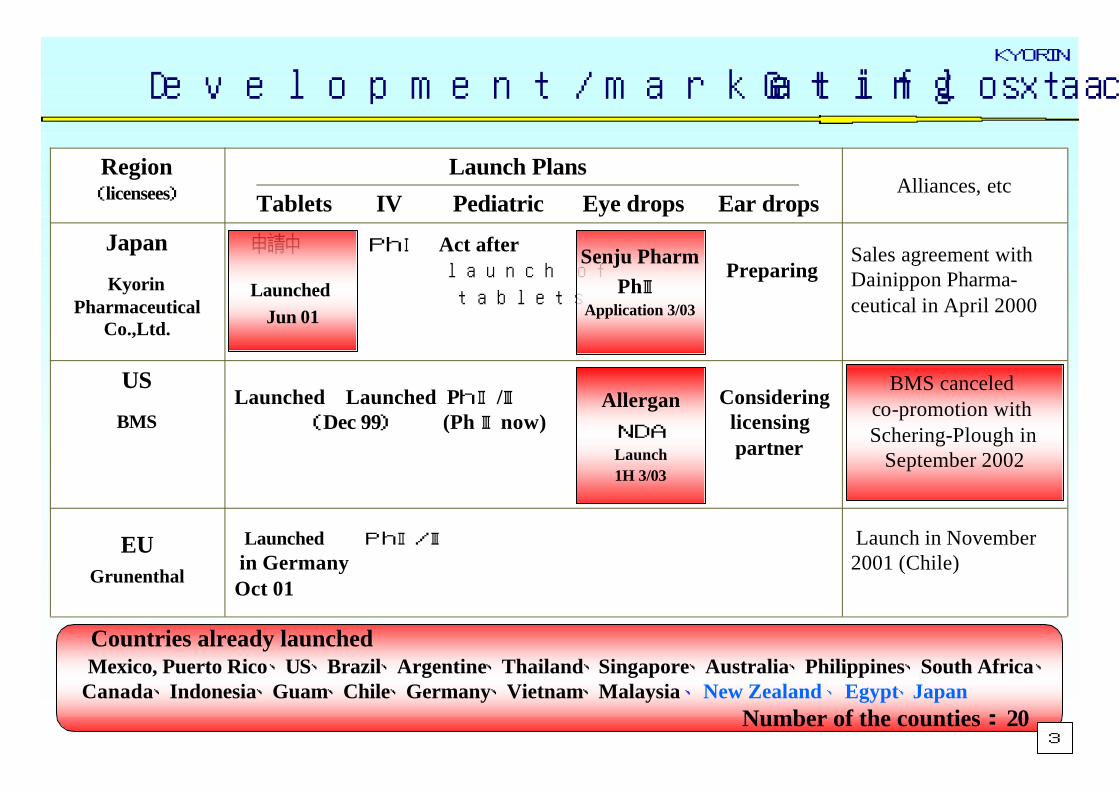
Launched Launched PhⅡ/Ⅲ Considering (Dec 99) (Ph Ⅲnow) licensing partner
US
BMS
Launch in November 2001 (Chile)
Launched PhⅡ/Ⅲ
in Germany Oct 01
EUGrunenthal
Sales agreement with Dainippon Pharma-ceutical in April 2000
申請中 PhⅠ Act after launch of Preparing
tablets
Japan
KyorinPharmaceutical
Co.,Ltd.
Alliances, etc Launch Plans
Tablets IV Pediatric Eye drops Ear drops
Region(licensees)
Launched
Jun 01
Senju Pharm
PhⅢApplication 3/03
Allergan
NDALaunch1H 3/03
Countries already launched Mexico, Puerto Rico、US、Brazil、Argentine、Thailand、Singapore、Australia、Philippines、South Africa、Canada、Indonesia、Guam、Chile、Germany、Vietnam、Malaysia 、 New Zealand、 Egypt、Japan
Number of the counties : 20
Development/marketing status of Gatifloxacin
BMS canceled co-promotion with Schering-Plough in
September 2002
3

KYORINSituation of Major Products (1) Gatifloxacin: Overseas Situation ①BMS
1.BMS' sales of Tequin (Current performance) ① Based on actual demand: sales from Jan. to Jun.: up by 18.2% from the previous year; number of prescriptions: up by 1.6% from the previous year ②BMS' sales from Jan. to Jun.: $64MM (down by 50% from the previous year) ③Overstocking: According to the report received from BMS, BMS is overstocked by about $100MM but expects to clear the stock by the end of this year. BMS plans to resume bulk ordering at the beginning of the second half of the current term. ④Significance of impact of changed labeling: Though it is reported that only a small number of doctors consid er the changed labeling is a problem, the issue is predicted to have some impact (judged from the decl ine in the number of newly issued
prescriptions after the change. The details are still under investigation.)
2.Medium-term sales and forecast for whole term *Fiscal year: BMS: Jan. to Dec., Kyorin: Apr. to Mar. 2000 2001 Term ending in Mar. 2003 Turnover Turnover (Forecast)
BMS‘s turnover (first half term) 42 127 64 ($MM) (whole term) Kyorin’s turnover (first half term) 2.0 4.8 1.9 (�billion) (whole term)
3.Movements after briefing of sales forecast correction on Sep. 25①Termination of co-promotion with Schering Plough : The sales forecast is prepared assuming BMS‘ sole promotion and the termination of co -promotion.②Sales trend of Tequin :Actual demand of Tequin in 3Q (number of newly issued prescriptions: down by 23% from the previous year, sales volume: down by 13% from the previous year, source of data: IMS)【BMS’ view】 The 23% sales decline in 3Q is attributed to the decline in sales to only GPs.
If the 22% increase in the HP market is reflected, there is no overall change. (1- 3Q Number of newly issued prescriptions: down by 4.8%, sales: up by 9.1%, source of data: IMS)
【Kyorin’s view】 It is necessary to cautiously monitor future trends as implicated by impacts of labeling supplementationand BMS' motivation.
③Addition of indication/efficacy : Additional approval for dermatological indication.④Order of bulk : A confirmed order is received.
Actual demand of Tequin
$220MM/year Overstock
$100MM 5.5 9.8
131 320
4.6
120
4

KYORIN
Situation of Major Products (1) Gatifloxacin: Overseas Situation ② Allergan
<Development of gatifloxacin ophthalmic solution in the US>
5
Aug. 2000: Licensing agreement for gatifloxacin ophthalmic solution with Allergan of the US Application to FDA: May 2002 First half of 2003: Scheduled to be approved
<Market trends for antimicrobial ophthalmic solutions>
Ofloxacin (Allergan) �9 billion
Ciprofloxacin (Alcon) �10 billion
Quixin (Santen)
* Levofloxacin preparation
Aminoglycoside preparation
・・・
・Sales by Allergan, a leadingophthalmic solutionmanufacturer in the world
・Expiration of patent of ofloxacin (Sep. 2003)
Local sales are expected to peak
�10 billion.
Japanese/US/Europeanantimicrobial ophthalmic
solution market
FY2001
Source: Kyorin
Europe�10 billion
Japan�30 billion
US�40 billion

KYORIN
1.Medium-term and whole-term sales forecast for the term ending in Mar. 2003
Medium-term sales (forecast) Actual sales Whole-term sales forecast �2.0 billion �1.9 billion �8.5 billion
*Launch: June 11, 20022.Situation during the first half of the term ending in Mar. 2003 1)Reinforcing sales base in the first half term ・According to the area expansion strategy, about 33,000 customers, more than the target of 26,000 customers, are secured. 2)The sales were below the original plan (released in May 2002, first half term: �4.6 billion ) ・Sales promotion target was shifted from the 500-tablet pack to the 100-tablet pack. ・The number of patients with infectious diseases during summer was lower than expected. 3.Action plans for the second half of the term ending in Mar. 2003 <Basis for the achievement of the plan> ①Sales increase through shift of promotion activities from territ ory-based to individual-based (Increase in institutional share) ・Aim to obtain prescription sales particularly in RTI market which expands by 1.5 times in winter. ・Aim to obtain prescription sales through GPs, who used more than initially forecasted. *The number of GP customers necessary for the establishment of the business base
has been secured (first half term) ⇒ Second half term: Promotion activities are carried out focusing on about 20% of all GP
customers to nurture core customers and secure 80% sales to all GP customers. ②Early delivery to target HPs and securing sales ・Promote transactions with target HPs from 40% in the first half term to 70% in the 3rd quarter
to nurture core specialist customers benefiting from the ripple effects to GP customers. ・88% of university hospitals are customers (first half term) 6
Situation of Major Products (1) Gatifloxacin: Domestic Situation

KYORIN
1.Medium-term and whole-term sales forecast for term ending in Mar. 2003
Term ending in Mar. 2002 Term ending in Mar. 2003 Actual sales Term ending in Mar. 2003(Medium-term sales) (Whole -term sales) (Medium-term sales forecast) (Medium-term sales forecast)
�1.7 billion �3.1billion �2.6 billion �2.5 billion �7.1 billion
2.Situation in the first half of the term ending in Mar. 2003
①Despite delayed achievement of the targeted degree of use among HP customers,
Kipres is smoothly increasing the share in the LTI market.②Aim to acquire the target share of 17% of the LTI market for this term.
7
Situation of Major Products (2) Kipres: Situation in First Half Term
Scale of LTI market and share of Kipres
(Target)
8% 12%17%
LTI market
Share
of Kipres
About �38 billion
3/02 9/02 3/03
About �40 billion
About �43~45 billion

KYORIN
[Action plan for the second half of the term ending in Mar. 2003 -Marketing strategies-]
①Acquire larger amount of prescription sales associated with authorization of long-term dispensing !
*From Sep. 2002, one year after launch, long-term dispensing is authorized. → Endeavor for early achievement of the target number of prescriptions of 90,000.
②Proactively solicit switch from other LTI presenting the efficacy cross reference.③Increase the frequency of calls to specialists.
Hold seminars regularly for specialists and continuously for GPs. *Hold seminars regularly for HP doctors and continuously for GPs to increase awareness.
Situation of Major Products (2) Kipres: Action Plan for Second Half Term
4.6 4.7 4.5
5.7
7.1
0
20,000
40,000
60,000
80,000
100,000
120,000
Target 4-6月平均 JUL AUG SEP OCT0
2
4
6
8Changes in the number of
prescriptions/sales Following the stable increase in the number of prescriptions, authorization of long-term dispensing in Sep. resulted in accelerated increase in the number of prescriptions among HP doctors.
8
75,000
Unit: �100 millionsNumber of
prescriptions
Changes in sales (Unit: �100 millions)
Change in number of prescribed cases
90,000
48,500 50,800 47,800
61,100
Note: NHI price-based sales
Source of data: Kyorin
Apr. to Jun. (Average)
KYORIN
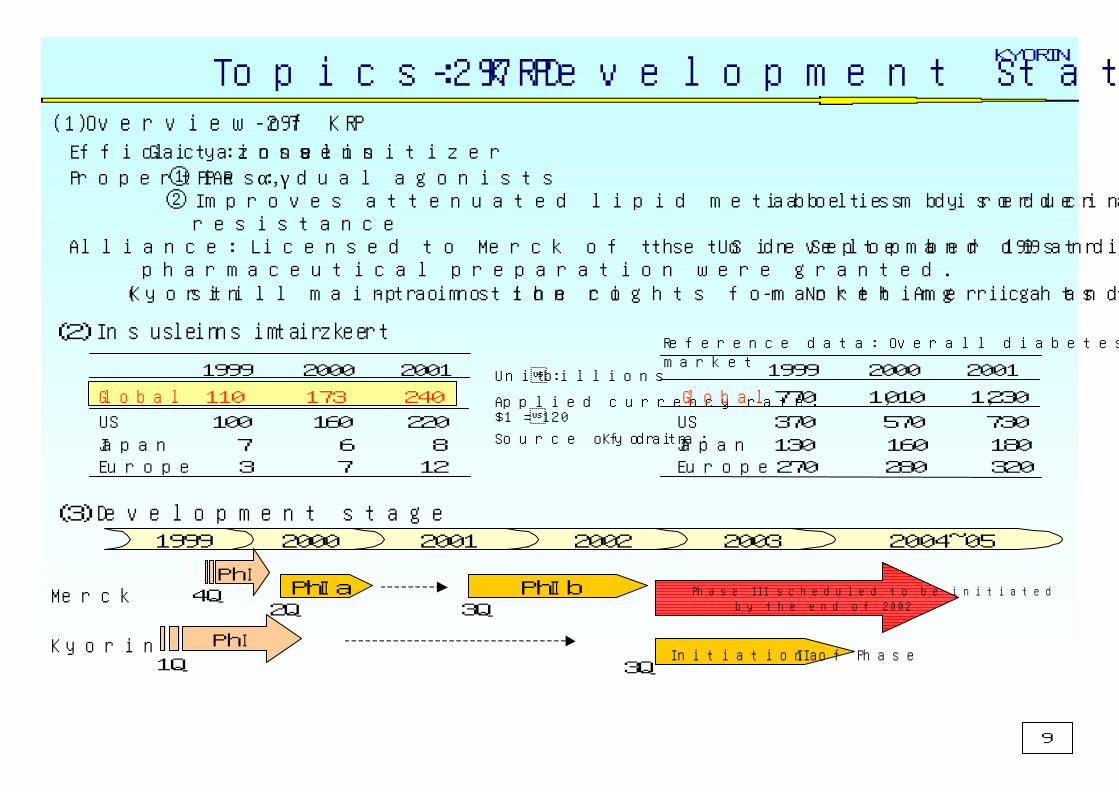
Topics: KRP-297 Development Status
(3)Development stage
(2)Insulin sensitizer market
(1) Overview of KRP-297 Efficacy: Glitazone insulin sensitizer Properties: ① PPAR α, γ dual agonists
② Improves attenuated lipid metabolism disorder associated with diabetes by reducing insulinresistance
Alliance: Licensed to Merck of the US in September 1999 and rights to develop and distribute thepharmaceutical preparation were granted.
(Kyorin still maintains the co-promotion rights for North America and co-marketing rights for Europe.)
Unit: �billions
Applied currency rate: $1 = �120
Source of data: Kyorin
1999 2000 2001
Global 110 173 240
US 100 160 220 Japan 7 6 8 Europe 3 7 12
1999 2000 2001 2002 2003 2004~05
MerckPhⅠ
PhⅡa Phase I I I schedu led to be in i t iated by the end of 2002
4Q
Kyorin PhⅠInitiation of Phase IIa
2QPhⅡb
3Q
1Q 3Q
9
1999 2000 2001
Global 770 1,010 1,230
US 370 570 730 Japan 130 160 180 Europe 270 280 320
Reference data: Overall diabetes treatment drug market

KYORIN
Progress of Kyorin MIC Plan
Start MIC-’05 plan in 3/02 to realize the New Kyorin: Research-oriented company of world class for new drugs in franchise marketing fiel ds
MIC-’02
MIC-’05
New Kyorin
Speedy and slim corporate base
Kyorin MIC PlanCreate promising infrastructure and dynamic corporate culture based on keywords: marketing, innovation and challenge
Kyorin MIC PlanCreate promising infrastructure and dynamic corporate culture based on keywords: marketing, innovation and challenge
Target MIC-’02 PlanSales �65 billion
Rec. profits margins : 25%
ROE 7%
Target MIC-’02 PlanSales �65 billion
Rec. profits margins : 25%
ROE 7%
SGA ratio 46% Target MIC-’05 PlanR&D : �15 billion
Sales : �100 billion
Recurring profits margin : 25%
Number of employee : 1,700
Productivity per employee
: about �60 million/year
Target MIC-’05 PlanR&D : �15 billion
Sales : �100 billion
Recurring profits margin : 25%
Number of employee : 1,700
Productivity per employee
: about �60 million/year 10
Evolution
DestructionTraditional Kyorin
with 70 years history
KYORIN
30
50
70
90
100
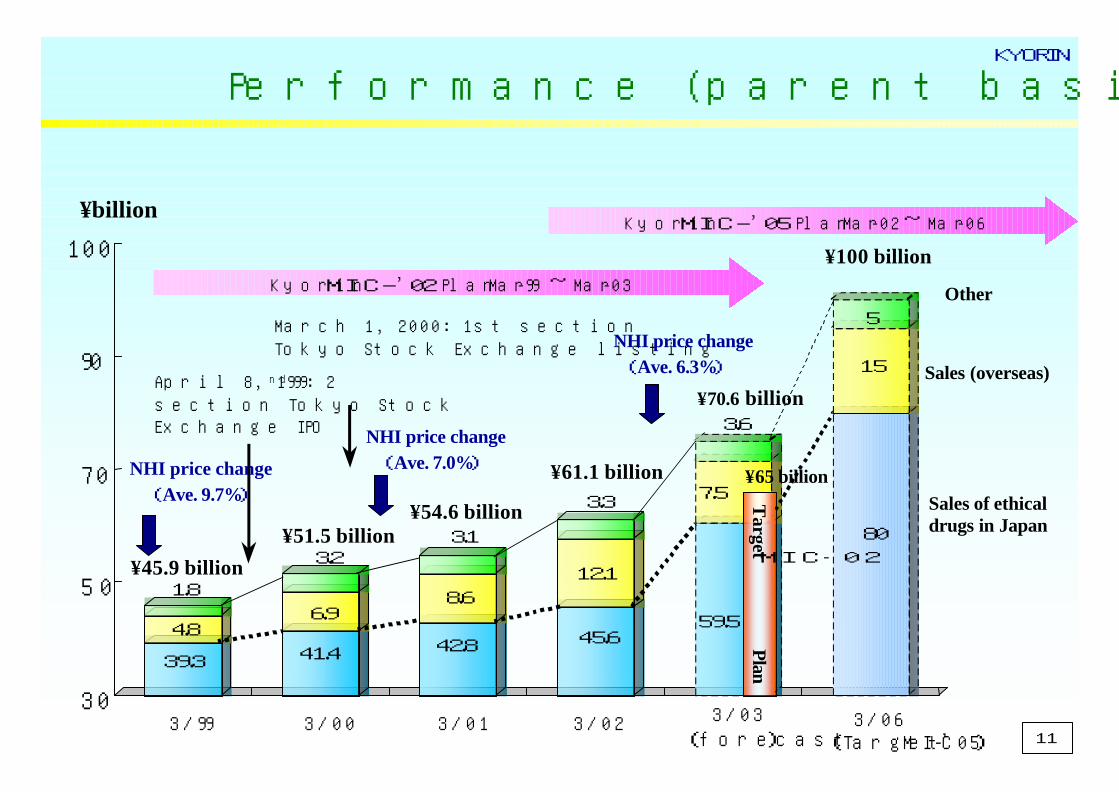
Performance (parent basis) after IPO
Kyorin MIC-’02 Plan Mar-99 ~ Mar-03
Kyorin MIC-’05 Plan Mar-02 ~ Mar-06¥billion
Sales of ethical drugs in Japan
Sales (overseas)
Other
1.8
4.8
39.3
3.2
6.9
41.4
3.1
8.6
42.8
3.3
12.1
45.6
3.6
7.5
59.5
¥45.9 billion
¥51.5 billion¥54.6 billion
¥61.1 billion
¥100 billion
March 1, 2000: 1st section Tokyo Stock Exchange listing
3/99 3/00 3/01 3/02 3/06(Target MIC-’05)
3/03(forecast)
¥70.6 billion
80
15
5
¥65 billion
11
Target
MIC‐02Plan
NHI price change(Ave. 7.0%)
NHI price change(Ave. 6.3%)
April 8, 1999: 2nd
section Tokyo Stock Exchange IPO
NHI price change(Ave. 9.7%)

KYORIN
Kyorin management policy FY 3/03
< Basic policy >
< Basic measures >
12
Evolution and creation:Establishment of new enterprise value
“Seize the chance for victory”
1.Expand R&D infrastructure and facilitate new drug development2. Promote FC (franchise customer) strategy with break through new drugs that eliminates negative effects of NHI price revisions
3.Enhance pipeline and grow overseas infrastructure
4. Thorough implementing of efficient management

KYORIN
TeamworkCommunication
PatienceGuts
1.Expand R&D infrastructure and promote new drug creationExpand R&D networks to strengthen infrastructure of search for l ead compounds
Top R&D institutions
Kyorin Kyorin Scotland Research LaboratoryScotland Research Laboratory
UE/EU/Japanese bio-ventures
ProteiosProteiosResearchResearch IIncnc
Kyorin PharmaceuticalDiscovery Research Laboratories
Fields of priority: Infectious diseases,Fields of priority: Infectious diseases,immunologiesimmunologies, allergies , allergies metabolic diseasesmetabolic diseases
Core competency&StrengthCore competency&Strength
Nissin Kyorin Pharmaceutical
NEW drug laboratoriesNEW drug laboratories
Bio-venture investments in Japan/UE/EU
JapanJapan USUS EUEU
ConsideringConsidering
Satellite Laboratories
allergies
Venture Company
GenomeGenomeResearchResearch
Immunologies
Infectious diseases
Others
SC Bio‐Capital
BH BH fundfund
SyntheticTechnology
MedicinalChemistry
Pharmacokinetics(ADME)
Tox
Pharmacology
(Molecular design.Molecular genetics)
<Kyorin Knowlegde>
※Closer contact with outside experts in the target field.Ability to collect comprehensive information with sophisticated approach.
※※Closer contact with outside experts in the target field.Closer contact with outside experts in the target field.Ability to collect comprehensive information Ability to collect comprehensive information with sophisticated approach.with sophisticated approach.
Selection of targetSearch for
lead compoundsOptimization of lead compounds
POC THEME
Reinforcement/Expansion
2Themes /year
Metabolic diseases
ActivX BiosciencesActivX Biosciences Metabolic diseases
13

KYORIN
14
2. Promote FC (franchise customer) strategy with break through new drugsthat eliminates negative effects of NHI price revisions
1. Promote FC (franchise customer) strategy FC(3 medical fields)doctors:
・Visit& Interview rate
Goal:100% ⇒ Results:78.8%( Yr chg +8.5%)
・Thenumber of sales calls(Permonth)
Goal :58,000 ⇒Results:56,000( Yr chg +13.7%)
・Coverage of prescribed doctors
(HP)
Goal :85% ⇒ Results:78%( Yr chg +1%)
(GP)
Goal : 70% ⇒ Results:74%( Yr chg +7%)
2.Aggressive action for post-marketing studies 〔e.g. EBM, PhⅢb〕 Mucodyne DS:Pediatric use(Approval in winter 2002)
KYORIN
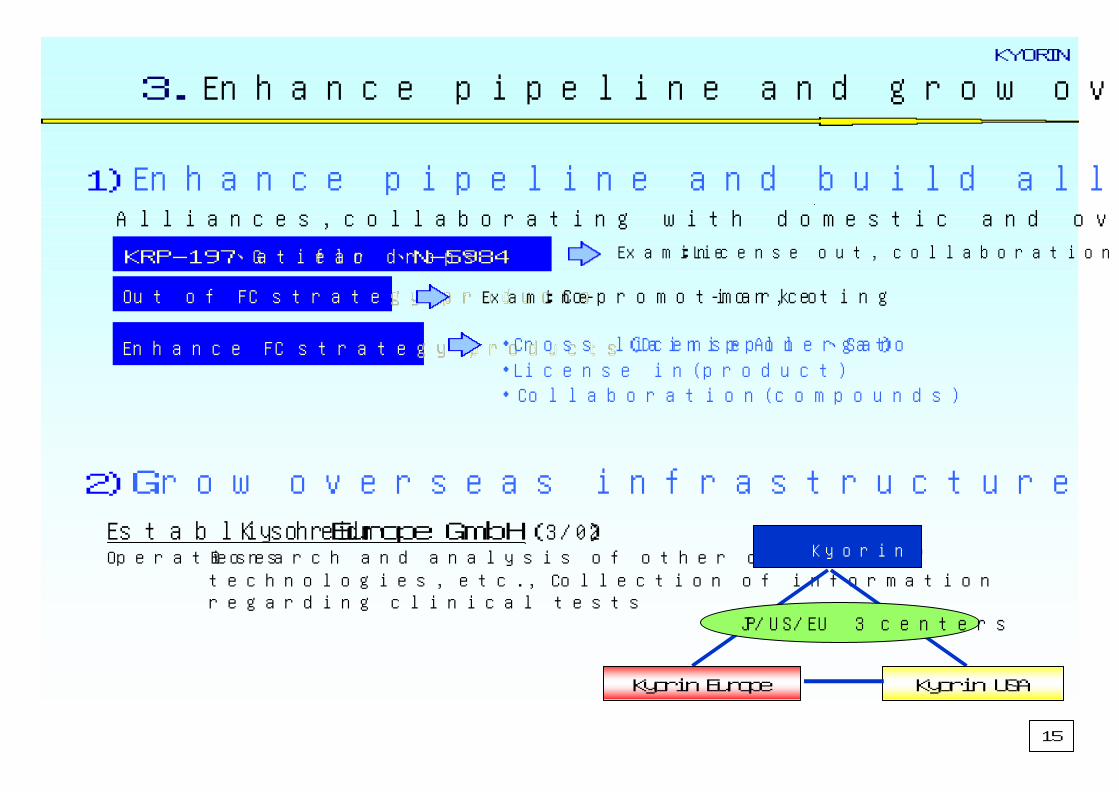
Established Kyorin Europe GmbH(3/02) Operations Research and analysis of other companies'
technologies, etc., Collection of informationregarding clinical tests
Alliances,collaborating with domestic and oversea companies
KRP-197、KRP-197、GatifloGatiflo ear dropsear drops、、N-5984N-5984
Enhance FC strategy products Enhance FC strategy products
Examine:License out, collaboration (oversea companies)
・Cross license(Dainippon 、 Allergan 、Sato)・License in(product)・Collaboration(compounds)
15
3.Enhance pipeline and grow overseas infrastructure
2)Grow overseas infrastructure
Kyorin
Kyorin USAKyorin Europe
JP/US/EU 3 centers
1)Enhance pipeline and build alliances
Out of FC strategy productsOut of FC strategy products Examine: Co-promotion,co-marketing

KYORIN
16
4.Thorough implementing of efficient management
1,6951,6711,887Staff
MIC
23.5%
76.5%
9/02
29.7%
70.3%
3/98
24.5%Indirect staff ratio
75.5%Direct staff ratio
3/02
1. Address cost reductions = Keep 30% COGS ratio = Reduce the products( 3/02 :7products ) Transfer the product( 3/02 :2products ) Improve automatic packaging system reduced intermediate product costs
2. Make indirect departments slimmer, more efficient Improve efficiency through IT : Sales office staff 0 person ⇒Allow voluntary retirement of office
workers (30 employees)Workflow to increase efficiency in operations
=Direct staff ratio=

KYORIN
17
Main R&D activities① (9/30/02)
Exclusive marketing right to Kyorin.Development in Japan was taken Over by Kyorin who filed to theAuthorities
Strong 5HT1B/1D agonist.Earlyonset of action after administration toMagraine attack.Improvement for recurrent cases.
Merck (US)
Migraine headache remedy
MaxaltTablets
Wefar tabets
NDA(11/01)
Developed with Nisshin Flour Milling(nissin pharma)
NDA by Nissin-kyorin5-HT3 and5-HT4 dual antagonist
Nisshin Flour Milling
Anti-emetic agent
N-3389Tablets
NDA(2/02)
○ Add 4 mg tablets
○ Change use and dosage
Newly produced for children 2 to 5 yrsMerck (US)Anti-bronchial asthma agent
MontelukastPhⅡ
First nail varnish formulation for nail mycosis in Japan
Developed with Nisshin Flour MillingA potent and selective β3 AR agonist. The reduction of plasma glucose,insulin,TG and FFA, and theimprovement ofglucose tolerance.
Nisshin Flour Milling
Anti-diabetes agent
Anti-obesity
N-5984Tablets
PhⅠ
Added formulationIn-houseBroad spectrum synthetic anti-bacteria agent
GATIFLO Intravenous
PhⅠ
US: Licensed to Merck (9/99) Japan:developed with Banyu
Improves insulin resistance and lipid abnormality of Type 2 diabetes
In-houseInsulin sensitizerKRP-297
Tablets ※PhⅡ
UK: Phase I (Outsource to CRO)Japan: Agreement with Ono Pharm for joint development and sales
Potent anti-cholinergic agent, little dry mouthIn-houseUrinary
incontinence treatment
KRP-197Tablets
PhⅡ
Agreement with Maruho for joint development(11/01)
In-houseAnti-mycotic
agent
PEKIRON Nail
lacquerPhⅡ
Comments FeaturesOriginEfficacyCompound/CodeStage

KYORIN
Other products (one change approved)
○ Changed to prescription ○ Pediatric use ○ Adult use: National Drug Prices listed on 7/6/01
Partially dissolved to improve efficacy. Produced in peach flavor for children
JoullieIn-house developed
Bronchial mucous
disordersMucodyne DS
※NDA(12/01)
CommentsCharacteristicsOriginEfficacyCompound/CodeStage
Licensing developments
In-house
Synthetic antibacterial
agentPhⅡ/ⅢGrünenthalGatifloxacin
Intravenous
Exp
orts
Synthetic antibacterial
agent
Provide R&D, production and sales rights worldwide except Japan, China, Korea, Taiwan
In-house
Insulin sensitizer
※PhⅡb
(US)MerckKRP-297
Provide R&D, production and sales rights in JapanPh III (JapanSenju Seiyaku
Provide R&D, production and sales rights worldwide except Japan, China, Korea, TaiwanIn-
house
※NDA(USA)
AllerganGatifloxacin
Eye Drops
CommentsOriginEfficacyStageLicenseeCode
18
Main R&D activities② (9/30/02)

KYORIN
1. Update on Bistner business fund ・Start: September 2000・Investment: �5 billion (of which �2 billion invested during 2ndyear results�1.1 billion )・Focus: Pharmaceuticals, healthcare, daycare, health
・Sterilizer / disinfectant for poultry use
・Developing treatments for viral pneumonia and rheumatism 2
・Sales of health foods
・Commercialize various water treatment methods
・Securities firm ※Increase information from China (Kanpo Medicines and health food ventures) ETC
7
・Organic waste management (lavatories for nursing use)
ETC3
・Dentist delivery (to daycare, nursing homes)
ETC5
BusinessCompanies invested
Facilities, Daycare at home, Related products
NursingFacilities, Daycare at
home, Related products
Medical-careAlternative and/or
reproductive medicine, and IT
PharmaceuticalsNew drugs derived from
genome etc.
Focus
Invested companies
19
Growth in new businesses: update
Total:17companeis

KYORIN
March 2002 MidMarch 2002 Mid--Term Financial ResultsTerm Financial Results
P&L BS SUMMARYP&L BS SUMMARY

KYORIN
P&L SUMMARY(1)
4.2%52.1%4521,3193.0%867Net profit
8.6%39.2%7582,6936.7%1,935Pretax profit
0.1%
6.3%
△14.3%
△0.6%
△5
△10
31
1,965
0.1%
6.9%
36
1,976
Extraordinary profits
Extraordinary losses
14.8%19.4%7524,62613.5%3,874Recurring profit
0.6%
1.0%
6.6%
205.0%
12
210
200
313
0.7%
0.4%
188
102
Non-op income
Non-op expense
25.1%
8.7%
6.0%
1.7%
8.6%
Yr chgAmt chg
54.9%
10.0%
1,366
176
17,109
3,130
54.9%
10.3%
15,743
2,954
SG&A
of which R&D
15.2%9504,73913.2%3,788Operating profit
31.9%
100.0%
% sales9/02% sales9/01
9,163 29.9%1519,315 COGS
100.0%2,46831,16428,695Sales
<Parent>
20
(Units: ¥ millions)

KYORIN
P&L SUMMARY(2)
■ Operating profit ¥4,739 million (+ �1.0billion)
Operating profit ratio: 15.2% (+ 2..0 points)
■Recurring profit:¥4,626 million (+ ¥0.8billion)
Recurring profit ratio:14.8% (+ 1.3 points)
【Other income】 + ¥12 million
【Other expense】 + ¥210 million
■Current term profit:�1,319 million (+ ¥0.5billion)
Valuation loss of negotiable investment securities
(¥355 million)
Depreciation of debt for pension plan (¥1,590 million )
* Last year of 3-year depreciation
■ COGS:¥9,315 million (+�0.2billion)
●Cost ratio:29.9% (- 2.0points)
【Positive factors】
Gatiflo launched
【Negative factors 】
Decline in wholesale prices as a result of revision of NHI
price (Price revision rate: 8.2%)
■ SAG:¥ 17,109 million (+¥1.4billion)
●SAG ratio:(54.9% → 54.9%)
【Negative factors 】
Initial marketing expense of Gatiflo
Increase of personnel expenses
R&D cost :¥3,130million(+¥0.2million )
【Positive factors】
Sales increase & Reinforced management of other costs
21

KYORIN
BS SUMMARY(1)
100.0%6,867133,696100.0%126,829Total assets
26.6%
73.4%
% total % totalAmt chg9/029/01
33,69413,8507,020
12,823
32.9%10,26343,95715,3765,970
22,611
Fixed assets Tangible assets Intangible assets Investments
67.1%△3,39689,73852,158
43918,5551,906
11,1625,515
93,13560,049
48218,3313,3998,1632,708
Current assetsCash, depositsNotes receivableAccounts receivableMk securitiesInventoryOther
< Parent >
■ Current assets(down �3,396 million yoy)
・Cash & deposits (down �7,891 million yoy)・A/R, notes receivable (up �181 million yoy )・Inventory (up �2,998 million yoy)
■ Fixed assets (up �10,263 million yoy)
・Tangible assets(up �1,526 million yoy)
・ Intangible assets(down �1,050 million yoy)
*Depreciation(Milton)
・Investments (up �9,787 million yoy) 22
(Units: ¥ millions)

KYORIN
BS SUMMARY(2)
12.4%4,28616,5549.7%12,267Long term liabilities
3.2%
0.7%73.2%
△0.2%△0.4%
4,317
94997,879
△269△522
2.9%1.3%0.7%
74.0%
△0.2%
3,6231,642
90593,861
△243
Common stock Additional paid-in capital Legal reserve Retained earnings Capital surplus
Retained earnings Net unrealized(losses)gains of securities
Treasury stock
76.5%2,563102,35578.7%99,791Total shareholders’ eq.
100.0%6,867133,696100.0%126,829Total Liabilities & sh/s eq.
21.3%
11.6%
% total % totalAmt chg9/029/01
27,038 23.5%4,30331,341Total liabilities
11.1%1614,787
965
2,825
10,996
14,770
1,036
4,696
9,037
Current liabilities Note payable
Trade accounts payable
other
< Parent >
■ Current liabilities(up �16 million yoy)
・ A/P, notes payable (down �1,942 million yoy)
・ Other(up �1,958 million yoy)
■ Non-current liab(up �4,286 million yoy) 23
(Units: ¥ millions)

KYORIN
Yr chg
3,500
5,300
7,300
3/03 (Forecast)
1,435
343
2,616
9/99
1,312
1,099
2,795
9/00
1,518
950
2,954
9/01
3,207
2,507
6,031
3/02
5.2%1,597Depreciation expense
157.7%2,448Capex (book base)
6.0%3,130R&D expense
9/02
< Capital expenditure(Result/Forecast)>
3/02 9/02 3/03New drug production equipment and (Result) (Forecast)other production equipment (each factory) �0.8 billionStaff loading, living quarters (Noshiro Plant) �0.4 billion
Kilo-Labo equipment �0.4billion �1.0billionNew drug production equipment andother production equipment (each factory) �1.4 billion �2.6 billion Equipment for control, sales activities �0.3 billion �1.0billion
Branch building rebuild �0.3 billion �0.5billion
(Units: ¥ millions)
24
R&D, capex & depreciation
Amt chgYr chg% sales9/02% sales9/01
871
△922
2,058
2,007
36
1,976
3,946
214
98
3,831
15,847
(2,954)
19,679
9,613
29,293
3.0%
△3.2%
7.0%
6.9%
0.1%
6.7%
13.5%
0.7%
0.3%
13.1%
54.1%
(10.1%)
67.2%
32.8%
100.0%
68478.5%4.9%1,555Net profit
△392―4.1%△1,315Tax adjustments
66432.3%8.5%2,722 Corporate, inhabitants
and enterprise taxes
95647.6%9.3%2,963Pretax profit
△12
△10
△35.0%
△0.6%
0.1%
6.2%
23
1,965
Extraordinary profits
Extraordinary losses
95824.3%15.4%4,904Recurring profit
110
127
51.8%
129.5%
1.0%
0.7%
324
226
Non-op income
Non-op expense
97525.4%15.1%4,806Operating profit
1,375
176
8.7%
(6.0%)
54.0%
(9.8%)
17,222
(3,130)
SG&A
(of which R&D)
2,35011.9%69.1%22,029Gross profit
2352.4%30.9%9,848 COGS
2,5858.8%100.0%31,878Sales
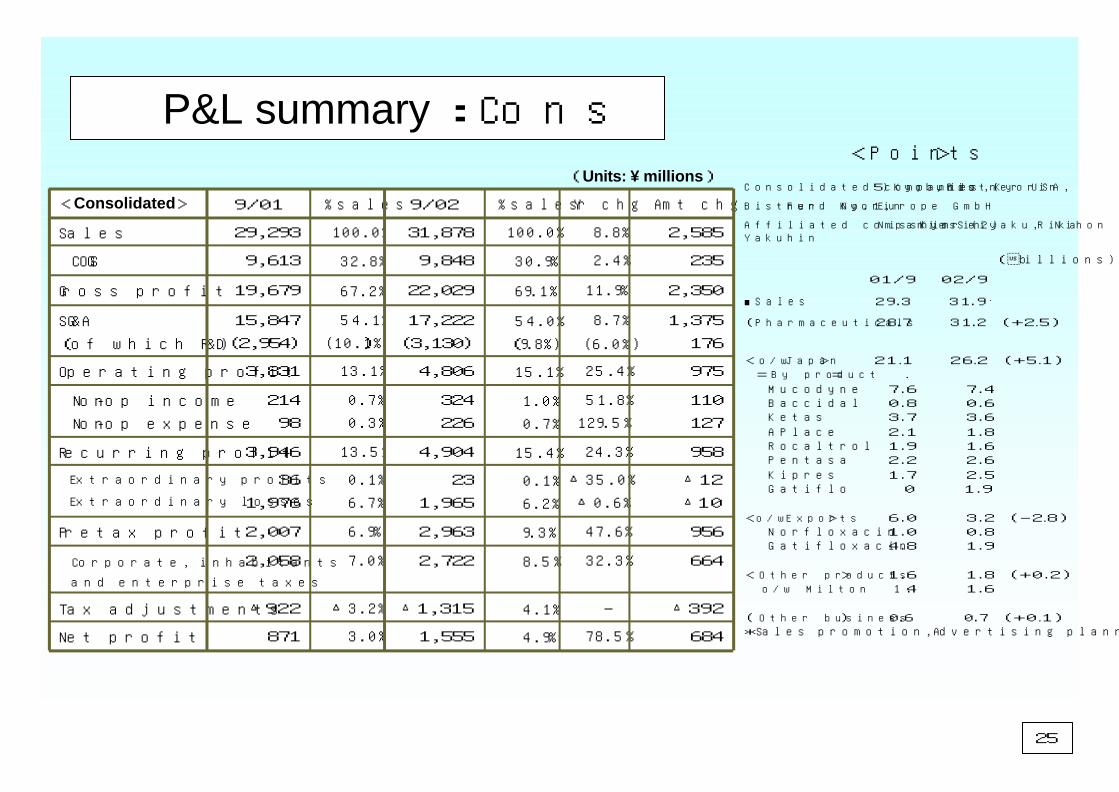
<Consolidated>
P&L summary :Cons
(Units: ¥ millions)
<Points>
Consolidated companies (5) Kyobundo, Bistner, Kyorin USA,
Bistner Fund No.1,Kyorin Europe GmbH
Affiliated companies (2) Nisshin Kyorin Seiyaku, Nihon Rikagaku Yakuhin
(�billions)
01/9 02/9
■Sales 29 .3 31 . 9
(Pharmaceuticals 28 .7 31 .2 (+2.5)
< o/w Japan > 21.1 26.2 (+5.1) = By product = . Mucodyne 7.6 7.4 Baccidal 0.8 0.6 Ketas 3.7 3.6 APlace 2.1 1.8 Rocaltrol 1.9 1.6 Pentasa 2.2 2.6 Kipres 1.7 2.5 Gatiflo 0 1.9
<o/w Exports > 6.0 3.2 (-2.8) Norfloxacin 1.0 0.8 Gatifloxacin 4.8 1.9
< Other products > 1.6 1.8 (+0.2) o/w Milton 1.4 1.6
( Other business ) 0 .6 0 .7 (+0.1)*Sales promotion,Advertising planning and production
25

KYORIN
P&L summary :Par①(Units: ¥ millions)
Amt chgYr chg% sales9/02% sales9/01
16410.3%5.6%1,7595.6%1,595Other
△2,793△46.7%10.2%3,19120.9%5,984Pharm (Exp)
5,09624.1%84.1%26,21273.6%21,116Pharm (Jpn)
2,4688.6%100.0%31,164100.0%28,695Sales
< Parent >
26
[Major issues for current medium term]♦ Sales: �31,164 million (up by �2.500 billion)[Prescription drugs for Japanese market] �26,212 million (up by �5.1 billion)=Positive factors= ( Units: ¥ billions)
9/01 9/02New drugs: Launch of Gatiflo 0 → 1.9 (+1.9)*Only Kyorin's turnover is shown.
- Continuous increase in sales of Kipres 1.7 → 2.5 (+0.8)- Other drugs 1.1 → 4.2 (+3.1)
(Other positive factors)•Sales of Gatiflo to Dainippon Pharmaceutical and licensing fee installments=Negative factors=*Decline in wholesale prices as a result of revision of NHI price (Price revision rate: 8.2%)Turnover for major products (already on the market) 18.3 → 17.6 (-0.7)Aplace 2.1 → 1.8 (-0.3)Rocaltrol 1.9 → 1.6 (-0.3)[Prescription drugs for overseas market] �3,191 million (down by �2.8 billion)- Gatiflo 4.8 → 1.9 (-2.9)* Substantial reduction in export of gatifloxacin due to BMS' overstocking [Other products] (up by �0.2 billion)-Milton 1.4 → 1.6 (+0.2)

KYORIN
P&L summary :Par②(Units: ¥ millions) <Points>
27
Amt chgYr chg% sales9/02% sales9/01
45252.1%4.2%1,3193.0%867Net profit
△348―△4.2%△1,297△3.3%△949Tax adjustments
65432.5%8.6%2,6717.0%2,016 Corporate, inhabitants
and enterpr ise taxes
75839.2%8.6%2,6936.7%1,935Pretax profit
△5
△10
△14.3%
△0.6%
0.1%
6.3%
31
1,965
0.1%
6.9%
36
1,976
Extraordinary prof its
Extraordinary losses
75219.4%14.8%4,62613.5%3,874Recurring profit
12
210
6.6%
205.0%
0.6%
1.0%
200
313
0.7%
0.4%
188
102
Non-op income
Non-op expense
95025.1%15.2%4,73913.2%3,788Operating profit
1,366
(176)
8.7%
(6.0%)
54.9%
10.0%
17,109
(3,130)
54.9%
(10.3%)
15,743
(2,954)
SG&A
(of which R&D)
2,31611.9%70.1%21,84868.1%19,531Gross profit
1511.7%29.9%9,31531.9%9,163 COGS
< Parent >■ COGS:¥9,315million (+¥0.2 billion)
●Cost ratio:29.9% (- 2.0points)
【Positive factors】
Gatiflo launched
【Negative factors 】
Decline in wholesale prices as a result of revision of NHI
price (Price revision rate: 8.2%)
■ SAG:¥ 17,109million(+¥1.4 billion)
●SAG ratio::(54.9% → 54.9%)
【Negative factors 】
Initial marketing expense of Gatiflo
Increase of personnel expenses
R&D cost :¥3,130million(+¥0.2 billion)
【Positive factors】
Sales increase & cost management
■ Operating profit ¥4,739million (+ �1.0 billion)
Operating profit ratio: 15.2% (+ 2.0 points)
■Recurring profit:¥4,626million (+ ¥0.8 billion)
Recurring profit ratio:14.8% (+ 1.3 points)
【Other income】 + ¥12million
【Other expense】 + ¥210million
■Current term profit:�1,319million (+ ¥0.5 billion)
Valuation loss of negotiable investment securities
(¥355million)
epreciation of debt for pension plan
(¥1,590million )
* Last year of 3-year depreciation

Amt chg% total9/02% total9/01
7,534100.0%135,017100.0%127,483Total Liabilities & sh/s eq.
3,12076.5%103,22878.5%100,107Total shareholders ’ eq.
3.2%
0.7%73.1%
△0.1%
0.0%
△0.4%
4,317
94998,724
△244
3
△522
2.8%1.3%
74.6%
△0.2%
0.0%
△0.0%
3,6231,642
95,051
△219
9
△0
Common stock Additional paid-in capital Consol idated retained earn ings
Capital surplusRetained earnings
Net unrealized(losses)gains of securities Foreign currency adjustment
account Treasury stock
4,41323.5%31,78921.5%27,376Total liabilities
4,29512.3%16,6439.7%12,347Non-current liab.
4,48210,664
6,3068,722
A/P, notes payable Other
11811.2%15,14611.8%15,028Current liabilities
15,4275,971
22,242
13,8877,020
12,166
Tangible assets Intangible assets Investments
10,56632.3%43,64125.9%33,074 Fixed assets
53,10419,515
2,01711,165
5,572
60,90919,123
3,4698,2302,675
Cash, deposits A/R, notes receivable Mk securities Inventory Other
△3,03267.7%91,37674.1%94,408Current assets
< Consolidated >
BS summary:Cons(Units: ¥ millions)
<Points>
28
■ Current assets(down ¥3,032 million yoy)
■Cash & deposits (down ¥7,805 million yoy)
■ A/R, notes receivable (up ¥329 million yoy)
■Inventory (up¥2,935 million yoy)
■ Fixed assets (up¥10,566 million yoy)
■ Tangible assets(up¥1,593 million yoy)
■ Intangible assets(down¥1,049 million yoy)
*Depreciation(Milton)
■Investments (up ¥10,076 million yoy)
■ Current liabilities(up ¥118 million yoy)
・ A/P, notes payable(down¥1,823 million yoy
・ Other(up ¥1,941million yoy)
■ Non-current liab(up ¥4,295million yoy)
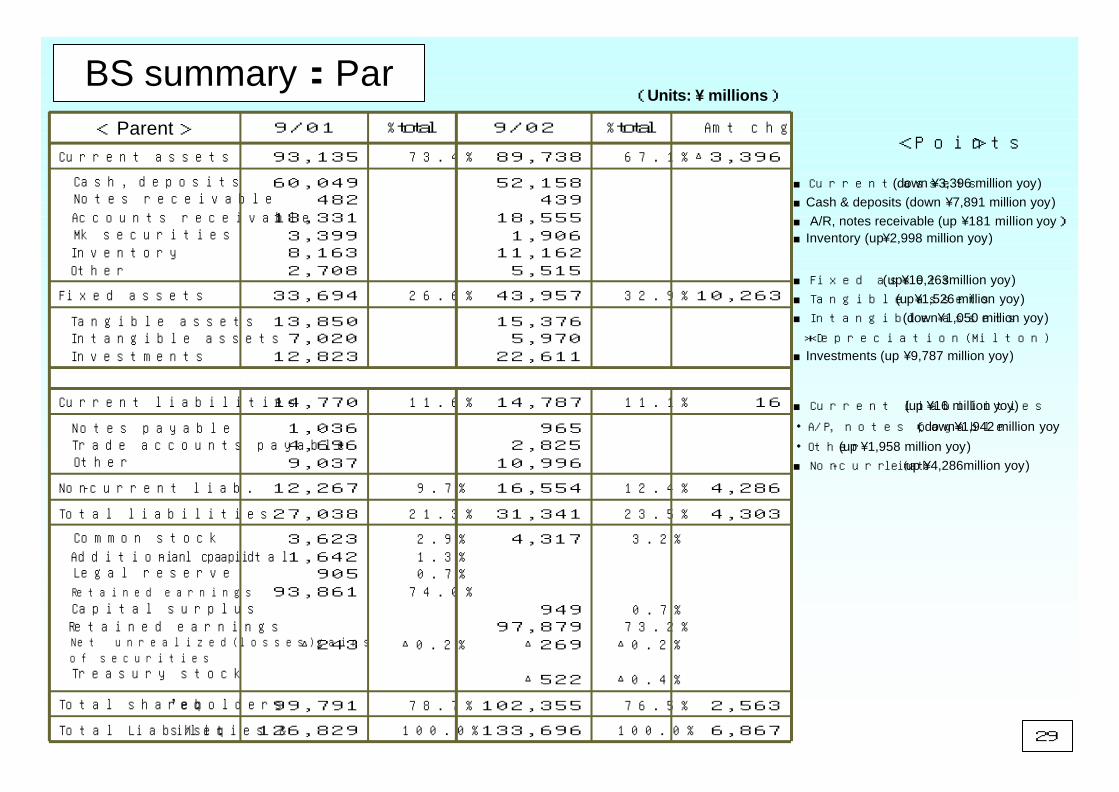
BS summary:Par(Units: ¥ millions)
<Points>Amt chg% total9/02% total9/01
6,867100.0%133,696100.0%126,829Total Liabilities & sh/s eq.
2,56376.5%102,35578.7%99,791Total shareholders ’ eq.
3.2%
0.7%73.2%
△0.2%
△0.4%
4,317
94997,879
△269
△522
2.9%1.3%0.7%
74.0%
△0.2%
3,6231,642
90593,861
△243
Common stock
Additional paid-in capital Legal reserve
Retained earnings
Capital surplusRetained earnings
Net unrea l ized( losses)ga ins of securities Treasury stock
4,30323.5%31,34121.3%27,038Total liabilities
4,28612.4%16,5549.7%12,267Non-current liab.
9652,825
10,996
1,0364,6969,037
Notes payable Trade accounts payable Other
1611.1%14,78711.6%14,770Current liabilities
15,3765,970
22,611
13,8507,020
12,823
Tangible assets Intangible assets Investments
10,26332.9%43,95726.6%33,694Fixed assets
52,158439
18,5551,906
11,1625,515
60,049482
18,3313,3998,1632,708
Cash, deposits Notes receivable
Accounts receivable Mk securities Inventory Other
△3,39667.1%89,73873.4%93,135Current assets
< Parent >
29
■ Current assets(down ¥3,396 million yoy)
■Cash & deposits (down ¥7,891 million yoy)
■ A/R, notes receivable (up ¥181 million yoy)
■Inventory (up¥2,998 million yoy)
■ Fixed assets (up¥10,263million yoy)
■ Tangible assets(up¥1,526 million yoy)
■ Intangible assets(down¥1,050 million yoy)
*Depreciation(Milton)
■Investments (up ¥9,787 million yoy)
■ Current liabilities(up ¥16 million yoy)
・ A/P, notes payable(down¥1,942 million yoy
・ Other(up ¥1,958 million yoy)
■ Non-current liab(up ¥4,286million yoy)

Yr chg
85.1%
10.6%
1.4
4.6
7.5
3.1
5.4
3.2
3.4
8.5
1.0
17.5
8.5
7.1
3/03
(Forecast)
In-house ratio (%)
Export ratio (%)
Norfloxacin( Bulk・Royalty )
Gatifloxacin(Bulk・Royalty)
Exports
Milton(Effervescent disinfectant)
Pentasa(Ulcerative colitis and Crohn ’s
disease treatment)
Rocaltrol(Osteoporosis remedy)
Aplace(Anti-ulcer agent)
Ketas(For bronchial asthma and cerebrovasculas disorders)
Baccidal(Antibacterial agent)
Mucodyne(Mucuregulant)
Gatiflo(Kyorin)(Antibacterial agent)
Kipres(LT receptor antagonist)
1.8△17.3%0.81.01.11.2
2.95.9%1.61.41.41.5
3.144.5%2.51.7――
――1.9―――
9.8△59.5%1.94.82.00.7
84.0%―83.1%84.0%81.4%82.3%
20.1%―10.2%20.9%14.0%11.5%
12.1△46.7%3.15.93.52.6
*
4.519.3%2.62.21.91.5
3.8△16.1%1.61.91.91.8
4.3△18.6%1.82.12.32.4
7.5△3.9%3.63.73.73.3
1.7△30.5%0.60.80.91.1
17.5△4.2%7.47.67.06.6
3/029/029/019/009/99
(Units: ¥ billions)Sales update
DO
ME
ST
IC
SA
LE
S
30
OT
CF
OR
EIG
N
SA
LE
S

Financial summary (consolidated)
< Full-term > (Units: �millions )
31
1,312
1,099
1,724
82.6%
1.0%
1,711
98,522
119,249
3,623
17.11
985
(3.7%)
3,778
(14.4%)
3,518
(13.4%)
2,795
(10.7%)
14,010
(53.5%)
8,681
(33.1%)
26,210
(3,589)
9/00
950
1,746
78.5%
0.9%
1,739
100,107
127,483
3,623
15.14
871
(3.0%)
3,946
(13.5%)
3,831
(13.1%)
2,954
(10.1%)
15,847
(54.1%)
9,613
(32.8%)
29,293
(5,984)
9/01
1,7311,757Staff
3,5003,2131,6031,518Depreciation expense
5,3002,5072,448Capital expenditure
76.1%76.5%Equity ratio (%)
4.1%1.5%ROE (%)
1,1871,197BPS (¥)
102,356103,228Shareholders’ equity
134,472135,017Assets
4,3174,3174,317Capital
62.6660.5518.05EPS (¥)
5,400
(7.5%)
4,117
(6.6%)
1,555
(4.9%)
Net profit(Ratio to sales)%
14,300
(19.9%)
12,210
(19.6%)
4,904
(15.4%)
Recurring profits(Ratio to sales)%
14,300
(19.9%)
11,957
(19.2%)
4,806
(15.1%)
Operating profit(Ratio to sales)%
7,300
(10.2%)
6,031
(9.7%)
3,130
(9.8%)
R&D expense(Ratio to sales)%
ー31,101
(49.8%)
17,222
(54.0%)
SGA(Ratio to sales)%
ー19,336
(31.0%)
9,848
(30.9%)
COGS(Ratio to sales)%
71,900
(7,500)
62,395
(12,127)
31,878
(3,191)
Sales(Exports)
03/3(Forecast)
3/029/02
< Interim period >

Financial summary (parent)< Full-term> (Units: �millions )
32
1,6711,6951,6921,6791,7981,867Staff
3,5003,2071,5971,5181,3121,4351,296Depreciation expense
5,3002,5072,4489501,099343427Capital expenditure
76.2%76.5%78.7%82.9%84.4%83.2%Equity ratio (%)
3.8%1.2%0.9%1.0%1.7%0.6%ROE (%)
1,1791,1871,7331,7081,6601,575BPS (¥)
101,703102,35599,79198,35995,59390,709Shareholders’ equity
133,427133,696126,829118,674113,317108,985Assets
4,3174,3174,3173,6233,6233,6233,623Capital
60.3455.6715.3115.0716.4928.078.80EPS (¥)
5,200
(7.4%)
3,785
(6.2%)
1,319
(4.2%)
867
(3.0%)
949
(3.7%)
1,616
(7.0%)
506
(2.5%)
Net profit(Ratio to sales)%
14,000
(19.8%)
11,816
(19.3%)
4,626
(14.8%)
3,874
(13.5%)
3,710
(14.5%)
3,118
(13.4%)
1,379
(6.8%)
Recurring profits(Ratio to sales)%
14,300
(20.3%)
11,865
(19.4%)
4,739
(15.2%)
3,788
(13.2%)
3,488
(13.6%)
2,999
(12.9%)
1,452
(7.2%)
Operating profit(Ratio to sales)%
7,300
(10.3%)
6,031
(9.9%)
3,130
(10.0%)
2,954
(10.3%)
2,795
(10.9%)
2,616
(11.3%)
2,564
(12.6%)
R&D expense(Ratio to sales)%
ー30,889
(50.5%)
17,109
(54.9%)
15,743
(54.9%)
13,897
(54.3%)
13,105
(56.4%)
12,805
(63.1%)
SGA(Ratio to sales)%
ー18,376
(30.1%)
9,315
(29.9%)
9,163
(31.9%)
8,234
(32.1%)
7,132
(30.7%)
6,020
(29.7%)
COGS(Ratio to sales)%
70,600
(7,500)
61,131
(12,127)
31,164
(3,191)
28,695
(5,984)
25,620
(3,589)
23,238
(2,679)
20,277
(2,431)
Sales(Exports)
03/3(Forecast)
3/029/029/01 9/009/999/98
< Interim period >