March 14, 2013 WORKING GROUP 3 E9-1-1 Location Accuracy Indoor
56
The Communications Security, Reliability and Interoperability Council III Working Group 3 “Indoor Location Test Bed Report” 1 March 14, 2013 WORKING GROUP 3 E9-1-1 Location Accuracy Indoor Location Test Bed Report
Transcript of March 14, 2013 WORKING GROUP 3 E9-1-1 Location Accuracy Indoor

The Communications Security, Reliability and Interoperability Council III Working Group 3 “Indoor Location Test Bed Report”
1
March 14, 2013 WORKING GROUP 3
E9-1-1 Location Accuracy
Indoor Location Test Bed Report

The Communications Security, Reliability and Interoperability Council III Working Group 3 “Indoor Test Report”
2
Table of Contents 1. CSRIC III Structure ............................................................................................................................. 5
2. INTRODUCTION ...................................................................................................................................... 8
3. PUBLIC SAFETY FOREWORD ................................................................................................................... 8
4. INDOOR TEST BED OBJECTIVES .............................................................................................................. 9
5. TEST BED FRAMEWORK .......................................................................................................................... 10
5.1 Test Location, Test Plan and Device Considerations ......................................................................... 11
5.2 Funding for Test Bed ......................................................................................................................... 11
5.3 Confidentiality of Data .............................................................................................................. 12
6. STAGE 1 TESTING .................................................................................................................................. 12
6.1 Test Approach .............................................................................................................................. 12
6.2 Performance Attributes Tested ................................................................................................ 14
6.2.1 Location Accuracy ............................................................................................................. 14
6.2.2 Latency (TTFF) ........................................................................................................................ 14
6.2.3 Yield ......................................................................................................................................... 14
6.2.4 Reported Uncertainty ......................................................................................................... 14
6.2.5 Location Scatter ................................................................................................................... 14
6.3 Morphologies and Buildings Used ...................................................................................... 14
6.3.1 Dense Urban Morphology and Buildings ...................................................................... 15
6.3.2 Urban Morphology and Buildings .................................................................................... 17
6.3.3 Suburban Morphology and Buildings ............................................................................. 20
6.3.4 Rural Morphology and Buildings ...................................................................................... 22
6.4 Location Technologies Tested in Stage-1 ............................................................................ 24
6.4.1 Technology from NextNav ........................................................................................................ 24
6.4.2 Technology from Polaris Wireless ............................................................................................. 24
6.4.3 Technology from Qualcomm ..................................................................................................... 25
7. SUMMARY OF RESULTS ......................................................................................................................... 25
7.1 Yield .............................................................................................................................................. 26

The Communications Security, Reliability and Interoperability Council III Working Group 3 “Indoor Test Report”
3
7. 2 Overall Location Accuracy Summary .................................................................................. 26
7.3 Location Accuracy by Environment ...................................................................................... 27
7.3.1 Dense Urban Environment ................................................................................................. 27
7.3.2 Urban Environment .............................................................................................................. 29
7.3.3 Suburban Environment ....................................................................................................... 31
7.3.4 Rural Environment ................................................................................................................ 33
7.4 Location Accuracy Summary by Technology .................................................................... 34
7.5 Vertical Error.................................................................................................................................. 36
7.6 TTFF ................................................................................................................................................... 37
7.7 Reported Uncertainty ................................................................................................................ 38
7.8 Vendor feedback on testing ................................................................................................... 39
7.8.1 NextNav .................................................................................................................................. 39
7.8.2 Polaris Wireless....................................................................................................................... 40
7.8.3 Qualcomm ............................................................................................................................ 41
8. HANDSET RAMIFICATIONS .................................................................................................................... 41
8.1 NextNav ......................................................................................................................................... 42
8.2 Polaris Wireless .............................................................................................................................. 42
8.3 Qualcomm .................................................................................................................................... 42
9. NETWORK RAMIFICATIONS ...................................................................................................................... 43
9.1 POLARIS WIRELESS ............................................................................................................................. 43
9.2 NextNav ......................................................................................................................................... 43
9.3 Qualcomm .................................................................................................................................... 43
10. STANDARDS MODIFICATIONS ........................................................................................................... 44
10.1 Polaris Wireless ............................................................................................................................ 44
10.2 NextNav ....................................................................................................................................... 44
10.3 Qualcomm.................................................................................................................................. 44
11. COST, AVAILABILITY, RELIABILITY, AND TIMING .................................................................................. 44
11.1 Polaris Wireless ............................................................................................................................ 44
11.2 NextNav ....................................................................................................................................... 45
11.3 Qualcomm.................................................................................................................................. 45

The Communications Security, Reliability and Interoperability Council III Working Group 3 “Indoor Test Report”
4
12. LESSONS LEARNED ........................................................................................................................... 45
12.1 Key Factors to Success of the Current CSRIC WG3 Effort .............................................. 46
12.1.1 Commitment to the Effort and the Team: .................................................................. 46
12.1.2 Alignment on Goals: ......................................................................................................... 46
12.1.3 Willingness to Accept Risk: .............................................................................................. 46
12.1.4 Highly Controlled process for Exchange of Proprietary Information: ................. 46
12.1.5 Viable Means of Procuring Test bed Services: .......................................................... 47
12.1.6 Achieving Test-house Independence: ........................................................................ 47
12.1.7 Establishment of a Workable Funding Mechanism:................................................. 47
12.1.8 Establishment of an Oversight Function: ..................................................................... 48
12.1.9 Balance of Stakeholder Interests: ................................................................................. 48
12.2 Challenges to Overcome and Process Recommendations .................................... 48
12.2.1 Project Setup and Contractual Challenges: ............................................................. 49
12.2.2 Building Access Challenges: .......................................................................................... 49
12.2.3 Considerations Regarding Building Access for Future Test Beds .......................... 51
13. LOCATION TECHNOLOGY CONSIDERATIONS FOR INDOOR WIRELESS E911.................................... 51
13.1 Important Insights Gained from Test Bed Process .......................................................... 52
13.2 Further Observations on Indoor Location ......................................................................... 52
13.3 Cost Considerations ................................................................................................................. 53
13.4 Summary of Desired Location Technology Characteristics ......................................... 53
13.5 Summary & Conclusions ........................................................................................................ 54
13.5.1 Location Technologies/Vendors Not Participating in the Test Bed .................... 55
13.5.2 Recommendation For Future Test Bed Stages ......................................................... 55
14. APPENDIX ........................................................................................................................................ 55

The Communications Security, Reliability and Interoperability Council III Working Group 3 “Indoor Test Report”
5
1. CSRIC III Structure
Figure 1: CSRIC III Organization Chart
Working Group 3 Outdoor Sub-Group Team Members
Working Group 3 Co-Chairs
Stephen J. Wisely – APCO International
Richard Craig – Verizon Wireless
Subgroup Co-Leaders
Susan Sherwood Verizon Wireless
Norman Shaw Polaris Wireless
Working Group Document Editor:
Brent Burpee Verizon Wireless
The Communications Security, Reliability and Interoperability Council III Working Group 3 “Indoor Test Report”
6
WG 3 LBS Subgroup consists of the following members:
First Name Last Name Organization
Wayne Ballantyne Motorola Mobility, LLC
Andrew Beck CommScope
Richard Craig Verizon Wireless
Marlys Davis King County E9-1-1 Program Office
Khaled Dessouky TechnoCom Corporation
Jeanna Green Sprint
Roger Hixson NENA
Ryan Jensen T-Mobile
Marte Kinder Time Warner Cable
Sandra Lott CenturyLink
Mike Loushine Applied Communication Sciences
Barry Martin Boeing
Kathy McMahon APCO International
Martin Moody Metro Emergency Services Board
Gary Parsons NextNav LLC
Ganesh Pattabiraman NextNav LLC
Gustavo Pavon True Position, Inc.
Raghavendhra Rao AT&T
Chuck Ronshagen Cassidian Communications
Brett Schneider Bexar Metro 9-1-1 Network District
DeWayne Sennett ATIS
Norman Shaw Polaris Wireless
Susan Sherwood Verizon Wireless
Girish Sivaram TeleCommunication Systems, Inc. (TCS)
Dorothy Spears-Dean Virginia Information Technologies Agency
Bill Tortoriello US Cellular
Greg Turetzky CSR Technology Inc.

The Communications Security, Reliability and Interoperability Council III Working Group 3 “Indoor Test Report”
7
First Name Last Name Organization
Bruce Wilson Qualcomm Inc.
Stephen Wisely APCO International
Table 1 - List of Working Group Members
Additional Contributors:
Kirk Burroughs - Qualcomm
The Communications Security, Reliability and Interoperability Council III Working Group 3 “Indoor Test Report”
8
2. INTRODUCTION
As wireless usage increases and as more people are using cell phones indoors (or have abandoned the
usage of landline phones altogether) it is becoming clear that the need to accurately locate wireless users
in indoor environments is increasing1. In June 2012, CSRIC Working Group III submitted its initial
report regarding Indoor Location Accuracy for E9-1-12. That report responded directly to the questions
on Indoor Location posed by the FCC in the Working Group's Charter. In addition, a primary finding in
that report identified the lack of objective and validated information regarding the performance of
available location technologies in various representative indoor environments. In the initial June report,
the Working Group identified obtaining this critical information as its highest priority and established a
set of cooperative actions, including an independent test bed, required to accomplish this task.
As noted in the June report, the key requirement for the test bed was to create an objective and consistent
test platform where the accuracy and performance of currently available location technologies could be
assessed, where new and emerging technologies could be evaluated in the future, and where the efficacy
of indoor testing methodologies could be proven in representative morphologies (e.g. urban, suburban,
etc..) and building types. To accomplish this goal, the work group developed a framework to support the
operation and management of an Indoor Location Test Bed. Key elements of that framework included:
* Solicitation and selection of an independent 3rd party to manage and perform testing
* Establishment of a funding mechanism to share common costs among participating vendors and
carriers
* Solicitation of interested and appropriate location technology vendors for participation
* Identification of representative morphologies for dense urban, urban, suburban and rural
* Identification of representative building types (including size, construction method and materials)
within the morphologies
* Establishment of an appropriate test plan, including testing parameters
This report provides details of the process for successfully establishing and completing the test bed, as
well as summary testing results from the technologies which were tested. The findings in this report are
consistent with the initial June report, and the Working Group does not believe that any results from the
test bed conflict with the answers or recommendations provided in the June report.
3. PUBLIC SAFETY FOREWORD
The Public Safety representatives on WG3 agree that the Test Bed objectives of conducting an unbiased
test to verify location accuracy in various structure types and morphologies were fulfilled with the Test
Bed. The results demonstrate the current capabilities and limitations of location based technologies
participating in the Test Bed. While the location positioning platforms tested provided a relatively high
level of yield, as well as improved accuracy performance, the results clearly indicate additional
development is required to ensure the positional coordinates provided on an emergency caller sheltered
indoors result in an “actionable location” for emergency response, especially in urban and dense urban
environments. An actionable location can vary based on the type of emergency incident and required
1 Article by the Center of Disease and Prevention Control entitled “Wireless Substitution: Early Release of Estimates From the
National Health Interview Survey, January - June 2010” by Stephen J. Blumberg, Ph.D., and Julian V. Luke, Division of Health
Interview Statistics, National Center for Health Statistics. 2 Report submitted by Communications Security, Reliability and Interoperability Council III Working Group 3 to the FCC
entitled “E9-1-1 Location Accuracy” on June 1, 2012.

The Communications Security, Reliability and Interoperability Council III Working Group 3 “Indoor Test Report”
9
response, but an essential element, in addition to location accuracy, is the ability to provide high
reliability and consistency of data (often captured as a low “uncertainty” metric), such that both
telecommunicators and first responders have confidence in the underlying information.
Public Safety desires reliable and consistent caller location information to a specific dispatch-able
building (and floor in multi-story environments). Lacking the specific building and floor, the desire
would be for the smallest possible search ring, but still with the underlying requirement for confidence in
the reliability and consistency of the data. In high building density environments (such as dense urban
and urban morphologies), even a small search ring may still encompass multiple adjacent buildings, while
in less dense environments (particularly rural), a somewhat larger search ring may still be sufficient to
identify a single structure. Further, floor level vertical accuracy is valuable in large multi-story structures
common in urban and dense urban morphologies, but is of lesser importance in rural morphologies and
single family structures.
Horizontal positional accuracy within 50 meters can provide a meaningful indoor location, particularly in
rural or suburban environments, but as the results of the Test Bed demonstrate, even this accuracy within
heavily urbanized areas or downtown settings may still result in positions outside the actual building
where the emergency call originated. Horizontal positional fixes that substantially exceed 50 meter
accuracy, provides only general location information. Tighter performance is required, particularly in
urban and dense urban environments to narrow the search ring to a single building or a more reasonable
number of adjacent buildings. The test bed results show significant promise with respect to high yield,
relatively high confidence factors and reliability for the technologies tested. Additional work is required
that incorporates emerging technologies into future, long term test bed processes. The current results
involving emerging technologies demonstrate the ability to achieve improved search rings in the
horizontal dimension (often identifying the target building, or those immediately adjacent). Substantial
progress in the vertical dimension (67th percentile of 2.9 meters, or approximate floor level accuracy) was
also demonstrated by one emerging technology through the use of locally calibrated barometric pressure
sensors in the handset. The availability of such functionality would be an important factor in locating
indoor callers in urban and dense urban multistory buildings. Public safety recognizes that additional
work remains before actionable altitude measurements can be broadly provided and utilized to aid first
responders, including standardization, commercial availability, and deployment of such technologies.
Public Safety expects that the standardization, commercial availability and deployment of such
technologies are priorities for all stakeholders. The incorporation of accurate vertical dimension (Z axis)
coordinates into public safety GIS systems would further assist in refining the caller’s location and in
some cases may well assist in eliminating adjacent properties as the call origination point.
The processes and procedures used to coordinate and establish the Test Bed should be used as a baseline
for recommended future indoor accuracy studies. It is imperative the processes used are repeatable and
technology neutral, thus allowing future test bed initiatives to follow the same processes regardless of the
type of technology represented in the test. However, Public Safety acknowledges that wide-spread
indoor accuracy testing is not practical, considering the challenges with building access, logistics and time
required to perform and analyze the test results as encountered in the current Test Bed. A process of
small-scale test beds and statistical sampling mutually designed and agreed upon by Public Safety,
location determining equipment vendors and wireless carriers will most likely provide the best vehicle for
future studies.
4. INDOOR TEST BED OBJECTIVES
The objective of the indoor E9-1-1 location test bed is to provide a platform to test the accuracy and
dependability of location technologies in the indoor environment across as many building types and

The Communications Security, Reliability and Interoperability Council III Working Group 3 “Indoor Test Report”
10
neighborhood descriptions (e.g. dense urban, suburban, etc.) as possible. While there are differing goals
among the WG 3 members, a primary goal of this testing will be to provide the FCC with verified data
for the capabilities of indoor location technologies on which to base their decisions as regards the
strategic direction of public safety services in this environment. Another goal will be to establish a
benchmark upon which emerging technologies can be compared to determine their relative promise in
improving the capabilities (both in terms of accuracy and/or consistency) that are currently available.
It is anticipated that this report will provide a clearer picture of the indoor performance of location
technologies available today or potentially in the near future. It is believed that the report will present the
most current picture of the ability to present “actionable locations” to public safety responders. The
various providers of public safety response, 9-1-1 Communications, Law Enforcement, Fire and EMS all
have the same basic needs and desires concerning location of those in need of assistance. The results of
the Test Bed will enable public safety associations to better educate Public Safety personnel on the
current capabilities of location technology in the indoor environment, as well as provide some insights
into the future.
5. TEST BED FRAMEWORK
The genesis of the test bed was to provide comprehensive, unbiased and actionable data to the FCC. In
order to meet this achieve this objective extreme care was taken in defining the technical parameters of
the test, including confidentiality of test points, and the selection of an independent 3rd
party to conduct
and compile the tests. CSRIC WG3 was divided into sub-committees to break up the task of the test plan
definition and execution. Certain committees did not include vendor companies in order to ensure that
there was no bias introduced into the results (specifically, the Building committee, which was responsible
for selection of specific buildings where the tests were to be conducted did not include any of the vendor
companies). The various tasks addressed by the committees included the following:
Committee Role
Polygon Responsible for selection of polygons – representing Dense
Urban, Urban, Suburban and Rural environments
Building Responsible for selecting specific buildings within each
morphology and coordinating with building managers to
facilitate access
Test Plan Responsible for defining the parameters of the test plan and
device characteristics
Finance Responsible for putting together the budget for the testing
program, defining the 3rd
party testing house selection
process, defining and creating the framework between the
3rd
party testing house and the various participating
companies.
The Communications Security, Reliability and Interoperability Council III Working Group 3 “Indoor Test Report”
11
Each committee performed the detailed tasks necessary to provide input to the workgroup, where final
decisions were made; thus ensuring all members of the committee were kept informed and their
concurrence was obtained.
5.1 Test Location, Test Plan and Device Considerations
In order to characterize the performance of location technologies indoors, the technologies needed to be
tested in truly representative environments. These environments reflect where the devices are expected to
be used. ATIS-0500011 defined these wireless use environments to be the ‘Dense Urban’, ‘Urban’,
‘Suburban’, and ‘Rural’ morphologies. For efficient testing and to keep costs manageable, a metropolitan
area had to be selected which had sufficient diversity of points in close enough proximity to allow a single
team to be deployed. Based on this criterion, the San Francisco Bay area was selected. The ‘Polygon’
committee then selected areas or ‘polygons’ representing the distinct morphologies per the ATIS
recommendations. Care was taken to ensure sufficient diversity of polygons, thus ensuring no systemic
biases were present. Further, because the Bay Area also included the city of San Jose, the Polygon
committee included two different ‘Urban’ polygons. One polygon characterized as ‘New Urban’ and
represented by downtown San Jose, and one characterized as ‘Old Urban’ and represented by downtown
San Francisco, which is adjacent to the ‘Dense Urban’ polygon.
A test plan framework developed by ATIS was further refined by the CSRIC committee to make it more
suitable for the FCC test bed. This included refining the requirements on the number of buildings,
defining ‘cold start’/’warm start’, background power consumption parameters of the handset, antenna
settings, etc.
5.2 Funding for Test Bed
In order to ensure that the tests are conducted in an unbiased manner, a neutral 3
rd party testing house was
hired. The budget for testing comprehensively across the various morphologies and hiring the 3rd
party to
do the tests was estimated to be approximately $250,000. To ensure that no one party had excessive
influence over the testing process it was critical to ensure that the test bed was jointly funded by all the
participating vendors and the wireless operators. Hence, a bilateral framework between each
‘participating company’ and the 3rd
party testing house was considered optimal. To further simplify the
agreement process and avoid a protracted negotiation process (where several companies were negotiating
multiple agreements with a single testing house), an agreement template was developed that was agreed to
by the participating CSRIC vendors. The other key understanding was that the companies could modify
specific administrative portions of the agreement, but the key technical areas (the actual test plan to be
executed, timeframe, confidentiality of data portions) were to remain unmodified and any modifications
would require concurrence of the full CSRIC WG. This ensured all parties were operating within the
same technical framework.
The 3rd
party test house selection was done through an RFI process, with over 4 companies participating.
At the completion of the RFI evaluation, TechnoCom was selected as the test vendor. Some of the
parameters for selecting the 3rd
party testing house were:
Should have the technical expertise to conduct and process the results in a timely fashion

The Communications Security, Reliability and Interoperability Council III Working Group 3 “Indoor Test Report”
12
Should have conducted tests of similar scale and participation of companies in the past
Should have worked with tier 1 operators, technology providers and have similar agreements in place
in the past (this is for making the agreement process go more smoothly between operators and the
testing house)
Should have the independence and credibility of carrying out the tests
5.3 Confidentiality of Data
It was also agreed upon by all parties that the raw results would be made available to each of the vendors
whose technology was to be tested, participating wireless operators (of all participating vendors), and the
3rd party testing house. To all other parties only summary data will be made available, which will be
made public through this report to the FCC.
6. STAGE 1 TESTING
6.1 Test Approach
Since the early discussions within WG3, the concept of objective side-by-side testing of location
technologies under well defined, clearly quantifiable conditions became a central tenet of the test bed.
The test methodology developed in ATIS-0500013 for indoor testing, and upon which the CSRIC test
plan was created, readily lent itself to such rigorous side-by-side testing.
The essence of the methodology is testing indoors in representative morphologies (i.e., distinct wireless
use environments). The morphologies used in Stage-1 were defined as dense urban, urban, suburban and
rural, which are the basic morphologies found throughout the United States. The San Francisco Bay area
was chosen by WG3 because it has these four morphologies and thus enabled efficient testing using one
test team, with a reasonable amount of travel within the area.
In each morphology (or broad wireless use environment) a number of buildings of different sizes and
types common in that morphology were identified. Within each building, different test points were
selected to represent the range of conditions encountered within that building. The number of test points
in a given building depended on its size and complexity. At each test point a statistically significant
number of independent test calls was placed. This logical flow-down is shown in Figure 6.1-1.

The Communications Security, Reliability and Interoperability Council III Working Group 3 “Indoor Test Report”
13
Figure 6.1-1. Morphology, Building and Test Point Flow Down
Critical to obtaining reliable, repeatable results that can be used as a benchmark is statistically reliable
samples of test calls at each test point. The consensus of the WG3 Test Plan sub-group is that a minimum
recommended sample size per technology per test point is 100 calls.
Test planning proceeded based on that requirement to arrive at the best combination of number of devices
to test simultaneously per technology, the minimum required length of the test calls, and how long it takes
to place the required calls vis-à-vis the need to complete testing in each building in no more than a day.
The details on test call placement, timing budgets and the large number of test calls placed from each
technology—which easily achieved statistical reliability—are provided in the attached Indoor Test
Report.
In all 75 points were selected as suggested in the test plan. Due to real world building availability and
access limitations in the limited time window the eventual test point distribution somewhat favored dense
urban over urban settings. As will be seen in summary results, dense urban performance observed was
actually somewhat better than urban performance (in the selected sample of buildings).
Table 6.1-1 Summary of Test Point Distribution
Accurate ground truth3, which does not introduce measurable errors in the results, is imperative in a
comparative indoor performance benchmarking effort. Consequently, TechnoCom selected a certified
land surveying vendor from the Bay Area, who was intimately familiar with the morphology and terrain.
This ensured that the highest quality and reliability was achieved in comparing the test call locations to
the actual ground truth.
The survey information provided by the vendor included latitude, longitude and height. The certified
accuracy is +/-1cm horizontal a +/-2cm vertical, which is far better accuracy than the minimum required
3-5 m accuracy. The survey method and equipment are described in the Indoor Test Report, along with
a sample survey ground truth output measurement.
3 ATIS-0500013 defines ground truth as a geographic location specified in latitude and longitude for the actual location on a map for an identified location.
Dense Urban 29
Urban 23
Suburban 19
Rural 4
Total 75
Number of
Test PointsMorphology

The Communications Security, Reliability and Interoperability Council III Working Group 3 “Indoor Test Report”
14
6.2 Performance Attributes Tested
6.2.1 Location Accuracy
The error in estimating the location of the device under test was computed by comparing each vendor’s
reported horizontal position (provided to TechnoCom) to the surveyed ground truth position of the test
location (determined through a precise land survey). Each test call (or equivalent) was assumed to be
independent from prior calls and accuracy was based on the first location delivered by the vendor after
“call initiation.” Vertical distance error was also determined for the NextNav technology. The absolute
vertical distance error has been used in these statistical computations.
6.2.2 Latency (TTFF)
The Time to First Fix (TTFF) or the time to obtain the first computed caller location was calculated by
establishing the precise time for call initiation (or an equivalent initiation event if the vendor’s test
configuration did not support the placement of an emulated emergency test call).
6.2.3 Yield
The yield of each technology was determined as the % of calls with delivered location to overall “call
attempts” at each test point. Even though 30 seconds is normally considered the maximum latency, if a
location fix is delivered after 30 seconds it was still included in successful call attempts.
6.2.4 Reported Uncertainty
The horizontal uncertainty reported by the location systems has been captured and as needed normalized
to correspond to 90% confidence. The reported uncertainty at each test point is compared to the fraction
of calls for which the resulting (empirically measured) location falls inside the uncertainty circle. The
ideal number would be 90% of the calls have an actual error that causes the reported locations to fall
inside the reported uncertainty circle.
6.2.5 Location Scatter
To provide CSRIC WG3 and the FCC with insight into the qualitative indoor performance of the various
location technologies in the different environments, to aid in discerning possible effects of specific
structural features at certain test points, and to place any common reference error distances in the proper
indoor perspective, scatter diagrams have been prepared and provided for each technology at each test
point.
6.3 Morphologies and Buildings Used
The various polygons containing the four distinct morphologies spanned the Bay Area and extended 40
miles south of San Jose. A dense urban polygon was identified in the City of San Francisco around its
financial district. Two urban polygons were selected one in San Francisco adjacent to the dense urban
polygon and one in Downtown San Jose. Those two urban settings are somewhat different with San
Francisco representing an older urban clutter and San Jose a newer clutter with wider streets and more
spaced large buildings. A large suburban polygon was selected in Silicon Valley centered around the

The Communications Security, Reliability and Interoperability Council III Working Group 3 “Indoor Test Report”
15
Santa Clara-Sunnyvale-San Jose area. The rural polygon was chosen 40 miles south of Downtown San
Jose, between Gilroy and Hollister, primarily driven by the desire to have a relatively sparse cellular site
density as seen in rural areas that are more remote or outside California.
6.3.1 Dense Urban Morphology and Buildings
The dense urban polygon used is shown in Figure 6.3-1. It consisted primarily of the financial district of
San Francisco and its immediate vicinity of high rise buildings.
Figure 6.3-1. Relative Locations of the Test Buildings Used in the Dense Urban Morphology
The dense urban buildings used for indoor testing in this stage of the test bed were:
Bldg. 1: Marriott Marquis Hotel, SF Bldg. 2: One Front Street, SF Bldg. 3: 201 Spear Street, SF Bldg. 14: The Hearst Office Building (699 Market Street), SF Bldg. 15: The Omni Hotel, SF Bldg. 16: One Embarcadero Plaza, SF

The Communications Security, Reliability and Interoperability Council III Working Group 3 “Indoor Test Report”
16
Those buildings are shown in Figure 6.3-2.

The Communications Security, Reliability and Interoperability Council III Working Group 3 “Indoor Test Report”
17
Figure 6.3-2. Dense Urban Buildings Used in Stage-1 Testing
The sample of these 6 dense urban buildings selected for testing provided an excellent representation of
building types in such a dense city environment. Distinct common building types were included. Steel
buildings with glass, concrete and masonry with glass, brick veneer (in the East Coast tradition), tall
buildings over 40 stories high, medium height buildings of around 15 stories high, and buildings
surrounded by other tall buildings on all sides and on fewer sides were all represented. More detailed
descriptions and photographs of these buildings are provided in the attached Indoor Test Report.
6.3.2 Urban Morphology and Buildings
The urban polygon in San Francisco is shown in Figure 6.3-3. It contains varied building densities and
construction types that range from larger commercial buildings (near the downtown dense urban
polygon), to older mixed-use neighborhoods with medium and smaller sized buildings (both commercial
and residential in the middle of urban clutter), as well as newer, redeveloped areas with medium height
residential and commercial buildings, city government buildings, and a large stadium. The San Francisco
urban polygon is typical of an “older urban” area with densely packed construction (regardless of building
height), somewhat narrower streets, and similar or narrower building separation than the dense urban
polygon.
The urban polygon in San Jose is representative of “newer urban” development, with a downtown typified
by tall buildings of up to 30 stories, but with somewhat wider streets and somewhat greater building
separation than in older urban or dense urban morphologies. It is depicted in Figure 6.3-4.
Figure 6.3-3. Urban Polygon in San Francisco and Relative Locations of the Test Buildings

The Communications Security, Reliability and Interoperability Council III Working Group 3 “Indoor Test Report”
18
Figure 6.3-4. Urban Polygon in San Jose
The urban buildings used for indoor testing in this stage of the test bed were:
Bldg. 4: AT&T Park (baseball stadium), SF Bldg. 5: Moscone Convention Center, SF Bldg. 17: US Federal Court of Appeals Building, SF Bldg. 18: Super 8 Motel on O’Farrell St., SF Bldg. 19: The 88 San Jose (condominium building), SJ

The Communications Security, Reliability and Interoperability Council III Working Group 3 “Indoor Test Report”
19
Those buildings are shown in Figure 6.3-5.
Figure 6.3-5. Urban Buildings Used in Stage-1 Testing
These five buildings offered a challenging environment, each in their own way. The convention center
had large areas under the surface of the street, with excellent internal cellular coverage but considerable

The Communications Security, Reliability and Interoperability Council III Working Group 3 “Indoor Test Report”
20
attenuation when viewed from the outside (e.g., by a beacon). The baseball stadium on the bay (BD4)
offered a challenging RF signal environment. The US Court of Appeals building (BD17) is a heavily
constructed masonry structure (that survived the famous 1906 earthquake) with considerable use of tile on
the inside. The motel (BD18), although not itself large or high, is sandwiched in a row of continuous side
to side five story urban buildings, with higher buildings across the street and down the corner. Finally, the
high rise in urban San Jose presented its own challenges in having considerable visibility to the whole
valley from its high floors and the presence of tall buildings within a few hundred yards. The
combination of buildings selected created a solid, challenging urban sample that represents well beyond
California.
6.3.3 Suburban Morphology and Buildings
The suburban polygon is in Silicon Valley, which includes a variety of suburban office buildings,
industrial and commercial complexes, government buildings, and a range of residential buildings,
including single and multi-family dwellings. Also included in the suburban polygon are shopping malls,
large discount retail buildings and an airport. The boundary of the suburban polygon is shown in Figure
6.3-6.
The suburban buildings used for indoor testing in this stage of the test bed were:
Bldg. 6: Westfield Valley Fair Mall, SJ Bldg. 7: Techmart Office Building, Santa Clara Bldg. 8: 861 Shirley Avenue (house), Sunnyvale Bldg. 9: City Library, Santa Clara Bldg. 10: Senior Center, Santa Clara Bldg. 11: 1405 Civic Center, Santa Clara
The suburban buildings are pictured in Figure 6.3-7. This suburban building sample contained smaller,
lighter constructed buildings common in the Southwest as well as an office building and a major mall.
The latter two larger structures could be found in virtually any part of the US. In all cases significant
relative space existed between the tested structure and its neighbors, reflecting the lower density suburban
setting.

The Communications Security, Reliability and Interoperability Council III Working Group 3 “Indoor Test Report”
21
Figure 6.3-6. Suburban Polygon and Location of Buildings Used

The Communications Security, Reliability and Interoperability Council III Working Group 3 “Indoor Test Report”
22
Figure 6.3-7. Suburban Buildings Used in Stage-1 Testing
6.3.4 Rural Morphology and Buildings
The rural polygon is located in the area between Gilroy and Hollister and is depicted in Figure 6.3-8. It is
characterized by large farming tracts, isolated residences and limited commercial development. Of
particular note is the low density of cell sites due to distances and the intervening terrain on the periphery
of the area. The low cellular site density was a key factor in the selection of this polygon, which is about
40 miles south of downtown San Jose.

The Communications Security, Reliability and Interoperability Council III Working Group 3 “Indoor Test Report”
23
Figure 6.3-8. Rural Polygon and Location of Buildings Used
The rural buildings used in this stage of the test bed were:
Bldg. 12: Gilroy Gaits, green building (riding stable with metal roof), Hollister, CA
Bldg. 13: Gilroy Gaits, beige building (riding stable with metal roof), Hollister, CA
This selection of rural buildings used (shown in Figure 6.3-9) was influenced by the paucity of available
building in the defined rural polygon (a selection that was driven by a desired lower cell site density).
The lack of public-like buildings in the area compounded the difficulty. The chosen buildings are both
large one story buildings with metal roofing, which is a common combination in rural operations. They
generally represent a more challenging environment than a rural home, whose performance would be
more similar to a suburban home, e.g., BD 8, or other smaller apartment type structure like BD10.

The Communications Security, Reliability and Interoperability Council III Working Group 3 “Indoor Test Report”
24
Figure 6.3-9. Rural Buildings Used in Stage-1 Testing
Between the 19 buildings spanning the 4 distinct morphologies a wide spectrum of building types and
settings were attained. This was complemented by a wide range of test point scenarios inside those
buildings. This created a broadly representative sample with very meaningful results, demonstrative of
indoor performance in many areas throughout the United States.
6.4 Location Technologies Tested in Stage-1
6.4.1 Technology from NextNav
The NextNav location system utilizes GPS-like signals transmitted by the NextNav beacon transmitters
deployed across a geographical area. The signals transmitted from the beacons are spread‐spectrum
signals using Gold codes at a 1.023 Mcps chipping rate, similar to GPS. The beacons transmit in the 900
MHz licensed band. The beacon broadcast transmissions carry all the necessary information for
positioning at the NextNav receiver (handset based positioning).
The devices utilized in this stage of the test bed were standalone receivers (sleeves) that received the
NextNav beacons and computed their location. A smartphone was connected to the NextNav receiver
(the sleeve) and contained the test application utilized in creating the events equivalent to an emergency
test call. The application also stored the call logs, which were forwarded to TechnoCom.
The received signal was attenuated at the output of the RF antenna by 2 dB to make it more equivalent to
the envisioned handset based implementation. The location results were aggregated over the 2 active
receivers used at each test point. Further details on the configuration used during the testing can be found
in the attached Indoor Test Report.
6.4.2 Technology from Polaris Wireless
Polaris Wireless’ technology uses RF pattern matching (RFPM), referred to at times as RF fingerprinting,
uses radio frequency pattern matching to compare mobile measurements (signal strengths, signal-to-

The Communications Security, Reliability and Interoperability Council III Working Group 3 “Indoor Test Report”
25
interference ratios, time delays, etc.) against a geo-referenced database of the mobile operator’s radio
environment
Two standard, off the shelf Nokia C7 2G/3G smartphones were tested. One of the handsets was locked to
T-Mobile 2G (GSM) and one was locked to AT&T 2G (GSM). The handsets were connected to a laptop
running the Nemo Outdoor RF monitoring software. The laptop logged the test call related RF data from
the test handsets. At the end of one or more days of testing, those handset logs were forwarded to Polaris
for processing to return the location results to TechnoCom. This offline process was required because the
Polaris position computing platforms were not integrated into the AT&T or T-Mobile networks serving
the Bay Area. (Normally the RF measurement data would be gathered by tapping into the Lb interface.)
The location results at each test point and overall were for the aggregate over the two wireless carrier
networks
Further details on the test setup and the processing are contained in the attached Indoor Test Report.
Some of the possible issues related to the offline analysis are addressed in this report under vendor
feedback.
6.4.3 Technology from Qualcomm
Qualcomm’s AGPS/AFLT location solution takes advantage of the complementary nature of the GPS
satellite constellation and the terrestrial wireless network. It creates a significant range of solutions
depending on the achievable satellite visibility and network conditions. Because these solutions combine
to work as one, it is viewed as a hybrid solution. The various position fix types are defined in the attached
Indoor test report. Qualcomm’s AGPS technology is widely deployed and in regular use. It has been
field-tested extensively for E911, albeit generally in an outdoor context.
Two test handsets were used on each of the Verizon and Sprint networks. Those were HTC EVO 4G
LTE for Sprint and HTC Droid Incredible 4G LTE for Verizon. The handsets were configured to disable
WiFi and BlueTooth connections, to remove any possibility of inadvertent information coming across
these data links or contributing to fix accuracy. Dial strings other than 9-1-1 were used and received
emergency call location treatment without being delivered to an actual PSAP. A number of subtle details
regarding the GPS setup of these handsets are discussed in the Indoor Test Report.
Calls were dialed by an application developed by TechnoCom for that purpose. The application ran on
the four Android handsets and allowed call dialing and hang up time between calls to be timer controlled
and logged. The application created the ‘handset logs’ which were collected by TechnoCom. The PDE
logs were collected by the two wireless carriers on a periodic basis and forwarded to TechnoCom. The
location results were derived by aggregating the results of all 4 test phone, i.e., across the two wireless
carrier networks.
7. SUMMARY OF RESULTS
Only brief summary results by morphology are provided here for accuracy (horizontal and vertical
distance errors), yield, TTTF and Uncertainty. Horizontal accuracy results are also summarized by
technology vendor. The detailed results of all testing are provided in the attached report entitled: “Indoor
Test Report to CSRIC III-WG3.” Those results include individual results per test point per technology
and summaries aggregated by building and by morphology. Detailed scatter plots overlaid on Google

The Communications Security, Reliability and Interoperability Council III Working Group 3 “Indoor Test Report”
26
Earth images are also provided there per technology at each test point. Those provide significant detailed
insight that is not captured in the summaries.
7.1 Yield
Yield in general varied with the difficulty of the indoor test environment. This is manifested in the yield
results in Table 7.1-1. This variation was particularly true of the location technology that was integrated
into the network (AGPS) and thereby required multiple message exchanges to carry out the location
determination process per the standard implementation. (The technology from Polaris was processed off
line and therefore this observation does not apply to it). The NextNav technology also showed some
dependence in yield on the difficulty of the environment, but to a lesser extent, since less interaction with
the infrastructure is required in the implementation tested. In all, the values of yield observed were
encouraging given the difficulty of the environments in which the test calls were made.
Table 7.1-1 Summary Test Call Yield Results
7. 2 Overall Location Accuracy Summary
A concise overall summary of location accuracy aggregated by morphology is presented in Table 7.2-1
for the three technologies under test. In the following sections, more illustrative summaries of accuracy
performance, including comparative CDFs, are provided for each morphology. To provide the reader
with added insight gained from the testing, comments are provided on the accuracy observed within each
of these morphologies (dense urban, urban, etc.). The results are also summarized for each technology
across the 4 distinct morphologies.
Table 7.2-1 Summary Horizontal Accuracy Statistics in All Environments
NextNav_BD1 350 112 32.0%
NextNav_BD2 1020 1020 100.0%
NextNav_BD3 809 809 100.0%
NextNav_BD4 692 690 99.7%
NextNav_BD5 765 612 80.0%
NextNav_BD6 825 825 100.0%
NextNav_BD7 934 934 100.0%
NextNav_BD8 395 395 100.0%
NextNav_BD9 598 598 100.0%
NextNav_BD10 423 423 100.0%
NextNav_BD11 406 406 100.0%
NextNav_BD12 443 443 100.0%
NextNav_BD13 400 377 94.3%
NextNav_BD14 998 998 100.0%
NextNav_BD15 1200 1123 93.6%
NextNav_BD16 797 797 100.0%
NextNav_BD17 972 958 98.6%
NextNav_BD18 800 800 100.0%
NextNav_BD19 1215 1178 97.0%
NextNav_All Dense Urban Buildings 5174 4859 93.9%
NextNav_All Urban Buildings 4444 4238 95.4%
NextNav_All Suburban Buildings 3581 3581 100.0%
NextNav_All Rural Buildings 843 820 97.3%
Total Number of
Test Calls
Attempted
Total
Number of
Test Calls
with Position
Fix Received
Percentage of
Test Calls
with Fix
Received
(Yield)
Number of Test Calls and Yield
Building ID

The Communications Security, Reliability and Interoperability Council III Working Group 3 “Indoor Test Report”
27
7.3 Location Accuracy by Environment
7.3.1 Dense Urban Environment
The following are the results aggregated over buildings BD1, BD2, BD3, BD14, BD15 and BD16, all in
and around downtown San Francisco.
Figure 7.3-1 Cumulative Horizontal Accuracy in the Dense Urban Environment
67th 90th 95th Standard
Percentile Percentile Percentile Deviation
NextNav_BD1 112 177.6 236.3 270.1 142.0 125.8 735.0 2.57
NextNav_BD2 1020 51.7 72.1 82.4 41.8 22.4 127.0 0.63
NextNav_BD3 809 74.0 136.2 179.5 76.6 74.3 1059.2 4.30
NextNav_BD4 690 64.0 91.2 114.4 69.1 189.7 4367.2 2.75
NextNav_BD5 612 138.8 235.1 270.0 126.9 70.3 408.0 20.17
NextNav_BD6 825 36.0 54.2 63.3 32.3 16.6 122.3 1.43
NextNav_BD7 934 36.3 58.0 65.7 29.5 19.7 91.0 0.38
NextNav_BD8 395 16.7 24.1 27.8 14.7 7.0 42.5 1.28
NextNav_BD9 598 38.7 63.8 71.5 42.9 240.5 5854.2 1.13
NextNav_BD10 423 17.4 24.5 26.3 14.8 6.9 35.6 0.48
NextNav_BD11 406 15.0 29.4 32.4 13.7 9.9 53.7 0.54
NextNav_BD12 443 26.6 38.0 41.2 21.7 11.6 56.7 1.58
NextNav_BD13 377 29.9 64.1 85.0 127.5 1815.9 35255.9 1.53
NextNav_BD14 998 42.7 96.5 114.5 41.0 34.7 186.0 0.57
NextNav_BD15 1123 65.7 177.4 318.5 77.6 92.3 665.9 0.85
NextNav_BD16 797 43.8 71.2 91.0 38.7 28.3 236.0 0.64
NextNav_BD17 958 48.1 60.5 80.3 48.5 75.5 1221.4 2.15
NextNav_BD18 800 54.3 66.5 73.0 45.6 17.7 144.0 8.02
NextNav_BD19 1178 69.7 190.6 203.0 73.1 70.6 617.2 2.81
NextNav_All Dense Urban Buildings 4859 57.1 102.4 154.0 57.5 64.9 1059.2 0.6
NextNav_All Urban Buildings 4238 62.8 141.1 196.1 69.5 99.9 4367.2 2.1
NextNav_All Suburban Buildings 3581 28.6 52.9 62.2 27.2 99.7 5854.2 0.4
NextNav_All Rural Buildings 820 28.4 44.9 60.3 70.3 1231.5 35255.9 1.5
Horizontal Error Statistics (m)
Building IDTotal Number of
Calls
Average
ErrorMax Error Min Error

The Communications Security, Reliability and Interoperability Council III Working Group 3 “Indoor Test Report”
28
Figure 7.3-2 Accuracy Percentiles in the Dense Urban Environment
The results for the dense urban buildings highlighted the challenges that satellite signals have in
penetrating to those points that are in the interior of large buildings. Consequently, AGPS fall-back
modes, such as AFLT, were experienced frequently. Accuracy degraded as expected when GPS fixes
were not attained. While a surprising proportion of hybrid fixes were experienced, even at test points
where one would not expect a satellite signal to penetrate, the quality of the hybrid fixes was in general
significantly degraded compared to GPS fixes. Hence, in many dense urban test points (and in urban
buildings as well) a significant amount of spread in location fixes was observed. This often extended over
a number of city blocks. Few very poor fixes are seen in the dense urban case, perhaps because the high
cell site densities (and consequently small cell radii) in the dense urban core create a reasonable lower
bound on fall-back accuracy.
In contrast to the challenges that GPS signals face in the dense urban setting, RF finger printing
experienced its best performance in the dense urban setting. This is probably a combination of a confined
environment that could be extensively calibrated and many RF cell sites and handoff boundaries that
could be leveraged in creating a good RF fingerprint map of the dense urban center.
The best observed performance in the dense urban setting was that of the dedicated terrestrial (beacon)
location system—a new infrastructure that will require investment. With this level of accurate location
performance it is actually possible to discern some of the vagaries caused by multipath. Oftentimes, when
the test point is floors below the roof and in an outside room with windows, the signal is forced to
propagate from the handset out (or by reciprocity in) towards or from a building that is across the street or
The Communications Security, Reliability and Interoperability Council III Working Group 3 “Indoor Test Report”
29
a few blocks away (if the space between it and the test point is open). The signal then propagates to (or
from) the location infrastructure, whether terrestrial beacons or satellites. The result is that location fixes
that may be relatively close in absolute distance (e.g., 40 m away) are often located in a building across
the street, in a neighboring building, or even across a few blocks from the test point. (See for example,
BD3_TP1, BD14_TP3 and BD15_TP4 for NextNav In the attached Indoor Test Report. This
phenomenon will also become more obvious in the urban setting.)
7.3.2 Urban Environment
The following are the results aggregated over buildings BD4, BD5, BD17, BD18 in and around
Downtown San Francisco, plus BD19 in Downtown San Jose.
As mentioned earlier, the specific test buildings used in the urban morphology were challenging, each in
their own way. This is because each building represented more distinctly a building type and setting than
the high rises of the dense urban environment.
The baseball stadium by the San Francisco Bay (BD4, AT&T Park) created a situation where AGPS
fallback fixes could be very far away due to the very exposed RF propagation outside the structure in
which the test points were located. This impacted points that were relatively deep inside the stadium
building. The structure of the stadium also appears to have created challenges to RF fingerprinting at
some test points.
Figure 7.3-3 Cumulative Horizontal Accuracy in the Urban Environment

The Communications Security, Reliability and Interoperability Council III Working Group 3 “Indoor Test Report”
30
Figure 7.3-4 Accuracy Percentiles in the Urban Environment
The convention center created in some cases an environment that was deep indoors but with very strong
cellular signal from cell sites inside the building (including a DAS). This situation was captured by two
points of different depth (BD5_TP2 and BD5_TP3). This situation resulted in the beacon-based location
system performing poorer than in most other test points, since attenuation to different directions in the
outside world was particularly strong in those scenarios. AGPS and RF fingerprinting relied on the cell
sites inside the structure to create adequate location fixes.
The US Court of Appeals Building (BD17) represented a classic older, heavy construction, but also had a
very large atrium in its middle. Results varied depending heavily on the degree of distance from windows
or the central atrium. Again, the phenomenon of apparent location in a building across the street is seen
here (e.g., BD17_TP2 for both NextNav and Qualcomm, which was a test point inside a large court room
with windows in the direction of the building across the street). As one would expect, the degradation
caused by being away from a window or atrium more significantly impacted the satellite based system
than the terrestrial beacon based one. RF fingerprinting fixes appeared to cluster about the larger
reflectors in this urban corner of San Francisco, which happened to be mostly across the streets from the
target building.
The motel building (BD18) provided a very clear example of relatively good location fixes on the basis of
absolute error distance but that are mostly in or around other buildings across the street (e.g., NextNav all
four test points in BD18 .) This phenomenon is primarily caused by the physics of the problem. This
case poignantly demonstrates the unique challenge with indoor location: absolute distances (like 50 or
150 m) which may have meant much in assessing outdoor performance mean less for the indoors, since

The Communications Security, Reliability and Interoperability Council III Working Group 3 “Indoor Test Report”
31
emergency dispatch to the wrong building or even the wrong block could be easily encountered at 50 or
150 m. A location across the street is certainly better than one a few or many blocks away but it may still
leave some human expectations unmet. RF fingerprinting for this building generates either fixes around
the immediate vicinity of the building or clustered around major reflectors in the general area or along
streets, presumably where calibration measurements were gathered.
Finally, the tall condominium building in urban downtown San Jose (BD19) demonstrated the mix of
high rise construction causing direct signal attenuation, prominent distant reflectors, plus wide area cell
site visibility. All combined to create relatively poor AGPS performance, uneven beacon system
performance, and RF fingerprinting performance that degraded with the height of the test point.
All of the above factors related to each of the urban buildings, combined with a generally lower cell site
density for fall back (than in dense urban), resulted ultimately in an aggregate urban performance that is
slightly worse than the dense urban performance. Still, this overall performance is representative of the
challenges of the big city with high structural density, whether it be San Francisco or a city in the
Northeast or the Midwest.
7.3.3 Suburban Environment
The following are the results aggregated over buildings BD6, BD7, BD8, BD9, BD10 and BD11 in Santa
Clara and Sunnyvale.
The effect of smaller buildings with lighter construction and more spacing between buildings is
immediately evident on the quality of the location fixes in the suburban environment. This is most clearly
demonstrated in the case of individual houses or small apartment buildings. Outstanding GPS
performance, almost as good as outdoors, can be achieved inside single story homes (see BD8). The
majority of the GPS fixes fall inside the small home or its small lot. Almost as good a performance is
achieved inside the upper floor of relatively small buildings with composite or tile roof material (see
BD10_PT1, BD11_PT1). CDF’s that are tightly packed at small error values (well below 50 m) signify
this type of outstanding performance. Similarly outstanding performance is achieved on average by the
beacon based location technology under similar circumstances. RF fingerprinting appears to suffer from
performance degradation compared to more dense morphologies in the city. It is able to identify only the
part of the neighborhood where the test calls originated, with spreads over a few to several blocks, and
fixes that are frequently clustered or spread along roads where calibration was performed (e.g., BD8,
BD9, BD10).

The Communications Security, Reliability and Interoperability Council III Working Group 3 “Indoor Test Report”
32
Figure 7.3-5 Cumulative Horizontal Accuracy in the Suburban Environment
Figure 7.3-6 Accuracy Percentiles in the Suburban Environment

The Communications Security, Reliability and Interoperability Council III Working Group 3 “Indoor Test Report”
33
The AGPS performance predictably changes as the suburban buildings become bigger and higher. Test
points that are not on the top floor have significantly more positioning error and spread about them as fall-
back modes are more frequently the solution. The terrestrial beacon-based network continues to perform
well in the larger suburban buildings (e.g., BD6, BD7). The phenomenon of positioning at the nearest
building is only occasionally seen (basically when the propagation physics force it to happen, which is not
common in the suburban environment). One example where this is seen is the parking structure
(BD7_PT5) where the location signals are forced to tunnel through the garage entrance and bounce off the
side of the adjacent building. Curiously, GPS appears to perform well in this specific scenario, perhaps
because the parking structure had only 2 floors. RF finger printing shows some enhancement relative to
the smaller suburban buildings, but still shows most of the location fixes along the roads, highways or
reflecting buildings.
7.3.4 Rural Environment
The following are the results aggregated over buildings BD12 and BD13 in the rural area north of
Hollister, CA.
Figure 7.3-7 Cumulative Horizontal Accuracy in the Rural Environment

The Communications Security, Reliability and Interoperability Council III Working Group 3 “Indoor Test Report”
34
Figure 7.3-8 Accuracy Percentiles in the Rural Environment
As mentioned earlier, the buildings chosen for the rural environment where limited by what was
accessible in the available time. Both buildings selected were large one story structures with metal roofs.
Performance of AGPS reflected the effect of the metal roof and some metal siding in limiting the
available number of satellite signals available for trilateration at certain test points. In these cases more
hybrid fixes were experienced with a concomitant increase in the spread of the location fixes about the
true location (e.g., BD13_TP2 and to a lesser extent BD12_TP1). In easier rural scenarios where metallic
surfaces or multiple floors are not present, e.g., in a rural house, the expected performance would be very
good similar to that seen in a suburban home, like BD8, or a small structure like BD11.
The performance of the beacon based network was less impacted by the metallic roof (since that roof had
more impact on sky visibility rather than on side visibility towards terrestrial beacons). Consequently the
performance was somewhat better than for AGPS. The performance of the beacon based network would
of course depend on the density of its deployed beacons covering the rural area, which was sufficient in
the case of the rural test polygon.
RF finger printing showed reduced performance relative to the suburban environment due to the large
spacing between surveyed roads (where calibration is done) and the rural structures as well as the lower
density of cell sites. The location fixes are spread along relatively long stretches of the rural roads.
7.4 Location Accuracy Summary by Technology
The following charts provide a quick view summary of the horizontal accuracy percentiles for each
technology across the four morphologies.

The Communications Security, Reliability and Interoperability Council III Working Group 3 “Indoor Test Report”
35
Figure 7.4-1. Indoor Accuracy by Morphology for NextNav

The Communications Security, Reliability and Interoperability Council III Working Group 3 “Indoor Test Report”
36
Figure 7.4-2. Indoor Accuracy by Morphology for Polaris
Figure 7.4-3. Indoor Accuracy by Morphology for Qualcomm
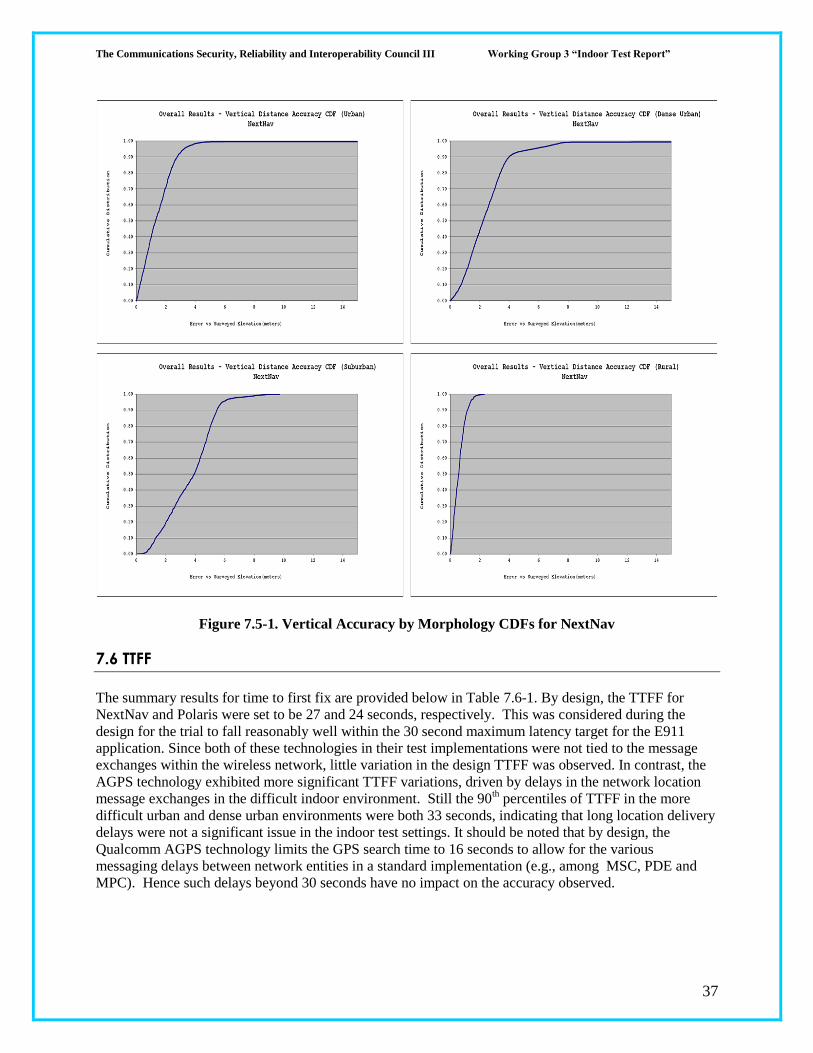
7.5 Vertical Error
Altitude results were only provided by the NextNav technology. The statistics of the vertical distance
error are as follows. In this statistical computation the absolute value of the altitude error of each test call
is used. More detailed vertical error results are provided in the Indoor Test Report. The nature of vertical
accuracy and its variation with environment is captured in the four CDFs shown in Figure 7.5-1. The
vertical accuracy appears not to be tightly correlated with the density of the test environment.
Table 7.5-1. Summary Vertical Error by Morphology
67th 90th 95th Standard
Percentile Percentile Percentile Deviation
NextNav_BD1 112 4.3 22.3 22.4 7.1 8.7 23.1 0.04
NextNav_BD2 1020 3.4 5.1 5.9 2.7 1.6 8.2 0.01
NextNav_BD3 809 3.6 6.9 7.3 3.3 6.4 173.6 0.01
NextNav_BD4 690 1.7 3.4 3.8 5.0 23.0 193.5 0.02
NextNav_BD5 612 2.8 3.5 4.0 2.2 1.1 5.3 0.03
NextNav_BD6 825 2.4 2.8 3.0 1.9 0.8 3.6 0.06
NextNav_BD7 934 4.3 5.0 5.2 3.7 1.1 7.4 0.62
NextNav_BD8 395 4.5 5.2 5.4 3.1 1.7 6.0 0.39
NextNav_BD9 598 5.2 7.3 8.1 4.7 1.8 9.7 0.28
NextNav_BD10 423 5.2 5.7 5.8 5.0 0.5 6.7 3.20
NextNav_BD11 406 5.2 5.7 6.0 4.8 0.7 6.7 2.83
NextNav_BD12 443 0.7 1.2 1.5 0.6 0.4 2.3 0.01
NextNav_BD13 377 0.8 1.0 1.2 0.6 0.4 1.6 0.01
NextNav_BD14 998 2.6 3.2 3.4 2.4 0.7 6.5 0.03
NextNav_BD15 1123 1.6 2.9 3.2 1.5 0.9 5.1 0.03
NextNav_BD16 797 3.0 3.8 4.2 2.5 1.1 6.5 0.04
NextNav_BD17 958 1.3 2.0 2.2 1.0 0.7 4.0 0.02
NextNav_BD18 800 2.3 2.7 2.9 2.0 0.6 3.8 0.10
NextNav_BD19 1178 1.1 1.9 2.2 0.9 0.7 4.6 0.01
NextNav_All Dense Urban Buildings 4859 2.9 4.0 5.6 2.5 3.2 173.6 0.0
NextNav_All Urban Buildings 4238 1.9 2.8 3.2 2.0 9.4 193.5 0.0
NextNav_All Suburban Buildings 3581 4.6 5.5 5.8 3.6 1.6 9.7 0.1
NextNav_All Rural Buildings 820 0.7 1.1 1.4 0.6 0.4 2.3 0.0
Vertical Distance Error Statistics(m)
Building IDTotal Number
of Calls
Average
Distance ErrorMax Error Min Error
The Communications Security, Reliability and Interoperability Council III Working Group 3 “Indoor Test Report”
37
Figure 7.5-1. Vertical Accuracy by Morphology CDFs for NextNav
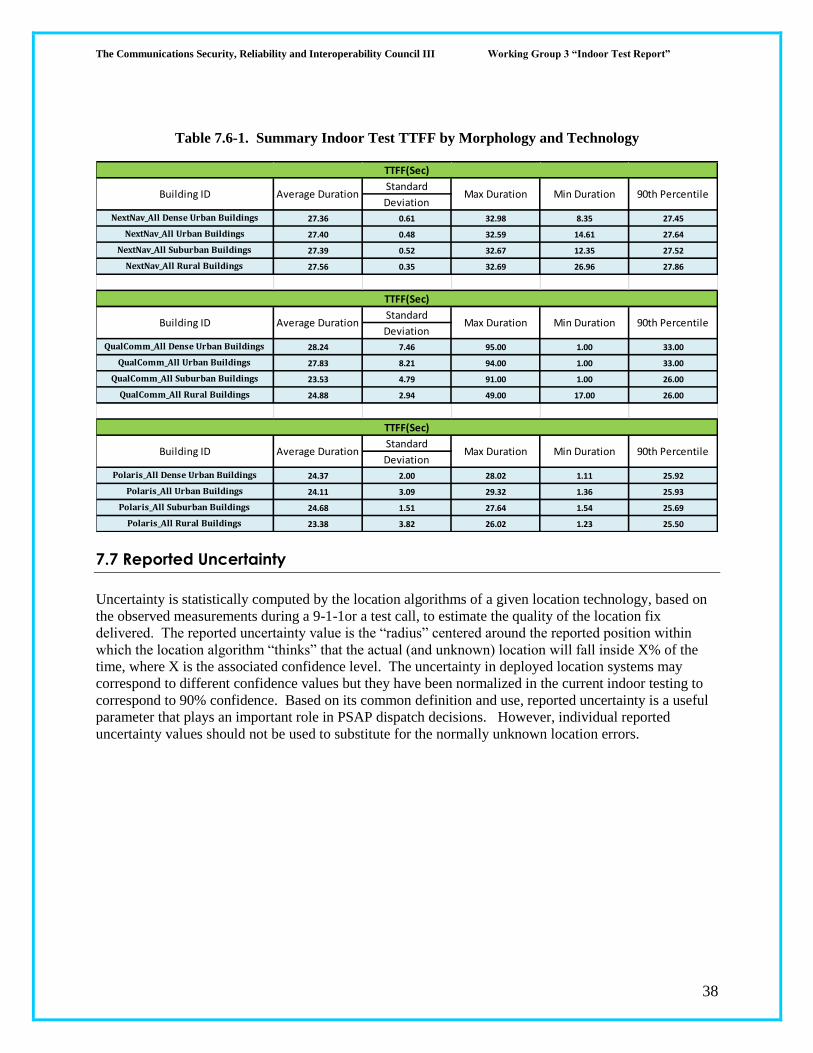
7.6 TTFF
The summary results for time to first fix are provided below in Table 7.6-1. By design, the TTFF for
NextNav and Polaris were set to be 27 and 24 seconds, respectively. This was considered during the
design for the trial to fall reasonably well within the 30 second maximum latency target for the E911
application. Since both of these technologies in their test implementations were not tied to the message
exchanges within the wireless network, little variation in the design TTFF was observed. In contrast, the
AGPS technology exhibited more significant TTFF variations, driven by delays in the network location
message exchanges in the difficult indoor environment. Still the 90th percentiles of TTFF in the more
difficult urban and dense urban environments were both 33 seconds, indicating that long location delivery
delays were not a significant issue in the indoor test settings. It should be noted that by design, the
Qualcomm AGPS technology limits the GPS search time to 16 seconds to allow for the various
messaging delays between network entities in a standard implementation (e.g., among MSC, PDE and
MPC). Hence such delays beyond 30 seconds have no impact on the accuracy observed.
The Communications Security, Reliability and Interoperability Council III Working Group 3 “Indoor Test Report”
38
Table 7.6-1. Summary Indoor Test TTFF by Morphology and Technology
7.7 Reported Uncertainty
Uncertainty is statistically computed by the location algorithms of a given location technology, based on
the observed measurements during a 9-1-1or a test call, to estimate the quality of the location fix
delivered. The reported uncertainty value is the “radius” centered around the reported position within
which the location algorithm “thinks” that the actual (and unknown) location will fall inside X% of the
time, where X is the associated confidence level. The uncertainty in deployed location systems may
correspond to different confidence values but they have been normalized in the current indoor testing to
correspond to 90% confidence. Based on its common definition and use, reported uncertainty is a useful
parameter that plays an important role in PSAP dispatch decisions. However, individual reported
uncertainty values should not be used to substitute for the normally unknown location errors.
Standard
Deviation
NextNav_All Dense Urban Buildings 27.36 0.61 32.98 8.35 27.45
NextNav_All Urban Buildings 27.40 0.48 32.59 14.61 27.64
NextNav_All Suburban Buildings 27.39 0.52 32.67 12.35 27.52
NextNav_All Rural Buildings 27.56 0.35 32.69 26.96 27.86
Standard
Deviation
QualComm_All Dense Urban Buildings 28.24 7.46 95.00 1.00 33.00
QualComm_All Urban Buildings 27.83 8.21 94.00 1.00 33.00
QualComm_All Suburban Buildings 23.53 4.79 91.00 1.00 26.00
QualComm_All Rural Buildings 24.88 2.94 49.00 17.00 26.00
Standard
Deviation
Polaris_All Dense Urban Buildings 24.37 2.00 28.02 1.11 25.92
Polaris_All Urban Buildings 24.11 3.09 29.32 1.36 25.93
Polaris_All Suburban Buildings 24.68 1.51 27.64 1.54 25.69
Polaris_All Rural Buildings 23.38 3.82 26.02 1.23 25.50
TTFF(Sec)
Building ID Average Duration Max Duration Min Duration 90th Percentile
TTFF(Sec)
Building ID Average Duration Max Duration Min Duration 90th Percentile
TTFF(Sec)
Building ID Average Duration Max Duration Min Duration 90th Percentile

The Communications Security, Reliability and Interoperability Council III Working Group 3 “Indoor Test Report”
39
Table 7.7-1. Summary Reported Uncertainty per Technology per Morphology
In the context of indoor location testing, reported uncertainty results provide an indication of how useful
that parameter would be when the call is placed indoors. Additionally, in the context of location system
testing in general (not only indoors) the results provide an indication of how well a location system under
test is performing in a certain environment. Lower accuracy is often (but not always) associated with
larger statistical deviation from the 90% target for the reported uncertainty values.
The measured uncertainty performance relative to the desired confidence level was reasonably well
behaved for two of the three technologies under test. The third technology (RF Fingerprinting)
experienced a lower level of reported uncertainty reliability.
7.8 Vendor feedback on testing
7.8.1 NextNav NextNav feels that its technology performed generally in line with expectations, considering the
intentionally rigorous nature of the testing performed and the very dense concentration of buildings in the
Urban Polygons. Overall yield across all morphologies was 96%, and overall TTFF at the 90th percentile
was 27 seconds. Horizontal location accuracy across all morphologies for the median , 67th and
90th percentiles were 36m, 51m and 94m respectively. NextNav vertical performance was also tested
across all morphologies, and vertical location accuracy for the median, 67th and 90th percentiles was 2m,
2.9m and 4.8m respectively (compared to an average floor height separation of 3 meters). Across the 74
total test points inside 19 buildings, about a third of the fixes fell inside the target building, and the
Number of
calls with
Error <
Uncertainty
NextNav_BD1 112 47 41.96%
NextNav_BD2 1020 965 94.61%
NextNav_BD3 809 758 93.70%
NextNav_BD4 690 664 96.23%
NextNav_BD5 612 420 68.63%
NextNav_BD6 825 784 95.03%
NextNav_BD7 934 909 97.32%
NextNav_BD8 395 395 100.00%
NextNav_BD9 598 544 90.97%
NextNav_BD10 423 423 100.00%
NextNav_BD11 406 405 99.75%
NextNav_BD12 443 427 96.39%
NextNav_BD13 377 351 93.10%
NextNav_BD14 998 943 94.49%
NextNav_BD15 1123 1037 92.34%
NextNav_BD16 797 786 98.62%
NextNav_BD17 958 865 90.29%
NextNav_BD18 800 729 91.13%
NextNav_BD19 1178 1010 85.74%
NextNav_All Dense Urban Buildings 4859 4536 93.35%
NextNav_All Urban Buildings 4238 3688 87.02%
NextNav_All Suburban Buildings 3581 3460 96.62%
NextNav_All Rural Buildings 820 778 94.88%
Uncertainty
Building ID Total Test Calls
Percentage of
calls Error <
Uncertainty
The Communications Security, Reliability and Interoperability Council III Working Group 3 “Indoor Test Report”
40
majority of all fixes fell inside of 40 meters. NextNav expects that its next generation system, which was
not available for testing in the testbed, will improve upon these results.
7.8.2 Polaris Wireless The performance for RFPM in the test-bed was not completely consistent with the design parameters for
this technology. In reviewing the data from the test, a few specific issues were identified.
The Polaris Wireless implementation of RFPM technology is based on comparing the RSSI values
reported by the handset with off-line predictions of the signal strengths that should be observed in various
locations and on using these predicted signal strengths to anticipate where these signals should be
decoded by the handset. The representation of the signal environment that is used in our deployed
location systems allows only one predicted value per cell per location, but in reality, the signal
environment in the upper floors of a high rise building is significantly different from that on the lower
floors because of the difference in obstructions to the signal paths. Polaris Wireless is currently working
on a multiple signature representation that will overcome these limitations, but it was not deemed
appropriate for these trials because it did not represent our currently deployed technology. Before the
trial started, we anticipated that our performance would suffer on upper floors, and that indeed proved to
be the case. The impact of the challenge noted above can be seen in the table below, which compares the
summary test results for Dense Urban with a summary that omits the results for upper floor test points
(exact test points omitted are identified in the third column of the table):
Area Buildings TP excluded e67 (m) e90 (m) e95 (m) <100m <300m Calls
Dense
Urban All
1 2 3 14 15
16
117 400 569 60.3% 86.3% 5372
Dense
Urban w/o
upper floor
1 2 3 14 15
16
0103
0302
1404
1601 1602 89 187 276 71.3% 96.4% 4433
In addition to the upper floor challenge. Two of the buildings included DAS (distributed antenna system)
cells. DAS environments generally represent a very good environment for RFPM. However, due to the
very tight time schedule of this testing, we were unable to work with the carriers to create detailed
models for these cells. We believe that with proper models for DAS, our performance for calls
involving these cells would have been much better and a truer reflection of the performance we would
achieve in an actual deployment.
Finally, the tight timelines of the trial did not allow us to use a network connection, such as would be the
case in an actual deployment. Instead, we used data recorded from the handset to do off-line location
estimates. For the serving cell, a GSM handset reports the signal strength of the downlink traffic
channel. Because the down link power is time-varying, the received traffic channel power cannot be used
to estimate position without knowing the instantaneous down link power, a quantity known to the
network but not to the handset. A connection to the live network would have provided us this information
and resulted in an additional (and strong) RSSI measurement (and improved performance).

The Communications Security, Reliability and Interoperability Council III Working Group 3 “Indoor Test Report”
41
7.8.3 Qualcomm
Qualcomm believes that the report fairly reflects the deployed system accuracy, and TTFF. Yield
degradation appears to be mostly caused by real-world RF issues rather than issues in the phase 2 location
calculation system in that a fraction of the calls across morphologies did not reach the location system at
all, but were included in yield calculation. Yield varied by morphology; 85% in dense urban to 99% in
rural, corresponding to RF issues in the deployed networks.
TTFF at the 90% level ranged from 26 to 33 seconds; again with the more difficult urban and dense urban
having the longer fix times due to network timer issues. Accuracy 67th
/90Th
percentile ranged from 48.5
m/210.1m (rural) to 226.8 m/449.3 m (urban).
Qualcomm provides a hybrid solution combining the strength of ubiquitous nationwide coverage from
GPS satellites, combined with ranging to terrestrial cell towers at indoor locations where GPS is blocked.
This can be seen in the staircase shape of the CDF graphs in the attached report (e.g. BD3_TP3 & TP4),
where each technology contributes to the combined solution. Accuracy is driven by the strength of the
observed signals and the geometric diversity of the transmitters. GPS provides the most accurate
positioning. For example, Qualcomm_BD13_TP1 had 90.5 % GPS with a 33.5 m / 67th
percentile. AFLT (Advance Forward Link Trilateration) uses ranging to multiple cell towers. For
example, Qualcomm_BD2_TP3 had 75.0 % AFLT with a 111.5 m / 67th percentile. Mixed Cell Sector is
a geometry based overlapping of cell sectors calculation. For example, Qualcomm_BD5_TP2 had 89.0 %
MCS with 163.3 m / 67th percentile.
Future improvements to 3G AFLT accuracy are expected when 4G LTE/OTDOA is deployed. OTDOA
has been designed with a specific PRS ranging signal to have better than AFLT performance. Wide
spread commercial deployments of OTDOA capable LTE networks and OTDOA support on newer model
handsets will allow testing and validation of indoor accuracy in the next CSRIC test bed.
8. HANDSET RAMIFICATIONS
In the ideal scenario, commercially available UE devices should be used to exercise the candidate indoor
location technology, in the process of making a 9-1-1 call. The carriers have implemented 9-1-1 test
emulation procedures using unique dial strings, which exercise the location technology and call/data
flow, without actually placing a live call to a PSAP. During Phase I field testing of the AGPS technology,
test calls on the Verizon and Sprint networks used unique emulation strings to start emergency call flows
between the PDE and the handset in each respective network.
The ability to use commercially available UE devices depends on the maturity of the candidate indoor
location technology. For the Phase I test bed, off-the-shelf UE devices were used on two of the
technologies, with no firmware updates or parameter reconfigurations required. These were Qualcomm
hybrid GPS-AFLT and Polaris Wireless RFPM, which are already in use for E911. For NextNav, which
requires a specific 900 MHz ISM band receiver configured to decode NextNav beacons, a commercially
available UE with this receiver integrated was not available at the time of the testing.

The Communications Security, Reliability and Interoperability Council III Working Group 3 “Indoor Test Report”
42
8.1 NextNav
NextNav utilized a “sleeve” based receiver during the field testing attached to a standard Mobile Handset
via a USB interface. A standard Android based application logged the location computed, stored it on the
device’s SD card and emailed it to the 3rd party testing house.
The “sleeve” is similar to a handset implementation, with a primary difference being the use of an FPGA
for a receiver. The FPGA is similar to a GPS chip in its computational power but consumes more power
than a standard GPS chip and is programmable. The NextNav capability is currently being implemented
in a commercial GPS chip which is expected to have comparable performance with reduced power
consumption (i.e., equal to or better power characteristics than standard GPS chips). Other RF
components, such as SAW filters, LNA’s and the MEMS pressure sensor used for vertical computation
were similar to those available for use in a commercial handset implementation. A commercial grade
patch antenna was included. Based on the Work Group’s recommendation to further model a
“commercial” handset implementation, the antenna’s gain was reduced by an additional 2 dB.
8.2 Polaris Wireless
Polaris Wireless: the following off-the-shelf UE devices were used on the (AT&T//T-Mobile) GSM
network(s): Nokia Model C7 (see Section 6.4.2).
8.3 Qualcomm
Qualcomm purchased 2 commercial handsets from a Verizon and Sprint store. Qualcomm did no custom
software upgrades or special calibration to improve accuracy before sending the handsets to the test
vendor.
a. Sprint: HTC EVO 4G LTE
b. Verizon: HTC Droid Incredible 4G LTE
Commercial builds for MS-Assisted TIA/EIA IS-801-1 call flows implement “cold start” where no prior
fix data is used in the calculation. This assured independent fixes, even though the same handset was
used repeatedly at the same location.
An Android application running on the handset was used to dial the carrier specific 9-1-1 emulation string
and record the start time of the call. Each call lasted 30 seconds. The application waited the required 60
seconds before dialing the next call. The off time was required so the network would treat each call as an
independent call, rather than a continuation of an interrupted call. At the end of each test site, the log file
was emailed directly to the test vendor.

The Communications Security, Reliability and Interoperability Council III Working Group 3 “Indoor Test Report”
43
9. NETWORK RAMIFICATIONS
9.1 POLARIS WIRELESS
For the purposes of testing, the RFPM system was not actively connected to the carrier networks. In a
production implementation of RFPM, a standard messaging interface (Lb for 2G, Iupc for 3G, Sls for 4G)
will be provisioned into the carrier network to pass the measurement information that is used to perform
the location calculation (both from the handset and the network). Beyond the provisioning of this standard
messaging circuit, there are no network or handset modifications necessary for RFPM and the technology
has no impact on normal network or handset operations.
The fact that no network connections were used for the purpose of the CSRIC test bed meant that log files
needed to be manually correlated. In a production implementation, all location aspects of RFPM are fully
automated.
9.2 NextNav
NextNav typically runs similar to “autonomous” mode of GPS and does not require assistance
information. Therefore, as a standalone technology; NextNav has minimal carrier network impact. For
an A-GPS/NextNav hybridized solution involving a location server or PDE, there would be SW changes
required for the server.
9.3 Qualcomm
Qualcomm used the commercially deployed network elements serving daily 9-1-1 calls on both carriers
networks, thus there were no network modifications necessary for this test.
In an attempt to simplify the test process and use only one handset per wireless network, a faster call rate
of 25 second On and 20 second- Off was attempted. This caused duplicate sessions to be created due to
the high availability, high reliability commercial deployment. When the session time was extended to
standard 30 second On time and 60 second Off time between calls, the other carrier started a 2nd session
that did not have time to fully complete. These extra calls and duplicate sessions were identified and
removed by custom log analysis software written by TechnoCom.
Call length variation had no effect on the test results, since GPS searching time was limited to 16 seconds
by a PDE setting. For the record, one site BD1_TP1 was done with a 40 second On time, all others were
done with either 25 second or 30 second On time, with data combined from four handsets across the two
wireless networks of Verizon and Sprint.
Further details can be found in the attached Indoor Test Report in Section 4.6.

The Communications Security, Reliability and Interoperability Council III Working Group 3 “Indoor Test Report”
44
10. STANDARDS MODIFICATIONS
10.1 Polaris Wireless
RFPM uses standard 3GPP messaging and interfaces. The technology has been fully standardized in 2G
and 3G and there are no standards modifications required to support RFPM on these air interfaces. The
basic messaging and interfaces for RFPM have been completely standardized in 4G as well. The
technology will currently operate in 4G, although further enhancements are being worked through 3GPP
to better leverage the data capability of this advanced network interface.
10.2 NextNav
The NextNav system has been designed to minimize the impact on the GPS ecosystem including the core
network infrastructure in a wireless communications system. This is possible because the NextNav
system is similar to a terrestrial positioning constellation, which like other positioning constellations
enables the system to compute the location on the device. The system operates similar to ‘Autonomous’
modes of positioning operation and can support both MS-Based and MS-Assisted position fixes similar to
GPS. Details of the standards ramifications are captured in the LBS report 3 (section 5.3.1)
10.3 Qualcomm
The deployed solution is fully standards compliant.
11. COST, AVAILABILITY, RELIABILITY, AND TIMING
11.1 Polaris Wireless
Polaris Wireless’ form of RF Pattern Matching, known as Wireless Location Signatures (WLS) was first
deployed in North America in 2003. The technology has been deployed in 24 networks domestically; as
well as with 6 managed service partners, and in 15 international deployments for a variety of public
safety, national security and commercial LBS applications. Owing to the lack of UE and cell site
requirements, implementation timelines for network deployment are very short. Yield for this technology
is 100%. Finally, the system can be deployed with redundancy, resulting in high availability.
RF Pattern Matching leverages data which is native to the cellular network. As a result of no changes
required to cell sites, and handsets, this technology has low cost while delivering high network
technology accuracy performance.

The Communications Security, Reliability and Interoperability Council III Working Group 3 “Indoor Test Report”
45
11.2 NextNav
The NextNav network is a shared, dedicated, overlay location network that is managed by NextNav and
will be offered as a service to wireless operators, public safety personnel and others across a metropolitan
area. NextNav owns and operates each element of the network including the spectrum (93% pop coverage
in the country) on which the signal is radiated, the beacons themselves are fully redundant at each site,
and at any given point in its footprint typically more than the minimum number of beacons are visible
ensuring multiple levels of reliability of the network suitable for a E911 type of service. The performance
of the system is optimized for location – including deployment of the network to ensure good geometry
between beacons, knowing and characterizing cable and hardware delays, accurately locating each tower
location to a high degree of precision. The shared infrastructure approach, like GPS, helps ensure the cost
of the service is competitive. Similar to GPS, the overlay network also allows the evolution of location
technology independent of cellular technologies that receive the service
NextNav has largely completed its commercial deployment in the San Francisco Bay area where the tests
were conducted, and has an initial network deployment in the top 40 metropolitan areas (E911 grade
indoor location capability, however will require additional beacon deployments over the next 18-24
months).
11.3 Qualcomm
The Qualcomm solution was first introduced in the market in 2001 with a cost effective GPS receiver in
the handset, a PDE in the network and leveraging the existing CDMA infrastructure for ranging
measurements. It has been continuously supported with regular system upgrades for enhanced
performance. It has been deployed for both E-9-1-1 applications as well as commercial LBS services.
12. LESSONS LEARNED
As the CSRIC WG3 committee began to draft its final report on Indoor accuracy, the group discussed its
desire to see the test bed capability developed and implemented under this CSRIC survive beyond the
current charter. WG3 members and leadership believe that this framework could be instrumental in
evaluating the capability of future technologies for use in 9-1-1.
To ensure that any group or entity who might follow WG3 in this pursuit be in a position to minimize the
learning curve necessary in its effort, it was decided to include this section in the report. In particular,
WG3 wanted to share information on those factors that it believes allowed it to accomplish the Stage I test
bed work within the timeframe and constraints of the current CSRIC charter. Moreover, WG3 wanted to
highlight some of those challenges it faced, that with perfect hindsight, could have been avoided if it were
to tackle this work again.

The Communications Security, Reliability and Interoperability Council III Working Group 3 “Indoor Test Report”
46
12.1 Key Factors to Success of the Current CSRIC WG3 Effort
12.1.1 Commitment to the Effort and the Team:
The CSRIC WG3 team is made up of volunteers from industry and government 9-1-1 stakeholder
organizations. Consequently, the work undertaken by its members has usually been in direct competition
with most members’ regular daily tasks and the effort of producing the three deliverables required of this
charter were significant.
One of the key factors that allowed WG3 to accomplish all its objectives is the commitment of the
individual members and their companies to provide work product of the highest possible quality given the
time constraints imposed by the charter. In most cases, this meant that members of the team had to
commit a considerable amount of their personal time to achieve getting the work out the door. This level
of commitment to the effort is extraordinary and was a key determinant in WG3’s success.
12.1.2 Alignment on Goals:
In any sort of a consensus based industry activity, having agreement and alignment on what it is the group
is trying to achieve is critical to success and needs to be well established up front; WG3 did the up-front
work and then regularly revisited the common goals when it was felt that progress might be drifting off
course.
12.1.3 Willingness to Accept Risk:
Since the CSRIC charter is a voluntary effort, the Work Groups under the charter do not constitute legal
entities. In order to contract for test bed services, exchange and manage the proprietary information of
the test bed participants and provide a mechanism to fund the test bed effort, most of the companies who
participated in this effort needed to be willing to accept some degree of legal risk in order to get the work
done in the timeframe allotted. In many cases this took the form of bypassing or substantially modifying
member organization internal legal and procurement processes designed to manage liability, risk and cost
of services. Even without the time constraints, companies who participated had to be willing to take on
some degree of additional risk for the good of the effort.
12.1.4 Highly Controlled process for Exchange of Proprietary Information:
The willingness of companies to participate in test bed efforts was predicated on the ability to protect
their intellectual property. In order to manage this obligation, WG3 required that the exchange of
proprietary information only occur between the independent test house and owners of that information
under NDA. Companies interested in sharing proprietary information outside of this approved
mechanism, were encouraged to handle that by mutual agreement outside of the CSRIC process. All
WG3 interactions as a team were performed in a manner that ensured that the number of people who
needed to see proprietary information was limited to the minimum possible, as it was felt this would be
critical to attracting companies to the test bed process.

The Communications Security, Reliability and Interoperability Council III Working Group 3 “Indoor Test Report”
47
12.1.5 Viable Means of Procuring Test bed Services:
As mentioned earlier in this section, WG3 is not a legal entity and has no mechanism available to it to
contract for and procure the services of the test bed company. The group discussed a number of ways to
tackle this particular challenge and ultimately decided that only the least complicated approach would be
viable. Consequently, WG3 required that companies actively participating in the testing efforts contract
directly with the test bed company for testing services.
12.1.6 Achieving Test-house Independence:
For the output of this process to be useful to the FCC and the industry as a whole, it was critical that the
means used to evaluate technology performance be credible and the results beyond reproach. The way in
which the test house was supported and managed was a key determinant in achieving that credibility. In
order to achieve those objectives the following tasks were performed by WG3:
Developed a repeatable testing framework and methodology that can be expected to deliver
credible results and which provides the degree of transparency necessary.
Developed a contract template and required its statement of work be used between each of the test
bed participants and the test house.
Developed a scope of services agreement to ensure the test house conducts the work in a manner
consistent with our goals and that clearly establishes test-house deliverables.
Included the scope of work and the testing methodology information as attachments to the
contract documents.
Conducted an RFP process and selected a test house known to the industry and considered
capable of accomplishing the effort within the prescribed timeframe and with the degree of
technical expertise necessary.
Ensured that the test-house be the only party authorized to contribute to the Test-house
deliverable. The WG provided commentary on the test house report describing its interpretation
of the results and how they were being presented, but in no case was the test-house instructed to
modify the underlying data or the results.
Set up a technical oversight subgroup within the WG that did not include any members of the
technology companies to provide direction to the test house and answer any questions that might
come up during execution of the testing.
12.1.7 Establishment of a Workable Funding Mechanism:
The funding mechanism used by WG3 relied on voluntary financial contributions from a combination of
participating technology and carrier companies. Since it was hoped that as many existing technologies as
possible be evaluated during the Stage-1 effort, it was felt that the most cost efficient way to accomplish
this would be to do it all as part of one substantial initial effort. WG3 was successful in obtaining
sufficient funding from participating companies to complete the Stage-1 testing but, in reality, the group
was well into the implementation of the total effort before it was established that funding the test bed on a
voluntary basis would be possible. To simplify the logistics of this funding approach, the group required
that each company contributing to the effort issue funds directly to the test bed company. This shared
voluntary funding mechanism may not work for future efforts and establishing and obtaining commitment
for funding early on in future efforts will be critical to achieving similar results.
The Communications Security, Reliability and Interoperability Council III Working Group 3 “Indoor Test Report”
48
12.1.8 Establishment of an Oversight Function:
The technical complexity of the 9-1-1 ecosystem makes interpretation of performance information a
challenging exercise. The test house concept was developed to ensure that the empirical data necessary to
compare technology capabilities was produced under the most controlled and scientific circumstances.
However the impact of new technologies on all of the stakeholders in the 9-1-1 ecosystem is also subject
to a number of factors that cannot be found in the raw data; the cost, time and complexity of deploying
technology being only a few examples.
WG3 oversight was necessary not only to sponsor the activity and handle the logistics of getting the work
done but to ensuring that the whole story of the impact of technology on 9-1-1 gets told. For WG3, doing
so in a manner that made sure everyone’s voice got heard was a function of the makeup of its team as
discussed under the next paragraph.
12.1.9 Balance of Stakeholder Interests:
The current CSRIC WG3 benefited from the active participation of a diverse group of 9-1-1 stakeholders.
The makeup of the group represented a good balance between technology companies that offer 9-1-1
products and services, carrier companies licensed by the FCC and on whom 9-1-1 obligations fall and
PSAP organizations who must ultimately partner with carriers to make the solutions work in practice.
The level of 9-1-1 technical expertise and depth of experience within the group has been significant. In
this environment, it was very difficult for marketing hype to survive. Even so, the group agreed to some
of the following concepts to guide its interactions:
Contributions laden with marketing hype are not helpful and should not be submitted or included
in WG reports.
Representations of performance that are included in final deliverables to the FCC should be based
only on verifiable data with the possible exception of gross order of magnitude data-points that
help to convey an important point or concept.
Healthy debate is not only useful but necessary to achieving consensus
Egos should be checked at the door - an environment of mutual respect is important.
Conducting future test bed work without benefit of a well-balanced oversight committee or group may
result in only part of the story being told. Participation from all key stakeholders in the 9-1-1 ecosystem
brought together as a group with a common set of goals and objectives will be one of the keys to success
in future efforts.
12.2 Challenges to Overcome and Process Recommendations
The lessons summarized in this section have been gained directly from going through the steps required to
setup the test bed, incorporate location technologies to be tested, and actually going through the
challenging process of identifying the test buildings per the test plan, and performing the indoor testing.

The Communications Security, Reliability and Interoperability Council III Working Group 3 “Indoor Test Report”
49
12.2.1 Project Setup and Contractual Challenges:
Prior to issuance of an RFP for test house selection, agreement on the scope of the testing needs to take
place. This relates to both the scale of the testing (e.g., number of buildings) and the number and types of
location technologies to be tested. An estimate has to be prepared that details the costs involved in the
preparation, execution, analysis and reporting of the test bed results. A determination of funding sources
and amounts is critical and could impact the level of participation in the test bed effort. In addition, the
scope of the test bed effort may need to be scaled to fit within the available budget.
Even if, as in the case of the current Stage-1 testing, a common legal agreement framework is developed,
significant bilateral legal and contractual negotiations and agreements have to take place among the test
bed participants and with the test house. These would cover issues like non-disclosure, data sharing,
deliverable timing, and payment terms. For example, once the test bed is ready for location vendor
testing, a test management resource (e.g., an independent legal entity with contractual authority) and the
test house must identify the detailed entrance criteria for each potential test participant. For location
vendors meeting the entrance criteria, the test equipment, database preparation, and underlying network
requirements must be detailed in a test agreement between the test house and each location vendor.
Depending on the scope and size of the location vendors, other participant organizations, and possible
complicating factors (e.g. partnership structures,) the length of time to complete these agreements and
delivery of the test bed participation fee (if any), could vary from two to several months.
Required network carrier involvement in the testing of a given location technology, could create further
complexity and time constraints. This involvement could vary from the simple provision of a recent base
station almanac (BSA) to the location vendor, to the higher complexity of integrating location equipment
into the carrier network and handsets. At a minimum, an NDA will be required between the carrier and
the location vendor before the provision of a current BSA. If no business relationship exists between the
carrier and location vendor prior to the test bed effort, then it is likely that a service agreement will need
to be negotiated. The complexity of the service agreement will depend on the level of effort required of
the carrier and the extent of network or handset integration. Fully integrating a new location technology
in the network and/or the handset (if that is required) could take over a year.
Based on current experience, for an indoor test bed effort to be successful, at least six months before the
intended start of testing should be set aside for all of the required preparation. It is also recommended
that the dedicated test management resource work with the selected test vendor to ensure all of the
preparation steps are completed in a timely manner.
The attached Indoor Test Report details in its Section 8 a number of specific project setup and contractual
challenges encountered by the test house, TechnoCom, who interacted with all test participants, building
managers, and various intermediaries. Other challenges and lessons learned by TechnoCom in the areas
of technology readiness for testing, integration, and test execution are also included that Section.
12.2.2 Building Access Challenges:
As stated at the beginning of this section WG3 membership and leadership hope that this important work
continue and that the information provided in this section help those who may follow avoid some of the

The Communications Security, Reliability and Interoperability Council III Working Group 3 “Indoor Test Report”
50
obstacles that this working group had to contend with, particularly relating to the challenges in identifying
and accessing buildings for indoor testing purposes.
The process of building identification and access proved to be one of the biggest challenges in
establishing the Test Bed. WG3 established a Building Committee to specifically address issues with
building selection and access. The process of identifying select facilities meeting certain building
characteristics within each predefined test area proved more difficult than anticipated. Although online
resources, such as property tax information, internet map applications, and general web searches by
building name or location provided some assistance in these efforts, the lack of on the ground personnel
to make contact with property owners and management led to unforeseen delays in securing test locations.
To overcome this limitation, the Building Committee solicited assistance from various local public
agencies within each test area to assist with the process. WG3 would like to acknowledge their
appreciation to the following public agencies for their support and assistance with building selection and
access:
City of San Francisco Fire Department, Division of Fire Prevention and Investigation
City of San Francisco, Department of Emergency Management
San Mateo County Sheriff’s Office
City of Santa Clara Public Safety Communications and building maintenance
U.S. General Services Administration
These agencies assisted the Building Committee with building identification and provided contact
information for property owners, management or maintenance personnel associated with the location.
Additionally, some placed follow-up calls to contacts on behalf of WG3 to ensure location representatives
fully understood the scope of the project and how their respective facilities played a vital role in testing
indoor accuracy for the benefit of public safety. Often, the members were tasked with making multiple
contacts for each location subsequent to initial contact. Initial points of contact often referred
representatives to building maintenance engineers or property owners. Members of the Building
Committee encountered several instances where multiple telephone calls – in one case ten follow-up calls
- were required to various parties before the proper point of contact with the authority to grant access was
reached. Even with these efforts, and attempts by the Building Committee to fully educate property
contacts on the purpose of the Test Bed through multiple telephone conversations and emails, members of
the indoor accuracy test team were still met with reservations at some locations.
One location allowed the test team access, as promised, with the caveat to remove the building from
consideration on future tests. Additional unexpected issues encountered included the requirement at
several test buildings that the test vendor extend liability insurance to cover building management and
ownership. Ownership at one building required the test house to complete an additional legal access
agreement before entering the building.
The tight deadlines on WG3’s final deliverables required an abbreviated coordination period. Time
constraints on building identification and access led to the exclusion of some building types, for example
in the rural polygon, due to the inability to contact property representatives and secure access in the
allotted time period.

The Communications Security, Reliability and Interoperability Council III Working Group 3 “Indoor Test Report”
51
Approximately eight to sixteen hours were needed to perform initial site visit, establish ground truth for
each test point, and perform the full test. Regardless of location or type of building, multiple visits were
required to secure building access, coordinate efforts for a surveyor to establish ground truth for the test
points and a visit to perform the actual indoor accuracy testing. Consideration was given to the type of
facility to ensure the test team’s efforts did not interfere with building occupants or trade. Access to the
AT&T Stadium and the Moscone Center was granted contingent upon not conflicting with normally
scheduled events.
Despite all of the above challenges, without the cooperation and support of the building owners,
managers, and engineering staffs of the 19 buildings used for testing in this stage this test campaign for
would not have been possible. WG3 and the test house, TechnoCom, would like to expressly thank all of
those parties for their help and their valuable contribution to furthering the public’s safety.
12.2.3 Considerations Regarding Building Access for Future Test Beds
Consideration of the following should be given to help mitigate any expected delays in future Test Bed
initiatives:
Follow a more structured and formal approach to building identification and access than the voluntary
ad-hoc approach used in Stage-1. Not only is a long lead time imperative, but also innovative
approaches should be put in place to educate building managers and owners, and to incentivize them
to permit access for testing, possibly on a periodic basis. One such idea would be a standing access
agreement (possibly with a local wireless carrier or the test management resource) in which the
building receives an honorarium or convenience fee (depending on the size of building) for each day
in which testing takes place.
Plan for onsite building selection and access coordination. Representation on the ground within each
test polygon is paramount in both building selection and securing access.
Engage local Public Safety representatives for their assistance and support earlier in the project.
Develop a standard set of education materials to provide detailed information on the Test Bed’s
process, purpose and role in addressing Public Safety concerns.
Develop an access form to be completed by the property representative and/or owner and returned to
the project access coordinator prior to the test team’s dispatch to the location. The form can be used
to acknowledge permission is granted to the facility and help identify any additional requirements or
documentation that must be submitted before access is allowed.
Refrain from project coordination and testing near Holidays. Time requirements to meet the WG3
final deliverable forced testing to occur in late 2012. Timing this close to the Holiday season made
access to the building owners and management more difficult, thus impacting the overall timeline.
WG3 was fortunate retail centers included in this Test Bed allowed access during the busy holiday
shopping season.
13. LOCATION TECHNOLOGY CONSIDERATIONS FOR INDOOR WIRELESS E911
This section summarizes some of the important considerations and challenges associated with location of
indoor wireless 9-1-1 calls. This includes challenges related to developing the location technology,
standardizing the location technology, deploying the location technology, and testing location

The Communications Security, Reliability and Interoperability Council III Working Group 3 “Indoor Test Report”
52
performance indoors. Other considerations include a brief overview of costs and other impacts to the
handset and carrier network, a review of desirable location technology characteristics, and some overall
observations, conclusions, and recommendations.
13.1 Important Insights Gained from Test Bed Process
The common indoor test bed process undertaken by Workgroup 3 drove several important insights clearly
to the surface, as highlighted in this section.
Testing indoors presents substantial logistical and technical challenges – as anticipated by Workgroup 3,
and highlighted in the ‘E9-1-1 Location Accuracy Final Report’ (1 Jun 2012). In that report, CSRIC
WG3 made the following observations and recommendations to the Commission:
“Indoor location testing is logistically challenging, expensive, and may require differing industry
accepted methods of testing”, as compared to currently established outdoor methods.
“Due to the complexity of indoor testing, the working group recommends a flexible and efficient
approach that relies on field testing in representative environments”.
“The approach recommended by the working group is to characterize indoor accuracy separately from
outdoor accuracy”.
FCC: “Should indoor locations be sampled in a statistical manner within each county of PSAP
coverage area? CSRIC: “Consensus within the working group is that such widespread indoor testing
would not be practical”.
Execution of the common indoor test bed has proven these assertions accurate. Testing in just a single
geographical test area required months to plan and execute the tests – even with complete cooperation and
support from vendors, carriers, and public safety. The cost to cover the planning, execution, and analysis
of performance within this single test area was also substantial ($240,000). As testing of a larger number
of test points increases so do costs.
Logistical indoor testing challenges include:
Identification of buildings for testing
Privacy, security, and building access issues
Obtaining accurate indoor ground truth
Large variations in structure types
Substantial time and cost required to plan, collect, and analyze indoor test data
13.2 Further Observations on Indoor Location
Technical performance indoors is only one consideration in bringing a location technology into use for
emergency services. Other considerations include:
Commercial availability
Standardization
Cost to deploy
Cost to operate and maintain
Impacts to the handset
Cost

The Communications Security, Reliability and Interoperability Council III Working Group 3 “Indoor Test Report”
53
Battery life
Complexity
Size
Difficulty validating performance of new handset models
Impacts to the wireless network
Availability from multiple sources (versus a proprietary solution)
13.3 Cost Considerations
Various current and emerging location technologies have different cost considerations. Potential areas of
significant cost include: deployment in the wireless network, operation and maintenance, impact to the
handset, and other required independent infrastructure or database development.
Some technologies have relatively low costs upfront to deploy but are relatively costly to operate and
maintain. Others have relatively high upfront costs and have lower operational/maintenance costs. Some
methods have cost implications in the handset, some to the wireless network, and some impact both.
Others require infrastructure development independent of the wireless network. Some require the
development and maintenance of various databases to operate. Evaluation of all of these considerations
was beyond the scope of this test bed process. Overall, each location technology requires substantial
investment in both time and resources.
Carrier and equipment costs impact the cost of service to subscribers. Emergency services resources are
finite and must be used responsibly. Given these considerations, it is impractical to change location
technologies frequently. New technologies must be somewhat future-proof, efficient to deploy into a
high-reliability wireless network without impacting voice/data services, and also efficient to operate and
maintain. Technologies that allow costs to be shared across multiple wireless carriers are preferred.
To ensure a healthy ecosystem, location technologies must be standardized and ideally available from
multiple providers.
13.4 Summary of Desired Location Technology Characteristics
High Accuracy and High Yield – across various real-world morphologies, both outdoor and indoors
o Good compliment to AGPS – widely accepted as a primary location method
o Provision of altitude information is preferred – however, much work is needed before altitude
information can be provided to and effectively utilized by public safety.
Low-Latency
Commercially Available
Standardized – crucial for efficient and cost-effective implementation and operation
Economically Reasonable
o Location technologies that allow costs to be shared across carriers are preferred
Low impact to the handset and its development cycle
o New handsets models are extremely competitive and introduced frequently , therefore it is
important that any new location technology can be introduced quickly with multi-vendor support
for (1) ICs in the UE, and (2) test equipment required to characterize the new technology
o Handset bill-of-material costs are fundamental to the business case
o Minimal power consumption is important

The Communications Security, Reliability and Interoperability Council III Working Group 3 “Indoor Test Report”
54
Independent (or largely independent) from the Wireless network
o Independent of cellsite locations and density
o Independent of changes in frequencies, bands, and deployment configuration
o Independent of Radio Access Network technology changes
o Given the massive investments involved in deploying new location technologies – it is
impractical to change them frequently. New technologies must be somewhat future-proof.
o Minimal impacts to cell sites
Many cellsite deployments are extremely restricted. In many instances, basestation
equipment is being placed on towers rather than within ground-level equipment cabinets.
Must be efficient to deploy into a high-reliability wireless network without impacting voice/data
services, and also efficient to operate and maintain
Availability from multiple sources – must have a healthy eco-system
Unrestricted Intellectual Property – or at least fair/reasonable licensing of underlying technology
13.5 Summary & Conclusions
Seven different location vendors/technologies began the process to demonstrate their performance indoors
through the common test bed, but only three completed the process. Of these three, two technologies
(AGPS/AFLT and RF Fingerprinting) are already in common use for emergency services, while the third
(metropolitan beacons) is not yet commercially available. However all technologies tested demonstrated
relativity high yield and various levels of accuracy in indoor environments.
Significant standards work is required to allow practical implementation of many emerging location
technologies for emergency services use.
While this working group attempted to provide some initial insight into costs associated with
implementation of these new technologies, we did not attempt to quantify cost to deploy, cost to operate
and maintain, and cost impact to the handset.
Many positioning methods require handset modifications. Integration of these modified handsets into the
subscriber base, once the location technology is commercially available, will take years to complete.
Technical performance of some position methods was determined in the test bed using non-production
form factor hardware. Care must be exercised in applying these results to production handsets.
The test bed was limited to evaluating the indoor performance of technologies, and in some instances did
not test the end-to-end E911 solution as it would be deployed in a carrier’s network. Accuracy and
stability impacts to the location system from continual carrier network changes and other operational
issues were not taken into consideration and still need to be fully understood.
In some cases, determination of the position estimate (position calculation function) for the test bed effort
was computed in non-real time, using non-standardized signaling methods independent of the wireless
carrier network. Differences in technical performance resulting from these deviations, relative to an
actual production implementation, need to be fully understood.
As noted in the Public Safety Foreword, progress has been made in the ability to achieve significantly
improved search rings in both a horizontal and vertical dimension. However, even the best location
technologies tested have not proven the ability to consistently identify the specific building and floor,

The Communications Security, Reliability and Interoperability Council III Working Group 3 “Indoor Test Report”
55
which represents the required performance to meet Public Safety's expressed needs. This is not likely to
change over the next 12-24 months. Various technologies have projected improved performance in the
future, but none of those claims have yet been proven through the test bed process. It is hoped that such
technologies would be tested and validated in future test bed campaigns.
13.5.1 Location Technologies/Vendors Not Participating in the Test Bed
The following location vendors showed initial interest in having their technologies tested and highlighted
through the test bed process, but ended up not participating in the Stage 1 test bed, for a variety of
reasons.
U-TDOA Positioning (TruePosition)
DAS Proximity-based Positioning (CommScope)
AGNSS / WiFi / MEMS Sensor Hybrid Positioning (CSR)
LEO Iridium Satellite-based Positioning (Boeing BTL)
Other technologies of potential interest for indoor positioning were not available in the Stage 1 test bed
time frame, but are good candidates for the next stage. These technologies include:
WiFi-based Location
AGNSS (A-GPS and A-GLONASS, and possibly other Satellite constellations)
OTDOA with LTE
13.5.2 Recommendation For Future Test Bed Stages
Very few location technologies are currently available for E9-1-1 use indoors. However, location
technologies continue to evolve and new technologies continue to emerge. Given the dynamic nature of
these technology developments, Workgroup 3 felt strongly that future stages of the test bed should be
chartered by the FCC and carried out in a similar controlled manner – perhaps under the auspices of
future CSRIC Workgroups.
Several cycles of testing, at regular intervals, are needed to support the rate of technology development in
this actively developing arena. Thus, a test bed management structure with contractual authority that
extends beyond this and subsequent CSRIC cycles will encourage ongoing technology development.
Vendors and technologies that chose not to participate in the initial test bed, those who were not identified
in time to participate, and other technologies of potential interest (including those listed above) would
then have an opportunity to formally demonstrate the indoor performance of their positioning method.
As such, CSRIC Workgroup 3 strongly recommends the FCC consider including the scope for another
test bed effort in a future CSRIC charter. It is further recommended that an open invitation be extended to
those location vendors who feel their technology is ready for formal public scrutiny, to participate in the
next indoor test bed opportunity.
14. APPENDIX
1. Indoor test report from TechnoCom
Sue.Gilgenbach
Sticky Note
Unmarked set by Sue.Gilgenbach
Sue.Gilgenbach
Comment on Text
Under WG3, See Indoor Test Report - Bay Area Stage 1 Test Bed
The Communications Security, Reliability and Interoperability Council III Working Group 3 “Indoor Test Report”
56
address: ftp.technocom-wireless.com
Username: CSRIC_Report
Password: Report!2CWG3
2. Test Plan