March 12, 2019 An ideal blend - ICICI Direct
35
ICICI Securities – Retail Equity Research Initiating Coverage March 12, 2019 CMP: | 440 Target: | 500 ( 14%) Target Period: 12 months M&M Financial Services ( MAHFIN) BUY Rural dominance & normal monsoons – An ideal blend Mahindra and Mahindra Financial Services (MMFS) is a subsidiary of Mahindra & Mahindra group, one of the largest business conglomerates in the country. MMFS is predominantly into rural, semi urban vehicle financing with advances at ~| 58,240 crore as on December 31, 2018 and wide customer base of 5.3 million. It is headed by Ramesh Iyer (MD, Vice Chairman), who has decades of experience in Indian financial sector. MMFS operates 1313 branches in 27 states servicing ~5.3 million customers. Strong business momentum led by rural cash flow, high NIM For MMFS, AUM has grown at 23% CAGR with volatile spells in FY09-18. AUM grew at 32% CAGR in 09-14, slowed down in FY15-17 to 10% and then revived to 16% in FY16-18 to | 55,100 crore. We expect AUM to grow at 20% CAGR in FY19-21E to | 94,996 crore. Robust infrastructure spends and recent farmer friendly schemes are expected to support rural cash flows. Current NIM at ~8% is expected to remain stable over the next two years as it has already moderated from highs of 9.2% in the past. Operating leverage to kick in; productivity to improve ahead As loan book growth picks up, we expect MMFS to benefit from expenses incurred on employee and branch expansion. Opex/AUM ratio is seen moderating by ~10 bps to 2.9% in FY21E. Likewise, CI ratio is expected to reduce from 39.7% in FY18 to 36.5% in FY21E. RoA improvement led by steady asset quality, productivity Post impact of bad monsoon, RoA revived from 1% in FY17 to 1.9% in FY18 and further to 2.3% in 9MFY19. Likewise, RoE improved from 6.4% in FY17 to 11.3% in FY18, on the back of strong NII growth at 16% YoY and reduction in CI ratio from ~42% to ~39% in FY18. With steady credit cost and stable yields, we expect RoA to improve further to 2.4% in FY21E. Buoyancy in rural India to benefit; valuation to sustain, BUY Buoyancy in rural India and MMFS’ focus on rural financing are expected to support valuations. MMFS has ingredients to sustainably command premium valuation - 1) rural reach providing huge opportunity with pricing power, 2) robust AUM growth (AUM, earnings CAGR of 20%, 25%, respectively, in FY18-21E), 3) higher rural income led by farm loan waivers and cash flow receipt during election, 4) strong management and 5) adequate risk management with limited losses. We value core auto business at 2.6x FY21E ABV (1.8x FY21E BV) and add | 50 as value for subsidiaries like housing that is picking up pace. Assuming 20% holding company discount in lieu of subsidiaries, we initiate coverage with BUY recommendation and a target price of | 500 per share. Key Financial Summary Key Financials FY17 FY18 FY19E FY20E FY21E Net profit (| Crore) 400 1076 1325 1704 2089 EPS (|) 7.1 18.5 21.6 27.7 32.9 BV (|) 113.9 151.4 172.9 200.7 243.0 P/BV (|) 3.8 2.8 2.5 2.1 1.8 ABV (|) 86.3 97.3 117.0 138.9 176.6 P/E (x) 60.7 23.2 19.9 15.5 13.1 P/ABV (x) 5.0 4.4 3.7 3.1 2.4 ROA (%) 1.0 1.9 2.2 2.3 2.4 ROE (%) 6.4 11.3 13.3 14.8 15.1 Source: ICICI Direct Research, Company Stock data & valuation summary Amount Market Capitalisation | 27000 crore Net worth | 10306 crore 52 week H/L 537 / 351 Equity Capital | 123 crore Face Value | 2 DII Holding (%) 12.98 FII Holding (%) 27.14 Key Highlights MMFS, being rural auto financier, poised to benefit from underlying buoyancy in rural India Adequate capital – no near term dilution Experienced management and strong parentage to support valuation Price performance 2,000 4,000 6,000 8,000 10,000 12,000 14,000 0 100 200 300 400 500 600 Mar- 19 Sep- 18 Apr- 18 Nov- 17 May- 17 Dec- 16 Jul- 16 MMFS (R.H.S) Nifty (L.H.S) Source: BSE Research Analyst Kajal Gandhi [email protected] Vishal Narnolia [email protected] Harsh Shah [email protected]
Transcript of March 12, 2019 An ideal blend - ICICI Direct

ICIC
I S
ecurit
ies –
Retail E
quit
y R
esearch
Init
iatin
g C
overage
March 12, 2019
CMP: | 440 Target: | 500 ( 14%) Target Period: 12 months
M&M Financial Services ( MAHFIN)
BUY
Rural dominance & normal monsoons – An ideal blend
Mahindra and Mahindra Financial Services (MMFS) is a subsidiary of
Mahindra & Mahindra group, one of the largest business conglomerates in
the country. MMFS is predominantly into rural, semi urban vehicle financing
with advances at ~| 58,240 crore as on December 31, 2018 and wide
customer base of 5.3 million. It is headed by Ramesh Iyer (MD, Vice
Chairman), who has decades of experience in Indian financial sector. MMFS
operates 1313 branches in 27 states servicing ~5.3 million customers.
Strong business momentum led by rural cash flow, high NIM
For MMFS, AUM has grown at 23% CAGR with volatile spells in FY09-18.
AUM grew at 32% CAGR in 09-14, slowed down in FY15-17 to 10% and then
revived to 16% in FY16-18 to | 55,100 crore. We expect AUM to grow at
20% CAGR in FY19-21E to | 94,996 crore. Robust infrastructure spends and
recent farmer friendly schemes are expected to support rural cash flows.
Current NIM at ~8% is expected to remain stable over the next two years as
it has already moderated from highs of 9.2% in the past.
Operating leverage to kick in; productivity to improve ahead
As loan book growth picks up, we expect MMFS to benefit from expenses
incurred on employee and branch expansion. Opex/AUM ratio is seen
moderating by ~10 bps to 2.9% in FY21E. Likewise, CI ratio is expected to
reduce from 39.7% in FY18 to 36.5% in FY21E.
RoA improvement led by steady asset quality, productivity
Post impact of bad monsoon, RoA revived from 1% in FY17 to 1.9% in FY18
and further to 2.3% in 9MFY19. Likewise, RoE improved from 6.4% in FY17
to 11.3% in FY18, on the back of strong NII growth at 16% YoY and reduction
in CI ratio from ~42% to ~39% in FY18. With steady credit cost and stable
yields, we expect RoA to improve further to 2.4% in FY21E.
Buoyancy in rural India to benefit; valuation to sustain, BUY
Buoyancy in rural India and MMFS’ focus on rural financing are expected to
support valuations. MMFS has ingredients to sustainably command
premium valuation - 1) rural reach providing huge opportunity with pricing
power, 2) robust AUM growth (AUM, earnings CAGR of 20%, 25%,
respectively, in FY18-21E), 3) higher rural income led by farm loan waivers
and cash flow receipt during election, 4) strong management and 5)
adequate risk management with limited losses. We value core auto business
at 2.6x FY21E ABV (1.8x FY21E BV) and add | 50 as value for subsidiaries
like housing that is picking up pace. Assuming 20% holding company
discount in lieu of subsidiaries, we initiate coverage with BUY
recommendation and a target price of | 500 per share.
Key Financial Summary
Key Financials FY17 FY18 FY19E FY20E FY21E
Net profit (| Crore) 400 1076 1325 1704 2089
EPS (|) 7.1 18.5 21.6 27.7 32.9
BV (|) 113.9 151.4 172.9 200.7 243.0
P/BV (|) 3.8 2.8 2.5 2.1 1.8
ABV (|) 86.3 97.3 117.0 138.9 176.6
P/E (x) 60.7 23.2 19.9 15.5 13.1
P/ABV (x) 5.0 4.4 3.7 3.1 2.4
ROA (%) 1.0 1.9 2.2 2.3 2.4
ROE (%) 6.4 11.3 13.3 14.8 15.1
Source: ICICI Direct Research, Company
Stock data & valuation summary
Amount
Market Capitalisation | 27000 crore
Net worth | 10306 crore
52 week H/L 537 / 351
Equity Capital | 123 crore
Face Value | 2
DII Holding (%) 12.98
FII Holding (%) 27.14
Key Highlights
MMFS, being rural auto financier,
poised to benefit from underlying
buoyancy in rural India
Adequate capital – no near term
dilution
Experienced management and strong
parentage to support valuation
Price performance
2,000
4,000
6,000
8,000
10,000
12,000
14,000
0
100
200
300
400
500
600
Mar-
19
Sep-
18
Apr-
18
Nov-
17
May-
17
Dec-
16
Jul-
16
MMFS (R.H.S) Nifty (L.H.S)
Source: BSE
Research Analyst
Kajal Gandhi
Vishal Narnolia
Harsh Shah
ICICI Securities | Retail Research 2
ICICI Direct Research
Initiating Coverage | M&M Financial Services
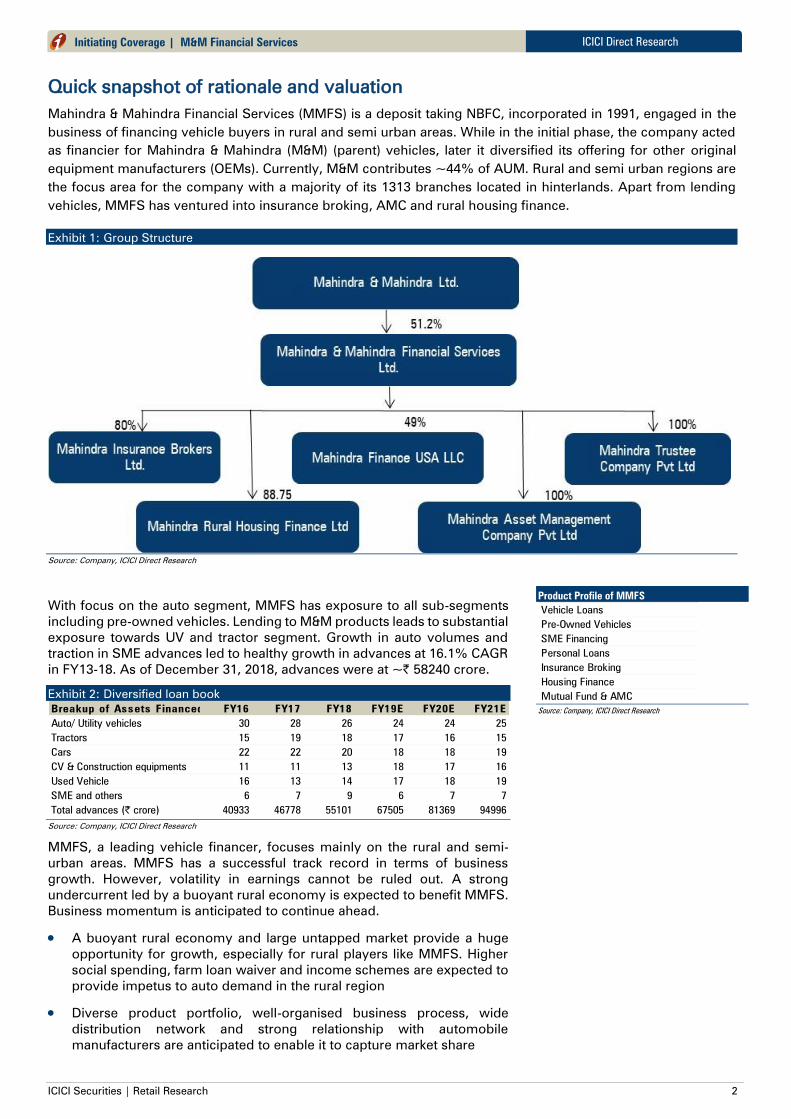
Quick snapshot of rationale and valuation
Mahindra & Mahindra Financial Services (MMFS) is a deposit taking NBFC, incorporated in 1991, engaged in the
business of financing vehicle buyers in rural and semi urban areas. While in the initial phase, the company acted
as financier for Mahindra & Mahindra (M&M) (parent) vehicles, later it diversified its offering for other original
equipment manufacturers (OEMs). Currently, M&M contributes ~44% of AUM. Rural and semi urban regions are
the focus area for the company with a majority of its 1313 branches located in hinterlands. Apart from lending
vehicles, MMFS has ventured into insurance broking, AMC and rural housing finance.
Exhibit 1: Group Structure
Source: Company, ICICI Direct Research
With focus on the auto segment, MMFS has exposure to all sub-segments
including pre-owned vehicles. Lending to M&M products leads to substantial
exposure towards UV and tractor segment. Growth in auto volumes and
traction in SME advances led to healthy growth in advances at 16.1% CAGR
in FY13-18. As of December 31, 2018, advances were at ~| 58240 crore.
Exhibit 2: Diversified loan book
Breakup of Assets Financed (%)FY16 FY17 FY18 FY19E FY20E FY21E
Auto/ Utility vehicles 30 28 26 24 24 25
Tractors 15 19 18 17 16 15
Cars 22 22 20 18 18 19
CV & Construction equipments 11 11 13 18 17 16
Used Vehicle 16 13 14 17 18 19
SME and others 6 7 9 6 7 7
Total advances (| crore) 40933 46778 55101 67505 81369 94996
Source: Company, ICICI Direct Research
MMFS, a leading vehicle financer, focuses mainly on the rural and semi-
urban areas. MMFS has a successful track record in terms of business
growth. However, volatility in earnings cannot be ruled out. A strong
undercurrent led by a buoyant rural economy is expected to benefit MMFS.
Business momentum is anticipated to continue ahead.
A buoyant rural economy and large untapped market provide a huge
opportunity for growth, especially for rural players like MMFS. Higher
social spending, farm loan waiver and income schemes are expected to
provide impetus to auto demand in the rural region
Diverse product portfolio, well-organised business process, wide
distribution network and strong relationship with automobile
manufacturers are anticipated to enable it to capture market share
Product Profile of MMFS
Vehicle Loans
Pre-Owned Vehicles
SME Financing
Personal Loans
Insurance Broking
Housing Finance
Mutual Fund & AMC
Source: Company, ICICI Direct Research

ICICI Securities | Retail Research 3
ICICI Direct Research
Initiating Coverage | M&M Financial Services
Margins are expected to jump in FY19E. Healthy balance of credit and
borrowing mix is expected to keep margins steady ahead
Ind-As, reflecting real stress, led to a decline in NPA. An improvement
in asset quality is anticipated to continue ahead
Healthy credit growth and robust operational performance are expected
to improve RoA by ~20-30 bps in FY19-21E
We expect NII to grow at 25.7% CAGR in FY18-21E to | 7020 crore while
PAT is expected to grow at a CAGR of 24.7% over the same period to | 2087
crore. Margins are expected to be in the region of ~8% by FY21E.
Considering slow auto sales by OEMs and a tight liquidity environment, we
expect strong players like MMFS to capture market share and thereby
continue to grow AUM. The positive ALM position indicates that MMFS is
relatively immune to liquidity shocks positive ALM in shorter tenure buckets)
though a rise in CoF is expected to keep margins steady. Capital adequacy
remains strong at 19.4%. We factor in capital raising in FY21E to fund
balance sheet growth.
Exhibit 3: AUM growth at ~20% in FY19-21E
34,13336,878
40,933
46,778
55,101
67,505
81,369
94,996
8.0
11.0
14.3
17.8
22.5
20.5
16.7
0
5
10
15
20
25
0
15,000
30,000
45,000
60,000
75,000
90,000
105,000
FY14 FY15 FY16 FY17 FY18 FY19E FY20E FY21E
(%)(| crore)
Gross AUM AUM growth (%)
Source: Company, ICICI Direct Research

ICICI Securities | Retail Research 4
ICICI Direct Research
Initiating Coverage | M&M Financial Services
Exhibit 4: Growth in auto sales, improving finance penetration to drive auto finance
Tractor FY2013 FY2014 FY2015 FY2016 FY2017 FY2018 FY2019 FY2020 FY2021
Tractor Sales (Volume) 524,000 633,000 550,000 493,764 582,844 711,478 782,626 845,236 777,617
Industry Size (| crore) 33,300 30,500 28,400 31,400 37,500 40,425 42,786 41,331
Disbursement (| crore) 18,200 17,700 16,800 18,500 22,100 24,600 26,194 25,465
YoY growth -2.7% -5.1% 10.1% 19.5% 11.3% 6.5% -2.8%
Mahindra Disbursement 4,768 4,318 5,110 5,074 6,332 6,799 8,060 8,713 9,235
YoY growth 18.3% -0.7% 24.8% 7.4% 18.5% 8.1% 6.0%
Market Share 24% 29% 30% 34% 31% 33% 33% 36%
Loan outstanding 5,303 6,485 6,638 6,959 7,952 9,367 11,241 13,070 14,164
Commercial Vehicle FY2013 FY2014 FY2015 FY2016 FY2017 FY2018 FY2019 FY2020 FY2021
CV Sales (Volume) 793,150 632,851 614,961 685,704 714,232 856,453 1,010,615 1,162,207 987,876
Industry Size (| crore) 93,654 79,526 90,647 101,988 107,268 141,730 167,242 192,328 183,096
Disbursement (| crore) 45,200 34,352 37,444 46,056 50,201 65,200 77,772 91,938 88,441
YoY growth -24.0% 9.0% 23.0% 9.0% 29.9% 19.3% 18.2% -3.8%
Mahindra Disbursement 2,622 3,048 2,676 2,938 3,799 4,910 8,399 9,470 10,259
YoY growth 16.2% -12.2% 9.8% 29.3% 29.3% 71.1% 12.7% 8.3%
Market Share 6% 9% 7% 6% 8% 8% 11% 10% 12%
Loan outstanding 4,745 5,120 4,794 4,912 6,081 7,714 11,309 14,583 16,938
Passenger Vehicle FY2013 FY2014 FY2015 FY2016 FY2017 FY2018 FY2019 FY2020 FY2021
PV Sales (Volume) 2,665,015 2,503,685 2,601,236 2,789,678 3,047,582 3,287,965 3,403,044 3,607,226 3,859,732
Industry Size (| crore) 130,007 125,200 135,461 152,466 172,827 200,000 211,140 228,285 249,150
Disbursement (| crore) 71,100 69,400 76,100 86,800 99,700 116,900 125,845 138,721 154,327
YoY growth -2.4% 9.7% 14.1% 14.9% 17.3% 7.7% 10.2% 11.3%
Mahindra Disbursement 12,158 12,700 11,922 12,819 15,196 17,376 19,964 23,393 27,568
YoY growth 4.5% -6.1% 7.5% 18.5% 14.3% 14.9% 17.2% 17.8%
Market Share 17% 18% 16% 15% 15% 15% 16% 17% 18%
Loan outstanding 14,515 18,091 19,914 22,513 24,792 27,000 30,305 34,651 40,150
Source: Company, Crisil Research, ICICI Direct Research
MMFS has the ingredients to command premium valuation in a sustained manner - 1) rural reach providing huge
opportunity with pricing power, 2) robust AUM growth (AUM, earnings CAGR of 20%, 25%, respectively, over
FY18-21E), 3) higher rural income led by farm loan waivers and cash flow receipt during election, 4) strong
management and 5) adequate risk management with limited losses. Valuing the core auto business at 2.6x FY21E
ABV (1.8x FY21E BV) and adding | 50 as value for subsidiaries (at 20% holdco discount), we initiate coverage with
a BUY rating and a target price of | 500 per share.
Exhibit 5: Valuation Summary
Business Basis Stake (%)
Business
Value
Value of
stake (|
crore)
Value/
share after
20%
discount
(|)
Standalone 2.6X FY21E ABV 100 28512 28512 449
Housing Finance 2X of FY21E NW 89% 3072 2734 34
Insurance Distribution 15x FY21E PAT 80% 1513 1210 15
AMC FY18 NW 100% 57 57 1
Total 32513 500
Source: Company, ICICI Direct Research
Exhibit 6: Valuation comparison – Auto finance peers
ROA (%) ROE (%) P/E (x) P/BV (x)
FY19E FY20E FY21E FY19E FY20E FY21E FY19E FY20E FY21E FY19E FY20E FY21E
Mahindra Finance 2.2 2.3 2.4 13.3 14.8 15.1 17.9 13.9 11.4 2.5 2.1 1.8
Sundaram Finance 2.2 2.2 2.1 14.0 14.4 14.8 25.4 21.9 19.3 3.8 3.4 3.1
Chola Finance 2.6 2.5 2.4 21.5 21.0 20.9 15.4 12.9 10.7 3.3 2.7 2.2
Bajaj Finance 3.6 3.6 3.7 20.9 22.7 24.0 40.3 30.3 23.2 8.1 6.6 5.2
AU SFB 1.6 1.7 1.8 14.2 15.4 17.5 44.3 30.3 21.3 5.7 4.4 3.7
Shriram transport 2.4 2.5 2.5 17.2 17.5 17.6 9.9 8.3 7.1 1.8 1.6 1.4
L&T fin 2.6 2.5 2.6 18.7 18.5 19.1 10.7 9.7 8.2 2.1 1.9 1.6
Source: Company, ICICI Direct Research
Key risks include inadequate rainfall or drought
conditions in rural belts where it operates and
significant slowdown in auto sales

ICICI Securities | Retail Research 5
ICICI Direct Research
Initiating Coverage | M&M Financial Services
Company Background
Mahindra & Mahindra Financial Services (MMFS) is a deposit taking NBFC, incorporated in 1991, engaged in the
business of financing vehicle buyers in rural and semi urban areas. While in the initial phase, the company acted
as financier for M&M (parent) vehicles, later it diversified its offering for other original equipment manufacturers
(OEMs). Currently, M&M contributes ~44% of AUM. Rural and semi urban regions are the focus areas of the
company with a majority of its 1313 branches located in hinterlands. Apart from lending vehicles, MMFS has
ventured into insurance broking, AMC and rural housing finance.
Exhibit 7: Group structure
Source: Company, ICICI Direct Research
MMFS started business as Maxi Motors Financial Services Ltd in 1991. Later,
in 1992, the name of the entity was changed to Mahindra & Mahindra
Financial Services Ltd. In the initial phase, the company began financing
M&M utility vehicles. However, later in 2002, MMFS ventured into non M&M
vehicles in rural and semi urban areas. Further, commercial vehicle and
construction equipment finance were added in its product boutique. In 2011,
MMFS entered into a JV with Rabobank subsidiary for tractor financing in
USA. Small and medium enterprises (SME) financing as a product was
added to the portfolio in FY14. With emphasis on and better understanding
of rural regions and with the objective of diversification in product mix,
MMFS started its home finance business with a new subsidiary – Mahindra
Rural Housing Finance Ltd.
As of December 31, 2018, advances were at ~| 58240 crore. Product
offerings include vehicle financing for auto and utility vehicles, tractors, cars,
commercial vehicles, three wheelers, and construction equipment. Apart
from new vehicles, pre-owned vehicle financed across products including
cars, multi-utility vehicles, tractors, and commercial vehicles. MMFS is
engaged in providing housing finance for new houses, renovation and
improvements. SME financing services includes lending to auto dealers and
suppliers in the supply chain of parent (M&M) primarily for equipment
finance and working capital finance.
Shareholding Pattern (Q3FY19)
Shareholders Holding (%)
Promoters 51.19
Institutional investors 40.11
Others 8.7
Source: BSE
Top Shareholders
Top shareholders Holding (%)
Mahindra Group 51.2
Blackrock Global Funds 1.5
Blackrock Global Funds 1.5
SBI AMC 2.9
UTI AMC 2.4
HDFC Standard Life Ins 2.3
Kotak Mahindra AMC 1.3
Axis AMC 1.1[
Source: BSE
ICICI Securities | Retail Research 6
ICICI Direct Research
Initiating Coverage | M&M Financial Services
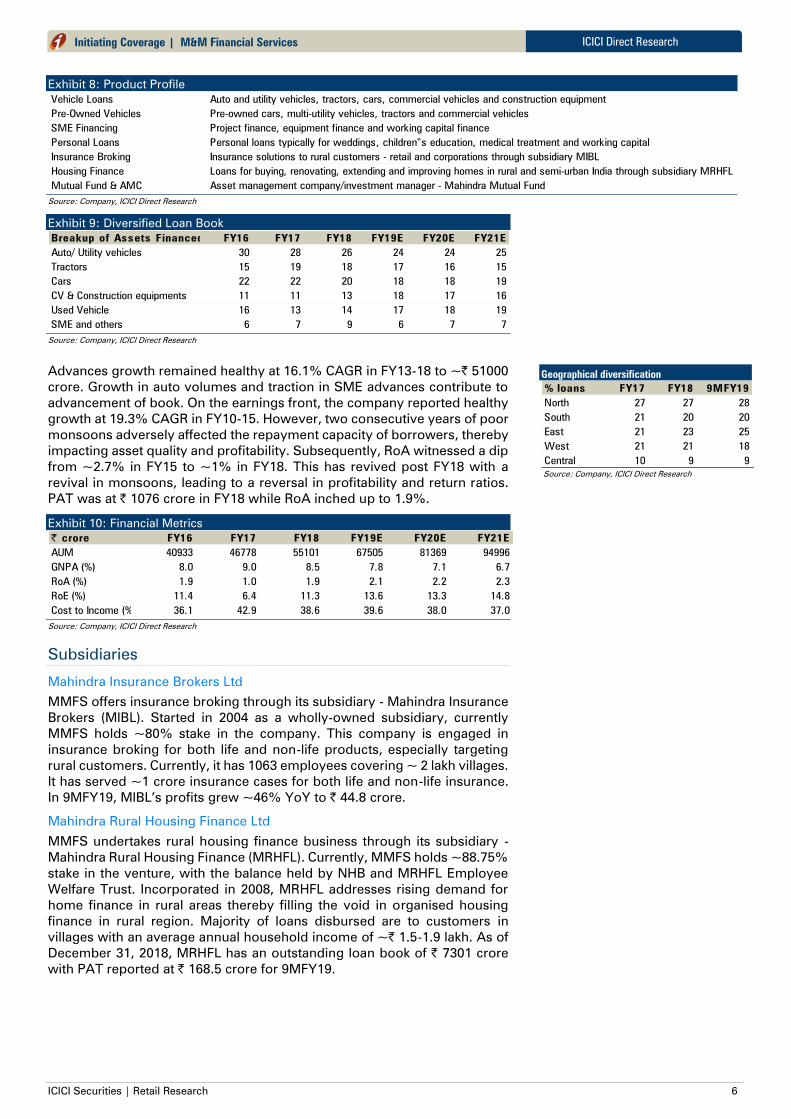
Exhibit 8: Product Profile
Vehicle Loans Auto and utility vehicles, tractors, cars, commercial vehicles and construction equipment
Pre-Owned Vehicles Pre-owned cars, multi-utility vehicles, tractors and commercial vehicles
SME Financing Project finance, equipment finance and working capital finance
Personal Loans Personal loans typically for weddings, children‟s education, medical treatment and working capital
Insurance Broking Insurance solutions to rural customers - retail and corporations through subsidiary MIBL
Housing Finance Loans for buying, renovating, extending and improving homes in rural and semi-urban India through subsidiary MRHFL
Mutual Fund & AMC Asset management company/investment manager - Mahindra Mutual Fund
Source: Company, ICICI Direct Research
Exhibit 9: Diversified Loan Book
Breakup of Assets Financed (%)FY16 FY17 FY18 FY19E FY20E FY21E
Auto/ Utility vehicles 30 28 26 24 24 25
Tractors 15 19 18 17 16 15
Cars 22 22 20 18 18 19
CV & Construction equipments 11 11 13 18 17 16
Used Vehicle 16 13 14 17 18 19
SME and others 6 7 9 6 7 7
Source: Company, ICICI Direct Research
Advances growth remained healthy at 16.1% CAGR in FY13-18 to ~| 51000
crore. Growth in auto volumes and traction in SME advances contribute to
advancement of book. On the earnings front, the company reported healthy
growth at 19.3% CAGR in FY10-15. However, two consecutive years of poor
monsoons adversely affected the repayment capacity of borrowers, thereby
impacting asset quality and profitability. Subsequently, RoA witnessed a dip
from ~2.7% in FY15 to ~1% in FY18. This has revived post FY18 with a
revival in monsoons, leading to a reversal in profitability and return ratios.
PAT was at | 1076 crore in FY18 while RoA inched up to 1.9%.
Exhibit 10: Financial Metrics
| crore FY16 FY17 FY18 FY19E FY20E FY21E
AUM 40933 46778 55101 67505 81369 94996
GNPA (%) 8.0 9.0 8.5 7.8 7.1 6.7
RoA (%) 1.9 1.0 1.9 2.1 2.2 2.3
RoE (%) 11.4 6.4 11.3 13.6 13.3 14.8
Cost to Income (%) 36.1 42.9 38.6 39.6 38.0 37.0
Source: Company, ICICI Direct Research
Subsidiaries
Mahindra Insurance Brokers Ltd
MMFS offers insurance broking through its subsidiary - Mahindra Insurance
Brokers (MIBL). Started in 2004 as a wholly-owned subsidiary, currently
MMFS holds ~80% stake in the company. This company is engaged in
insurance broking for both life and non-life products, especially targeting
rural customers. Currently, it has 1063 employees covering ~ 2 lakh villages.
It has served ~1 crore insurance cases for both life and non-life insurance.
In 9MFY19, MIBL’s profits grew ~46% YoY to | 44.8 crore.
Mahindra Rural Housing Finance Ltd
MMFS undertakes rural housing finance business through its subsidiary -
Mahindra Rural Housing Finance (MRHFL). Currently, MMFS holds ~88.75%
stake in the venture, with the balance held by NHB and MRHFL Employee
Welfare Trust. Incorporated in 2008, MRHFL addresses rising demand for
home finance in rural areas thereby filling the void in organised housing
finance in rural region. Majority of loans disbursed are to customers in
villages with an average annual household income of ~| 1.5-1.9 lakh. As of
December 31, 2018, MRHFL has an outstanding loan book of | 7301 crore
with PAT reported at | 168.5 crore for 9MFY19.
Geographical diversification
% loans FY17 FY18 9MFY19
North 27 27 28
South 21 20 20
East 21 23 25
West 21 21 18
Central 10 9 9
Source: Company, ICICI Direct Research

ICICI Securities | Retail Research 7
ICICI Direct Research
Initiating Coverage | M&M Financial Services
Management profile
Exhibit 11: MMFS- Management profile
Board Member Position
Remun
eration
(|
lakhs)
Dhananjay Mungale
Chairman
(Independent
Director)
Dhananjay Mungale is a member of the Institute of Chartered Accountants of India (ICAI). He was
on the MMFS board since 1999 and appointed Chairman in 2016. He is also a former Bank of
America and DSP Merrill Lynch banker
34
Ramesh Iyer
Vice-Chairman &
Managing Director
(Whole Time)
Ramesh Iyer has been the Managing Director of the company with effect from April 30, 2001 and
has been associated with the company since inception. He has vast experience in matters
related to business development, finance and marketing. He is associated as a member with
FIDC, Ficci and Siam
608
V Ravi
Executive Director
and CFO (Whole
Time)
V Ravi has been associated with the company since its inception. Prior to this, he served with
Mahindra Ugine Steel Company (MUSCO) in Treasury, Finance and Diversification Projects. Ravi
is on the boards of Mahindra Insurance Brokers, Mahindra Rural Housing Finance and Mahindra
Asset Management Company Pvt Ltd, Mahindra Finance US LLC and Mahindra Solar One Pvt
Litd. He has also been a member of the Asia Council of the Conference Board, US and the
Informal Advisory Group of the Reserve Bank of India. He is a chartered and cost accountant
265
MG Bhinde Independent Director
MG Bhide is a Certified Associate of the Indian Institute of Bankers and has a Master's Degree in
Arts from Mumbai University. He was CMD of Bank of India and also the MD and Group
Executive (National Banking) of State Bank of India. He has served on various committees
constituted by the RBI
28
Piyush Mankad Independent Director
Piyush G Mankad, an IAS, was appointed as Controller of Capital Issues - Ministry of Finance,
Government of India, Principal Finance Secretary - Government of Madhya Pradesh, Secretary in
Ministry of Industry - Government of India, and Chairman of Foreign Investment Promotion Board.
He is currently on the Board of Directors of several companies in private sector as Independent
Director and is part of various governing bodies⁄trusts. He has a Bachelor's and Master's Degree
in Humanities from Delhi University and Diploma in Development Studies from Cambridge
University, UK
27
Rama Bijapurkar Independent Director
Rama Bijapurkar is an independent market strategy consultant and has about 30 years of
experience in industries such as advertising, marketing and consultancy. She was previously
associated with McKinsey & Company, AC Nielsen India. She has also worked as a full-time
consultant with HUL. She holds a PG Diploma in management from Indian Institute of
Management, Ahmedabad. She holds a Bachelor's Degree in Science (Hons)
23
CB Bhave Independent Director
Chandrashekhar Bhave, an IAS, has worked in different positions in central and state
governments. He has been CMD of NSDL from 1996 to 2008. Mr Bhave was chairman of Sebi,
from 2008 to 2011. He has several professional affiliations including Member of Board of Public
Interest Oversight Board (PIOB), Madrid and Member of City of London Advisory Council for India
26
VS Parthasarthy Director
VS Parthasarathy joined M&M in 2000. Prior to this, he was Associate Director at Xerox. At
M&M, he spearheaded functions like Finance, HR, M&A, IT and international operations before he
was appointed CFO – M&M. He is on the board of various Mahindra Group Companies.
Parthasarathy holds a Bachelor's Degree in Commerce and is a fellow member of Institute of
Chartered Accountants of India. He is a Harvard Alumni of Advanced Management Programme
Dr Anish Shah Director
Dr Anish Shah is Group President (Strategy) for the Mahindra Group. Prior to joining M&M in
2014, he was President and CEO of GE Capital India, where he led a turnaround of the SBI Card
joint venture. His career at GE spanned 14 years. Before GE, Dr Shah worked at Bank of
America, Bain & Company and Citibank. He holds a PhD from Carnegie Mellon's Tepper School of
Business where his doctoral thesis was in the field of corporate governance
Source: Company, ICICI Direct Research
Exhibit 12: Management Profile
Board Member Subsidiaries Position
Remuner
ation (|
lakhs)
Dr Jaideep Devare
Mahindra
Insurance BrokersMD
Joined M&M in 1992 with diverse experience across various segments in Mahindra
Group. He holds a Bachelor of Engineering (BE) degree in Production Engineering, with
Honors, MMS degree with specialisation in Finance, Licentiate from Insurance Institute
of India (LIII), and Doctorate of Philosophy (Ph.D) in management with a thesis on Indian
insurance private sector joint ventures
417
Anuj MehraMahindra Rural
Housing Finance
MDMehra served as CEO at Mahindra & Mahindra Financial Services. He has served as VP
(Marketing) in Mahindra Lifespace Developers Ltd
214
Ashutosh Bishnoi
Mahindra Asset
Management
Company Pvt Ltd
MD & CEO
Ashutosh Bishnoi has over 34 years experience in consumer marketing and financial
service businesses in India. He has been CMO of DSP Merrill Lynch Mutual Fund,
President & CEO of JM Mutual Fund, ED of UTI Mutual Fund and CEO of L&T MF
124
Source: Company, ICICI Direct Research

ICICI Securities | Retail Research 8
ICICI Direct Research
Initiating Coverage | M&M Financial Services
Key industry trends
A look at NBFCs and current scenario of auto finance industry
In the Indian financial arena, non-banking financial companies (NBFCs) play
an important role in promoting inclusive growth by catering to financial
needs of masses, especially the lower strata of the pyramid that remains
excluded by banks. NBFCs are instrumental in meeting increasing financial
needs of corporates, delivering credit to unorganised sector and small local
borrowers, thereby supplementing role of banking. NBFCs contribute ~| 25
lakh crore or ~18% of total system credit. Currently, NBFCs provide loans
across financial segments, with housing and infra forming the largest
proportion at ~51% of outstanding loans, followed by auto and MSME,
which contribute ~13% each to the portfolio mix.
Exhibit 13: Break-up of NBFC portfolio
Housing
25%
Auto
13%
MSME
13%
Wholesale
12%
MFI & Gold
7%
CE & CD
4%
Infra
26%
Source: Crisil Research, ICICI Direct Research
Of total system credit of ~| 136 lakh crore, the auto sector accounts for~ |
6.8 lakh crore wherein banks and NBFCs individually contribute nearly half
of the pie. As of FY18, NBFCs contributed ~49% of auto loans at ~| 3.3 lakh
crore. Out of this, captive NBFCs (financiers of leading Indian original
equipment manufacturers) contribute nearly one-third of outstanding credit
at ~| 1.2 lakh crore as of FY18.
Exhibit 14: Auto finance industry
Source: Crisil Research, Company, ICICI Direct Research
Of total system credit of ~| 136 lakh crore, ~ | 6.8
lakh crore is provided to auto sector
ICICI Securities | Retail Research 9
ICICI Direct Research
Initiating Coverage | M&M Financial Services
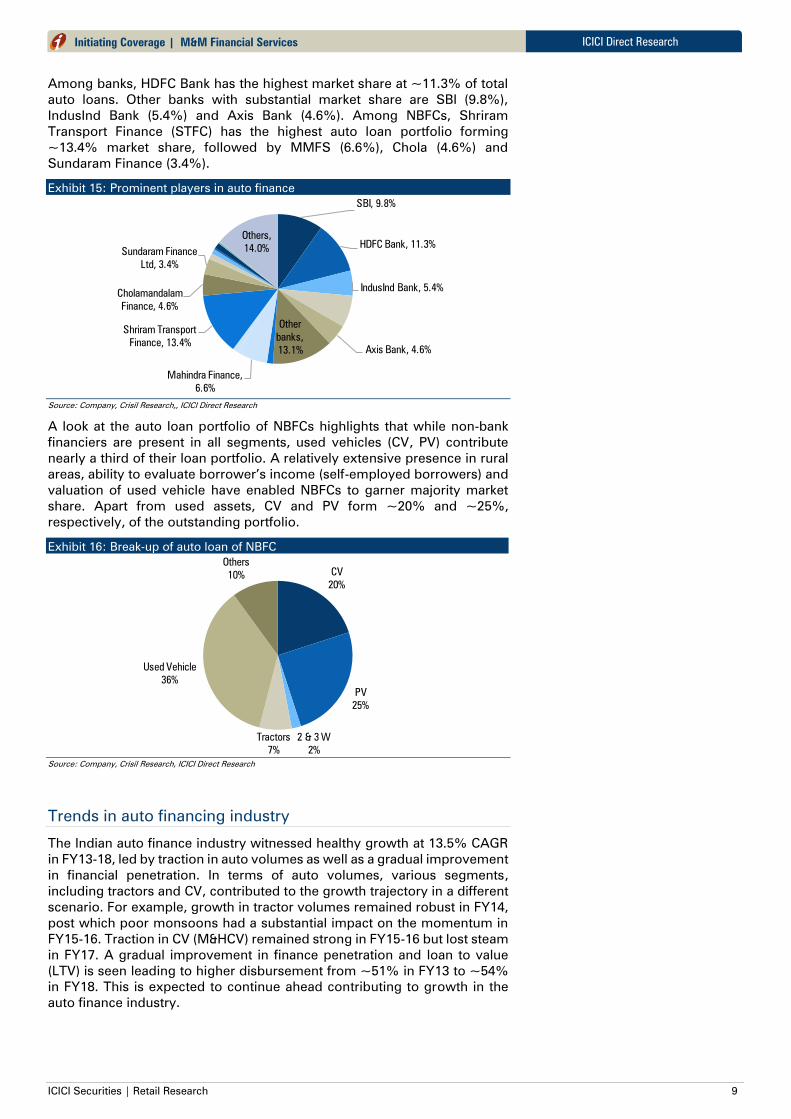
Among banks, HDFC Bank has the highest market share at ~11.3% of total
auto loans. Other banks with substantial market share are SBI (9.8%),
IndusInd Bank (5.4%) and Axis Bank (4.6%). Among NBFCs, Shriram
Transport Finance (STFC) has the highest auto loan portfolio forming
~13.4% market share, followed by MMFS (6.6%), Chola (4.6%) and
Sundaram Finance (3.4%).
Exhibit 15: Prominent players in auto finance
SBI, 9.8%
HDFC Bank, 11.3%
IndusInd Bank, 5.4%
Axis Bank, 4.6%
Other
banks,
13.1%
Mahindra Finance,
6.6%
Shriram Transport
Finance, 13.4%
Cholamandalam
Finance, 4.6%
Sundaram Finance
Ltd, 3.4%
Others,
14.0%
Source: Company, Crisil Research,, ICICI Direct Research
A look at the auto loan portfolio of NBFCs highlights that while non-bank
financiers are present in all segments, used vehicles (CV, PV) contribute
nearly a third of their loan portfolio. A relatively extensive presence in rural
areas, ability to evaluate borrower’s income (self-employed borrowers) and
valuation of used vehicle have enabled NBFCs to garner majority market
share. Apart from used assets, CV and PV form ~20% and ~25%,
respectively, of the outstanding portfolio.
Exhibit 16: Break-up of auto loan of NBFC
CV
20%
PV
25%
2 & 3 W
2%
Tractors
7%
Used Vehicle
36%
Others
10%
Source: Company, Crisil Research, ICICI Direct Research
Trends in auto financing industry
The Indian auto finance industry witnessed healthy growth at 13.5% CAGR
in FY13-18, led by traction in auto volumes as well as a gradual improvement
in financial penetration. In terms of auto volumes, various segments,
including tractors and CV, contributed to the growth trajectory in a different
scenario. For example, growth in tractor volumes remained robust in FY14,
post which poor monsoons had a substantial impact on the momentum in
FY15-16. Traction in CV (M&HCV) remained strong in FY15-16 but lost steam
in FY17. A gradual improvement in finance penetration and loan to value
(LTV) is seen leading to higher disbursement from ~51% in FY13 to ~54%
in FY18. This is expected to continue ahead contributing to growth in the
auto finance industry.

ICICI Securities | Retail Research 10
ICICI Direct Research
Initiating Coverage | M&M Financial Services
Exhibit 17: Growth in auto loans in last five years
3.6 3.64.1
4.7
5.6
6.8
7.9
9.3
0%
5%
10%
15%
20%
0
2
4
6
8
10
FY13 FY14 FY15 FY16 FY17 FY18 FY19E FY20E
(| crore)
Total auto loans YoY growth (RHS)
Demonetisatio
Bad
Monsoon
(FY15-16)
GST(July,2017)Change in NPA
recognition norms
for NBFC
(April,2018)
Source: Crisil Research, ICICI Direct Research
Exhibit 18: Gradual pick-up in finance penetration in auto segment
52.0%
51.2% 51.1%
52.9%
54.1%53.8%
54.5%
55.4%
56.6%
48%
50%
52%
54%
56%
58%
0
100000
200000
300000
400000
500000
FY2013 FY2014 FY2015 FY2016 FY2017 FY2018 FY2019 FY2020 FY2021
(| crore)
New sales value Disbursement Penetration
Source: Crisil Research, ICICI Direct Research
While the auto finance industry witnessed AUM growth at 13.5% CAGR in
FY13-18, NBFCs grew at a faster pace of 14.5% CAGR during the same
period. Understanding of customer profile, product customisation to suit
customer needs, expertise in asset valuation (especially in used assets)
along with faster turnaround time have enabled NBFCs to grow their loan
book. This has led to an increase in market share of NBFCs from 47% in FY13
to ~50% in FY17. However, in FY18, banks with increased focus towards
retail loans witnessed an increase in market share by ~100 bps to 51%.
Exhibit 19: NBFCs contribute ~49% of auto finance in FY18
53% 54% 52% 53% 50% 51%
47% 46% 48% 47% 50% 49%
0%
20%
40%
60%
80%
100%
FY13 FY14 FY15 FY16 FY17 FY18
Bank NBFC
Source: Company, Crisil Research, ICICI Direct Research
Banks and NBFCs form two major financiers in the formal auto finance
industry. A peculiar feature to be noted is that each participant has its
focused sub-segment in terms of geography, customer and products. While

ICICI Securities | Retail Research 11
ICICI Direct Research
Initiating Coverage | M&M Financial Services
banks concentrate on urban business, NBFCs have garnered dominant
market share in rural areas because of their reach in remote regions. While
banks have a higher market share in the new vehicle segment, NBFCs cater
to the used vehicle segment.
Exhibit 20: Banks lead pie in PV;NBFC dominates in used vehicle business
55%
75%
50% 50%
22% 25%
45%
25%
50% 50%
78% 75%
0%
20%
40%
60%
80%
100%
CV PV Others Tractors Used Vehicle 2/3 W
Bank NBFC
Source: Crisil Research, ICICI Direct Research
NBFC market continues to remain buoyant
The auto finance industry is expected to grow at 17% CAGR in FY19-20E to
~| 9.3 lakh crore (Crisil Research). Among financiers, growth of banks is
expected to be higher at 17-19%, led by higher focus on retail segment and
growth in new vehicle (PV and MHCV) while NBFCs will continue to
dominate in the used vehicle and low ticket (two and three wheeler)
segment. Therefore, the market share of banks in auto finance is expected
to increase ~100 bps to ~52% in FY20E.
Exhibit 21: NBFC market share in auto finance to remain buoyant
53% 54% 52% 53% 50% 51% 51% 52%
47% 46% 48% 47% 50% 49% 49% 48%
0%
5%
10%
15%
20%
0%
25%
50%
75%
100%
FY13 FY14 FY15 FY16 FY17 FY18 FY19E FY20E
Banks NBFC YoY growth (RHS)
Source: Crisil Research, ICICI Direct Research
Captive financier gaining market share; trend to continue ahead
Auto finance NBFCs are broadly divided into two sub-segments – captive
and non-captive financiers. Captive financier are the ones formed by original
equipment manufacturers (OEM) and are generally engaged in providing
finance assistance for purchase of the parent’s vehicles. Non-captive
financiers, on the other hand, have a product portfolio spanning across
manufacturers. In FY13-18, there was steady growth in the loan book of
captive financers, which led to an increase in their market share from 15.5%
in FY13 to 18% in FY18.

ICICI Securities | Retail Research 12
ICICI Direct Research
Initiating Coverage | M&M Financial Services
Exhibit 22: Captive financer to grow faster at 19.7%CAGR in FY19-20E
0.71.2
1.7
1.4
2.1
2.8
0
1
2
3
4
5
FY15 FY18 FY20E
(| lakh crore)
Captive Non-captive
Source: Crisil Research, ICICI Direct Research
The main advantage for captive financiers is access to a large dealer network
of OEMs where significant proportion of auto loans originate. In addition,
captive financiers also provide loans to channel partners. This trend is
expected to continue ahead in FY19-20E, with captive NBFCs seen growing
at a relatively faster pace of 19.7% CAGR. MMFS, being a captive financier,
is set to benefit from this prevailing trend in the auto finance segment.
Buoyant rural economy & under-penetration to drive industry
The state of the rural economy and pace of infrastructure activity are primary
factors, which define growth as well as asset quality for rural financiers. Farm
output and realisation are two important aspects, which drive the health of
small borrowers. In FY09-13, healthy output and better realisation led to
higher growth for rural financiers while lower farm production and a muted
rise in MSP in FY13-16 impacted the rural economy and thereby asset quality
and earnings of rural lenders.
Apart from agriculture, pace of construction activity is another important
driver of financial health of rural economy. With signs of a pick-up in
construction activity, expect rural economy to tread recovery path ahead.
Higher social spending to support rural economy
Rural spending is an integral part of the Indian growth story. To boost rural
income, production and consumption, the government has been
undertaking various measures. It has been increasing allocation in existing
rural based schemes and initiating new schemes. The outlay towards rural
upliftment in the last three years has been growing at 14.3% CAGR.
Schemes like Mahatma Gandhi National Rural Employment Guarantee
Scheme (MNREGA), National Rural Livelihood Mission and Pradhan Mantri
Awas Yojana-Grameen has seen consistent growth. Increase in cash inflow,
led by the government’s support, is seen strengthening the rural economy.
This, in turn, should drive growth in consumption.
Exhibit 23: Allocation to MGNREGA witnessed jump from FY17 onwards
0%
5%
10%
15%
20%
25%
30%
0
100
200
300
400
500
600
700
FY12 FY13 FY14 FY15 FY16 FY17 FY18 FY19 FY20E
Amount (| bn) Growth (%)
Source: Ministry of rural development,, ICICI Direct Research
Cement Demand showing sign of recovery
-4%
0%
4%
8%
12%
16%
0
100000
200000
300000
FY08 FY11 FY14 FY17
Amount (in tonnes) Growth (%)
Source: EAindustry.nic.in, ICICI Direct Research
ICICI Securities | Retail Research 13
ICICI Direct Research
Initiating Coverage | M&M Financial Services
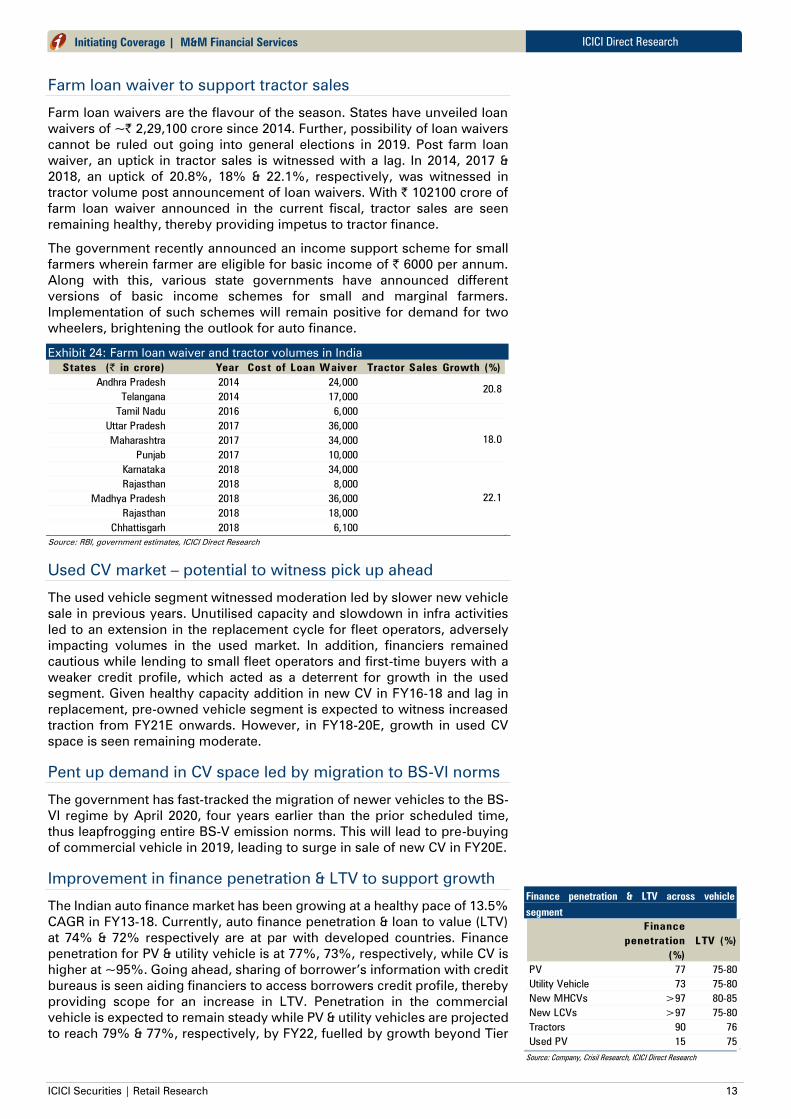
Farm loan waiver to support tractor sales
Farm loan waivers are the flavour of the season. States have unveiled loan
waivers of ~| 2,29,100 crore since 2014. Further, possibility of loan waivers
cannot be ruled out going into general elections in 2019. Post farm loan
waiver, an uptick in tractor sales is witnessed with a lag. In 2014, 2017 &
2018, an uptick of 20.8%, 18% & 22.1%, respectively, was witnessed in
tractor volume post announcement of loan waivers. With | 102100 crore of
farm loan waiver announced in the current fiscal, tractor sales are seen
remaining healthy, thereby providing impetus to tractor finance.
The government recently announced an income support scheme for small
farmers wherein farmer are eligible for basic income of | 6000 per annum.
Along with this, various state governments have announced different
versions of basic income schemes for small and marginal farmers.
Implementation of such schemes will remain positive for demand for two
wheelers, brightening the outlook for auto finance.
Exhibit 24: Farm loan waiver and tractor volumes in India
States (| in crore) Year Cost of Loan Waiver Tractor Sales Growth (%)
Andhra Pradesh 2014 24,000
Telangana 2014 17,000
Tamil Nadu 2016 6,000
Uttar Pradesh 2017 36,000
Maharashtra 2017 34,000
Punjab 2017 10,000
Karnataka 2018 34,000
Rajasthan 2018 8,000
Madhya Pradesh 2018 36,000
Rajasthan 2018 18,000
Chhattisgarh 2018 6,100
18.0
22.1
20.8
Source: RBI, government estimates, ICICI Direct Research
Used CV market – potential to witness pick up ahead
The used vehicle segment witnessed moderation led by slower new vehicle
sale in previous years. Unutilised capacity and slowdown in infra activities
led to an extension in the replacement cycle for fleet operators, adversely
impacting volumes in the used market. In addition, financiers remained
cautious while lending to small fleet operators and first-time buyers with a
weaker credit profile, which acted as a deterrent for growth in the used
segment. Given healthy capacity addition in new CV in FY16-18 and lag in
replacement, pre-owned vehicle segment is expected to witness increased
traction from FY21E onwards. However, in FY18-20E, growth in used CV
space is seen remaining moderate.
Pent up demand in CV space led by migration to BS-VI norms
The government has fast-tracked the migration of newer vehicles to the BS-
VI regime by April 2020, four years earlier than the prior scheduled time,
thus leapfrogging entire BS-V emission norms. This will lead to pre-buying
of commercial vehicle in 2019, leading to surge in sale of new CV in FY20E.
Improvement in finance penetration & LTV to support growth
The Indian auto finance market has been growing at a healthy pace of 13.5%
CAGR in FY13-18. Currently, auto finance penetration & loan to value (LTV)
at 74% & 72% respectively are at par with developed countries. Finance
penetration for PV & utility vehicle is at 77%, 73%, respectively, while CV is
higher at ~95%. Going ahead, sharing of borrower’s information with credit
bureaus is seen aiding financiers to access borrowers credit profile, thereby
providing scope for an increase in LTV. Penetration in the commercial
vehicle is expected to remain steady while PV & utility vehicles are projected
to reach 79% & 77%, respectively, by FY22, fuelled by growth beyond Tier
Finance penetration & LTV across vehicle
segment
Finance
penetration
(%)
LTV (%)
PV 77 75-80
Utility Vehicle 73 75-80
New MHCVs >97 80-85
New LCVs >97 75-80
Tractors 90 76
Used PV 15 75
Source: Company, Crisil Research, ICICI Direct Research
ICICI Securities | Retail Research 14
ICICI Direct Research
Initiating Coverage | M&M Financial Services
II & III cities. Used passenger car market, with low finance penetration at 15%
offers an opportunity for financiers to make inroads in the segment.
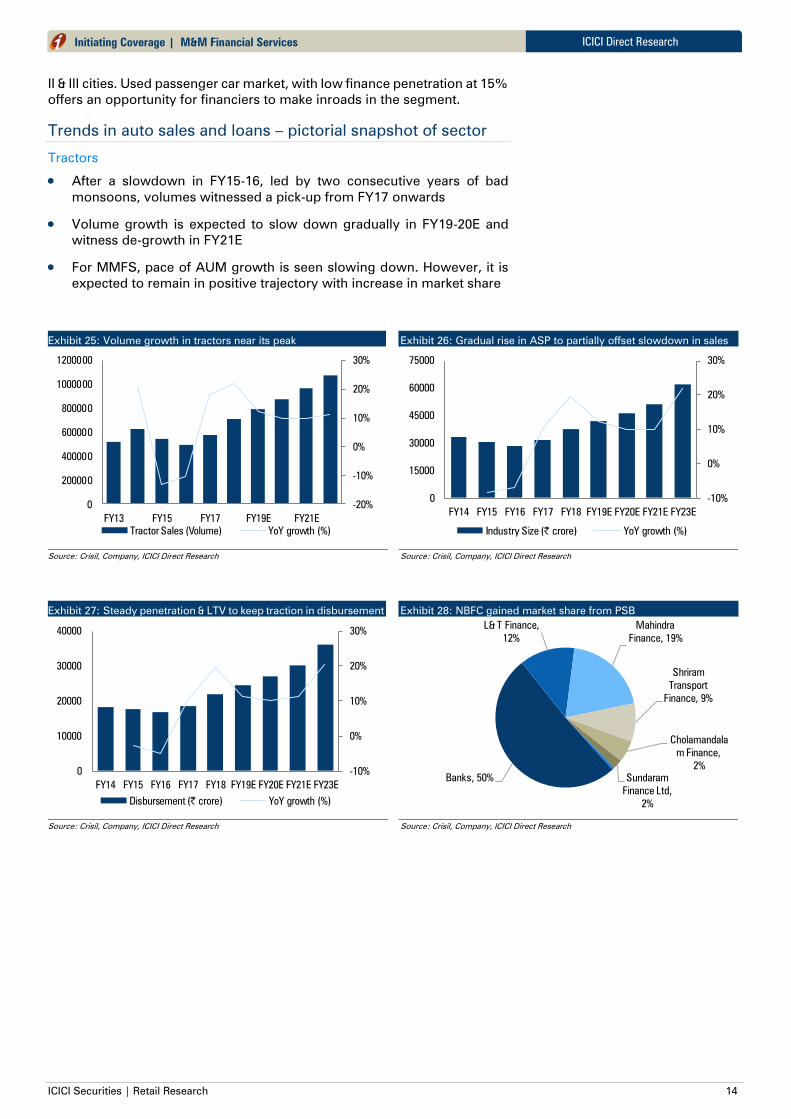
Trends in auto sales and loans – pictorial snapshot of sector
Tractors
After a slowdown in FY15-16, led by two consecutive years of bad
monsoons, volumes witnessed a pick-up from FY17 onwards
Volume growth is expected to slow down gradually in FY19-20E and
witness de-growth in FY21E
For MMFS, pace of AUM growth is seen slowing down. However, it is
expected to remain in positive trajectory with increase in market share
Exhibit 25: Volume growth in tractors near its peak
-20%
-10%
0%
10%
20%
30%
0
200000
400000
600000
800000
1000000
1200000
FY13 FY15 FY17 FY19E FY21E
Tractor Sales (Volume) YoY growth (%)
Source: Crisil, Company, ICICI Direct Research
Exhibit 26: Gradual rise in ASP to partially offset slowdown in sales
-10%
0%
10%
20%
30%
0
15000
30000
45000
60000
75000
FY14 FY15 FY16 FY17 FY18 FY19E FY20E FY21E FY23E
Industry Size (| crore) YoY growth (%)
Source: Crisil, Company, ICICI Direct Research
Exhibit 27: Steady penetration & LTV to keep traction in disbursement
-10%
0%
10%
20%
30%
0
10000
20000
30000
40000
FY14 FY15 FY16 FY17 FY18 FY19E FY20E FY21E FY23E
Disbursement (| crore) YoY growth (%)
Source: Crisil, Company, ICICI Direct Research
Exhibit 28: NBFC gained market share from PSB
Banks, 50%
L& T Finance,
12%
Mahindra
Finance, 19%
Shriram
Transport
Finance, 9%
Cholamandala
m Finance,
2%
Sundaram
Finance Ltd,
2%
Source: Crisil, Company, ICICI Direct Research
ICICI Securities | Retail Research 15
ICICI Direct Research
Initiating Coverage | M&M Financial Services
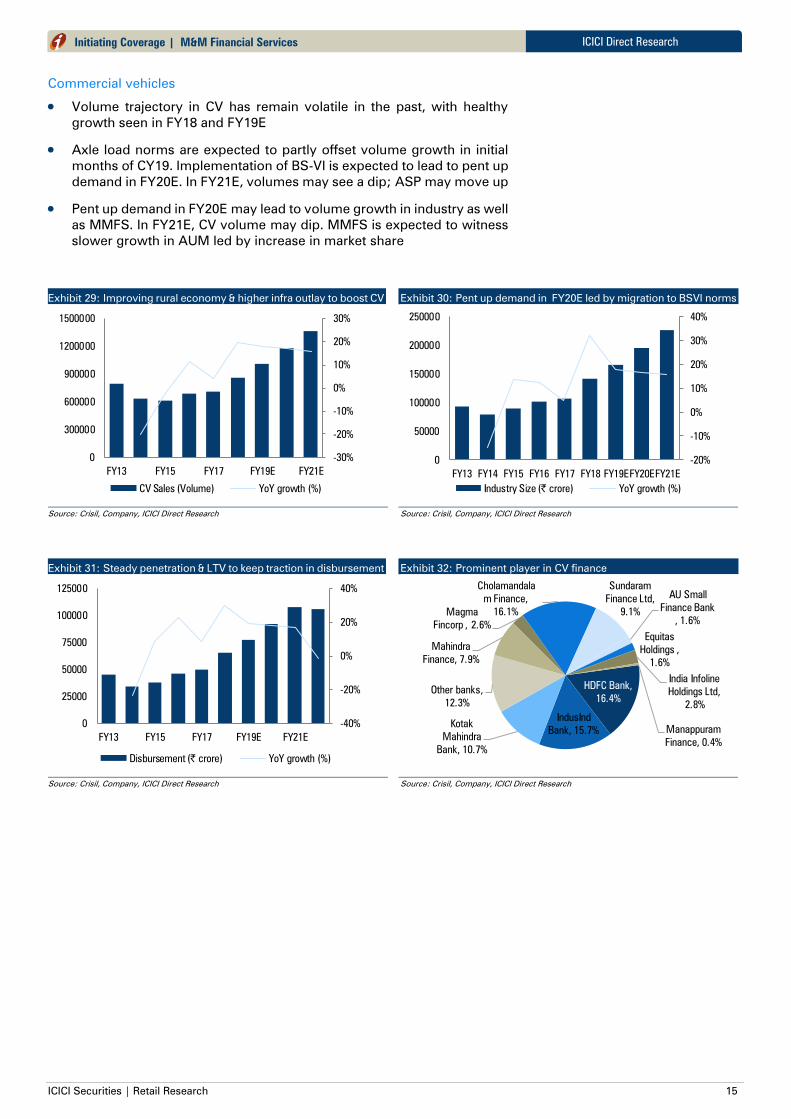
Commercial vehicles
Volume trajectory in CV has remain volatile in the past, with healthy
growth seen in FY18 and FY19E
Axle load norms are expected to partly offset volume growth in initial
months of CY19. Implementation of BS-VI is expected to lead to pent up
demand in FY20E. In FY21E, volumes may see a dip; ASP may move up
Pent up demand in FY20E may lead to volume growth in industry as well
as MMFS. In FY21E, CV volume may dip. MMFS is expected to witness
slower growth in AUM led by increase in market share
Exhibit 29: Improving rural economy & higher infra outlay to boost CV
-30%
-20%
-10%
0%
10%
20%
30%
0
300000
600000
900000
1200000
1500000
FY13 FY15 FY17 FY19E FY21E
CV Sales (Volume) YoY growth (%)
Source: Crisil, Company, ICICI Direct Research
Exhibit 30: Pent up demand in FY20E led by migration to BSVI norms
-20%
-10%
0%
10%
20%
30%
40%
0
50000
100000
150000
200000
250000
FY13 FY14 FY15 FY16 FY17 FY18 FY19EFY20EFY21E
Industry Size (| crore) YoY growth (%)
Source: Crisil, Company, ICICI Direct Research
Exhibit 31: Steady penetration & LTV to keep traction in disbursement
-40%
-20%
0%
20%
40%
0
25000
50000
75000
100000
125000
FY13 FY15 FY17 FY19E FY21E
Disbursement (| crore) YoY growth (%)
Source: Crisil, Company, ICICI Direct Research
Exhibit 32: Prominent player in CV finance
HDFC Bank,
16.4%
IndusInd
Bank, 15.7%Kotak
Mahindra
Bank, 10.7%
Other banks,
12.3%
Mahindra
Finance, 7.9%
Magma
Fincorp , 2.6%
Cholamandala
m Finance,
16.1%
Sundaram
Finance Ltd,
9.1%
AU Small
Finance Bank
, 1.6%
Equitas
Holdings ,
1.6%
India Infoline
Holdings Ltd,
2.8%
Manappuram
Finance, 0.4%
Source: Crisil, Company, ICICI Direct Research

ICICI Securities | Retail Research 16
ICICI Direct Research
Initiating Coverage | M&M Financial Services
Passenger vehicles
Steady volume growth is seen in FY16-18, which is expected to continue
ahead
Incremental volume growth & gradual increase in ASP (led by higher
traction in UV volume) is expected to keep sales traction broadly steady
MMFS is seen grabbing finance market share by ~100 bps, thereby
witnessing steady growth in AUM
Exhibit 33: Lower PV penetration bodes well for volume growth
-10%
0%
10%
20%
0
1500000
3000000
4500000
FY13 FY14 FY15 FY16 FY17 FY18 FY19EFY20EFY21E
PV Sales (Volume) YoY growth (%)
Source: Crisil, Company, ICICI Direct Research
Exhibit 34: Tilt towards UV to boost industry growth
-5%
0%
5%
10%
15%
20%
0
100000
200000
300000
400000
FY13 FY14 FY15 FY16 FY17 FY18 FY19E FY20E FY21E
Industry Size (| crore) YoY growth (%)
Source: Crisil, Company, ICICI Direct Research
Exhibit 35: Volume & improved finance availability to boost growth
-10%
0%
10%
20%
30%
40%
50%
60%
0
50000
100000
150000
200000
250000
300000
FY13 FY15 FY17 FY19E FY21E
Disbursement (| crore) YoY growth (%)
Source: Crisil, Company, ICICI Direct Research
Exhibit 36: Banks dominate new PV finance market
HDFC Bank,
23.8%
IndusInd
Bank, 2.6%
Other banks,
48.6%
Mahindra
Finance, 7.8%Magma
Fincorp , 1.1%
Shriram
Transport
Finance,
6.9%
Cholamandala
m Finance,
1.6%Sundaram
Finance Ltd,
2.3%
Shriram City
Union Finance
, 1.1%
AU Small
Finance Bank
, 1.3%
Source: Crisil, Company, ICICI Direct Research

ICICI Securities | Retail Research 17
ICICI Direct Research
Initiating Coverage | M&M Financial Services
Investment Rationale
MMFS, a leading vehicle financer, focuses mainly on the rural and semi-urban areas. MMFS has a successful track
record in terms of business growth. However, volatility in earnings cannot be ruled out. A strong undercurrent
led by buoyant rural economy is expected to benefit MMFS. Business momentum may continue ahead.
Diverse product portfolio, well-organised business process, wide
distribution network and strong relationship with automobile
manufacturers are expected to enable it to capture market share
Margins may jump in FY19E. Healthy balance of credit and borrowing
mix are expected to keep margins steady ahead
Ind-As, reflecting real stress, led to a decline in NPA. Improvement in
asset quality is expected to continue ahead
Healthy credit growth and robust operational performance may improve
RoA by ~20-30 bps in FY19-21E
Rural, semi-urban vehicle finance – Huge untapped market
India, predominantly a rural economy, continues to remain plagued by huge
proportion of population being under banked or un-banked. Availability of
auto finance remains weak, along with uneven disparity when seen in terms
of geographic presence. In terms of vehicle sales, major OEMs like Maruti
Suzuki, two-wheeler maker Hero Motor and tractor maker M&M generate
~35-50% of their sales from rural areas. However, penetration of auto
financier remains higher in top cities owing to easy credit availability and
better customer appraisal. Higher quantum of cash sales and weak credit
profile of the customers, on the other hand, keeps rural areas on a weak
footing in terms of credit outlay. Based on Crisil Research, financial
penetration (PV & UV) in top 20 cities is ~80% while other cities have
penetration ratio lower at ~65% with rural penetration even lower.
A buoyant rural economy and large untapped market provides huge
opportunity for growth. Apart from growth in auto sales, rise in financial
penetration is another important factor to drive growth of the auto finance
industry. Expansion beyond cities in rural areas is seen increasing
penetration of financiers while availability of customer credit profile is
expected to improve loan to value (LTV). MMFS, with a significant presence
in semi-urban and rural areas stands to benefit from untapped automobile
demand and low penetration of finance in rural areas.
Key strengths to act as pillar supporting growth
India is a country, which is not only large in terms of geography but also in
terms of culture, attitude and natural conditions. Such huge diversity acts as
a major challenge in doing business. MMFS, with extensive penetration
across semi-urban and rural India has gained exceptional knowledge of local
characteristics of these diversified markets. A diverse product portfolio, well-
organised business process, wide distribution network and strong
relationship with automobile manufacturers are key strengths of MMFS.
Wide reach in rural area
MMFS has a strong network of ~1313 branches with more than ~18733
employees on the ground. Customer facing staff, including field officers, are
localites. Therefore, they are well aware of local conditions and customers.
This network and local understanding of customers provides it a handsome
advantage for growth in rural regions.

ICICI Securities | Retail Research 18
ICICI Direct Research
Initiating Coverage | M&M Financial Services
Product portfolio to suit rural customers
With over two decades of lending expertise in rural & semi-urban markets,
the company has developed an understanding of the demands of
customers. Therefore, it is able to customise products to suite customer
needs, which acts as a key strength. In addition, such knowledge is also
instrumental in keeping a lid on asset quality in the long run.
Large dealer network of parent
A wide branch network and strong relationship with dealers aid business
growth. The large dealer network of the parent provides additional thrust to
growth. Currently, MMFS has access to more than 1000 dealers of the
parent, from where a loan originates, providing direct access to customers
and, thereby, business growth.
Lower intensity of competition
MMFS competes primarily with moneylenders along with smaller NBFCs.
High interest rates charged by these competitors makes MMFS a preferred
choice among rural customers. A strong brand name leads to trust and
simplified processes along with fast paperwork, providing an advantage
over competition.
Buoyant rural economy to drive credit growth
India has made significant progress in automotive growth so far, driven by
urban consumers. However, the government’s vision for economic growth
and development across all strata of the country is expected to pave the way
for rural India to complement growth in auto volumes ahead. Low tractor
density compared to global peers, two consecutive years of normal
monsoon, better crop production, government spending and increasing use
of tractors in non-agricultural sectors may drive tractor volumes ahead. The
government focuses on increasing infra spending and approval to large
projects - ‘Bharatmala’ (worth | 7 lakh crore to build ~83,000 km of roads by
2022) to lead to traction in commercial vehicle demand. Tipper sales are
expected to get a boost with an improvement in mining/construction
activity. As per Crisil, the CV market is expected to grow at 5-7% CAGR in
FY19-23. Rising disposable income and a shift towards UV over passenger
car is seen leading to growth in the PV segment.
MMFS has, over time, transformed from a single product financing single
vendor company to financier present across auto segments catering to
various manufacturers. AUM growth has remained healthy at 22.7% CAGR
in FY11-18, with phase of slower growth seen in FY15-16, led by bad
monsoon. A shift is also witnessed in asset mix with growth tilting towards
pre-owned vehicles and SME segment. In FY11, new vehicle finance (PV,
UV, tractors) formed ~85% of AUM, which has now reduced to 66% in FY18.
Exhibit 37: MMFS AUM mix (FY14-21E)
29 31 31 30 27 25 23 23
19 18 17 1717
17 16 15
24 23 24 2322
2019 19
15 13 12 1314
17 18 18
9 10 10 98 9 10 10
4 5 6 8 12 13 14 15
0
20
40
60
80
100
FY14 FY15 FY16 FY17 FY18 FY19E FY20E FY21E
(%)
SME and others Pre-owned vehicles
Commercial vehicles and Construction equipments Cars and Non M&M UVs, Tractors & SCVs
Tractors (M&M) Auto/ Utility vehicles (M&M)
Source: ICICI Direct Research, Company
ICICI Securities | Retail Research 19
ICICI Direct Research
Initiating Coverage | M&M Financial Services
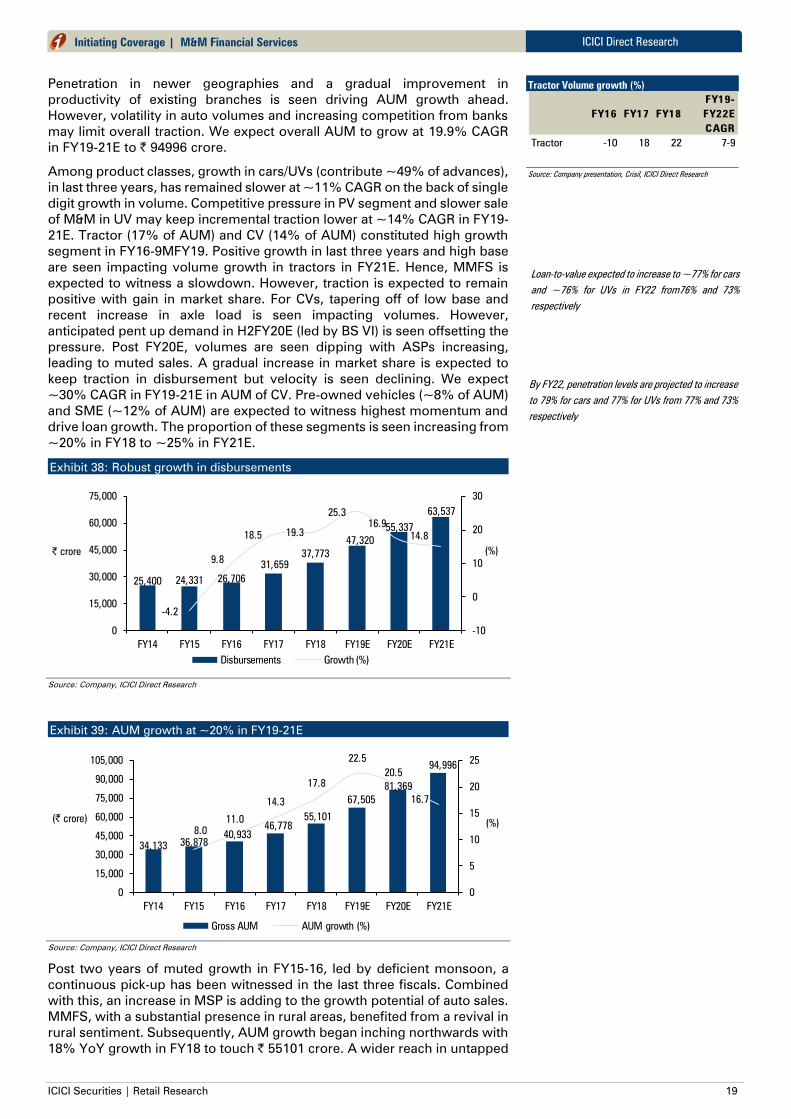
Penetration in newer geographies and a gradual improvement in
productivity of existing branches is seen driving AUM growth ahead.
However, volatility in auto volumes and increasing competition from banks
may limit overall traction. We expect overall AUM to grow at 19.9% CAGR
in FY19-21E to | 94996 crore.
Among product classes, growth in cars/UVs (contribute ~49% of advances),
in last three years, has remained slower at ~11% CAGR on the back of single
digit growth in volume. Competitive pressure in PV segment and slower sale
of M&M in UV may keep incremental traction lower at ~14% CAGR in FY19-
21E. Tractor (17% of AUM) and CV (14% of AUM) constituted high growth
segment in FY16-9MFY19. Positive growth in last three years and high base
are seen impacting volume growth in tractors in FY21E. Hence, MMFS is
expected to witness a slowdown. However, traction is expected to remain
positive with gain in market share. For CVs, tapering off of low base and
recent increase in axle load is seen impacting volumes. However,
anticipated pent up demand in H2FY20E (led by BS VI) is seen offsetting the
pressure. Post FY20E, volumes are seen dipping with ASPs increasing,
leading to muted sales. A gradual increase in market share is expected to
keep traction in disbursement but velocity is seen declining. We expect
~30% CAGR in FY19-21E in AUM of CV. Pre-owned vehicles (~8% of AUM)
and SME (~12% of AUM) are expected to witness highest momentum and
drive loan growth. The proportion of these segments is seen increasing from
~20% in FY18 to ~25% in FY21E.
Exhibit 38: Robust growth in disbursements
25,400 24,331 26,706
31,659
37,773
47,320
55,337
63,537
-4.2
9.8
18.5 19.3
25.3
16.9
14.8
-10
0
10
20
30
0
15,000
30,000
45,000
60,000
75,000
FY14 FY15 FY16 FY17 FY18 FY19E FY20E FY21E
(%)| crore
Disbursements Growth (%)
Source: Company, ICICI Direct Research
Exhibit 39: AUM growth at ~20% in FY19-21E
34,13336,878
40,933
46,778
55,101
67,505
81,369
94,996
8.0
11.0
14.3
17.8
22.5
20.5
16.7
0
5
10
15
20
25
0
15,000
30,000
45,000
60,000
75,000
90,000
105,000
FY14 FY15 FY16 FY17 FY18 FY19E FY20E FY21E
(%)(| crore)
Gross AUM AUM growth (%)
Source: Company, ICICI Direct Research
Post two years of muted growth in FY15-16, led by deficient monsoon, a
continuous pick-up has been witnessed in the last three fiscals. Combined
with this, an increase in MSP is adding to the growth potential of auto sales.
MMFS, with a substantial presence in rural areas, benefited from a revival in
rural sentiment. Subsequently, AUM growth began inching northwards with
18% YoY growth in FY18 to touch | 55101 crore. A wider reach in untapped
Tractor Volume growth (%)
FY16 FY17 FY18
FY19-
FY22E
CAGR
Tractor -10 18 22 7-9
Source: Company presentation, Crisil, ICICI Direct Research
Loan-to-value expected to increase to ~77% for cars
and ~76% for UVs in FY22 from76% and 73%
respectively
By FY22, penetration levels are projected to increase
to 79% for cars and 77% for UVs from 77% and 73%
respectively
ICICI Securities | Retail Research 20
ICICI Direct Research
Initiating Coverage | M&M Financial Services
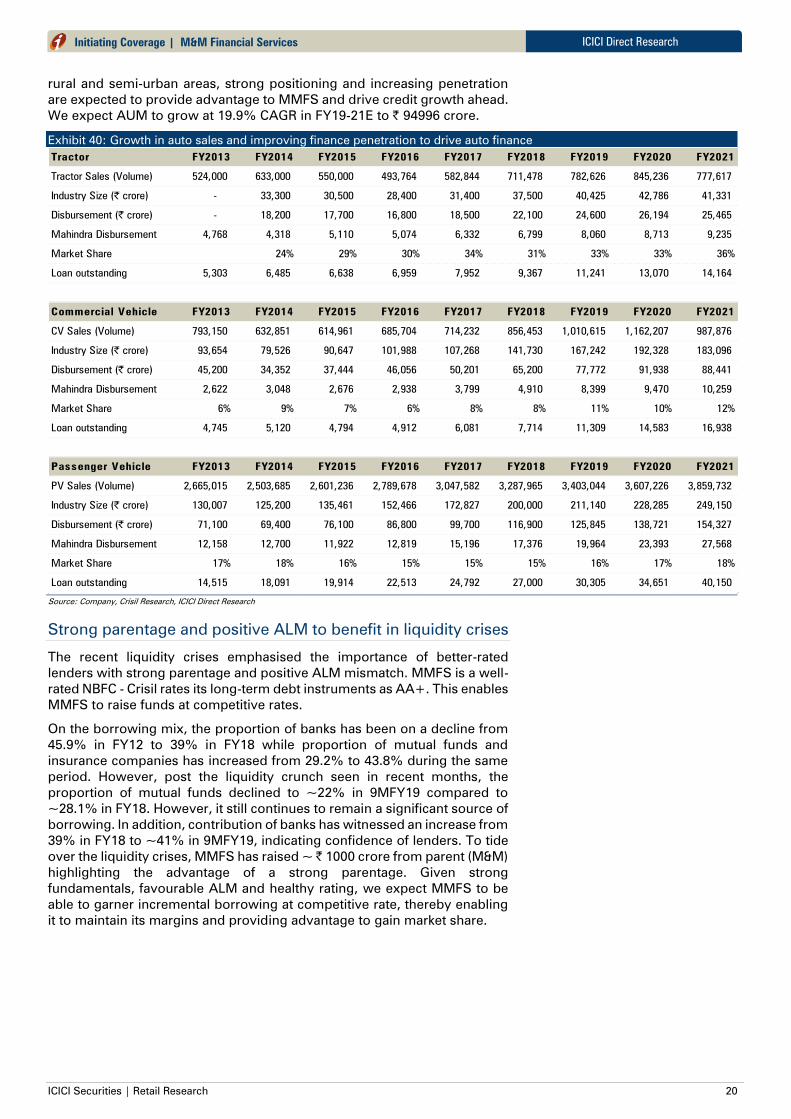
rural and semi-urban areas, strong positioning and increasing penetration
are expected to provide advantage to MMFS and drive credit growth ahead.
We expect AUM to grow at 19.9% CAGR in FY19-21E to | 94996 crore.
Exhibit 40: Growth in auto sales and improving finance penetration to drive auto finance
Tractor FY2013 FY2014 FY2015 FY2016 FY2017 FY2018 FY2019 FY2020 FY2021
Tractor Sales (Volume) 524,000 633,000 550,000 493,764 582,844 711,478 782,626 845,236 777,617
Industry Size (| crore) - 33,300 30,500 28,400 31,400 37,500 40,425 42,786 41,331
Disbursement (| crore) - 18,200 17,700 16,800 18,500 22,100 24,600 26,194 25,465
Mahindra Disbursement 4,768 4,318 5,110 5,074 6,332 6,799 8,060 8,713 9,235
Market Share 24% 29% 30% 34% 31% 33% 33% 36%
Loan outstanding 5,303 6,485 6,638 6,959 7,952 9,367 11,241 13,070 14,164
Commercial Vehicle FY2013 FY2014 FY2015 FY2016 FY2017 FY2018 FY2019 FY2020 FY2021
CV Sales (Volume) 793,150 632,851 614,961 685,704 714,232 856,453 1,010,615 1,162,207 987,876
Industry Size (| crore) 93,654 79,526 90,647 101,988 107,268 141,730 167,242 192,328 183,096
Disbursement (| crore) 45,200 34,352 37,444 46,056 50,201 65,200 77,772 91,938 88,441
Mahindra Disbursement 2,622 3,048 2,676 2,938 3,799 4,910 8,399 9,470 10,259
Market Share 6% 9% 7% 6% 8% 8% 11% 10% 12%
Loan outstanding 4,745 5,120 4,794 4,912 6,081 7,714 11,309 14,583 16,938
Passenger Vehicle FY2013 FY2014 FY2015 FY2016 FY2017 FY2018 FY2019 FY2020 FY2021
PV Sales (Volume) 2,665,015 2,503,685 2,601,236 2,789,678 3,047,582 3,287,965 3,403,044 3,607,226 3,859,732
Industry Size (| crore) 130,007 125,200 135,461 152,466 172,827 200,000 211,140 228,285 249,150
Disbursement (| crore) 71,100 69,400 76,100 86,800 99,700 116,900 125,845 138,721 154,327
Mahindra Disbursement 12,158 12,700 11,922 12,819 15,196 17,376 19,964 23,393 27,568
Market Share 17% 18% 16% 15% 15% 15% 16% 17% 18%
Loan outstanding 14,515 18,091 19,914 22,513 24,792 27,000 30,305 34,651 40,150
Source: Company, Crisil Research, ICICI Direct Research
Strong parentage and positive ALM to benefit in liquidity crises
The recent liquidity crises emphasised the importance of better-rated
lenders with strong parentage and positive ALM mismatch. MMFS is a well-
rated NBFC - Crisil rates its long-term debt instruments as AA+. This enables
MMFS to raise funds at competitive rates.
On the borrowing mix, the proportion of banks has been on a decline from
45.9% in FY12 to 39% in FY18 while proportion of mutual funds and
insurance companies has increased from 29.2% to 43.8% during the same
period. However, post the liquidity crunch seen in recent months, the
proportion of mutual funds declined to ~22% in 9MFY19 compared to
~28.1% in FY18. However, it still continues to remain a significant source of
borrowing. In addition, contribution of banks has witnessed an increase from
39% in FY18 to ~41% in 9MFY19, indicating confidence of lenders. To tide
over the liquidity crises, MMFS has raised ~ | 1000 crore from parent (M&M)
highlighting the advantage of a strong parentage. Given strong
fundamentals, favourable ALM and healthy rating, we expect MMFS to be
able to garner incremental borrowing at competitive rate, thereby enabling
it to maintain its margins and providing advantage to gain market share.

ICICI Securities | Retail Research 21
ICICI Direct Research
Initiating Coverage | M&M Financial Services
Exhibit 41: Borrowing mix
58.6%48.3%
42.0% 46.1%39.0% 42.3% 41.5%
7.9%
14.4%18.9%
21.2%28.1% 22.7% 21.7%
10.0% 14.3% 18.0% 7.8%15.8%
14.2% 14.6%
9.8% 6.3% 4.6% 12.1%
9.3% 12.4% 11.9%
13.7% 16.8% 16.5% 12.8%7.8% 8.4% 10.4%
0%
20%
40%
60%
80%
100%
FY14 FY15 FY16 FY17 FY18 H1 FY19 9MFY19
Banks Mutual Fund Insurance Co. & Institutions Banks for Assignment Others
Source: Company, ICICI Direct Research
One of the problems faced by NBFCs is large proportion of ALM mismatch
led by short-term borrowings funding long-term loans. This nature of
business creates a vacuum in the borrowing mix that makes it vulnerable in
times of liquidity crunch. MMFS, on the other hand, remained largely
unaffected owing to nearly one-third of asset and liabilities getting repriced
every year. ALM, on a cumulative basis, remains positive (that is more
advances will mature compared to borrowings) in all the buckets from one
month to five years (refer Exhibit below).
Exhibit 42: ALM remains positive across various buckets (9MFY19)
35693131
1936
4495
5794
7793
9742
0
2500
5000
7500
10000
Upto 1 month Upto 2
months
Upto 3
months
Upto 6
months
Upto 1 year Upto 3 years Upto 5 years
Cumulative Mismatch - Positive (| crore)
Source: Company, ICICI Direct Research
Up-tick in margins in FY19E; to remain steady ahead
MMFS commands strong pricing power owing to widespread access to rural
areas across India. In most areas of operation, least/negligible competition
exists due to absence of other financial institutions, with moneylenders as
the only option available to borrowers. This enables it to pass on any
increase in cost thereby maintaining healthy margins.
For MMFS, asset quality has played an important role in movement of
margins. After remaining at ~18% in FY10-14, yields fell ~300 bps to ~15%
in FY17 led by increase in NPA due to bad monsoon. Similarly, margins, at
~10% earlier, declined to ~8.4% in FY17 and 7.6% in FY18.
Exhibit 43: Loan book increasing towards CV and Tractors
Breakup of Assets Financed (%)FY16 FY17 FY18 FY19E FY20E FY21E
Auto/ Utility vehicles 30 28 26 24 24 25
Tractors 15 19 18 17 16 15
Cars 22 22 20 18 18 19
CV & Construction equipments 11 11 13 18 17 16
Used Vehicle 16 13 14 17 18 19
SME and others 6 7 9 6 7 7
Source: Company, ICICI Direct Research
Higher NIMs compared to peers
7.6
6.3
7.8
4.3
0.0
2.0
4.0
6.0
8.0
MMFS CFC STFC SFC
NIM on AUM (%)
Source: Company, ICICI Direct Research

ICICI Securities | Retail Research 22
ICICI Direct Research
Initiating Coverage | M&M Financial Services
In FY19E, yields and, thereby, margins are anticipated to witness a surge
owing to 1) improvement in NPA and subsequent interest reversal, 2) focus
on high yield products - tractor and used vehicle, and 3) recent hike in
lending rates. MMFS has not recognised income on Stage 3 assets.
Therefore, reduction in Stage 3 assets is expected to boost interest
recognition and, thereby, margins in FY19E. Calculated NIM is seen jumping
~100 bps to 8.7% in FY19E.
Focus on product mix and customer engagement are expected to keep
yields broadly stable ahead. Liquidity crunch and liabilities slated for
repricing at higher rates are expected to keep cost of funds higher ahead.
Ind-As allows recognition of income on net NPAs. Hence, effect of asset
quality on margins may fizzle out from FY20E onwards. Hence, margins are
expected to remain steady in FY20E. Improving productivity and anticipated
capital raising may lead to ~10 bps increase in margins to ~8.6% in FY21E.
Exhibit 44: NIM to surge in FY19E; to remain broadly steady thereafter….
9.2
8.47.6
8.78.5 8.6
16.2
15.5
14.2
15.1 15.3 15.4
9.59.1
8.48.6 8.7 8.7
6
9
12
15
18
FY16 FY17 FY18 FY19E FY20E FY21E
Net Interest Margins Yield on Gross AUM Cost of borrowing
(%)
Source: Company, ICICI Direct Research
Business expansion drives cost; operating leverage to kick in
For MMFS, one of the major components of opex is employee expense, as
the business needs investment in human resource to touch base with
customers (field staff). Over the years, MMFS has been increasing branches
and employee strength adding to opex. However, in the last five years,
opex/AUM has been in a tight range of 2.8-3.2%. As of 9MFY19, opex/AUM
was at ~3%.
Going ahead, we expect the branch count to increase to 1584 in FY21E from
1284 in FY18. Likewise, employee strength is set to increase from ~18733
in FY18 to ~22176, keeping employee per branch on a blended basis
broadly steady at ~14 in FY21E.
Employee productivity, measured in terms of contracts per employee, has
been on a gradual increase since FY10, except FY15-16, wherein contracts
per employee declined led by two consecutive years of bad monsoon. With
consecutive years of normal monsoon and positive vehicle sales, employee
productivity is seen increasing with contract per employee touching ~40 in
FY21E. In addition, increase in disbursement per contract is expected to
improve productivity.
Employee expense rose at faster pace in Q3FY19, led
by 1) higher employee addition at ~881 in Q3FY19
and 2) one-off incentive to employees as the
company completed 25 years of operations
Higher operational cost compared to peers
3.3
3.0
1.8
2.1
0.0
1.0
2.0
3.0
4.0
MMFS CFC STFC SFC
Op.costs/avg AUM (%)
Source: Company, ICICI Direct Research

ICICI Securities | Retail Research 23
ICICI Direct Research
Initiating Coverage | M&M Financial Services
Exhibit 45: Opex/advances
3.11
2.89
3.05
3.28
2.91 2.90 2.90 2.90
2.6
2.8
3.0
3.2
3.4
FY14 FY15 FY16 FY17 FY18 FY19E FY20E FY21E
%
Source: Company, ICICI Direct Research
Though, investment in business expansion in recent quarters has kept
opex/AUM on the higher side, the ratio is seen subsiding as operating
leverage kicks in. Therefore, opex is seen growing at 22.2% CAGR in FY19-
21E to | 2598 crore. Also, opex to AUM is seen declining at ~2.9% in FY20-
21E, after inching up at ~3% in FY19E.
Exhibit 46: Number of employees
16,459
17,43317,85617,659
18,35018,48618,733
20,760
21,518
22,176
12000
15000
18000
21000
24000
FY12 FY13 FY14 FY15 FY16 FY17 FY18 FY19EFY20EFY21E
In N
o's
Source: Company, ICICI Direct Research
Exhibit 47: Rise in contract per employee to aid productivity
28.3
30.6 31.5
29.2 28.5
30.1
33.4
35.6
37.9
39.9
20
25
30
35
40
45
FY12 FY13 FY14 FY15 FY16 FY17 FY18 FY19EFY20EFY21E
(In Nos)
Source: Company, ICICI Direct Research
Headline NPA to improve; credit cost to remain at current level
For MMFS, headline NPA numbers have remained volatile over the years.
GNPA was at 3% in FY13, surging to 9% in FY18, led by two consecutive
bad monsoons and implementation of NPA recognition norms (180 days to
90 days). With a pick-up in rural economy, asset quality witnessed an
improvement, which is seen continuing ahead with GNPA at ~6.7% in
FY21E. We expect ~64% PCR on an overall basis, 4.4% NNPA for FY21E.
Though GNPA has remained high owing to volatile cash flows of the
borrower and dependence on agriculture, as per the management actual
loss ratio remains lower. Customers postpone payment but eventually pay
leading to loss given default (LGD) remaining low.
Implementation of Ind-As is seen bringing back rationality on NPA
recognition (as Stage III) and interest income write-backs. The expected loss
methodology also incorporates loss on interest income. As such interest
reversals are not required under Ind-As. This will lower volatility in earnings.
Implementation of Expected Credit Loss (ECL) methodology under Ind-As is
seen keeping overall provision levels higher compared to the earlier regime.
The reason for higher credit cost is attributable to increase in provision on
standard advances classified under stage 1 and 2 category. Provision in lieu
of advances classified as Stage 3 will be relatively lower as LGD and
probability of default are considered.
Gross NPA as percentage of loans
8.5
2.9
9.2
1.3
0
2
4
6
8
10
MMFS CFC STFC SFC
GNPL (% of loans)
Source: Company, ICICI Direct Research

ICICI Securities | Retail Research 24
ICICI Direct Research
Initiating Coverage | M&M Financial Services
An important point to note is that stage 1, 2 provisions will contribute ~47%
of total ECL with stage 3 PCR at 34% forming ~53% of ECL. As such,
provisions will be sticky, implying earnings appreciation in an up cycle will
be lower than previous regime. Similarly, downside will also be lower. In
other words, earnings, profitability will be less volatile over the next term.
Waiver of farm loans announced in the past does not seems to have any
material impact on asset quality. However, MMFS stands to benefit in the
aftermath given increase in cash flow in the hands of the farmers.
Exhibit 48: Revival in rural economy to lead to improvement in NPA numbers
4.4%
5.9%
8.0%
9.0%8.5%
7.8%
7.1%6.7%
1.9%2.4%
3.2%3.6% 3.8%
5.1%4.7%
4.4%
0%
2%
4%
6%
8%
10%
0
14,000
28,000
42,000
56,000
70,000
FY14 FY15 FY16 FY17 FY18 FY19E FY20E FY21E
GNPA NNPA GNPA % NNPA %
(| crore)
Source: Company, ICICI Direct Research
Healthy NIM, steady asset quality & productivity to improve RoA
Healthy margins, control on cost and steady credit cost enabled MMFS to
maintain healthy return ratios in the past. However, two consecutive bad
monsoons in FY15-16 impacted yields and led to an increase in credit cost,
thereby resulting in a decline in RoA from 3.3% in FY14 to 1% in FY17. With
normal monsoons from FY17 onwards, RoA revived from 1% in FY17 to
1.9% in FY18 and further to 2.3% in 9MFY19, led by improvement in margins
and decline in credit cost. Likewise, RoE also improved from 6.4% in FY17
to 11.3% in FY18 and 13% in 9MFY19.
Implementation of Ind-As and subsequent change in accounting for
provisions in lieu of advances led to an improvement in return ratios.
Improvement in margins, focus on cost efficiency and stable credit cost are
expected to lead RoA to inch up gradually by ~20 bps to 2.4% in FY21E. A
gradual up-tick in gearing is expected to further support improvement in RoE
from 11.3% in FY18 to ~14-15% in FY21E.
Exhibit 49: Gradual improvement in RoA ahead
22.0 22.8
24.2
18.8
15.5
11.4
6.4
11.3
13.3 14.8 15.1
4.4 4.1 4.2 3.3
2.7 1.9 1.0 1.9 2.2 2.3 2.4
0
10
20
30
FY11 FY12 FY13 FY14 FY15 FY16 FY17 FY18 FY19E FY20E FY21E
(%)
ROE (%) ROA (%)
Source: Company, ICICI Direct Research
Implementation of Ind-As implies focusing on
“substance” in a number of areas in accounting
rather than “form”, which has been followed earlier.
Ind-As follows Expected Credit Loss (ECL)
methodology, under which provisions are
categorised as Stage 1 (loans delinquent up to 30
days), Stage 2 (loan delinquent between 31 and 90
days) and Stage 3 (loans delinquent beyond 90 days)
are provided
RoA - Peer comparison (FY18)
2
3
2
2
0
1
2
3
MMFS CFC STFC SFC
RoA (%)
Source: Company, ICICI Direct Research

ICICI Securities | Retail Research 25
ICICI Direct Research
Initiating Coverage | M&M Financial Services
Exhibit 50: RoA decomposition
FY16 FY17 FY18 FY19E FY20E FY21E
Interest Earned 14.5% 14.0% 13.0% 14.0% 14.1% 14.3%
Interest Expended 6.8% 6.5% 6.1% 6.2% 6.3% 6.3%
Net Interest Income 7.7% 7.5% 6.9% 7.8% 7.8% 8.0%
Non Interest Income 0.7% 0.2% 0.1% 0.1% 0.1% 0.1%
Net Income 8.4% 7.7% 7.1% 7.9% 7.9% 8.1%
Staff cost 1.4% 1.6% 1.6% 1.8% 1.7% 1.6%
Other Operating expense 1.6% 1.8% 1.2% 1.2% 1.3% 1.4%
Opex 3.0% 3.3% 2.8% 3.0% 2.9% 2.9%
Operating profit 5.4% 4.4% 4.3% 4.9% 5.0% 5.1%
Provisions 2.7% 3.0% 1.1% 1.6% 1.5% 1.5%
PBT 2.7% 1.4% 3.1% 3.3% 3.5% 3.6%
Taxes 0.9% 0.5% 1.2% 1.2% 1.2% 1.3%
RoA 1.7% 0.9% 2.1% 2.2% 2.3% 2.4%
Leverage 6.6 7.0 6.5 6.2 6.5 6.4
RoE 11.4% 6.4% 13.6% 13.3% 14.8% 15.1%
Source: Company, ICICI Direct Research
Comfortable capital adequacy to support growth
MMFS has raised | 1056 crore via qualified institutional placement (QIP) of
2.4 crore shares at | 440/share, thereby increasing tier I ratio to 17% as of
December 2017. Faster growth in advances is seen leading to higher capital
consumption ahead. Capital adequacy (CaR) remains comfortable at 19.4%,
while tier I ratio is at 14.7%. We believe MMFS is adequately capitalised for
at least next 12-18 months. In our assumptions, we factor in the next capital
raising in FY21E (the management has indicated capital raising on tier I
nearing 13% ahead).
Exhibit 51: Capital adequacy remains comfortable
15.5 15.514.6
13.2
16.1
14.213.7
0
4
8
12
16
20
FY14 FY15 FY16 FY17 FY18 FY19E FY20E
Tier I (%)
Source: Company, ICICI Direct Research
Proportion of non-auto segment to increase ahead
MMFS started business as an auto financier and gradually ventured into
allied business of SME and home finance to rural customers. Understanding
of rural markets and its customer behaviour provide MMFS with an
opportunity in allied businesses. Though the customer segment remains the
same, the company is able to diversify its product portfolio. In FY13, non-
auto business contributed ~3% of consolidated AUM, which increased to
~20.6% in FY18, led by faster growth in SME and home finance segment.
The management aims to increase contribution from the non-auto business
further to ~35-40% ahead. We expect faster growth in SME as well as home
finance segment to continue, thereby witnessing an increase in proportion
to ~25.1% of AUM in FY21E.

ICICI Securities | Retail Research 26
ICICI Direct Research
Initiating Coverage | M&M Financial Services
Exhibit 52: AUM mix comparison of auto and non-auto loans
92% 90% 87% 83%79% 78% 77% 75%
8% 10% 13% 17%21% 22% 23% 25%
0%
20%
40%
60%
80%
100%
FY14 FY15 FY16 FY17 FY18 FY19E FY20E FY21E
Auto-finance Non-Auto finance
Source: Company, Crisil Research, ICICI Direct Research
Mahindra Insurance Brokers Ltd
MMFS offers insurance broking through its subsidiary - Mahindra Insurance
Brokers (MIBL). Started in 2004 as a wholly-owned subsidiary, currently
MMFS holds ~80% stake in the company. This company is engaged in
insurance broking for both life and non-life products, especially targeting
rural customers. Currently, it has 1063 employees covering ~two lakh
villages. It has served ~1 crore insurance cases for both life and non-life
insurance, covering mostly rural markets. In 9MFY19, MIBL’s profits grew
~46% YoY to | 44.8 crore. With focus on enhancing rural reach and launch
more products suitable to rural India, we expect premium to grow at ~23%
CAGR in FY18-21E with PAT increasing at ~23% CAGR to | 101 crore in
FY21E.
Mahindra Rural Housing Finance Ltd
MMFS undertakes rural housing finance business through its subsidiary -
Mahindra Rural Housing Finance (MRHFL). Currently, MMFS holds ~88.75%
stake in the venture, with the balance held by NHB and MRHFL Employee
Welfare Trust. Incorporated in 2008, MRHFL addresses rising demand for
home finance in rural areas thereby filling the void of organised housing
finance in rural segment. Majority of loans disbursed are to customers in
villages with an average annual household income of ~| 1.5-1.9 lakh. As of
December 31, 2018, MRHFL has outstanding loan book of | 7301 crore with
PAT reported at | 168.5 crore in 9MFY19. With housing shortage in rural
areas estimated at ~4.4 crore (Ministry of Rural Development) and the
government’s focus through ‘Housing for all’ schemes along with interest
subventions, there is huge scope for growth. Growth in advances and
profitability is expected at ~30% CAGR in FY18-21E to | 13,187 crore and
| 341 crore, respectively.

ICICI Securities | Retail Research 27
ICICI Direct Research
Initiating Coverage | M&M Financial Services
Financials
For MMFS, its performance in FY11-14, has been healthy with advances growth upwards of 25% YoY, steady
GNPA at ~3-4% & RoA of ~3%. However, two bad monsoons in FY15-16 adversely impacted the performance
trajectory on all fronts impacting RoA. A revival in monsoon from FY18 has led to a pick-up in growth as well as
asset quality, thereby leading to a rise in RoA from ~1% in FY17 to ~2.5% in FY18. Growth momentum is seen
remaining healthy at 19.9% CAGR in FY19-21E to | 94996 crore. Steady margin at ~8%, improvement in
productivity (opex to AUM at 2.9-3%) & moderation in slippages are expected to lead to healthy growth in earnings
at 24.7% CAGR in FY19-21E to | 2089 crore.
Exhibit 53: Traction in gross AUM to remain strong at ~20-25% ahead
34,13336,878
40,933
46,778
55,101
67,505
81,369
94,996
8.0
11.0
14.3
17.8
22.5
20.5
16.7
0
5
10
15
20
25
0
15,000
30,000
45,000
60,000
75,000
90,000
105,000
FY14 FY15 FY16 FY17 FY18 FY19E FY20E FY21E
(%)(| crore)
Gross AUM AUM growth (%)
Source: Company, ICICI Direct Research
Exhibit 54: Growth in NII to remain healthy
27343039
3214 3316
3834
4776
5831
7020
-3
8
19
30
0
1500
3000
4500
6000
7500
FY14 FY15 FY16 FY17 FY18 FY19E FY20E FY21E
(%)| crore
Net Interest Income NII growth (%)
Source: Company, ICICI Direct Research
Exhibit 55: Margin trends to remain broadly steady
10.16 9.72
9.24
8.38 8.20 8.71 8.46 8.60
0
3
6
9
12
FY14 FY15 FY16 FY17 FY18 FY19E FY20E FY21E
(%)
NIM
Source: Company, ICICI Direct Research
Exhibit 56: Asset quality trend to improve
1406
2100
3224
4183
4698.75293
5793
6389
4.4
5.9
8.0
9.08.5
7.8
7.16.7
0
2
4
6
8
10
0
1000
2000
3000
4000
5000
6000
7000
FY14 FY15 FY16 FY17 FY18 FY19E FY20E FY21E
(%)(| crore)
Axis TitleGNPA GNPA ratio (%)
Source: Company, ICICI Direct Research
Exhibit 57: NPA moderation, productivity to lead to higher RoA
22.0 22.8
24.2
18.8
15.5
11.4
6.4
11.3
13.3 14.8 15.1
4.4 4.1 4.2 3.3
2.7 1.9 1.0 1.9 2.2 2.3 2.4
0
10
20
30
FY11 FY12 FY13 FY14 FY15 FY16 FY17 FY18 FY19E FY20E FY21E
(%)
ROE (%) ROA (%)
Source: Company, ICICI Direct Research
ICICI Securities | Retail Research 28
ICICI Direct Research
Initiating Coverage | M&M Financial Services
Risks and concerns
Dependence on monsoon weighs on rural financing business
MMFS, being focused on rural financing, has a substantial proportion of
loans to borrowers wherein dependency on agriculture is high. Deficient
monsoon and emergence of drought situation in key states could strain
recovery and asset quality. In FY15-16, two consecutive years of poor
monsoon led to a surge in GNPA from 4.4% in FY14 to 9% in FY17. Thus,
irregularity in monsoon cycle could impact asset quality as well as
profitability.
Continuity of management team, skilled personnel
The company’s performance is highly dependent on the continued services
of its management team. In particular, this includes the efforts of its
Managing Director & CEO along with other experienced members of its
Board of Directors & senior management. Ramesh Iyer has been the
Managing Director of the company with effect from April 30, 2001 and has
been associated with the company since inception. Any loss of a key
personnel or inability to replace key personnel may restrict its ability to grow
and manage the overall running of operations.
Cyclical nature of business
MMFS is a leading vehicle financer, present mainly in the rural and semi-
urban areas. Thus, the business model is highly cyclical and subject to the
vagaries of the rural economy. Though MMFS has a successful track record
in terms of business growth, volatility in earnings cannot be ruled out. MMFS
has started its housing finance business to diversify its AUM. However, with
the target customer category remaining the same, the risk associated with
the rural business cycle continues to remain inherent.
Captive nature of business
MMFS, being a captive auto financier, is engaged in financing the parent’s
vehicles. As of 9MFY19, parent M&M contributes ~ 44% of AUM. Such high
dependence on parent adds an advantage in up-cycle but acts as a deterrent
in the down cycle. In addition, it limits the ability of MMFS to alter its AUM
mix to suit business cycles.
Slowdown in auto volume may impact growth, earnings
With ~86% of AUM comprising auto finance, growth and earnings are
substantially impacted by a change in factors of cost of ownership – price of
vehicle, fuel price, interest rates and insurance cost. Though the velocity of
impact varies across product segment, the overall impact is there. For
example, HCV sales witnessed healthy growth in FY16-18, led by strong
growth in rural economy, improved road construction, etc. However, a
sudden spike in fuel price and elevated interest rates put the brakes on its
momentum. Such a slowdown in volume growth in the auto segment is
expected to impact the momentum of advances, thereby impacting its
earnings trajectory.

ICICI Securities | Retail Research 29
ICICI Direct Research
Initiating Coverage | M&M Financial Services
Valuation
Valuation premium to sustain ahead
MMFS possesses the ingredients to sustainably command premium
valuation - 1) rural reach providing huge opportunity with pricing power, 2)
robust AUM growth (AUM, earnings CAGR of 20%, 25%, respectively, in
FY18-21E), 3) higher rural income led by farm loan waivers and cash flow
receipt during election, 4) strong management and 5) adequate risk
management with limited losses. Valuing core auto business at 2.6x FY21E
ABV (1.8x FY21E BV) and adding | 50 as value for subsidiaries (at 20%
holdco discount), we initiate coverage with a BUY rating and target price of
| 500 per share.
We expect NII to grow at 25.7% CAGR in FY18-21E to | 7020 crore while
PAT is expected to grow at CAGR of 24.7% over the same period to | 2089
crore. Margins are expected to be in the region of ~8% by FY21E.
Considering slow auto sales by OEMs and tight liquidity environment, we
expect strong players like MMFS to capture market share and, thereby,
continue to grow AUM. The positive ALM position indicates MMFS is
relatively immune to liquidity shocks (positive ALM in shorter tenure
buckets) though rise in CoF is expected to keep margins steady. Capital
adequacy remain strong at 19.4%. We factor in capital raising in FY21E to
fund balance sheet growth.
Exhibit 58: MMFS trading at ~1.9x one year forward P/B, near its lower range of 1.6x
0
100
200
300
400
500
600
Sep-11 Sep-12 Sep-13 Sep-14 Sep-15 Sep-16 Sep-17 Sep-18
(|)
Price 3.0x 2.5x 2.0x 1.8x 1.5x
Source: Company, Capital line, ICICI Direct Research
Exhibit 59: PE bands (one year forward basis)
0
100
200
300
400
500
600
700
Sep-11 Sep-12 Sep-13 Sep-14 Sep-15 Sep-16 Sep-17 Sep-18
(|)
Price 18.0x 16.0x 14.0x 12.0x 10.0x
Source: Company, Capital line, ICICI Direct Research
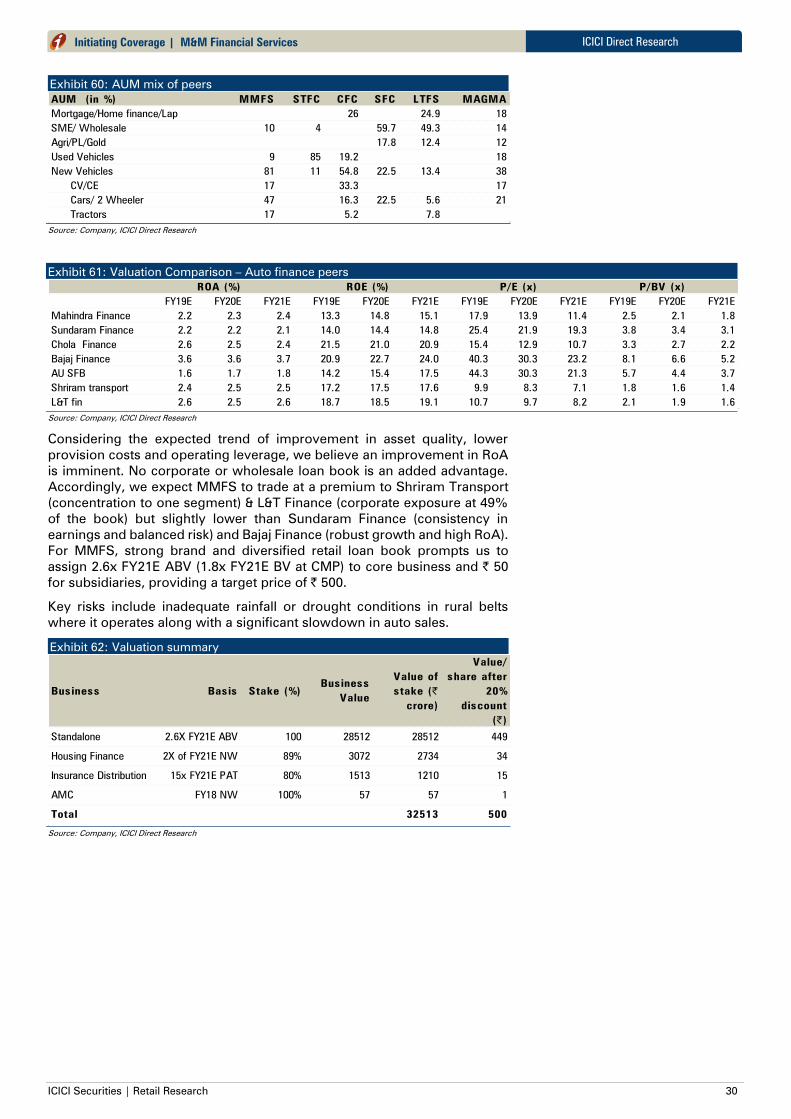
ICICI Securities | Retail Research 30
ICICI Direct Research
Initiating Coverage | M&M Financial Services
Exhibit 60: AUM mix of peers
AUM (in %) MMFS STFC CFC SFC LTFS MAGMA
Mortgage/Home finance/Lap 26 24.9 18
SME/ Wholesale 10 4 59.7 49.3 14
Agri/PL/Gold 17.8 12.4 12
Used Vehicles 9 85 19.2 18
New Vehicles 81 11 54.8 22.5 13.4 38
CV/CE 17 33.3 17
Cars/ 2 Wheeler 47 16.3 22.5 5.6 21
Tractors 17 5.2 7.8
Source: Company, ICICI Direct Research
Exhibit 61: Valuation Comparison – Auto finance peers
ROA (%) ROE (%) P/E (x) P/BV (x)
FY19E FY20E FY21E FY19E FY20E FY21E FY19E FY20E FY21E FY19E FY20E FY21E
Mahindra Finance 2.2 2.3 2.4 13.3 14.8 15.1 17.9 13.9 11.4 2.5 2.1 1.8
Sundaram Finance 2.2 2.2 2.1 14.0 14.4 14.8 25.4 21.9 19.3 3.8 3.4 3.1
Chola Finance 2.6 2.5 2.4 21.5 21.0 20.9 15.4 12.9 10.7 3.3 2.7 2.2
Bajaj Finance 3.6 3.6 3.7 20.9 22.7 24.0 40.3 30.3 23.2 8.1 6.6 5.2
AU SFB 1.6 1.7 1.8 14.2 15.4 17.5 44.3 30.3 21.3 5.7 4.4 3.7
Shriram transport 2.4 2.5 2.5 17.2 17.5 17.6 9.9 8.3 7.1 1.8 1.6 1.4
L&T fin 2.6 2.5 2.6 18.7 18.5 19.1 10.7 9.7 8.2 2.1 1.9 1.6
Source: Company, ICICI Direct Research
Considering the expected trend of improvement in asset quality, lower
provision costs and operating leverage, we believe an improvement in RoA
is imminent. No corporate or wholesale loan book is an added advantage.
Accordingly, we expect MMFS to trade at a premium to Shriram Transport
(concentration to one segment) & L&T Finance (corporate exposure at 49%
of the book) but slightly lower than Sundaram Finance (consistency in
earnings and balanced risk) and Bajaj Finance (robust growth and high RoA).
For MMFS, strong brand and diversified retail loan book prompts us to
assign 2.6x FY21E ABV (1.8x FY21E BV at CMP) to core business and | 50
for subsidiaries, providing a target price of | 500.
Key risks include inadequate rainfall or drought conditions in rural belts
where it operates along with a significant slowdown in auto sales.
Exhibit 62: Valuation summary
Business Basis Stake (%)
Business
Value
Value of
stake (|
crore)
Value/
share after
20%
discount
(|)
Standalone 2.6X FY21E ABV 100 28512 28512 449
Housing Finance 2X of FY21E NW 89% 3072 2734 34
Insurance Distribution 15x FY21E PAT 80% 1513 1210 15
AMC FY18 NW 100% 57 57 1
Total 32513 500
Source: Company, ICICI Direct Research

ICICI Securities | Retail Research 31
ICICI Direct Research
Initiating Coverage | M&M Financial Services
Exhibit 63: Peer comparison – auto finance
FY18 (| crore) MMFS CFC STFC SFC L&T Fin Magma
Total Income 4206 3118 6904 1414 5080 2217
Pre-provisioning profit 2534 1828 5354 869 3904 568
Net profit 827 974 1428 533 1459 232
Networth 9303 5150 12572 3971 13584 2319
AUM 55101 42879 95306 28648 65932 15555
Yields and margins (%)
Yield on AUMs 13.5 13.7 13.9 12.5 12.3 13.5
Cost of borrowings 8.1 8.2 9.2 8.0 7.1 9.1
Spread 5.4 7.5 4.7 4.5 5.2 4.4
NIM on AUM (%) 7.6 6.3 7.8 4.3 4.9 7.7
Operating efficiencies
Cost to income ratio (%) 39.7 41.1 22.5 38.5 23.2 50.3
Op.costs/avg AUM (%) 3.3 3.0 1.8 2.1 1.8 4.4
Asset quality and provisioning
GNPL 4699 1210 7376 370 3884 1089
NNPL 1971 654 2131 129 1845 809
GNPL (% of loans) 8.5 2.9 9.2 1.3 4.8 7.0
NNPL (% of loans) 3.8 1.7 2.8 0.5 2.3 5.2
Coverage ratio (%) 58.1 43.5 71.1 65.1 52.5 27.2
Per share data
BVPS (FY18) 151 329 554 357 63 98
BVPS (FY19E) 171 390 646 400 67 102
BVPS (FY20E) 195 463 755 451 79 114
ABVPS (FY18) 119 303 460 346 54 64
ABVPS (FY19E) 140 361 524 385 57 68
ABVPS (FY20E) 158 428 623 434 70 80
Du Pont Analysis (on average AUM)
Interest earned 13.5 12.3 13.9 9.1 12.0 14.2
Interest expended 5.9 6.0 6.2 4.9 7.1 5.7
Total income 8.3 5.4 7.9 5.4 6.8 8.8
Employee expenses 1.7 3.3 0.8 2.1 0.7 2.3
Provisions 2.4 0.9 3.6 0.2 2.4 2.4
Pre-tax earnings 2.6 3.9 2.6 3.1 2.8 2.0
RoA (%) 1.6 2.5 1.6 2.0 1.8 1.5
Leverage 6.5 8.2 7.3 6.8 5.7 6.9
RoE 10.5 20.8 12.0 13.8 15.0 10.4
Source: Company, ICICI Direct Research
Exhibit 64: Valuation Comparison – Home finance peers
ROA (%) ROE (%) P/E (x) P/BV (x)
FY18 FY19E FY20E FY18 FY19E FY20E FY18 FY19E FY20E FY18 FY19E FY20E
HDFC 2.3 2.2 2.2 14.9 15.2 16.0 33.5 29.5 25.2 4.7 4.3 3.9
LICHF 1.3 1.3 1.3 16.4 16.4 16.6 9.8 8.5 7.4 1.5 1.3 1.1
IHFL 3.0 3.1 3.0 26.5 26.1 24.9 6.5 5.7 5.5 1.6 1.4 1.3
PNBHF 1.5 1.5 1.5 15.2 16.5 17.2 14.6 11.7 8.9 2.1 1.8 1.5
GRUH 2.4 2.4 2.5 27.5 26.5 27.0 42.8 37.3 30.4 10.9 9.2 7.6
Repco 2.3 2.2 2.2 16.6 16.2 16.3 9.6 8.4 7.2 1.5 1.3 1.1
Source: Company, ICICI Direct Research

ICICI Securities | Retail Research 32
ICICI Direct Research
Initiating Coverage | M&M Financial Services
Exhibit 65: RoA decomposition
FY16 FY17 FY18 FY19E FY20E FY21E
Interest Earned 14.5% 14.0% 13.0% 14.0% 14.1% 14.3%
Interest Expended 6.8% 6.5% 6.1% 6.2% 6.3% 6.3%
Net Interest Income 7.7% 7.5% 6.9% 7.8% 7.8% 8.0%
Non Interest Income 0.7% 0.2% 0.1% 0.1% 0.1% 0.1%
Net Income 8.4% 7.7% 7.1% 7.9% 7.9% 8.1%
Staff cost 1.4% 1.6% 1.6% 1.8% 1.7% 1.6%
Other Operating expense 1.6% 1.8% 1.2% 1.2% 1.3% 1.4%
Opex 3.0% 3.3% 2.8% 3.0% 2.9% 2.9%
Operating profit 5.4% 4.4% 4.3% 4.9% 5.0% 5.1%
Provisions 2.7% 3.0% 1.1% 1.6% 1.5% 1.5%
PBT 2.7% 1.4% 3.1% 3.3% 3.5% 3.6%
Taxes 0.9% 0.5% 1.2% 1.2% 1.2% 1.3%
RoA 1.7% 0.9% 2.1% 2.2% 2.3% 2.4%
Leverage 6.6 7.0 6.5 6.2 6.5 6.4
RoE 11.4% 6.4% 13.6% 13.3% 14.8% 15.1%
Source: Company, ICICI Direct Research
Exhibit 66: Financial Summary
Key Financials FY17 FY18 FY19E FY20E FY21E
Net profit (| Crore) 400 1076 1325 1704 2089
EPS (|) 7.1 18.5 21.6 27.7 32.9
BV (|) 113.9 151.4 172.9 200.7 243.0
P/BV (|) 3.8 2.9 2.5 2.2 1.8
ABV (|) 86.3 97.3 117.0 138.9 176.6
P/E (x) 61.9 23.7 20.3 15.8 13.3
P/ABV (x) 5.1 4.5 3.7 3.2 2.5
ROA (%) 1.0 1.9 2.2 2.3 2.4
ROE (%) 6.4 11.3 13.3 14.8 15.1
Source: Company, ICICI Direct Research

ICICI Securities | Retail Research 33
ICICI Direct Research
Initiating Coverage | M&M Financial Services
Financial Summary
Exhibit 67: Profit & Loss Statement
(| Crore) FY16 FY17 FY18 FY19E FY20E FY21E
Interest Earned 5647 6130 6630 8569 10508 12570
Interest Expended 2639 2857 3096 3793 4677 5550
Net Interest Income 3008 3273 3534 4776 5831 7020
Non Interest Income 258 107 59 67 79 97
Net Income 3266 3380 3593 4843 5910 7117
Staff cost 559 681 833 1083 1235 1400
Other Operating expense 619 770 591 758 952 1198
Operating profit 2088 1929 2170 3003 3723 4519
Provisions 1050 1309 568 965 1102 1306
PBT 1038 620 1602 2038 2621 3213
Taxes 366 220 591 713 917 1125
Net Profit 673 400 1076 1325 1704 2089
EPS (|) 11.91 7.08 18.52 21.56 27.72 32.92
Source: Company, ICICI Direct Research
Exhibit 68: Balance sheet
(| Crore) FY16 FY17 FY18 FY19E FY20E FY21E
Sources of Funds
Capital 113 113 123 123 123 127
Reserves and Surplus 5975 6364 9180 10505 12208 15293
Networth 6088 6477 9303 10628 12331 15420
Borrowings 29440 33670 39556 48648 58864 68723
Current liabilities & Provision 4051 5838 5509 6749 8285 8969
Total 39579 45985 54368 66024 79481 93112
Applications of Funds
Fixed Assets 113 112 120 168 184 203
Investments 1483 1890 1873 2000 2410 2814
Advances 36658 42523 51004 62486 75319 87933
Other Assets 736 984 960 841 859 899
Cash with RBI & call money 589 476 411 531 709 1263
Total 39579 45985 54368 66024 79481 93112
Source: Company, ICICI Direct Research
Exhibit 69: Key Ratios
(Year-end March) FY16 FY17 FY18 FY19E FY20E FY21E
Valuation
No. of Equity Shares (Crore) 56.5 56.5 61.5 61.5 61.5 63.5
EPS (Rs.) 11.9 7.1 18.5 21.6 27.7 32.9
BV (Rs.) 107.0 113.9 151.4 172.9 200.7 243.0
ABV (Rs.) 86.0 86.3 97.3 117.0 138.9 176.6
P/E 36.8 61.9 23.7 20.3 15.8 13.3
P/BV 4.1 3.8 2.9 2.5 2.2 1.8
P/ABV 5.1 5.1 4.5 3.7 3.2 2.5
Yields & Margins (%)
Net Interest Margins 9.2 8.4 7.6 8.7 8.5 8.6
Yield on Gross AUM 16.2 15.5 14.2 15.1 15.3 15.4
Cost of borrowing 9.5 9.1 8.5 8.6 8.7 8.7
Quality and Efficiency (%)
GNPA 8.0 9.0 8.5 7.8 7.1 6.7
NNPA 3.2 3.6 3.8 5.1 4.7 4.4
ROE 11.4 6.4 13.6 13.3 14.8 15.1
Return on Gross AUM 1.9 1.0 2.1 2.2 2.3 2.4
Source: Company, ICICI Direct Research

ICICI Securities | Retail Research 34
ICICI Direct Research
Initiating Coverage | M&M Financial Services
RATING RATIONALE
ICICI Direct endeavours to provide objective opinions and recommendations. ICICI Direct assigns ratings to its
stocks according to their notional target price vs. current market price and then categorises them as Strong Buy,
Buy, Hold and Sell. The performance horizon is two years unless specified and the notional target price is defined
as the analysts' valuation for a stock
Buy: >10%/15% for large caps/midcaps, respectively;
Hold: Up to +/-10%;
Sell: -10% or more;
Pankaj Pandey Head – Research [email protected]
ICICI Direct Research Desk,
ICICI Securities Limited,
1st Floor, Akruti Trade Centre,
Road No 7, MIDC,
Andheri (East)
Mumbai – 400 093
ICICI Securities | Retail Research 35
ICICI Direct Research
Initiating Coverage | M&M Financial Services
ANALYST CERTIFICATION
We /I, Kajal Gandhi, CA, Vishal Narnolia, MBA and Harsh Shah, MBA, Research Analysts, authors and the names subscribed to this report, hereby certify that all of the views expressed in this
research report accurately reflect our views about the subject issuer(s) or securities. We also certify that no part of our compensation was, is, or will be directly or indirectly related to the
specific recommendation(s) or view(s) in this report. It is also confirmed that above mentioned Analysts of this report have not received any compensation from the companies mentioned in
the report in the preceding twelve months and do not serve as an officer, director or employee of the companies mentioned in the report.
Terms & conditions and other disclosures:
ICICI Securities Limited (ICICI Securities) is a full-service, integrated investment banking and is, inter alia, engaged in the business of stock brokering and distribution of financial products. ICICI
Securities Limited is a Sebi registered Research Analyst with Sebi Registration Number – INH000000990. ICICI Securities Limited Sebi Registration is INZ000183631 for stock broker. ICICI
Securities is a subsidiary of ICICI Bank which is India’s largest private sector bank and has its various subsidiaries engaged in businesses of housing finance, asset management, life insurance,
general insurance, venture capital fund management, etc. (“associates”), the details in respect of which are available on www.icicibank.com
ICICI Securities is one of the leading merchant bankers/ underwriters of securities and participate in virtually all securities trading markets in India. We and our associates might have investment
banking and other business relationship with a significant percentage of companies covered by our Investment Research Department. ICICI Securities generally prohibits its analysts, persons
reporting to analysts and their relatives from maintaining a financial interest in the securities or derivatives of any companies that the analysts cover.
The information and opinions in this report have been prepared by ICICI Securities and are subject to change without any notice. The report and information contained herein is strictly
confidential and meant solely for the selected recipient and may not be altered in any way, transmitted to, copied or distributed, in part or in whole, to any other person or to the media or
reproduced in any form, without prior written consent of ICICI Securities. While we would endeavour to update the information herein on a reasonable basis, ICICI Securities is under no
obligation to update or keep the information current. Also, there may be regulatory, compliance or other reasons that may prevent ICICI Securities from doing so. Non-rated securities indicate
that rating on a particular security has been suspended temporarily and such suspension is in compliance with applicable regulations and/or ICICI Securities policies, in circumstances where
ICICI Securities might be acting in an advisory capacity to this company, or in certain other circumstances.
This report is based on information obtained from public sources and sources believed to be reliable, but no independent verification has been made nor is its accuracy or completeness
guaranteed. This report and information herein is solely for informational purpose and shall not be used or considered as an offer document or solicitation of offer to buy or sell or subscribe
for securities or other financial instruments. Though disseminated to all the customers simultaneously, not all customers may receive this report at the same time. ICICI Securities will not treat
recipients as customers by virtue of their receiving this report. Nothing in this report constitutes investment, legal, accounting and tax advice or a representation that any investment or strategy
is suitable or appropriate to your specific circumstances. The securities discussed and opinions expressed in this report may not be suitable for all investors, who must make their own
investment decisions, based on their own investment objectives, financial positions and needs of specific recipient. This may not be taken in substitution for the exercise of independent
judgment by any recipient. The recipient should independently evaluate the investment risks. The value and return on investment may vary because of changes in interest rates, foreign
exchange rates or any other reason. ICICI Securities accepts no liabilities whatsoever for any loss or damage of any kind arising out of the use of this report. Past performance is not necessarily
a guide to future performance. Investors are advised to see Risk Disclosure Document to understand the risks associated before investing in the securities markets. Actual results may differ
materially from those set forth in projections. Forward-looking statements are not predictions and may be subject to change without notice.
ICICI Securities or its associates might have managed or co-managed public offering of securities for the subject company or might have been mandated by the subject company for any other
assignment in the past twelve months.
ICICI Securities or its associates might have received any compensation from the companies mentioned in the report during the period preceding twelve months from the date of this report
for services in respect of managing or co-managing public offerings, corporate finance, investment banking or merchant banking, brokerage services or other advisory service in a merger or
specific transaction.
ICICI Securities or its associates might have received any compensation for products or services other than investment banking or merchant banking or brokerage services from the companies
mentioned in the report in the past twelve months.
ICICI Securities encourages independence in research report preparation and strives to minimize conflict in preparation of research report. ICICI Securities or its associates or its analysts did
not receive any compensation or other benefits from the companies mentioned in the report or third party in connection with preparation of the research report. Accordingly, neither ICICI
Securities nor Research Analysts and their relatives have any material conflict of interest at the time of publication of this report.
Compensation of our Research Analysts is not based on any specific merchant banking, investment banking or brokerage service transactions.
ICICI Securities or its subsidiaries collectively or Research Analysts or their relatives do not own 1% or more of the equity securities of the Company mentioned in the report as of the last day
of the month preceding the publication of the research report.
Since associates of ICICI Securities are engaged in various financial service businesses, they might have financial interests or beneficial ownership in various companies including the subject
company/companies mentioned in this report.
ICICI Securities may have issued other reports that are inconsistent with and reach different conclusion from the information presented in this report.
Neither the Research Analysts nor ICICI Securities have been engaged in market making activity for the companies mentioned in the report.
We submit that no material disciplinary action has been taken on ICICI Securities by any Regulatory Authority impacting Equity Research Analysis activities.
This report is not directed or intended for distribution to, or use by, any person or entity who is a citizen or resident of or located in any locality, state, country or other jurisdiction, where such
distribution, publication, availability or use would be contrary to law, regulation or which would subject ICICI Securities and affiliates to any registration or licensing requirement within such
jurisdiction. The securities described herein may or may not be eligible for sale in all jurisdictions or to certain category of investors. Persons in whose possession this document may come
are required to inform themselves of and to observe such restriction.