Mapping!flexible!packaging! in!a!Circular!Economy! · PDF file- Confidential - 3...
127
PDEng ' Chemical Product Design Individual Design Project IDP.CPD.007.16 Mapping flexible packaging in a Circular Economy [F.I.A.C.E] Final Report Author: Aurélie Nonclercq MSc. Delft University of Technology Supervisors: Graham Houlder Sloop Consulting Prof. dr. ir. Peter Rem Delft University of Technology Ir. Pieter Swinkels Delft University of Technology Dr.ir. Peter Daudey Delft University of Technology Keywords: Flexible packaging, Circular Economy, Recycling Date issued: 14 October 2016
Transcript of Mapping!flexible!packaging! in!a!Circular!Economy! · PDF file- Confidential - 3...

!!!!!!!!!!!!!!!!!!!!!!!!!!!!!!!!!!!!!!!!!!!!!!!!!!!!!!!!!!!!!!!!!!!!!!!!!!!!!!!!!!!!!!!!!!!!!!!!!!!!!!!!!!!!!!!!!!!!!!!!!!!!!!!!!!!!!!!!!!!!!!!!!!!!!!!!!!!!!!!!!!!!!!!!!!!!!!!!!!!!!!!!!!!!!!!!!!!!!!!!!!!!!!!!!!!!!!!!!!!!!!!!!!!!!!!!!!!!!!!!!!!!!!!!!!!!!!!!!!!!!!!!!!!!!!!!!!!!!!!!!!!!!!!!!!!!!!!!!!!!!!!!!!!!!!!!!!!!!!!!!!!!!!!!!!!!!!!!!!!!!!!!!!!!!!!!!!!!!!!!!!!!!!!!!!!!!!!!!!!!!!!!!!!!!!!!!!!!!!!!!!!!!!!!!!!!!!!!!!!!!!!!!!!!!!!!!!!!!!!!!!!!!!!!!!!!!!!!!!!!!!!!!!!!!!!!!!!!!!!!!!!!!!!!!!!!!!!!!!!!!!!!!!!!!!!!!!!!!!!!!!!!!!!!!!!!!!!!!!!!!!!!!!!!!!!!!!!!!!!!!!!!!!!!!!!!!!!!!!!!!!!!!!!!!!!!!!!!!!!!!!!!!!!!!!!!!!!!!!!!!!!!!!!!!!!!!!!!!!!!!!!!!!!!!!!!!!!!!!!!!!!!!!!!!!!!!!!!!!!!!!!!!!!!!!!!!!!!!!!!!!!!!!!!!!!!!!!!!!!!!!!!!!!!!!!!!!!!!!!!!!!!!!!!!!!!!!!!!!!!!!!!!!!!!!!!!!!!!!!!!!!!!!!!!!!!!!!!!!!!!!!!!!!!!!!!!!!!!!!!!!!!!!!!!!!!!!!!!!!!!!!!!!!!!!!!!!!!!!!!!!!!!!!!!!!!!!!!!!!!!!!!!!!!!!!!!!!!!!!!!!!!!!!!!!!!!!!!!!!!!!!!!!!!!!!!!!!!!!!!!!!!!!!!!!!!!!!!!!!!!!!!!!!!!!!!!!!!!!!!!!!!!!!!!!!!!!!!!!!!!!!!!!!!!!!!!!!!!!!!!!!!!!!!!!!!!!!!!!!!!!!!!!!!!!!!!!!!!!!!!!!!!!!!!!!!!!!!!!!!!!!!!!!!!!!!!!!!!!!!!!!!!!!!!!!!!!!!!!!!!!!!!!!!!!!!!!!!!!!!!!!!!!!!!!!!!!!!!!!!!!!!!!!!!!!!!!!!!!!!!!!!!!!!!!!!!!!!!!!!!!!!!!!!!!!!!!!!!!!!!!!!!!!!!!!!!!!!!!!!!!!!!!!!!!!!!!!!!!!!!!PDEng!'!Chemical!Product!Design!!Individual!Design!Project! IDP.CPD.007.16!!!
Mapping!flexible!packaging!in!a!Circular!Economy!
[F.I.A.C.E]!!!Final!Report!!!Author:!Aurélie!Nonclercq!MSc.! Delft!University!of!Technology!! !! !!!!Supervisors:!Graham!Houlder! Sloop!Consulting!!Prof.!dr.!ir.!Peter!Rem! Delft!University!of!Technology!Ir.!Pieter!Swinkels! Delft!University!of!Technology!Dr.ir.!Peter!Daudey! Delft!University!of!Technology!! !! !!!Keywords:!Flexible!packaging,!Circular!Economy,!Recycling!!Date!issued:!14!October!2016!!

- Confidential -
2
Preface
Delft University of Technology considers its role in society as supplying technological solutions that
help people lead increasingly sustainable lives in a prospering economy. Collaboration with significant
players in society is an integral part of the ambition and strategy of TU Delft. In that light, the university
joined the Ellen MacArthur Foundation as one of the five pioneer universities in 2013, to help the
transition from a linear economy (“take, make, dispose”) to a Circular Economy.
Based on this growing interest in Circular Economy, I was encouraged to undertake an individual design
project in that direction in order to complete my Professional Doctorate in Engineering (PDEng). It was
deemed important to look at one global challenge: (flexible) packaging. The increasingly global
consumption of Fast Moving Consumer Goods in a linear economy combined with a growing and
increasingly affluent worldwide population already leads to an enormous amount of packaging waste,
both in terms of volume and economic value. Thus the initial idea was to re-design a packaging to
improve the end of life possibilities to further close the loop.
By contacting relevant parties prior to the project started, it became quite clear that there is a
misconception by consumers and governments that the difficulties in recycling flexible packaging
preclude it from being relevant in a Circular Economy. The misconceptions include:
•! Flexible packaging is predominantly multi-material
•! Flexible packaging cannot be recycled
Consequently, emphasis in the report has also been on presenting facts that correct these
misperceptions, on capturing how it adds value in a Circular Economy, and on finding solutions to
further close the loop via mechanical recycling.

- Confidential -
3
Acknowledgement
First of all, I would like to convey my sincere gratitude to Graham Houlder; for initiating the work on
mapping flexible packaging in a Circular Economy, for developing the project, for his extended network
and his excellent coordination skills. Without his effort, this project would have never come to light.
Furthermore I would like to thank him for his guidance and supervision, it was a pleasure to work with
him.
I would also like to thank all the stakeholder participants Nina Ackermans (Borealis), Isabel Arroyo
(Dow), Dennis Bankmann (Henkel), Thomas Boucoiran (Siegwerk), Robert Corijn (Attero), Jean-Paul
Duquet (Flexible Packaging Europe), Christian Goetzloff (Borealis), Fabienne Goosens (Attero), Thomas
Greigeritsch (Constantia), Thomas Gröner (Mondi), Sokhna Gueye (Nestlé), Karlheinz Hausmann
(DuPont), Matthias Klauser (Bosch), Horst Kürrer (Mondi), Louis Lindenberg (Unilever), Lars Lundquist
(Nestlé), Tristan Merk (Tönsmeier), Andreas Michalsky (Huhtamaki), Severine Mongauze (Unilever),
Dana Mosora (Dow), Michael Scriba (Mtm Plastics/Borealis), Jaap van de Hoek (Urban Mining Corp) for
their considerable input, for sharing their knowledge openly in rich discussions, for investing their
valuable time and also for their financial support to the project.
Additionally, thanks to my TU Delft supervisors Peter Daudey, Pieter Swinkels and Peter Rem for their
impact in the project. !

- Confidential -
4
Summary
In the context of a Circular Economy where high recycling rates are regarded as a requirement, the perceived difficulty to recycle flexible packaging could preclude it from being considered a relevant packaging solution. The purpose of this project was to capture the facts supporting the value added by flexible packaging in a European Circular Economy, and to identify the challenges and the opportunities to increase this added value by closing the loop through pack and system design hereby increasing the quantities and quality of flexible packaging that are mechanically recycled. To realise these objectives, a dual approach was adopted. First, an extensive desktop study was carried out to find and collect evidence in the literature. Secondly, 17 stakeholders, major players from all parts of the European flexible packaging supply chain, contributed to the project by sharing their knowledge, expertise and experience to identify the challenges and to validate potential solutions to further increase the recyclability of flexible packaging. The project concluded that flexible packaging clearly adds significant value in a circular economy prior to it becoming waste and that it typically uses less resources than alternative functionally equivalent packaging formats. This added value can be further improved if more flexible packaging is collected, recycled and the resources usefully redeployed. The examples studied demonstrated this for each stage of the value chain. This is specifically due to its highly efficient use of materials (i.e. resource efficiency) enabling it to prevent packaging material usage whilst optimising food waste reduction. Most often this waste prevention benefit translated into both an economic benefit and a reduced environmental impact. Other major insights from the project were:
•! Data available from studies in two European countries implies that approximately 80% of the flexible packaging is mono-material making it potentially recyclable via the existing infrastructure for recycling conventional plastics. Provided it can be effectively sorted out from the remaining c.a. 20% multi-material flexible packaging.
•! It was concluded that secondary plastics from flexible packaging would find suitable value adding end markets in non-food injection moulding applications provided sufficient quantities at consistent quality are available at an appropriate price relative to virgin polymers.
•! If (flexible) packaging is not collected, it cannot be recycled! Collection of flexible packaging by all European countries is a pre-condition for it to be sorted and recycled. This also applies to attracting new investment in sorting and recycling infrastructure. Collection of all flexible packaging will also contribute to preventing it from leaking into the natural environment to potentially become (marine) litter.
•! Current plastic waste sorting processes treat flexible packaging as a potential contaminant to other sorted plastic fractions and are designed to extract it from the waste stream. If it was sorted further, approximately 80% of material could potentially be diverted back into other higher value plastic fractions.
•! Design for recyclability is challenging: most packs have already been optimised for minimum material usage for a given functionality. It is not that simple to balance functionality and manufacturability with increased recyclability at a realistic cost. To do this without compromise requires input from the full value chain.
The project also generated a number of recommendations for future work, including: a detailed market analysis to confirm by country the ratio multi-material/mono-material; develop a robust methodology to quantify the value added by flexible packaging; how to identify and sort the 20% multi-material flexible packaging, and re-integrate the 80% mono-material into relevant plastic recycling streams; and the need to develop robust design guidelines for today and future.

- Confidential -
5
List of abbreviations
Abbreviation Meaning 2D – 3D Two dimensional – three dimensional ADP Abiotic Depletion Potential AlOx Aluminium Oxide BOPET Biaxially oriented polyethylene terephthalate BOPP Biaxially oriented polypropylene CaCO3 Calcium carbonate CED Cumulative Energy Demand CO2 Carbon dioxide CRD Cumulative Resource Demand DKR Deutsche Gesellschaft für Kreislaufwirtschaft und Rohstoffe mbH ECS Eddy Current Sorting EFSA European Food Safety Authority EMF Ellen MacArthur Foundation EoL End-of-life EPR Extended Producer Responsibility EVOH Ethylene vinyl alcohol FIACE Flexibles in A Circular Economy FMCGs Fast moving consumer goods FPE Flexible Packaging Europe GMP Good Manufacturing Practice GPPS Global Protocol on Packaging Sustainability GPW Global Warming Potential HDPE High density polyethylene HF Hydrogen fluoride HFFS Horizontal Form Fill Seal HoQ House of quality LCA Life cycle assessment LDPE Low density polyethylene LLDPE Low linear density polyethylene MCI Material Circularity Indicator MDS Magnetic density separation MSW Municipal solid waste Mn number-average molecular weight Mw Weight-average molecular weight NIR Near infrared O2 Oxygen OOH Out of home OPP Oriented polypropylene P&PWD Packaging and Plastic Waste Directive PA Polyamide PAYT Pay As You Throw PCL Polycaprolactone PHA Polyhydroxyalkanoates PHB Polyhydroxybutyrate PLA Polylactic acid PE Polyethylene PET Polyethylene terephthalate PP Polypropylene PUR Polyurethane PVC Polyvinylchloride RM Raw materials THF Tetrahydrofuran TiO2 Titanium dioxide TPU Thermoplastic polyurethane

- Confidential -
6
Table of contents Preface ................................................................................................................................................................................. 2!
Acknowledgement ............................................................................................................................................................. 3!
Summary .............................................................................................................................................................................. 4!
List of abbreviations ........................................................................................................................................................... 5!
Chapter 1: Introduction ...................................................................................................................................................... 8!
1.1.! Project background ......................................................................................................................................... 8!
1.2.! Project Partners ................................................................................................................................................ 9!
1.3.! Project goal and approach ........................................................................................................................... 10!
1.4.! Project scope ................................................................................................................................................. 10!
1.5.! Project challenges ......................................................................................................................................... 12!
1.6.! Project execution ........................................................................................................................................... 12!
1.7.! Report content structure ............................................................................................................................... 13!
Chapter 2: Market ............................................................................................................................................................. 15!
2.1. What is flexible packaging? ................................................................................................................................. 15!
2.2. European market for flexible packaging ............................................................................................................ 15!
2.3. Materials used in flexible packaging ................................................................................................................... 17!
2.4. Potential market opportunities for mechanically reprocessed flexible packaging (secondary materials) .... 20!
Chapter 3: Value added by flexible packaging in the supply chain ........................................................................... 23!
3.1. Flexible packaging supply chain ......................................................................................................................... 23!
3.2. Raw material utilisation ......................................................................................................................................... 24!
3.3. Savings in transportation ...................................................................................................................................... 25!
3.4. Consumption: food protection & food waste prevention ................................................................................. 26!
3.5. End-of-life: material waste prevention ................................................................................................................ 32!
3.6. Quantification of the value added ...................................................................................................................... 34!
3.7. Conclusion on the value added by flexible packaging ..................................................................................... 37!
Chapter 4: Indicators for Circular Economy .................................................................................................................. 39!
4.1. Resource and Resource Efficiency definitions .................................................................................................... 39!
4.2. Indicators for Resource Efficiency ....................................................................................................................... 39!
4.3. A new indicator in development: the Resource Efficiency indicator for packaging ....................................... 40!
4.4. Material Circularity Indicator: an indicator based on mass ............................................................................... 43!
4.5. Conclusion on the indicators for a Circular Economy ....................................................................................... 46!
Chapter 5: Mapping flexible packaging end-of-life .................................................................................................... 47!
5.1. Collection .............................................................................................................................................................. 47!
5.2. Sorting ................................................................................................................................................................... 51!
5.3. Mechanical Recycling ........................................................................................................................................... 55!
5.4. Classification of the challenges to achieve quality secondary materials ......................................................... 62!
5.5. Chapter conclusion ............................................................................................................................................... 65!
Chapter 6: Design of two packaging examples ............................................................................................................ 66!

- Confidential -
7
6.1. Design methodology ............................................................................................................................................ 66!
6.2. Design framework ................................................................................................................................................. 67!
6.3. Analysis of the two packaging examples ............................................................................................................ 69!
6.4. Stakeholders and stakeholders’ needs ............................................................................................................... 75!
6.5. Requirements and specifications ......................................................................................................................... 75!
6.6. Creating design ideas .......................................................................................................................................... 76!
6.7. Concept generation ............................................................................................................................................. 76!
6.8. Design Selection ................................................................................................................................................... 76!
6.9. Detailed design and evaluation ........................................................................................................................... 79!
Chapter 7: Knowledge gaps and recommendations for future projects .................................................................... 86!
7.1. Market analysis ...................................................................................................................................................... 86!
7.2. Value added by flexible packaging in the supply chain .................................................................................... 86!
7.3. Indicators for a Circular Economy ....................................................................................................................... 87!
7.4. Collection .............................................................................................................................................................. 87!
7.5. Sorting ................................................................................................................................................................... 88!
7.6. Recycling ................................................................................................................................................................ 88!
7.7. Packaging design .................................................................................................................................................. 89!
Chapter 8: Conclusion ...................................................................................................................................................... 90!
References ......................................................................................................................................................................... 93!
APPENDIX 1! Bioplastics ........................................................................................................................................ 98!
APPENDIX 2! Estimates for multilayers fraction ................................................................................................. 100!
APPENDIX 3! Food Losses and waste in Europe ............................................................................................... 102!
APPENDIX 4! End-of-life Modelling .................................................................................................................... 104!
APPENDIX 5! Global plastic protocol indicators ................................................................................................ 105!
APPENDIX 6! Material Circularity Indicator tool ................................................................................................. 106!
APPENDIX 7! Cost of manual sorting .................................................................................................................. 107!
APPENDIX 8! House of Quality to prioritize the issues ...................................................................................... 108!
APPENDIX 9! Specifications for the sorted fraction ........................................................................................... 110!
APPENDIX 10! Horizontal Form Fill Seal Packaging lines ............................................................................... 113!
APPENDIX 11! Detailed description of the sorting process ........................................................................... 115!
APPENDIX 12! Eddy Current Sorting (Steinert) ............................................................................................... 116!
APPENDIX 13! Detailed description of recycling process .............................................................................. 117!
APPENDIX 14! Stakeholders and their needs .................................................................................................. 118!
APPENDIX 15! Translating needs into measurables ....................................................................................... 121!
APPENDIX 16! Idea generation ......................................................................................................................... 122!
APPENDIX 17! Concept generation ................................................................................................................. 124!
APPENDIX 18! Evaluation matrix ....................................................................................................................... 126!
APPENDIX 19! AlOx barrier properties ............................................................................................................ 127!

- Confidential -
8
1 Introduction
!This chapter provides a background to the project and presents the project partners. Also, the project
goal and scope are explained as are the anticipated challenges for the project. Finally, the project
execution and the report structure are explained so that readers understand where to find specific
learnings/conclusions from the project.
1.1.!Project background The Circular Economy has become increasingly important in recent years. It is driven by the European
Commission’s ambitious plan to boost global competitiveness and encourage sustainable economic
growth (The European Commission, 2016). The European Commission has defined seven flagship
initiatives in its Europe 2020 strategy, which includes moving to a Resource Efficient Europe. Although
resource efficiency is not precisely defined, it is generally accepted that planet Earth has limited
resources and that these resources will increasingly be put under pressure by population growth and
the increasing wealth of that population. To achieve this, there is a need to shift from a linear economy
(“take, make, dispose”) towards a more Circular Economy, where products that become waste can
effectively circle in either the natural or technical cycles to ultimately become a new resource to be used
again.
In today’s linear economy, the recycling of packaging waste from fast moving consumer goods (FMCGs)
is generally perceived as being one of the big global challenges; this despite the fact that packaging
only represents less than 2% by weight of all municipal solid waste (Advisory Committee on Packaging,
2008). To meet this challenge, the European Union already introduced in the 1980s measures in its
Directive on Packaging and Packaging Waste to increase the recycling of these materials at the end of
their life.
The main factors driving consumer opinion and packaging legislation are:
•! The relatively short lifespan, it is likely to become “waste” within a year or after a single life
cycle (Al Salem, 2010).
•! The visibility of this packaging waste, in the consumer’s trash and as litter (land-based and
marine).
•! The risk that in the future with an increasingly affluent and growing global population, the
quantity of packaging waste will increase dramatically, both in terms of volume and value. The
European Commission estimates that 5.25 billion euro worth of recyclable materials (including
plastics) is landfilled each year in Europe (Kliaugaité, 2013). More specifically for plastic
packaging, Plastics Europe reports that c.a. 8 million tonnes are currently landfilled yearly in
Europe” (PlasticsEurope, 2015).

- Confidential -
9
To address this, the European Commission’s Circular Economy proposal 2015 includes proposed
measures to ban/ limit landfilling of recyclable plastics (by 2025), limiting incineration to non-recyclable
materials and increasing the recycling target for plastics to 60% (by 2030).
Although flexible packaging is a very resource efficient packaging solution, the proposed higher plastic
recycling rates could negatively impact the flexible packaging industry, as they are not yet widely
recycled in Europe.
Moving to an increasingly Circular Economy will require all resources (product and packaging) to be
used optimally and as efficiently as possible such that waste to final disposal is minimized. Flexible
packaging helps deliver resource efficiency by optimally combining various materials and using the
properties of these synergistically to deliver product protection and functionality resulting in much
higher product to pack ratios than is achievable with other equivalent packaging solutions; even where
these alternatives have high recycling rates.
This project seeks:
•! to understand the relative value added by flexible packaging in a Circular Economy prior to it
becoming waste
•! to identify pack and system design opportunities to further increase this added value through
increased the recycling of these materials to prevent them from becoming waste going to final
disposal.
To execute this project, the services of seventeen stakeholder companies, major leading players across
the flexible packaging value chain who were willing to collaborate, were recruited. These stakeholder
companies have openly and transparently embraced the opportunity to work together on of this
common challenge, recognising that collaboration and collective thinking to find solutions is one
effective way to look at the future and to help bring smarter solutions to the market.
1.2.!Project Partners The uniqueness of the project comes from the full representation of the whole flexible packaging
supply chain. This allowed for a rich discussion and broad insight into the challenges and future
opportunities. The list of project partners can be found in table 1.
table 1: List of project partners
Company Representation in the supply chain
Attero Sorter
Borealis Raw material supplier (plastics)
Bosch Packaging Machine manufacturer
Constantia Flexibles Converter
DuPont Raw Material supplier
(plastics, polymers, resins and additives) Dow Raw Material supplier (plastics and adhesives)
Flexible Packaging Europe Converter Association
Henkel Raw Material supplier
(adhesives, coatings and primers) Huhtamaki Converter
Mondi Converter
Mtm Plastics Recycler
Nestlé Brand Owner
Siegwerk Raw Material supplier (inks)

- Confidential -
10
SLOOP Project Co-ordinator
Tönsmeier Sorter
TU Delft Chemical Product Design - Engineering Urban Mining Corp Sorter
Unilever Brand Owner
1.3.!Project goal and approach The project goal is to capture the value added by flexible packaging solutions in a Circular Economy
and to identify future design and structural opportunities in the flexible packaging supply chain with
potential to further “close the loop”.
In terms of project approach, the project combines an extensive desktop study and the expert inputs
from the project partners to cover the following aspects:
•! Mapping the current flexible packaging supply chain to demonstrate where flexible packaging
adds value with a specific focus on resource efficiency and waste prevention
•! Understanding the hurdles in mechanical recycling of flexible packaging and suggesting areas
of opportunity to further close the loop
•! Applying the group learning on the re-design of two packaging examples to see how more
circularity can be realised and the subsequent challenges in doing this
•! Capturing “knowledge gaps” preventing/delaying progress on increasing recycling of flexible
packaging in Europe
1.4.!Project scope To realise the mapping of flexible packaging in a circular economy, the project scoped the following
items (table 2)
table 2: Items in scope for the project
In Scope Justification
Primary food packaging
Post-consumer waste
FMCG packaging is perceived as a big challenge.
However, the food normally has the most significant impact in
FMCG applications.
Flexible packaging (mono/ multi
materials), size smaller than DIN A4 This is the most challenging fraction.
Worldwide technologies/solutions
applicable for Europe
Although information/data is more accessible for Europe,
technologies available worldwide should be considered
Materials:
plastic/paper/aluminium Most commonly used materials by flexible packaging
Map challenges and opportunities in
mechanical recycling
Chemical recycling is reportedly still economically challenging.
However, changes to legislation and the EPR requirements could
change the whole picture. Chemical and other non-mechanical
recycling technologies might be further evaluated in a future phase
of the project.
Waste to energy is a credible alternative to mechanical recycling in
many European countries, although it is generally perceived as less
preferable.

- Confidential -
11
Use of LCA data/studies
(product/packaging)
The packaging serves the purpose of protecting a product, thus it
does not make sense to consider it alone.
2 design examples: 1 stand-up pouch
+ 1 flow-wrap
These packs are very representative of chocolate/ice-cream and
soup/pasta sauce applications. Further, they are perceived as
difficult packs to recycle.

- Confidential -
12
The project will not cover the following: •! Secondary and tertiary packaging
•! Applications other than food
•! Semi-rigid and rigid packaging
•! Global flexible packaging consumption/data
•! Industrial and commercial plastic waste
•! Other materials such as glass, steel, board, bioplastics (biodegradable)
•! Process and equipment design solutions will not be considered; the design solutions should
be compatible with current sorting and recycling processes.
•! Generation of LCA data
1.5.!Project challenges As flexible packaging is not (yet) widely recycled and that this is perceived as a key weakness in a
Circular Economy, a significant proportion of the project focus/effort will consist of exploring in more
details opportunities to increase mechanical recycling of flexible packaging through packaging and
system design.
The current collection, sorting and mechanical recycling solutions in Europe have been designed for
and work well with packaging which is easily collected and sorted such as rigid plastics, glass, metal
and paper. However, widespread collection and sorting of flexibles remains a challenge. These two
steps are necessary precursors to flexible packaging being recycled.
Although advances in technologies can probably tackle these issues, it is important to keep in mind
that the solutions need to also make sense in terms of environmental and economic impacts/benefits.
Specifically, the cost of collecting, sorting and reprocessing plastics, plus the cost of Extended Producer
Responsibility contribution, have to be competitive so that the price of the secondary material can
compare with that of the virgin material (Dainelli, 2008). A recent study investigated the estimated cost-
benefit balances for the recycling of plastic packaging waste streams and showed that the current limit
of sustainable plastic packaging recycling lies between 36% - 53% (Denkstatt, 2016). This implies that
recycling might not always be the best end-of-life option and that the best economic and environmental
solution is probably a balance of mechanical recycling and energy recovery.
1.6.!Project execution The timeline for the project is presented in Figure 1. Four milestones punctuated the project, each
milestone being supported by a number of specific deliverables.
On 12 February 2016, a kick-off meeting was held in Delft and the project brief was approved. This
project brief included the project goal and scope, the timeline, the project approach and some
preliminary findings.
In early May 2016, a face-to-face meeting was organised in Niedergebra, which allowed for visiting the
MTM mixed plastic (including flexible packaging) recycling facility. During this stage of the project, the
current flexible packaging supply chain was mapped, and the main challenges in collection, sorting and
recycling were identified.

- Confidential -
13
Early July 2016, a virtual intermediate progress meeting took place. The work to quantify the value
added by flexible packaging in terms of food waste prevention and resource efficiency were presented,
together with the design framework and the preliminary results of the design phase.
End of September 2016, this final report was delivered. It summarizes the whole project approach. The
results, conclusions and learnings were presented to the project stakeholders in October 2016 together
with the main insights, opportunities and recommendations.
Figure 1: Project timeline
1.7.!Report content structure Chapter 1 is an introduction to the project and describes the background, the goals, the scope, as well
as the approach.
Chapter 2 is a market analysis to understand the current breakdown of the European flexible packaging
market in terms of material combinations and relative shares of the market, but also to better
understand where the potential might be to increase mechanical recycling.
Chapter 3 captures the value added by flexible packaging in the various parts of the supply chain.
Chapter 4 explores the “Resource Efficiency” of flexible packaging and the challenge on measuring
resource efficiency.
Chapter 5 maps the existing flexible packaging end-of-life solutions as well as the challenges
associated. Some potential solutions/opportunities were explored.
Chapter 6 focuses on the redesign of two flexible packaging examples: an aluminium laminated plastic
pouch and a flow wrap. This design exercise helped to evaluate the effectiveness of some of the
solutions identified to increase the recyclability of these materials along with a methodology to do this.
Chapter 7 lists the knowledge gaps identified by the project. Also potential solutions to address the
identified issues were captured and clustered for further action.
Chapter 8 summarizes the main conclusions of this first phase of the FIACE project.
Figure 2 provides a schematic view on the composition of this report.

- Confidential -
14
Figure 2: Overview of the report content and how it falls under the project goals

- Confidential -
15
2 Market
This chapter is an introduction to the flexible packaging market and its main important numbers and
statistics. To quantify the potential of flexible packaging recycling opportunity, it is important to have
a reliable overview of the flexible packaging market volumes and material structures, as well as an
overview of the potential market for secondary materials.
2.1. What is flexible packaging? One of the key functions of a package is to contain and protect the food product by creating an effective
barrier between the product and its environment to prevent the product from becoming waste. As such,
it is an integrated part of the product and used to preserve product freshness, extend its shelf-life by
protecting it from potentially damaging environmental factors such as light, oxygen and moisture that
could affect the quality and the taste of food (FPA, 2013).
Flexible packaging is a package whose shape is not rigid and can be easily changed, when filled and
during use. Technically, flexible packaging is defined as a material sold in thicknesses of up to 250
microns (American Plastics Council, 1996). The structure can be a simple film or complex, which means
that it combines thickness from 13 to 75 micrometres of different materials such as paper, plastic film,
aluminium foil, or combinations of these (Glenroy, 2016).
Using the synergy of basic properties of the different materials combinations facilitates the tailoring of
the desired properties to meet complex consumer/product demands and provide specific end
applications. In contrast to other barrier packaging formats which generally provide a one-size-fits-all
solution (Pira, 2015), flexible packaging can be customised to meet the specific product requirements
and uses a large variety of innovative shapes, sizes and appearances. It can include components such
as handles and opening and reclosing features such as zips and spouts (Pira, 2015).
In this project, the focus will be on flexible packaging whose size is equivalent to DIN A4 or less, such
as pouches or flow-wraps.
2.2. European market for flexible packaging Over the past years, flexible packaging has become increasingly important and gained significant
market shares from other packaging sectors. This section presents the global and European market
figures to show the relevance of studying flexible food packaging in Europe.

- Confidential -
16
2.2.1. Europe relative to global market (sales) The global consumer flexible packaging market was worth $91.7 billion in 2015. If it grows at the
forecasted average rate of 4.4%, it will reach $114 billion in 2020. The corresponding market tonnage
amounted 26.2 million tonnes in 2015 and is forecast to reach 31.7 million tonnes by 2020 (Pira, 2015).
The top 10 flexible packaging markets in 2010 were: (in $ million (Pira, 2011)).
With five European countries in the top 10, the European Market is an important market representing
33% of the global flexible packaging consumption in 2010 (Pira, 2011).
2.2.2. European market for flexible packaging (sales) Note: All figures reported here are for the year 2010 and were found or calculated based on the Pira
report (Pira, 2011)1.
In 2010 Europe’s flexible packaging consumption was 42,872 million dollars, which represents 21% of
the European packaging consumption and 33% of the global flexible packaging consumption by value.
Western Europe’s2 packaging consumption by type can be seen in Figure 3. Flexible packaging is one
of the four major packaging types, together with rigid plastic, board and paper, and metal. Flexible
packaging includes material with a simple plastic film structure, plastic/plastic laminated films,
plastic/aluminium foil and plastic/flexible paper laminates and other combination.
Figure 3: Packaging consumption by type
Market in $ million
Flexible 37,524
Rigid plastic 35,405
Board 46,993
Metal 35,231
Glass 14,437
Other 10,393
Total 179,983
1 The report recognises that different sources of sales value and weight will depend on the definition of flexible packaging. For
future studies, a single consistent data source would be preferred.
2 Western Europe = 18 countries: France, Germany, Italy, Spain, Great Britain, Netherlands, Ireland, Denmark, Greece, Portugal,
Belgium, Luxembourg, Island, Norway, Sweden, Finland, Austria, Switzerland.
1.! US 25,683
2.! Japan 15,478
3.! China 10,669
4.! Germany 7,513
5.! Italy 6,372
6.! UK 6,163
7.! France 5,748
8.! India 4,969
9.! Canada 4,517
10.! Spain 3,286

- Confidential -
17
Further, the Western European packaging consumption splits (i.e. all type) by end-use sector can be
seen in the Figure 4. This shows the importance of food application, which is the second largest
category, after other packaging. Other packaging refers to wooden cases, crates, boxes, drums and
containers.
Figure 4: Packaging consumption (all type) by end use sector
Market in ($ million)
Food 58,155
Drink 21,094
Healthcare 6,252
Cosmetics 5,081
Other consumer 21,973
Other packaging 67,438
2.2.3. Conclusion on the European market Flexible packaging represents one fifth of the Western European consumption of packaging (by value)
and Europe consumes one third of the global flexible packaging production (by value). Moreover, food
applications are the most important market application. These numbers show and justify the relevance
of studying food flexible packaging in the European market.
2.3. Materials used in flexible packaging This section introduces the types of material used for flexible packaging, as well as some basic
properties. Currently, flexible packaging is mainly based on conventional plastics. Bio-plastics are a
small but growing market.
2.3.1. Conventional materials AMI Consulting reported that an estimated 4.0 million tons3 of flexible packaging for food application
were put on the European market in 2014 and provided the share of each material category used as
shown on the graph.
Figure 5: flexible packaging materials (AMI, 2014)
Material Volume in million tons in 2014 PE (AMI, 2012)
•! LDPE (49%) •! LLDPE (38%) •! HDPE (13%)
1.76 •! 0.86 •! 0.67 •! 0.23
Cast PP 0.16 BOPP 0.72 BOPET 0.16 PVC 0.08 EVOH 0.08 Paper 0.48 Aluminium 0.40 Other 0.16
3 Total European Plastics Demand for Flexible 2011: about 10.8 mt (Plastics Information Europe, 2012)

- Confidential -
18
The main materials that are used in flexible packaging are, per order of importance:
•! polyethylene (HDPE, LDPE and LLDPE) representing 44% by weight of all materials,
•! polypropylene (BOPP and cast PP) accounting for 22% by weight of all materials,
•! paper and aluminium being 12% and 10% by weight of all materials used
•! BOPET representing 4% by weight of all materials.
Flexible packaging uses the properties of a single material and/or combines materials with different
properties to achieve a unique set of barrier properties and mechanical properties.
Table 3 gives an overview of the properties of these materials. Table 3: Multilayer packaging for food and beverage (based on ILSI, 2011)
Tensile strength
Light barrier
Heat sealing
Heat resistance
Dead fold
Relative cost
Others
Blown
LDPE
+ 0 ++++ + + +++ Good moisture barrier
Fair gas barrier
Cast PP ++ 0 ++++ + + ++++ Moisture barrier
BOPP +++ 0 0 ++ + + Moisture barrier
BOPET +++ 0 0 +++ + ++ Good for printing
PVC Moisture, oxygen, aroma
barrier
EVOH 0 0 + + +++ Oxygen barrier, aroma
barrier
Paper +++ + 0 ++++ ++ ++
Aluminium + ++++ 0 ++++ ++++ +++ Absolute barrier to light,
gas/oxygen, water, etc.
The processes used for manufacturing multilayer and multi-material packaging are co-extrusion or
lamination. Multi-material flexible packaging are the structures of main interest in this project, as they
are widely perceived to embody the biggest fraction and seen to present the biggest challenge in
recycling. Mono-material flexible packaging is very recyclable but the challenge is to get it collected
and sorted in more European countries (see Chapter 5).
2.3.2. Bio-plastics – why they are not considered in this report. Bio-plastics are a small but growing market and are expected to become increasingly important in the
composition of flexible packaging (European Bioplastics, 2016). Bio-plastics can be classified into the
following three categories:
•! Bio-based and biodegradable (e.g. PLA)
•! Bio-based and non-biodegradable (e.g. PE, PP, PET)
•! Fossil-based and biodegradable (e.g. PCL)
Currently it is possible to produce conventional plastics (PE, PP) based on renewable resources (i.e. bio-
based and non-biodegradable) and, as expected, these plastic resins face the same recycling
challenges as do their fossil fuel derived equivalents.
Biodegradable plastics are materials that offer alternative solutions to conventional plastics and most
have their own set of properties. A more detailed discussion is provided in APPENDIX 1 .
Currently biodegradable materials represent a challenge in the current mechanical recycling schemes,
where they are perceived as a disruptor to conventional plastic recycling. Presently the volumes of these

- Confidential -
19
materials are still relatively small compared with conventional plastics and for this reason their potential
will not be considered in this project.
2.3.3. Understanding flexible packaging quantities relative to the total European plastics consumption To understand the potential recycling opportunity of flexible packaging in the European plastic
economy, the European demands for the different plastic applications were collected in Figure 6.
The European demand for plastics reaches 47.8 million tonnes per year (PlasticsEurope, 2015). Of this,
it is estimated that 32% is specifically dedicated to plastic food packaging, which is the equivalent of
15.3 million tonnes (GVM, 2016). From section 2.3.1, it was found that approximately 4 million tonnes of
materials are used for flexible food packaging. The share of multi-material flexible packaging is
estimated to be around 0.8 million tonnes. However, this last number should be treated with caution,
as it is based on data points from a limited number of countries and should be verified further (See
discussion in APPENDIX 2 ).
Note: Foil flexible packaging with aluminium as the dominant material (e.g. cheese foil or alu lids) are
not covered in this "plastic" consumption breakdown. Their weight is not negligible in the flexible
packaging market (as aluminium is representing 10% of the material used in flexible packaging whilst
only a small part of it is used in multi-material flexible packaging. In future studies, the impact of this
primarily mono-material fraction should be quantified and accounted for.
Figure 5 puts these numbers into perspective. What is very noticeable from the graph is that food
flexible packaging represents only a very small share in volumes/weight of all plastic consumption in
Europe. Further, it is estimated that the multi-material packaging fraction only accounts for less than
20% (by weight) of all flexible packaging, which suggests that 80% should already be recyclable.
Figure 6: Plastic distribution in Europe
2.3.4. Initial indicative conclusions for the structure food flexible packaging market in Europe Currently four million tons of food flexible packaging are used in Europe annually. Conventional plastic
resins are predominantly used and responsible for ~70% of the materials used, sometimes in
combination with aluminium and paper.
Plas
tic d
eman
d in
mill
ion
tonn
es

- Confidential -
20
Further, relative to the total tonnages of plastics consumed in Europe, it can be seen that the use of
plastics for food flexible packaging applications is small (3.2 million tons per year) and that of this
volume, that the multi-material laminates represent a minor proportion of food flexible packaging (less
than 20% by weight).
Conclusion: The main conclusion, whilst still needing to be verified with more robust data, is that mono-
material flexible packaging (especially PE and PP) are dominant in the market, and this fraction i.e. c.a.
80% by weight has excellent recycling potential if it was collected and sorted by more European
countries.
2.4. Potential market opportunities for mechanically reprocessed flexible packaging (secondary materials) While this project aims to increase the quantity and the quality of recycled materials, it is equally
important to consider which end market applications would/could use these. In the case of recycled
plastics for food contact applications, there are three drivers that strongly restrict the potential of these
markets:
•! Regulations for food contact applications (this is mostly a GMP/quality control issue: undefined
input ! undefined output)
•! Quality and volume of materials available as input into the recycling process
•! Cost of recycled materials relative to virgin plastic resin
The following section discusses the market opportunities for recycled flexible packaging taking these
parameters into account.
2.4.1. Flexible packaging food applications recycled back into a food application? In order to be used for food application, materials must be registered as suitable for food contact and
the EFSA regulations on this are very demanding The first challenge to be overcome is cross
contamination. If non-food-grade plastics and food-grade plastics are mixed, the whole batch cannot
be approved for use in a food application (ILSI, 2000). In the hypothetical case where post-consumer
food-grade plastics could be separated from the rest, a second challenge remains. In the recycling
process, plastics are not only mixed with many contaminants (e.g. solvents, inks, adhesives, decaying
food matter…) but also to multiple heat histories. This can cause plastics or their additives to degrade
into other substances that are not allowed in food contact for safety reasons (Pira, 2011).
One way to potentially circumvent these issues would be to embed the recycled materials between two
layers of virgin resin. This prevents having recycled materials in direct contact with food but requires a
highly effective barrier to avoid potential migration into the food.
Conclusion: Using recycled flexible packaging secondary materials in food applications is not currently
realistic due to food safety considerations.
2.4.2. Food flexible packaging into flexibles This section explores the possibility to use recycled flexibles into non-food flexibles.
Currently the only economically viable way to turn flexible packaging back into flexible packaging is to
reprocess films coming from industrial and commercial sources (out of this project scope). This is
possible primarily due to their low contamination and the (relatively) large volumes of a single material:

- Confidential -
21
95% of the volume is either exclusively PE or PP. The narrow specification allows commercial plastics to
be recycled into flexibles/sheets via film casting. This can result in applications such as: plastics bags,
consumer bags (textile packaging for shirts, sweater…), trash bags, turf bags. Other films like
agricultural films already have a separate industry and this is an example of a closed loop (McKeen,
2013).
Turning a food flexible package into new flexible packaging is more challenging. First, flexibles for food
application can be highly contaminated with food remains and thus require an intensive cleaning
process. Secondly, food flexibles generally end up in the mixed plastics fractions (see chapter 5), which
when reprocessed, do not have sufficient mechanical strength for film blowing. In the example of LDPE
films, recycled materials result in a very soft and flexible material, whose preferred application is
injection moulding. It is unlikely that it will be re-used in a flexible packaging application.
Conclusion: It is challenging to achieve the necessary quantity and quality coming from a post-
consumption food flexible packaging stream to allow conversion back into a flexible packaging. This
may be possible in the future if greater quantities of materials with a tighter specification are available
and/or if layer separation technologies become economically attractive.
2.4.3. Flexible packaging into rigid packaging Flexible recycled materials are generally more suited to injection moulding applications where they can
be/are used in rigid packaging for non-food applications. Typically recycled materials are mixed with
virgin resins to adjust for the required physical and mechanical properties. At present, the volumes that
could be generated if all flexible packaging was collected and the c.a. 80% representing the mono-
material fraction recycled are much smaller (~2.5 million tons per year) than volumes used in non-food
injection moulded plastic applications (~ 13 million tons of injection moulded plastics per year4 ).
Provided the secondary plastic material is price competitive, it is believed that this market could
relatively easily absorb the potential volume generated by flexible packaging recycling.
Conclusion: Injection moulded rigid packaging applications are currently the main market opportunity
for flexible packaging recyclate.
2.4.4. Flexibles into other applications? Currently most recycled plastics are re-used in applications which are different to their initial use.
Flexible packaging – where it is collected, sorted and recycled – is more usually converted into
applications able to integrate mixed polyolefins/plastics such as composite lumber, car applications,
pipes, artificial grass/lawn, crates, buckets, pallets, garden products, cable sheath; etc.
However, using recycled materials for low specification injection-moulded articles would have limited
local market (Scriba, 2016). Producing more could mean that the secondary material would intensify
competition and need to be exported, adding transportation costs, and threatening the attractiveness
of the secondary materials price competitiveness. Also, greater availability could provide economies of
scale for end-users.
Conclusion: Turning flexibles into other applications is also a viable way to re-use flexible packaging
secondary materials.
4! Total European packaging demand is 23.4 million tons (Plastics Europe, 2015). European plastics demand for flexibles is about 10.8mt (Plastics Information Europe, 2012)!

- Confidential -
22
2.4.5. Summary conclusions on market applications for secondary materials from recycled post-consumer flexible packaging? The secondary material generated from flexible packaging recycling is found to have more suitable
properties for injection moulded applications. Also, non-food rigid packaging is currently the most
interesting application that could potentially absorb the volume generated if significantly more flexible
packaging was collected and recycled.
Other less demanding injection moulding applications using mixed plastics are also potential markets
and but are already widely exploited.
To conclude, there are likely to be sustainable markets for secondary materials from flexible packaging
providing the material prices and quantities with consistent quality are available and attractive. A
summary of the pro’s and con’s is shown in Table 4.
Table 4: Recap tables for the potential markets for secondary materials
Potential market Go/No Go Reasons
Food application
! food application No go
"! Demanding food regulation
"! Barrier between food and recycled material?
Flexible packaging
! flexible (packaging) No go
"! Quality issue: impossible to blow films
"! Cast film?
Flexible packaging
! rigid packaging Go
"! Injection moulding applications
"! Mix with virgin RM
Flexible packaging
! other applications Go "! Downgrading: composite lumber, buckets

- Confidential -
23
3 Value added by
flexible packaging in the supply chain
The primary goal of this project is to identify and capture the value added by flexible packaging in a
circular economy. This chapter presents the advantages of flexible packaging across the supply chain,
highlights the resource efficiency of flexible packaging and its strong role in terms of waste prevention
(food and packaging material).
3.1. Flexible packaging supply chain The flexible packaging supply chain may be represented in eight main steps; each of them separated
by transportation, as shown on Figure 7.
The first step of the supply chain is the raw material manufacturing. The main flexible packaging raw
materials come from four industries, namely the mining industry (bauxite to produce aluminium), the
forestry industry (paper), the petroleum industry (monomers) and the (bio)chemical industry (plastic
resins, adhesives, inks, coatings, additives/fillers). The second step is the manufacturing of flexible
packaging, which involves films & foil converters. Then the product is packed into the flexible packaging
by brand owners and retailers or by their 3rd party suppliers, and sent to the shop/supermarket where
it is purchased by consumers. After the product reaches the household, it is consumed and the
packaging discarded. Post-consumption, the packaging reaches the end-of-life stage where it is
collected by municipalities where it is sent to (energy) recovery or landfilled. In a few European countries
it is sorted and recycled back into secondary materials.
Figure 7: Flexible packaging supply chain

- Confidential -
24
! This chapter has tried to capture value based on evidences found in the literature. Particular attention
was paid to the raw materials utilisation, the transportation, consumption phase and the end-of-life.
3.2. Raw material utilisation An ongoing trend in packaging is “light-weighting” as it enables material savings and reduces costs.
Over the years, advances in technology have allowed for significant light-weighting in all pack formats
including flexible packaging. Further, by optimally combining thin layers of different materials, flexible
packaging can deliver the same functionality as alternative mono-material packaging solutions but with
significantly less material. This is measured by the Packaging to Product Weight Ratio, which is defined
as “the ratio of the weight of all packaging material used to the weight of the product or functional unit
delivered”.
Various studies have demonstrated this benefit of flexible packaging, such as the “raisin packaging
study” (FPA, 2009), which compares the efficiency of three packaging solutions:
•! a folding carton with inner plastic bag
•! a paperboard canister with plastic lid
•! a stand-up flexible pouch
Table 5 shows that flexible packaging is the most lightweight solution; i.e. it provides the same food
protection whilst using the minimum amount of materials. In this example, only 11 grams of flexible
packaging are needed to protect 680 g of raisin. Thus, the stand-up flexible pouch is roughly four times
more efficient in packing raisins5 than the two other packaging solutions. Another way of looking at this
benefit is that 11 grams of packaging material was not required relative to the next best solution hereby
preventing the associated cost, environmental impact and waste generation.
Table 5: Packaging to Product Ratio of various raisins packaging (FPA, 2009)
!
! ! !
Packaging type Folding carton with
inner plastic bag
Round paperboard
canister with Plastic Lid Stand-up flexible pouch
Packaging Weight (g) 22.68 39.69 11.34
Product Weight (g) 340 680 680
Packaging to Product Ratio 1:15 1:17 1:60
Table 6 gives typical “Packaging to Product” Ratio’s for flexible packaging from other studies. In
extreme examples Flexible packaging can pack up to 108 times its weight demonstrating how its high
material efficiency adds value by preventing material use and waste.
5 Recognising that the secondary packaging requirements also need to be taken into consideration when calculating the pack-
to-product ratio. This is particularly important for most flexible packaging applications.
- Confidential -
25
Table 6: Packaging to Product Ratio of various food and beverage items Packaging Packaging to
Product Ratio
Butter (Büsser, 2009)
Block of 250 grams
Wrapper: Aluminium foil/ synthetic wax/ paper 1:17
Coffee (FPA, 2013) Flexible “brick pack” 1:29
Beverage (FPA, 2013) Aluminium foil laminated plastic pouch 1:35
Rotisserie Chicken(FPA, 2013) Plastic pouch 1:76
Soup (FPA, 2013) Plastic pouch, large size for food service 1:108
Conclusion
Relative to other packaging formats, flexible packaging is highly material (resource) efficient, which is
clearly demonstrated by the “Packaging to Product ratio”.
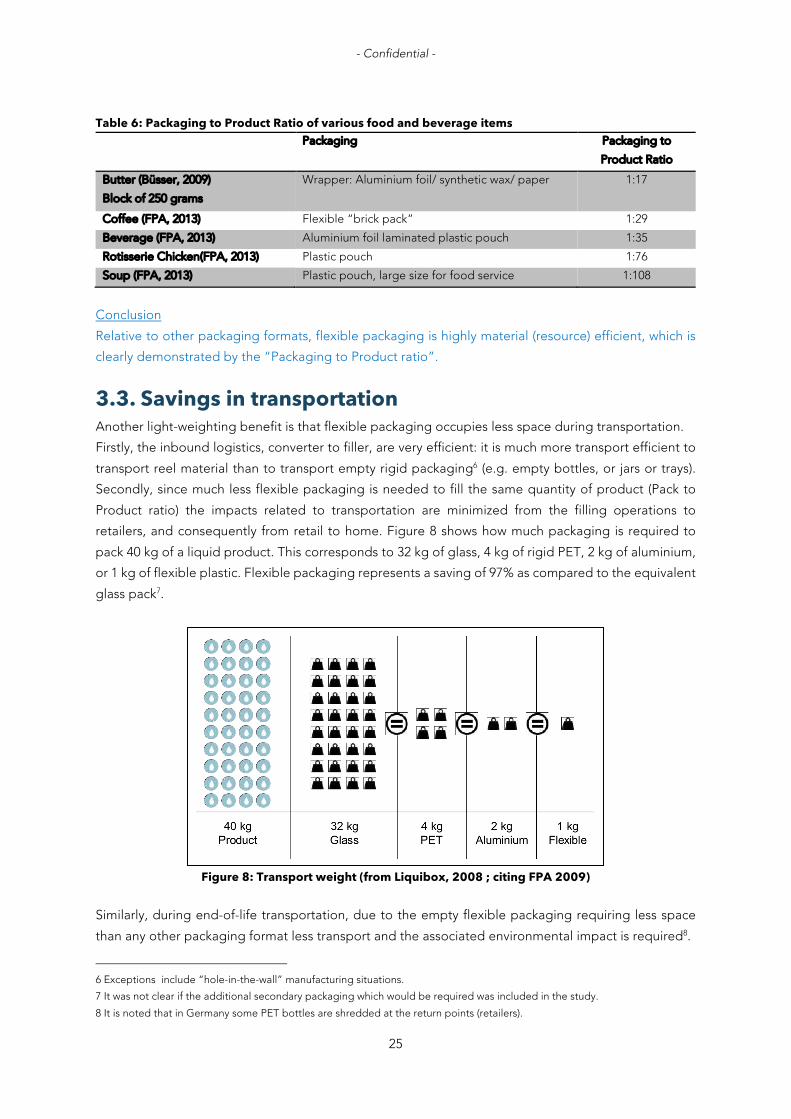
3.3. Savings in transportation Another light-weighting benefit is that flexible packaging occupies less space during transportation.
Firstly, the inbound logistics, converter to filler, are very efficient: it is much more transport efficient to
transport reel material than to transport empty rigid packaging6 (e.g. empty bottles, or jars or trays).
Secondly, since much less flexible packaging is needed to fill the same quantity of product (Pack to
Product ratio) the impacts related to transportation are minimized from the filling operations to
retailers, and consequently from retail to home. Figure 8 shows how much packaging is required to
pack 40 kg of a liquid product. This corresponds to 32 kg of glass, 4 kg of rigid PET, 2 kg of aluminium,
or 1 kg of flexible plastic. Flexible packaging represents a saving of 97% as compared to the equivalent
glass pack7.
Figure 8: Transport weight (from Liquibox, 2008 ; citing FPA 2009)
Similarly, during end-of-life transportation, due to the empty flexible packaging requiring less space
than any other packaging format less transport and the associated environmental impact is required8.
6 Exceptions include “hole-in-the-wall” manufacturing situations.
7 It was not clear if the additional secondary packaging which would be required was included in the study. 8 It is noted that in Germany some PET bottles are shredded at the return points (retailers).

- Confidential -
26
Conclusion
Flexible packaging saves space and weight in each transportation step in the supply chain. The
associated benefits i.e. added value, are:
•! cost savings during distribution (less transport operation, less fuel)
•! reduction of the environmental impact (less fuel), especially to the overall carbon footprint.
3.4. Consumption: food protection & food waste prevention Packaging waste receives a lot of attention probably because it is very visible (in trash bins and as land-
based and marine litters) and is perceived by consumers to be “wasted resources” when it is disposed
of end of life. This section aims to demonstrate the value added by flexible packaging in food waste
prevention even if the lack of robust data on food waste makes this benefit difficult to quantify. It also
is a reminder that the principle role of the pack, in this case a few grams of flexible packaging, allows
for food preservation and protection, hereby minimising environmental impact by preventing the food
and all the resources invested in producing it from becoming waste.
3.4.1. Contribution of flexible packaging in food waste prevention Food waste is also a global challenge with environmental, economic, social and ethical consequences
(more details can be found in APPENDIX 3 ). In Europe, food waste occurs mainly at the household
level. Although the largest potential to decrease food waste is to change consumers’ behaviour and to
raise their awareness about food waste and the impact of it, effective and appropriate packaging can
be part of the solution. This section explains how flexible packaging fulfils this role and where it adds
value.
Flexible packaging reduces food waste (as do other pack formats) through:
•! Product protection
The first function of packaging is to physically protect the food it contains throughout the whole supply
chain, from processing to consumption. It is crucial to anticipate the different environmental conditions,
especially during transport and handling at retailers/storage, in order to design a sufficiently robust
pack, so that the products reach consumers in good condition. This requires an understanding of how
consumers purchase, store and consume food in order to design in appropriate properties that prevent
packaging failure and subsequent food spoilage.
•! Communication role
Another role of packaging is to inform i.e. to communicate with the consumer. Improving labelling has
the potential to improve waste prevention (Verghese, 2013). Although it already contains important
information regarding storage and usage, food safety and indicates “best before” and “use by” dates,
it could also show additional information to help the consumer understand how to store the food better
and heighten consumer awareness of the impact of food waste. One such awareness raising
programmes is the British ‘Love Food Hate Waste’ programme.
•! Shelf-life extension
- Confidential -
27
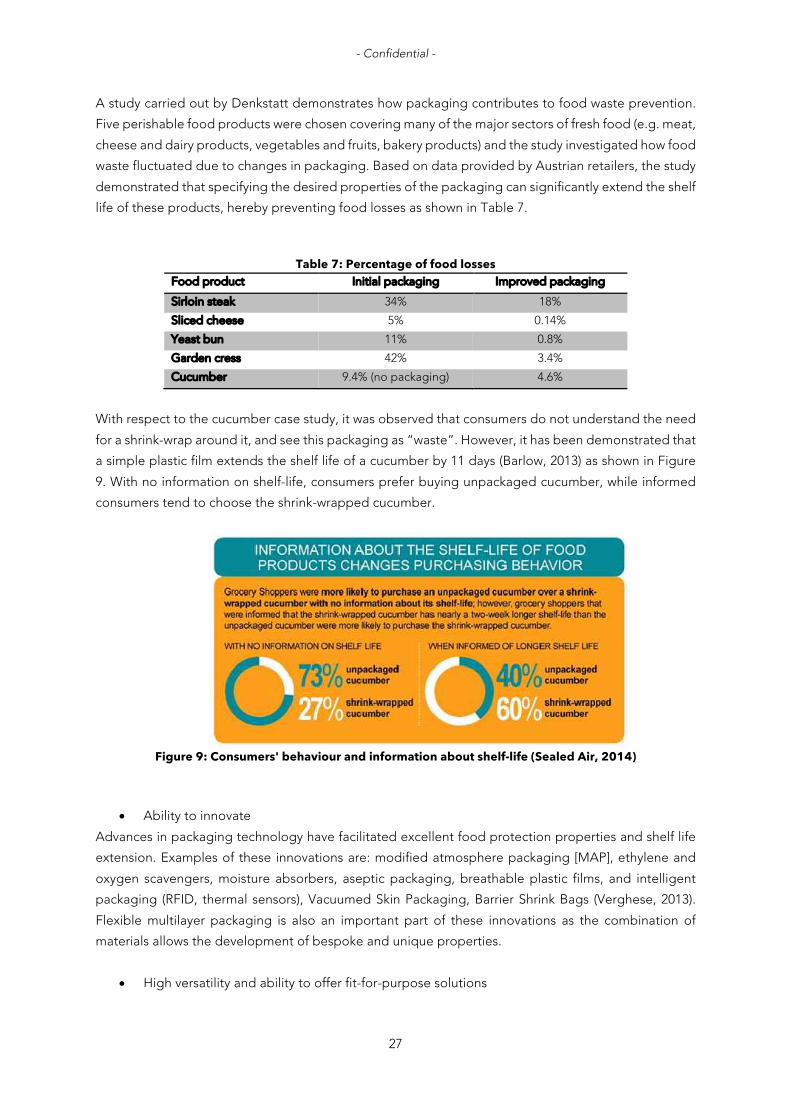
A study carried out by Denkstatt demonstrates how packaging contributes to food waste prevention.
Five perishable food products were chosen covering many of the major sectors of fresh food (e.g. meat,
cheese and dairy products, vegetables and fruits, bakery products) and the study investigated how food
waste fluctuated due to changes in packaging. Based on data provided by Austrian retailers, the study
demonstrated that specifying the desired properties of the packaging can significantly extend the shelf
life of these products, hereby preventing food losses as shown in Table 7.
Table 7: Percentage of food losses Food product Initial packaging Improved packaging
Sirloin steak 34% 18%
Sliced cheese 5% 0.14%
Yeast bun 11% 0.8%
Garden cress 42% 3.4%
Cucumber 9.4% (no packaging) 4.6%
With respect to the cucumber case study, it was observed that consumers do not understand the need
for a shrink-wrap around it, and see this packaging as “waste”. However, it has been demonstrated that
a simple plastic film extends the shelf life of a cucumber by 11 days (Barlow, 2013) as shown in Figure
9. With no information on shelf-life, consumers prefer buying unpackaged cucumber, while informed
consumers tend to choose the shrink-wrapped cucumber.
Figure 9: Consumers' behaviour and information about shelf-life (Sealed Air, 2014)
•! Ability to innovate
Advances in packaging technology have facilitated excellent food protection properties and shelf life
extension. Examples of these innovations are: modified atmosphere packaging [MAP], ethylene and
oxygen scavengers, moisture absorbers, aseptic packaging, breathable plastic films, and intelligent
packaging (RFID, thermal sensors), Vacuumed Skin Packaging, Barrier Shrink Bags (Verghese, 2013).
Flexible multilayer packaging is also an important part of these innovations as the combination of
materials allows the development of bespoke and unique properties.
•! High versatility and ability to offer fit-for-purpose solutions

- Confidential -
28
Flexible packaging offers high customizability to specific product needs. Flexible packaging specifically
helps to reduce food waste because:
1.! The “flexibility” allows the pack to follow the shape of the food it protects (e.g. cucumber). This
capability excludes air and cannot be provided by other packaging formats.
2.! The ability to combine different materials to deliver unique and customised properties. For
example: an optimised barrier/product protection, which allows for significant shelf-life
extension with a minimal amount of resources used (see section 3.2).
3.! The capability to offer numerous design possibilities in terms of shapes, sizes and appearance.
Additional functional benefits can also easily be incorporated e.g. zippers to provide easy
open/reclose or reseal to increase food safety and reduce food waste.
4.! Portion-ability provides consumers with appropriate quantities of product. This helps avoid
wasting food and educates consumers on how much to consume.
5.! Easy-to-empty due to the flexibility of the pack shape helps consumers to get all the product
out of the pack which also helps reduce food waste.
Both the size of packaging (too big) and the difficulty to empty were spontaneously named as one of
the reasons for the waste. A Swedish study has investigated the influence of packaging on the amount
of food wasted by households, and concluded the food waste reduction benefit due to effective
packaging is greater than 20-25% of the total food waste (Williams, 2012).
Conclusion
By delivering an optimised fit-for-purpose packaging, flexible packaging contributes to food waste
prevention by protecting the product from its external environment, avoiding food loss by
contamination. It also plays a role in communication and helps inform the customer about the product
freshness. Flexible packaging adds further value in terms of high customisability, shelf-life extension
and portion-ability.
3.4.2. The environmental factor The raison d’être of packaging is to protect product in the supply chain and to prevent food waste: a
few grams of packaging are sufficient to efficiently keep food safe and fresher for longer. However,
packaging is often perceived by consumers (even the environmentally conscious ones) as bad for
environment, probably due to the volume of visible waste generated and due to messages conveyed
by media. Governments have also stressed the need to reduce this waste in the Directive on Packaging
and Packaging Waste. For this reason, managing resources used for packaging and increasing
packaging recycling have always been regarded as a higher priority than food loss prevention (Williams,
2011). This section aims at providing a fact based understanding of the respective environmental
impacts of packaging relative to that of food waste recognising the importance of considering the
packaging and the food as one system.
Environmental impact of flexible packaging
In many LCAs, the aim is to compare one packaging solution to another, this to show the benefits of
light-weighting, a reduction in material use, efficiency of transport etc. In these studies flexible
packaging (normally) has a smaller environmental footprint than non-flexible alternatives. Although not
always the case, this is mainly accounted for by less packaging material being used but also highly

- Confidential -
29
depends on the material structure (mono-material vs multi-material structures). An example LCA (Figure
10) performed on rice packaging illustrates this.
Figure 10: Global warming potential of 3 packaging solutions for rice (Wilström, 2014)
What is still not that common is quantifying the environmental impact of the packaging relative to the
food it protects.
Breaking a misconception: environmental impact of food versus its packaging
•! Flexible packaging has a far lower environmental impact than food
Consumers sometimes question the omnipresence of packaging (e.g. why would we need a wrapped
cucumber?). The fact is that they perceive food packaging as a larger environmental issue than food
waste. An American survey determined that 89% of shoppers believe that food waste is less harmful to
the environment than food packaging. Furthermore, consumers view food with no packaging (or with
minimal packaging) more environmentally friendly than food packed in a packaging designed to reduce
food waste (Sealed Air, 2014). This is despite that it has been shown that packaging actually constitutes
only a small percentage of the total environmental impact in a food/packaging system: in the case of
flexible packaging usually around 5% and in many cases as low as 2% (Silvenius, 2011). LCAs performed
on butter, chocolate, coffee, goulash and spinach have also shown that the retail packaging (flexible
packaging) contributes to less than 10% of the environmental impact (Büsser, 2007-2011). An example
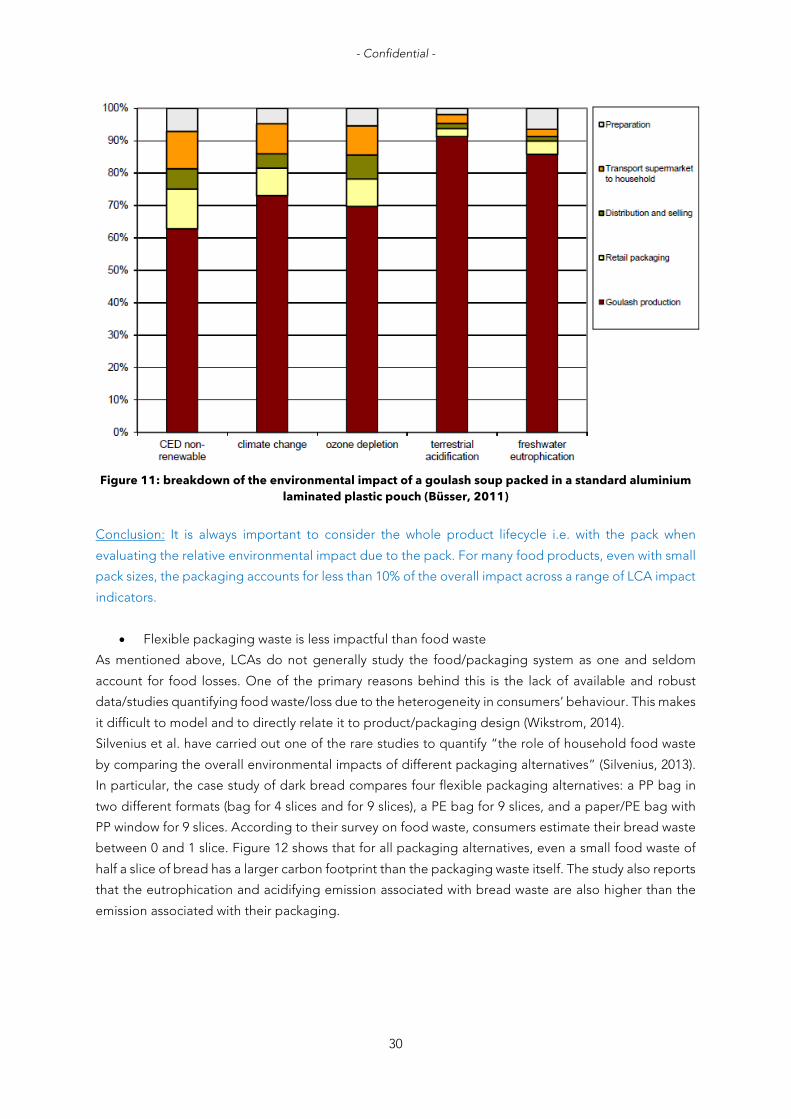
to illustrate this is provided in Figure 11. For the five environmental factors (cumulative energy demand,
climate change, ozone depletion, terrestrial acidification, freshwater eutrophication), the contribution
of packaging accounts for 10% or less of the total environmental impact. With the exception of
beverages, this observation holds true for many food products.
- Confidential -
30
Figure 11: breakdown of the environmental impact of a goulash soup packed in a standard aluminium
laminated plastic pouch (Büsser, 2011)
Conclusion: It is always important to consider the whole product lifecycle i.e. with the pack when
evaluating the relative environmental impact due to the pack. For many food products, even with small
pack sizes, the packaging accounts for less than 10% of the overall impact across a range of LCA impact
indicators.
•! Flexible packaging waste is less impactful than food waste
As mentioned above, LCAs do not generally study the food/packaging system as one and seldom
account for food losses. One of the primary reasons behind this is the lack of available and robust
data/studies quantifying food waste/loss due to the heterogeneity in consumers’ behaviour. This makes
it difficult to model and to directly relate it to product/packaging design (Wikstrom, 2014).
Silvenius et al. have carried out one of the rare studies to quantify “the role of household food waste
by comparing the overall environmental impacts of different packaging alternatives” (Silvenius, 2013).
In particular, the case study of dark bread compares four flexible packaging alternatives: a PP bag in
two different formats (bag for 4 slices and for 9 slices), a PE bag for 9 slices, and a paper/PE bag with
PP window for 9 slices. According to their survey on food waste, consumers estimate their bread waste
between 0 and 1 slice. Figure 12 shows that for all packaging alternatives, even a small food waste of
half a slice of bread has a larger carbon footprint than the packaging waste itself. The study also reports
that the eutrophication and acidifying emission associated with bread waste are also higher than the
emission associated with their packaging.

- Confidential -
31
Figure 12: Carbon footprint of bread waste versus its packaging, and contribution of their waste
management (recovery) (Silvenius, 2013)
Conclusion: These figures help to put the relative environmental impact of packaging into perspective
versus that of the food waste. It also encourages the consideration of the environmental impact of the
total food/packaging system in order to find the optimal packaging solution. This will be explained in
the next paragraph.
Role of flexible packaging in delivering the optimal solution
The Innventia AB model suggests that there is a pack design where the degree of product protection
is optimised and the environmental impacts of the packaging systems are minimised (The Consumer
Goods Forum, 2011). As shown on Figure 13, the environmental impacts due to under-
packaging/under-performing packaging are greater than the impacts due to over-packaging/over-
performing packaging. For instance, over-packing by 10% translates that 10% of (packaging) material
resources are wasted. In contrast, under-packing by 10% might results in a loss of 100% of the material
resources used for the product and packaging (and also the energy to transport the product).
Kg
CO
2-eq
/ton
fin
al p
rod
uct

- Confidential -
32
Figure 13: The Innventia AB model (The Consumer Goods Forum, 2011)
As previously explained (section 3.2), flexible packaging was found to be one of the most efficient
packaging solutions, especially from the perspective of resource use. The versatility of flexible
packaging and the infinite possibilities it offers in terms of design allow for designing in customised
product protection while using the minimum amount of materials. In this respect, flexible packaging
adds significant value.
3.4.3. Conclusions on the value added by flexible packaging in food waste prevention Food waste in Europe is a significant issue, especially at retail and household level (see APPENDIX 3 ).
Although consumer behaviour possibly has the greatest impact in reducing food waste, the packaging
system can and does play a substantial role in reducing food waste (> 20%). The value added by flexible
packaging in reducing food waste is the same as alternative packaging formats but due to its efficient
use of packaging materials (resources), flexible packaging (in most cases) achieves this with the lowest
environmental impact.
3.5. End-of-life: material waste prevention
Post project note to readers: In"this"section"as"well"as"overall"for"this"chapter,"the"objective"is"to"highlight"the"benefits"of"flexible"packaging"relative"to"other"formats."It"is"important"that"this"should"not"be"interpreted"as"a"general"recommendation"that""one"format/option"is"always"better"than"the"other". It has been shown in a previous section that flexible packaging makes efficient use of materials and
achieves very low Packaging to Product (weight) ratios. As a result, less material (in terms of mass) is
sent to disposal when compared to other packaging alternatives. A recent peer reviewed study
conducted by the Institut für Energie und Umweltforschung (ifeu) for Flexible Packaging Europe (FPE)
has quantified the advantages of flexible packaging (relative to non-flexible packaging) in terms of both
packaging material waste prevention (in tons) and the environmental impacts of this prevented waste
(ifeu, 2014). In this study, two extreme scenarios were investigated as shown on Figure 14: one where
all European packaging (excl. beverages) would be non-flexible (with current recycling and recovery

- Confidential -
33
rates at the EoL), the other where all European packaging (excl. beverages) would be flexible (with
current landfill and recovery rates for flexible packaging in the EU).
Figure 14: Scenarios of the ifeu study
Scenario 1: What if all packaging were non-flexible?
According to the study, currently approximately 60% of food items in Europe are packed in a non-
flexible packaging (ifeu, 2014). A first scenario investigated what would happen if all flexible packaging
was substituted with non-flexible packaging. This scenario concluded that the replacement of the 3.70
million tonnes of flexible packaging would require an additional 20.5 million tonnes of non-flexible
packaging material per year9. This represents an additional 67% more packaging by weight that would
be required to pack the same quantity of food (ifeu, 2014). This clearly highlights how resource efficient
flexible packaging is and shows that flexible packaging helps to prevent packaging materials from
becoming waste. When comparing the environmental impacts, the ifeu study concluded that this
additional packaging would represent (relative to the then current situation 2012):
•! an increase of 5.6% of the global warming potential (i.e. Carbon Footprint) of 6 million tonnes
of CO2-eq as measured in the LCA. Note: the study assumed that 100% of the non-flexibles
were recycled;
•! an increase of 5.3% of the overall Water Footprint;
•! and a decrease of 17% of the Abiotic Depletion Potential, a measure of the use of non-
renewable resources, as shown on Figure 15.
Scenario 2: What if all packaging were flexible?
A second scenario simulates the opposite scenario: the replacement of all non-flexible packaging with
flexible packaging (the study assumes that flexible packaging EoL is 37% recovery (waste to energy)
and 0% recycling.)
Note: This represents the “worst case” scenario as flexible packaging can be recycled and is being
recycled in several European countries.
In this scenario, the current 30.70 million tonnes of non-flexible packaging could be theoretically
substituted by 4.22 million tonnes of flexible packaging. This would result in a reduction of 26.48 million
tonnes of packaging material and, which would be prevented from entering the waste stream annually.
This represents a reduction of 77% by weight as compared to the current situation today. Using LCA to
quantify the reduction in the environmental impact, this translated into:
9 Secondary packaging was not taken into account.

- Confidential -
34
•! a 40% reduction in the Global Warming Potential or Carbon Footprint (42 million tonnes CO2
eq);
•! a reduction of 44% of the Water Footprint;
•! a reduction between 40% and 50% in the Abiotic Depletion Potential depending on the
assumption relating to the “end-of-life” of the flexible packaging (see Figure 15).
Figure 15: Environmental impact in 3 scenarios
Conclusion
The ifeu waste prevention study clearly demonstrates the resource efficiency potential of flexible
packaging (waste prevention by minimising the mass of material used) and the subsequent
environmental benefit relative to non-flexible alternative packaging solutions.
3.6. Quantification of the value added This section is a first attempt to quantify the value added and is based on recently released data. Note: To develop the methodology, it was necessary to create a fictitious example using the best
available data. This included assuming a ratio of 3:1 for the bottle/jar-to-pouch material ratio, a liquid
which could be a hot-filled dairy-based drink or pasta sauce. Also neither secondary packaging
information nor was the cost of filling/packing available and as such was not included. If this model is
further developed for uses other than an illustrative example, it is strongly recommended that robust
and consistent data for all elements of the packaging mix and end-of-life. Given these inconsistencies,
it is recommended that the example is used for illustrative purpose only and not to draw hard
conclusions on the relative value added between the two systems.
3.6.1. Methodology Functional unit and scenarios:
•! Based on the available data, two packaging examples were compared: 30g PET/plastic bottle and
a 10g plastic aluminium laminated pouch, which assumed to fulfil the same function (packing 1L of
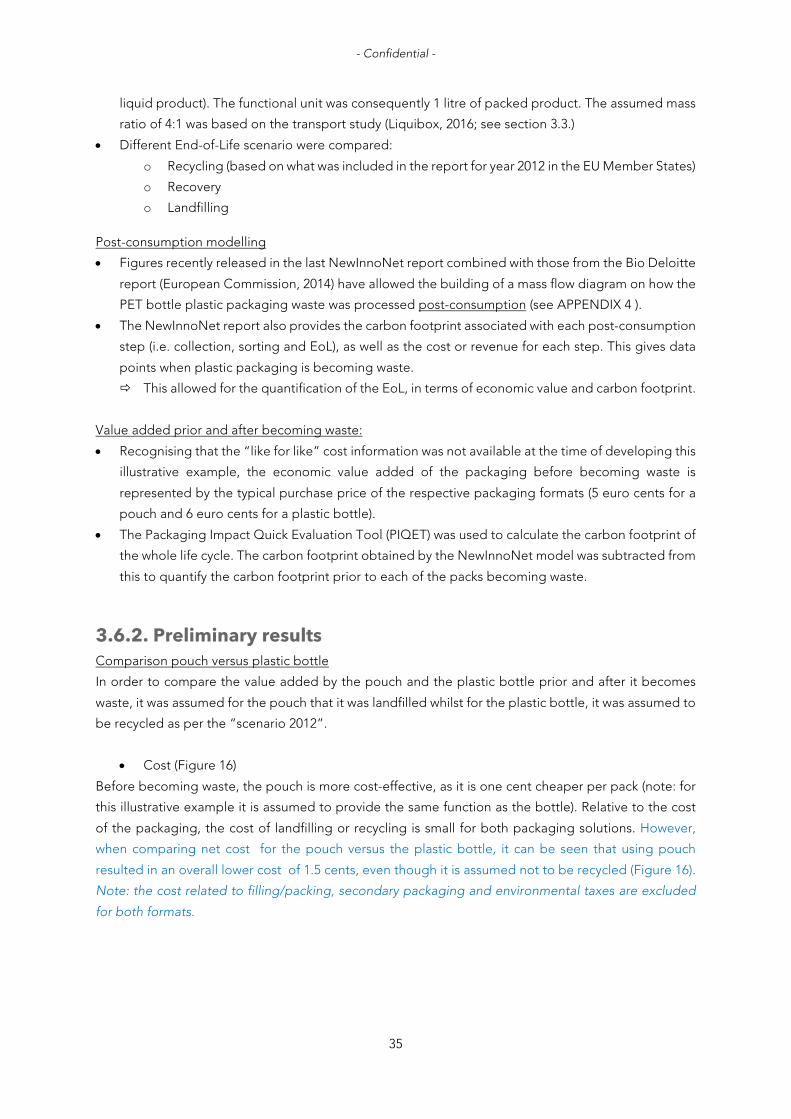
- Confidential -
35
liquid product). The functional unit was consequently 1 litre of packed product. The assumed mass
ratio of 4:1 was based on the transport study (Liquibox, 2016; see section 3.3.)
•! Different End-of-Life scenario were compared:
o! Recycling (based on what was included in the report for year 2012 in the EU Member States)
o! Recovery
o! Landfilling
Post-consumption modelling
•! Figures recently released in the last NewInnoNet report combined with those from the Bio Deloitte
report (European Commission, 2014) have allowed the building of a mass flow diagram on how the
PET bottle plastic packaging waste was processed post-consumption (see APPENDIX 4 ).
•! The NewInnoNet report also provides the carbon footprint associated with each post-consumption
step (i.e. collection, sorting and EoL), as well as the cost or revenue for each step. This gives data
points when plastic packaging is becoming waste.
"! This allowed for the quantification of the EoL, in terms of economic value and carbon footprint.
Value added prior and after becoming waste:
•! Recognising that the “like for like” cost information was not available at the time of developing this
illustrative example, the economic value added of the packaging before becoming waste is
represented by the typical purchase price of the respective packaging formats (5 euro cents for a
pouch and 6 euro cents for a plastic bottle).
•! The Packaging Impact Quick Evaluation Tool (PIQET) was used to calculate the carbon footprint of
the whole life cycle. The carbon footprint obtained by the NewInnoNet model was subtracted from
this to quantify the carbon footprint prior to each of the packs becoming waste.
3.6.2. Preliminary results Comparison pouch versus plastic bottle
In order to compare the value added by the pouch and the plastic bottle prior and after it becomes
waste, it was assumed for the pouch that it was landfilled whilst for the plastic bottle, it was assumed to
be recycled as per the “scenario 2012”.
•! Cost (Figure 16)
Before becoming waste, the pouch is more cost-effective, as it is one cent cheaper per pack (note: for
this illustrative example it is assumed to provide the same function as the bottle). Relative to the cost
of the packaging, the cost of landfilling or recycling is small for both packaging solutions. However,
when comparing net cost for the pouch versus the plastic bottle, it can be seen that using pouch
resulted in an overall lower cost of 1.5 cents, even though it is assumed not to be recycled (Figure 16).
Note: the cost related to filling/packing, secondary packaging and environmental taxes are excluded
for both formats.

- Confidential -
36
Figure 16: Cost comparison of a pouch versus a plastic bottle.
•! Carbon footprint (Figure 17)
Before becoming waste, the PIQET LCA showed the carbon footprint of a pouch to be one third of that
of the plastic bottle. Also, for the pouch, the carbon footprint associated with landfilling is negligible
compared to carbon footprint of the pouch. For the plastic bottle, the carbon footprint associated to
its recycling contributed to approximately 10% of the overall carbon footprint.
Comparing the results shows that the pouch to has an overall “added value” by reducing the carbon
footprint by 0.08 kg CO2 eq per pack.
Note: the carbon footprint impacts related to filling/packing and secondary packaging are excluded
for both formats.
Figure 17: Carbon footprint comparison of a pouch versus a plastic bottle
Quantification the relative added value of different EoL scenarios for the pouch
•! Cost (Figure 18)
The model was also used to gain an insight into the relative costs of disposal for the pouch for each of
the 3 scenarios (based on 2012 costs). It was observed that there was little difference in the costs to
recycle, recover or landfill the pouch with it ranging between 0.23 – 0.24 cents per pack. This represents
less than 5% of the overall cost. From an economic perspective, it would appear that there is no
economic incentive to recycle or recover the pouch as distinct from landfilling it. (It should be noted
that no revenue was taken into account for the waste-to-energy scenario).

- Confidential -
37
Figure 18: Cost associated to different EoL scenarios for the pouch
•! Carbon footprint
The information in the Bio-Deloitte report also allowed a comparison of the difference in carbon
footprint from each of the pouch EoL scenario. The reported respective carbon footprints were:
o! 0.0003 kg CO2 eq per pack for landfilling
o! 0.009 kg CO2 eq per pack for recycling
o! 0.0272 kg CO2 eq per pack for recovery
Relative to the carbon footprint of the pouch (0.05 kg CO2 eq per pack), the 0.009 kg CO2 eq per pack
that would result from the plastic recycling process is approximately equivalent to 20%. This would then
need to be offset against the carbon credit associated with the secondary material of which 50% can
be allocated to the current system in a 50:50 recycling benefit allocation LCA. This would approximately
result in no net reduction in the carbon footprint from recycling the pouch but would be more resource
efficient overall.
3.6.3.Conclusion This methodology (using an illustrative example) has allowed for the quantification of the theoretical
value added by flexible packaging (cost and carbon footprint) relative to a rigid plastic alternative. In
the future, the model should be validated with more robust data and could be further developed to
enable the comparison with other packaging alternatives (glass, paper, aluminium).
3.7. Conclusion on the value added by flexible packaging Flexible packaging adds value in many steps of the supply chain. First flexible packaging considerably
reduces the packaging materials needed relative to other packaging alternatives. The very high product
-to- packaging ratios effectively mean that flexible packaging is extremely resource efficient in
delivering its role of food packing.
Second, light-weighting and space saving solutions further reduce the transportation costs and also the
carbon footprint.
In the consumption phase, all packaging plays a crucial role in food protection. Flexible packaging has
the advantage that it allows for significant shelf-life extension and proposes fit-for-purpose solutions.
Further, when considered relative to the full product lifecycle, flexible packaging only represents a
relatively small environmental impacts (less than 10%). Whilst it is important to capture/understand the

- Confidential -
38
value (flexible) packaging adds in terms of food waste prevention this is seldom included in LCA studies
due to the availability of robust consumer food waste data.
The ifeu study showed that, even with no recycling, flexible packaging is very resource efficient relative
to the other packaging alternatives even if it was assumed that these were all (i.e. 100%) recycled. The
related LCA (which include secondary packaging) showed that flexibles have the lowest environmental
impact even when they are not fully recycled.
To conclude, flexible packaging uses the minimum amount of materials (resources) to optimally pack
the product. This not only demonstrates added value by preventing waste, which is the starting point
of Circular Economy thinking but it also translates into lower environmental impacts for the whole
product lifecycle. In summary, flexible packaging adds significantly more value through its high
resource efficiency and waste prevention relative to alternative packaging solutions, making it an
appropriate choice for specific applications; Further progress in collection and recycling/recovery
would further increase the added value of flexible packaging in a circular economy, and reduce risks of
leakage into the environment.
Note: In identifying the value added by flexible packaging, only equivalent functionality and the environmental impact of material used was taken into account. It is recognised that these are not the only two important criteria to be considered when selecting the most suitable packaging format and
that the consumption/use occasion, meeting the main consumer need (e.g. luxury) and brand/marketing requirements are also important criteria. For pragmatic reasons, they have been
deliberately excluded from this study.

- Confidential -
39
4 Indicators for
Circular Economy
Chapter 3 highlighted how and where flexible packaging adds value in the supply chain and
demonstrated the Resource Efficiency of flexible packaging. This chapter aims to explain why Resource
Efficiency is a key indicator in a circular economy and at defining “resource” and “resource efficiency”.
It also reviews which resource efficiency and circular indicators are in use today. Whilst it will be shown
that although a plethora of indicators exist and capture various aspects of circularity, holistic and
representative indicators (needed to set and measure targets) still need to be developed and be
endorsed widely so they can be used to support the emerging EU policy on the Circular Economy.
4.1. Resource and Resource Efficiency definitions Although advocating for a more Resource Efficient Europe and driving European legislation towards a
“Circular Economy to achieve this goal, the European Commission has never clearly defined what it
includes in “resources” or how to measure “resource efficiency”.
The European Environment Agency (EEA) conducted a survey of 31 countries to study their experiences
in instigating resource efficiency measures. It was found that most countries interpret the term
“resource” in a broad way to encompass all natural resources. This includes “raw materials, energy
sources, biomass, waste, land and soil, water and biodiversity” (EEA, 2011).
Resource efficiency (inter-)mingles the concepts of resource intensity and eco-efficiency (Wikipedia,
2016), meaning that Earth’s limited resources should be extracted and used while minimising
environmental impact. Resource efficiency is thus a pathway to deliver more, with fewer natural
resources (European Commission, 2015).
4.2. Indicators for Resource Efficiency To achieve a Resource Efficient Europe some indicators are necessary to quantify progresses towards
measurable objectives/targets possibly to be required by EU legislation.
4.2.1. At country level A European study revealed that Member States have different approaches to measure and track
resource efficiency (EEA, 2011) at the country level. Indicators exist in the following areas:
•! Materials: domestic material consumption (DMC), direct material input (DMI), domestic
extraction (DE)
•! Energy: energy efficiency, share of renewable energy, energy consumption

- Confidential -
40
•! Water: water quality, water use, exploitation index of renewable water resources
•! Land: forest area, land use, share of agricultural area under agro-environmental farming
•! Waste: waste generation, amount of waste recycled (recycling rates)
•! Others: fisheries, eco-efficiency, transport
4.2.2. Resource Efficiency Indicators for Packaging: Global Protocol on Packaging Sustainability 2.0 The Consumer Goods Forum, recognising that a “common language” was needed to assess packaging
performances in terms of economic, social and environmental aspects, created the Global Protocol on
Packaging Sustainability [GPPS - 2009]. The aim of the GPPS is to enable discussion/communication
between different businesses/industries/markets, but also to suggest standardised metrics that help
decision-making processes. The possible metrics to be used include:
•! Packaging attributes such as: Packaging Weight, Packaging to Product Weight Ratio, Material
Waste, Recycled Content
•! Life cycle indicator: Cumulative Energy Demand, Freshwater Consumption, Land occupation,
Global Warming Potential
The full list of indicator is available in APPENDIX 5 .
4.2.3. Conclusion Whilst Resource Efficiency is recognised as the primary pathway to realise a more circular economy,
there is neither a harmonised definition nor metric to quantify progress. There are, however, plenty of
indicators that can be used at various levels: global, country, company, product levels but none of these
are sufficiently holistic to be able to measure progress across a product (incl. the pack) value chain.
4.3. A new indicator in development: the Resource Efficiency indicator for packaging At a product level, a plethora of other simple metrics can be and are used to provide an indication of
resource efficiency. However, there does not appear to be a widely accepted methodology to
“measure” resource efficiency at the product level, let alone at the pack level. This section explores a
new Resource Efficiency definition, methodology and metric developed by ifeu (Institut für Energie-
und Umweltforschung, Heidelberg GmbH) at the request of Flexible Packaging Europe. The driver
behind this approach is to have a robust means to measure resource efficiency of alternative packaging
solutions providing functionally the same benefits for a given product. FPE’s interest is to ensure that
the very resource efficient nature flexible packaging gets credit for preventing packaging waste and
realises a lower overall environmental impact. Currently the only recognised and reported metric is the
End of Life Recycling Rate which is neither holistic nor reflects the total resources used to produce the
pack nor the impact of the whole product lifecycle.
4.3.1. Indicator presentation The ifeu indicator proposes to quantify all the resources used and recovered to produce a given pack.
It also quantifies the total non-renewable energy used and the quantity of resource going to “final

- Confidential -
41
disposal” i.e. landfill10. This indicator acknowledges that real "Resource Efficiency is only achieved when
all the inputs that are used to produce a product or material (and the impacts due to their use) are taken
into account; including those recycled/recovered end of life.
The ifeu indicator reflects the three of the main environmental impacts11 due to packaging and can be
represented on three axes as shown in Figure 19.
Figure 19: Resource efficiency indicator (FPE, 2016)
•! The use of energy is represented by the Cumulated Energy Demand (CED in J/kg), which takes
into account the fossil and nuclear energy used. Thus both the use of energy more efficiently
and/or renewable energy is rewarded. The CED must include possible credit from EoL thermal
recovery.
•! The use of materials is measured by the Cumulative Resource Demand (CRD in kg), which
determines the weight of all material resources needed to manufacture the product. In that
way, light weighting and the use of less materials to provide the same function is rewarded.
The CRD must include credit from EoL material recycling.
•! Waste to final disposal is quantified: both the fact that less waste is generated (waste
prevention) and higher material recycling rate is rewarded.
4.3.2. Application of the indicator In the study, the indicator has been applied by the Institut für Energie und Umweltforschung (ifeu, 2016)
to compare the resource efficiency of a pouch to the resource efficiency of three packaging alternatives:
a steel can, a glass jar and a plastic pot. These packages are fulfilling the same function i.e. long-life
preservation of 400 - 450mL of pasta sauce. Figure 20 shows the results obtained. It is observed that
the three-sided result graph (red line representing the pouch) can be completely contained within the
other scenarios (blue, black and yellow lines), which indicates that the pouch is more resource efficient
than the three packaging alternatives. It should be noted that for the steel can, the glass jar and the
10 Note: materials recycled and energy recovered are reflected and credited in the approach. The Ifeu method rewards scenario
where less pressure is put on resources, as well as where less amount of material is sent to disposal (which acknowledges the
contribution of recycling too).
11 It is important to note that Land Use and Water Footprint have been deliberately excluded from this tool because the
methodologies to measure them are not sufficiently robust and not recognised widely. Furthermore, their contribution is
generally not significant for packaging.

- Confidential -
42
plastic pot, the current recycling rates have been taken into account, whereas it was assumed that the
laminated pouch was not recycled at all.
Figure 20: Resource efficiency of a laminated pouch compared to three packaging alternatives
In order to evaluate the resource efficiency of flexible packaging, a baseline scenario was chosen based
on the European average package used for FMCGs: 37% of glass, 35% plastics, 11% aluminium, 17%
carton. It also considers the actual recycling rates (Eurostat, 2014) as followed: 70% for the aluminium
packaging, 73% for glass, 35% for the plastic packaging and 42% for the carton packaging. Figure 21
shows the results in this scenario, and that flexible packaging is on the whole average more resource
efficient as the red line is fully contained within the baseline scenario (blue line).
Figure 21: Resource efficiency of an average flexible packaging and average EU packaging

- Confidential -
43
4.3.3. Conclusion This indicator is a means to have a relative comparison between two functionally equivalent packaging
systems. The main benefit of this tool is that it allows for drawing robust conclusions on which pack is
more resource efficient as it is based on three factors (Resource, Energy and Waste) that provide a
holistic measure, unlike single metric indicators like the recycling rate.
Note: Although resource efficiency is very often also illustrative of a lower environmental impact, this is
not always the case. As such, it should not be used as an alternative to LCA when quantifying the overall
environmental impact.
4.4. Material Circularity Indicator: an indicator based on mass In this report it is also chosen to introduce the Material Circularity Indicator developed by the EMF. It
is important to analyse how the EMF plans to measure success at product level, and assess the
performance of a product in a Circular Economy.
4.4.1. Indicator presentation The Material Circularity indicator (MCI) focuses on the circulation and restoration of materials flows at
a product level (EMF, 2015). It promotes:
•! reused and recycled feedstocks
•! post-consumer waste recycling
•! long lasting products
•! intensive use of products
Figure 22 represents the material flows.
Figure 22: Representation of material flows (EMF, 2015)
The Material Circularity Indicator (MCI) is calculated as a function of the linear flow index (LFI) and the
utility factor (X). The latter translates the length and intensity of the product use. It is mentioned in the
report that a mass component can be added to the utility factor to highlight the light weighting effort

- Confidential -
44
(EMF, 2015). In other words, the MCI quantifies how much the linear flow is minimised by maximizing
the restorative flow based on the following formula:
!"#$ = 1 − ()$ ∗ 0.9.
Based on this equation, the MCI is always between 0.1 and 1. A product which would be fully circular,
would have a MCI of 1, whereas a fully linear product (take, make, dispose) has a MCI of 0.1 by
convention. The fully developed formula is:
"#$ = 1 −/ +12 +!13 +14
22" +!13 +14
2∗ 0.9((67
8867
""67
Where,
•! V is the mass of virgin feedstock used in a product
•! W0 is the mass of unrecoverable waste (landfill or energy recovery)
•! Wf is the mass of unrecoverable waste from recycling process
•! Wc is the mass of unrecoverable waste generated in the process of recycling part of the product
•! M is the mass of a product
•! L is the lifetime of a product
•! U is the number of functional unit
•! Av stands for average in the product industry
4.4.2. Application of the indicator A dynamic modelling tool is provided by the EMF to easily compute the MCI (APPENDIX 6 ) and allows
calculating the MCI for various scenarios. A few scenarios considering a standard Aluminium foil
laminated plastic pouch were established to see how it functions (Figure 23). These scenarios were
chosen in such way that all variables proposed by the model are used at least once.
Figure 23: Scenarios for the MCI
Scenario 1: Current scenario
The pouch is 100% based on virgin feedstock and not recycled at all. This is a total linear approach.
•! MCI = 0.1
Scenario 2: Focus on reuse

- Confidential -
45
The pouch is 100% based on virgin feedstock and that the post-consumer’ waste is reused in another
manner (like shopping bag, apron…). This “reuse” parameter is varied for illustrative purposes, which
does not imply that this is a route to promote.
•! 50% reused: MCI = 0.33
•! 100% reused: MCI = 0.55
Scenario 3: Efficiency of the feedstock recycling process
The pouch is 100% based on recycled feedstock (from an x% efficient process) and not recycled at all.
•! 50% efficient process: MCI = 0.46
•! 100% efficient process: MCI = 0.55
Scenario 4: Recycled content and material sent for recycling
The pouch contains recycled content and is recycled after use. The recycling processes are all fixed at
50% efficiency.
•! 50% based on recycled feedstock – 50% sent for recycling: MCI = 0.42
•! 100% based on recycled feedstock – 100% sent for recycling: MCI = 0.70
Scenario 5: Increase in utility (e.g. further light-weighting or longer use)
The pouch is assumed 100% based on virgin feedstock and not recycled at all. The utility factor
describes the service life of a product, using two components: the length component (L/Lav) and the
intensity of use components (U/Uav). The MCI increases for products which are kept longer than
average in use or that are used more intensively than average (taxi car vs. personal car). The EMF report
suggests that a mass component is incorporated alongside to reward light-weighting. Here are various
scenarios to see how MCI changes with utility (light-weighting being the most plausible scenario for
packaging)
•! Increased utility: 1.5*industry average: MCI = 0.4
•! Increased utility: 2*industry average: MCI = 0.55
•! Increased utility: 3*industry average: MCI = 0.7
•! Increased utility: 5*industry average: MCI = 0.82
Discussion
Looking at the various scenarios, the following observations can be made. First it can be seen that this
indicator does not necessarily only favour closed loops: in the scenario 2, where the pouch is
reused/cascaded in another application, the MCI increases significantly (up to 0.55). This means that
the materials do not have to serve the same initial application. From the scenario 3, it can be observed
that focussing on incorporating recycled feedstock is rewarded to a certain extent (MCI = 0.55 in the
best case scenario). From scenario 4, it is shown that adopting a complementary approach, which
includes recycled feedstock and ensuring circulation at the end-of life, increases the MCI. Finally, from
scenario 5, it can be seen that increasing the utility of the product is greatly rewarded. For a packaging,
this would be achieved by increasing the packaging efficiency even more (as illustrated by pack to
product ratio), or light-weighting even further.
4.4.3. Conclusion on the Material Circularity Indicator As a general observation, it can be seen that this indicator does not take into account the resulting
environmental impact nor the total amount of materials nor the energy that are initially required to

- Confidential -
46
produce the product. These are all considered important factors when trying to evaluate resource
efficiency. Further, it only appears to reward the circulation of the residual physical matter. This would
appear to imply that the more “loops” that are created, the better, regardless of the other impacts of
the product. It is possible that conclusions drawn out of this model and conclusions out of a LCA could
give very contradictory results. Therefore, in the author’s opinion, this tool needs to be used in
combination with complementary indicators. Whilst the EMF MCI does measure more “circularity, it is
not sufficient to be used as an indication of resource efficiency. Further, “circularity” of one component
of the product should not be considered an indication of the “circularity” of the whole product lifecycle.
4.5. Conclusion on the indicators for a Circular Economy From the discussion on Resource Efficiency and Circularity, it can be concluded that the Circular
Economy is not only about higher recycling rates as suggested by the EU Circular Economy legislation.
To measure added value in a Circular Economy one should consider measures of “Resource Efficiency”
and “Circularity” throughout the whole product lifecycle and the related environmental impact.
Besides, in a circular economy, it is also important to consider resource efficiency, overall environmental
impact, and the creation of economic value, before attempting to realise an effective cascading of
materials in the technical and biological cycles and further close the loop.

- Confidential -
47
5 Mapping
flexible packaging end-of-life
The second half of the project aims at exploring the opportunities to further close the loop via
mechanical recycling. This chapter gives an overview of some of the current collection, sorting and
recycling processes used in Europe. The challenges for each of these steps are identified as well as
some potential solutions/opportunities to increase the quantity and quality of recycled flexible
packaging.
5.1. Collection The collection of packaging waste in Europe is primarily managed to meet the Extended Producer
Responsibility12 (EPR) recycling targets for each packaging material sector. To meet these targets at the
lowest cost to producers, collection schemes in most European countries have traditionally targeted
those packaging formats that are more resource intensive as these are normally more cost effective to
collect, sort and recycle. In addition, given the challenges in sorting and collecting plastic packaging,
the legislated recycling targets have been significantly lower than those of other materials. This in turn
has had consequences for the quantity (and quality) of secondary plastic materials available to develop
markets for these.
Separate collection of packaging materials in one form or another is normally practised as this is seen
as an essential pre-cursor to achieve high recycling rates and quality of the recycled materials. This
section reviews the current waste collection systems in Europe, identifies the challenges and the
potential solutions to increase separate collection of flexible packaging waste.
5.1.1. Collection systems in Europe Whilst plastic packaging waste from household falls under the extended producer responsibility (EPR)
schemes, it is usually the responsibility of the municipality to decide on the waste collection system. A
wide variety of collection schemes exist across Europe to collect municipal solid waste (MSW) and most
countries use combinations of many/all of these schemes.
12 “EPR for packaging is a policy approach that extends the producer’s responsibility for a product beyond their current scope
to also include the management of their packaging after the product has been used by consumers. EPR policies generally shift
the waste management cost or physical collection partially or fully from local governments to producers” (Europen, 2016)

- Confidential -
48
Door-to-door (also called kerbside collection)
The general trend is for collection of recyclable materials through door-to-door collection. Three
alternatives are possible: strict separation, co-mingled collection or no separation.
•! Strict separation
With this method, one bin serves to collect one material type (e.g. paper/cardboard, glass, metal,
plastics, bio-waste). It allows for obtaining the highest quality and volume of collected fraction, but also
has the highest cost. This higher cost might be counter balanced by higher revenue on recycled
materials. Plastic packaging waste from commercial activities is collected separately and is frequently
directly transported to recycling companies (BIPRO, 2015).
•! Co-mingled collection
To maximize the cost efficiency of the collection, most door-to-door collections focus on co-mingled
collection of recyclable materials. This means that there is a mix in one bin of two or more material
types (e.g. plastics and metal), which are separated later in a sorting facility. As mentioned, co-mingled
collection has lower costs for the collection while having a relatively good quality clean stream for
sorting. As a rule of thumb, the more mixed streams are, the lower the quality of the sorted fraction.
•! Residual waste: no source separation
This is the cheapest way to collect “waste” and the collection costs are most often paid by the
municipalities. The quality of collected fraction is generally lower than the other two streams as the
materials are highly contaminated. However, where sorting of this stream is practised, the yields of the
different material fractions are appreciably higher than from the other two options.
Bring-points (drop-off containers)
Bring-point schemes tend to result in low to medium collection rates. They are based on the voluntary
behaviour of consumers who do not (normally) show strong commitment as long as there is no financial
incentive to participate. Although public authorities now largely encourage and sponsor the use of
bring-points, mixed plastics both cost relatively more to recover and they have the highest potential
for contamination (Dainelli, 2008). Consequently, the quality of the collected plastic packaging fraction
via this route is variable.
Other means
•! Deposit refund
This system relies on an additional fee at the purchase of a product. It is refunded when the packaging
is returned. This system is most widely used with beverage bottles. It allows for recovering a single
stream with high quality and consistent volume. Plastic packaging waste collected by deposit systems
are not often reported in the waste statistics. (BIPRO, 2015)
•! Recycling stations/local recycling depot
They are found to have the potential to improve the overall recycling rate of MSW, on condition that
they are convenient to use (close-by and suitable opening hours) and that the number of sorted
fractions is significant.
How do households pay for waste collection?
•! Pay As You Throw (PAYT) on residual waste
In a PAYT scheme, households are charged according to the amount of residual waste they generate
for collection. Whilst the quantification is normally based on the weight collected, it can also be based

- Confidential -
49
on volume (i.e. container size), or on the number of sacks, or on the frequency of the collection, or on
any combination of these (BIPRO, 2015). This system encourages citizens to reduce the volume of
residual waste, thus stimulating the separate collection. The EU capital cities who apply a PAYT scheme
achieve much better collection rates (BIPRO, 2015).
•! Fixed fee combined with PAYT
Some municipalities apply the PAYT combined with a fixed fee, which can be a fixed rate per household,
or bin.
•! Flat Rate
A flat rate can be applied. This means thatthere is a fixed rate per household.
Discussion and conclusions
In order to achieve high yields, high participation rates, low contamination rates and high potential for
sorting are required (WRAP, 2008). According to the BIPRO study, only 19% of the municipal waste
generated in Europe’s EU28 capital cities is collected separately: in other words, nearly 80% of the
waste ends up in the residual waste bin. These numbers are very significant considering that 156.8
kg/capita of packaging waste was generated in the EU-28 in 2012, translating into a total of 79.1 million
tonnes (Eurostat, 2015).
Many attempts have been made to clarify which collection system is optimal, but it seems difficult to
identify or converge on one solution. Finding the best systems primarily depends on parameters such
as the location (urban areas versus countryside), available infrastructure, and required transport to the
recycling centre. It remains a challenge to adapt the local waste management systems due to reasons
such as infrastructure, financial implications and lack of consistency in interpretation of regulations.
Collection is the first step post-consumption. Increasing collection of post-consumer plastics packaging
is a pre-condition to being able to achieve higher sorting and recycling rates. Although more than 80%
of flexible packaging is mono material and in principle recyclable (see chapter 2, section 2.3.), in most
European countries it still primarily ends up in the residual waste which is either sent for recovery in a
Waste to Energy plant or landfilled. Either way, it is not available to be sorted and recycled. To address
this, there has been several calls for separate collection of all plastic packaging, including flexibles.
However, at the time of this study this call had not yet gathered significant momentum.
5.1.2. Challenges in collection Two factors limit large separate collection: consumers’ behaviour and the available waste management
schemes.
Consumers’ behaviour
Consumers contribute to plastic collection when they source separate their waste. However according
to the BIPRO report for the European Commission on waste collection in the 28 capital cities in Europe
where most of the plastic separate collection relies on voluntary participation of citizens to separate
plastic packaging, the numbers tend to show that they are not committed to do so: approximately 80%
ends up in residual waste (BIPRO, 2015). Table 8 shows the percentage of separate collection in some
EU capital cities, as well as the plastic capture rate. Considering that the separate collection systems
are available in these cities (except Madrid), it could imply that either consumers are not sufficiently
informed on how to sort their waste or not sufficiently motivated to do so.

- Confidential -
50
Table 8: % separate collection (all systems) and plastic capture in some EU capital cities
City % of Separate collection
(all systems)
Plastic capture rate
Amsterdam 12.4% 2.5%
Berlin 27.4% 20%
Brussels 20.9% 0%
Copenhagen 23.7% 10.3%
Dublin 36.6% 25.5%
Lisbon 11.5% -
London 25.4% 15.9%
Madrid 11.6% -
Paris 11.6% 2.1%
Prague 14.3% 24.2%
Rome 16.3% -
Waste management schemes
The quantity of recovered plastics depends also on how waste collection is managed and financed. The
collection schemes are (mainly) financed by the EPR schemes to meet the European targets. As flexible
packaging is the lightest fraction, a lot has to be collected relative to other heavier packaging formats.
Also, due to its light weight, the proportion of ink and remaining product is high relative to the amount
of plastic available for recycling. For these reasons flexible packaging is often the last choice to be
collected to meet the national EPR obligations.
Conclusion on the collection for flexible packaging
The specific challenges in flexible packaging collection are:
•! The Packaging and Packaging Waste Directive recycling targets are weight based. lexible
packaging is not widely collected because some EPR schemes selectively collect the heavier
and more material intensive packaging fractions in order to meet their recycling obligations.
Lightweight flexible packaging is often not part of the collected fraction.
•! Many collection schemes are available often differing within countries and even by municipality.
This proliferation can bring confusion as to what is collected, what is not. Further, it makes the
flow of materials difficult to quantify.
•! Urban consumers generally show lower commitment to source separate, even though the
separate collection means are available.
5.1.3. Potential solutions For each step post-consumption (collection, sorting, recycling), opportunities/ideas for potential
solutions to the challenges presented were identified. These ideas/opportunities come from
brainstorming sessions, literature research and meeting discussions. For each section, the ideas are
listed and attributed a number, which is a classification following the Action Priority Matrix (Figure 24)
which classifies the impact and effort required by each solutions.

- Confidential -
51
On collection schemes:
•! Mandatory separate for collection for all plastic packaging including flexible packaging [1]
•! Apply PAYT schemes for residual waste in all Europe combined with the opportunity to
separately collect flexible packaging. [2]
•! Smart combination of EPR and rates paid by household [2]
•! Organising more deposit/refund systems [2][4]
•! Increase the number (thus proximity) of bring-points or recycling stations [4]
•! Favour commingled collection if strict separation is not possible [1]
•! More single stream collection [2]
•! Type of bins: more type of bins and homogeneous colours across Europe [2]
For consumers:
•! Education via better communication to households [2]
•! Challenges to raise awareness (e.g. 100/100/100: for 100 days, 100 households try to generate
less than 100 kg of waste) [2]
•! Clearer labelling system/ instructions for disposal [2]
•! Create financial incentives [2]
5.1.4. Conclusion for collection section Separate collection is a pre-requisite to achieve high quantity post-consumer flexible packaging
material available to be sorted and recycled. Although sorting and recycling would still remain an
economic challenge, investment in these infrastructures will/can only happen if there is a guarantee of
having input materials. For that significant changes in the waste management schemes are necessary
in most European countries combined with more active participation from (urban) households.
5.2. Sorting Post-consumer plastic sorting is the step where recovered plastics are separated into concentrated
fractions with a similar specification which, when combined, has a higher value. Sorting is an important
and critical step in plastic recovery during which plastic materials are classified into their plastic resin
type. The selectivity/accuracy of the sorter determines the “purity” of the sorted fraction which directly
Figure 24: Action priority matrix

- Confidential -
52
influences the value of the sorted bales and, to some degree, the quality of the future recycled
materials. This section presents the typical sorting technologies used in Europe, identifies the
challenges and the potential solutions to increase sorting of flexible packaging waste.
5.2.1. Sorting of lightweight packaging in Europe Sorting uses a combination of many technologies that are quite similar from sorting plant to sorting
plant. However, the sequences of these steps may differ. Figure 25 shows the sequences used by a
typical plastic sorting facility in Germany. This section describes briefly the sorting process.
Figure 25: Typical sorting steps
Process description
The collected (usually commingled) packaging arrives at the sorting plant and undergoes a
debaling/conditioning step, which serves to make the various items loose. Then, the various items are
separated according to their size, using a drum/rotary screens or vibrating screens. After that, an air
classification step separates heavy from lightweight materials. Films and papers belong to the
lightweight fraction and they are extracted out of the stream. Film grabbers are sometimes used
afterwards to recover remaining films from plastic and paper.
The heavier fraction undergoes further separation via a metal separation step where ferrous metals are
separated by a magnet, while non-ferrous (Aluminium) are separated by an Eddy Current sorter.
The remaining fraction, mostly concentrated plastics, is sent to ballistic separation. This classifies the
flow of materials into three fractions: 3D, 2D and sieved fractions. The heavy and rolling fraction (called
3D), which included rigid plastics, drinking cartons, rolls down the inclined screen. The flat and light
fraction (called 2D), which contains paper packaging and plastic films is carried up the inclined screen.
The sieved fraction; what falls through the screen, is typically not recyclable and contains organic waste,
soils or small pieces of recyclable plastic (Parini, 2015). Near-Infrared sorting (NIR) is performed on the
3D fraction. This effectively separates plastics into separate streams according to polymer type. This is
achieved by each polymer reflecting an identifiable light spectrum of the NIR which is detected by a
camera and instructs a compressed air jet ejection system to select the pack or to leave it for the next
NIR station which will detect a different polymer type or colour. This is a very rapid detection technique
where the sorting conveyor belts run at up to 5 m/s. The stream purity achieved by NIR sorting is usually
in the range of 80 to 95%. Repeated NIR sorting or high performing and well-configured systems can
achieve a purity exceeding 95% (WRAP, 2010). An additional manual post sort is sometimes performed
to achieve the highest purity of stream. Manual sorting still appears to provide the best sorting
accuracy. However, the main challenge of sorting plastic film manually is to do it cost efficiently. Finally,
the sorted materials are compacted in bales to be transported to the plastic recycler.
Flexible packaging in the sorting process
Generally, packaging sized lower than 50-70 mm is normally sorted out in the first sorting step (size
classification) of the sorting process and sent to recovery (normally waste to energy). This is the first
point of leakage for flexible packaging as very small flexible packs such as small candy wrappers are
“lost” during this step.
Debaling Size!separation
Air!classification
Metal!separation
Ballistic!separation
NIR!separation
Manual!sorting Baling

- Confidential -
53
During the air classification step, most flexible packaging is sufficiently lightweight to be extracted.
Whilst it depends on the sorting plant, flexible packaging is typically either part of the film fraction13
(specification DKR310), or the mixed plastics (specifications DKR 323, 350, 352), or the residual fraction
which is sent to energy recovery. The typically used DKR sorting specifications can be found in
APPENDIX 9
The flexible packaging fraction containing aluminium foil is unlikely to be extracted by Eddy Current
Sorting during the metal separation step. A plethora of parameters influence the Eddy Current sorting,
but it is widely reported that the relatively low Aluminium content together with the shape of the
packaging prevent it from being separated (APPENDIX 12 ).
The ballistic separation is the final point to separate remaining flexible packaging from the rest. It is
usually collected with the 2D fraction which is sent to mixed plastics. Only a tiny percentage might end
up in the NIR sorting, which would sort it according to the polymer type of the uppermost layer which
is exposed to the NIR light and camera.
Conclusion
Various technologies exist/are deployed to make the sorting of plastic packaging by plastic resin
feasible. These technologies were designed for and are well suited for rigid plastic packaging. In most
sorting processes today, flexible packaging is usually removed from other fractions in order to secure
the required quality standards specified by the DKR specification (Tönsmeier, 2016) and consequently
are not often available to be recycled.
In summary the sorting routes of flexible packaging are:
•! large flexible packaging (mostly PE film) are sorted with the film fraction which is normally recycled
•! small/medium flexible packaging will either be sorted in the film fraction (above) (where it is not
desired), or with the mixed plastics fraction.
•! very small flexible packs are usually sorted out in the first size sorting step and sent with the residual
waste for recovery.
5.2.2. Challenges in sorting Quantity and quality
Having sufficient quantity of secondary materials is necessary to build a business case and to supply
potential markets for secondary materials. This is a challenge for flexible packaging as much more
flexible packaging needs to be sorted relative to other packaging alternatives. Therefore, apart from
sorted bales of large flexible packaging (mainly PE), bales of sorted flexible packaging is (currently) not
very valuable on the market and are “sold” for between -40/€/ton to +40€/ton. The remaining flexible
packaging ends up in mixed plastics, or in residual waste sent to energy recovery.
The mixed plastics fraction has very low market value (typically -80€/ton) because it contains many
different plastic resins which require a further more sophisticated sorting step in order to generate
higher-value secondary material from it (Barlow, 2013).
In conclusion, in today’s situation where the quantities of flexible packaging collected for sorting are
limited, quantity and quality are contradictory requirements and difficult to achieve simultaneously, also
13 It should be noted that the film fraction aims at collecting large size (> DIN A4), which is larger than most of the food flexible
packaging.

- Confidential -
54
for flexible packaging. Increasing the quality of the sorted fraction (meaning to achieve sorting per resin
type) results in a drop in quantity and these factors are explored in the next section.
Factors influencing the quality:
•! Food contamination
The main advantage of flexible packaging is also its biggest drawback when it comes to sorting. Flexible
packaging has a small quantity of packaging material but a relatively large surface in contact of food
(high product to pack ratio). This means that these materials are relatively highly contaminated by
remaining food: often 10-20% of package weight (Morris, 2016). This reduces the plastic material yield
per ton of sorted plastic packaging and significantly decreases their value.
•! Multi-material combinations
“Sorted” material streams are considered “contaminated” even if they contain small amounts of other
materials. This is because the “contamination” impacts the secondary material yield and increases costs
for the recycler. In the case of immiscible multi-material structures (e.g. PET/PE or PET/PP
combinations), it would be necessary to identify, sort these into a multi- material stream and then to
separate the respective layers to achieve a pure stream of materials, which would then have the
possibility to be valorised (Barlow, 2013). An alternative technology would be to use compatibilisers
that increase the miscibility of the different polymers (Hausmann, 1996)
On the one hand, sorting needs to be sufficiently efficient to avoid as much as possible undesirable
combinations: for example, PET/PE, combination paper/film both of which have low/no market value
(or negative). However, on the other hand, having a high quality but a low volume might result in an
insufficient output at too a high cost to sustain a potential market application.
Sorting technologies for flexible packaging
Most of the small to medium size packaging which ends up in the mixed plastics fraction which is very
difficult to sort further. The NIR only registers the top material (2 µm penetration as a detection limit),
which is a real challenge in sorting multi-material structures accurately. The challenge is not only about
recognition of the material type which should also be ejected from the waste stream, but lightweight
nature of flexible packaging can make the accuracy of ejection random (i.e. it does not land where it is
supposed to).
Conclusions on the challenges in sorting of flexible packaging
The challenge is to achieve sufficient quality and sufficient volumes of materials to supply recyclers to
make the recycling of flexible packaging economically attractive. Mono-material flexible packaging has
a good potential to be recycled. However, sorting multi-material flexible packaging where the different
combinations of materials impact (or even prevent) the production of quality secondary plastics,
remains challenging and to date has no sustainable solution. An additional challenge is relatively high
level of soil/food residue that comes together with post-consumer flexible packaging waste.
5.2.3. Potential solutions in sorting In the same way as explained in section 5.1.3, ideas for potential solution to improve the sorting of
flexible packaging are proposed and classified according to the same Action Priority Matrix.

- Confidential -
55
•! New marker/tracer technologies that would be applied specifically to flexible packaging to
differentiate and sort mono-material and multi-material packaging [2]. Solutions include:
o! Chip in packaging
o! Special polymer markers to be detected by NIR
o! Diffraction grafting
o! Digital watermarking
o! Phosphorescent/fluorescent inks
o! Bar code
o! RFID
•! Boost sensor/sorting technologies in such a way that the sorting efficiency is increased. See
example: Polytech PI (99% identification) [2]
•! Having a collection programme that would only collect flexible packaging [2] [4]. This would
encourage consumers to source-separate the most valuable flexible packaging type.
•! Having a collection/sorting system that sorts food contact vs. non-food contact packaging [4]
•! New technology to eject the problematic fraction. For example, black plastic separation would be
ideal since 6 to 8% of PPW is made of black plastics (Attero’s presentation), but black cannot be
detected by NIR. Steinert is proposing a technology to solve this: UniSort BlackEye. [1]
•! NIR ejection system for flexibles [2]
5.2.4. Conclusion for sorting There is a wide variety of technologies to sort plastics into their respective plastic resin categories.
Currently, although most of the flexible packaging is still removed from the sorted waste stream to
secure the quality standards for rigid plastics, flexible packaging is found to be consistently sorted into:
•! plastics films for large size packaging
•! mixed plastics for small to medium size packaging
•! residual waste sent to recovery if small packaging
From work reported earlier it is important to realise that probably 80% of flexible packaging is likely to
be mono-material and therefore has good potential to be mechanically recycled, provided it is
collected and sorted. However, in order to deliver sufficient quantities of a given secondary plastic
resin/polymer and be economically viable, more recycling infrastructure will need to be developed in
parallel with additional flexible packaging sorting capacity.
5.3. Mechanical Recycling The project focussed on investigating opportunities for mechanical recycling as it appears to offer the
most promising results economically and environmentally. Although chemical recycling is also an
important route to consider, at the time of writing it is not yet considered environmentally or
economically attractive. Where mechanical recycling is not either economically or environmentally
interesting, waste to energy (recovery) offers a viable alternative to landfill in that the energy is
recovered for use in a Circular Economy.
This section describes the current recycling systems in Europe, the challenges and the potential
opportunities for the future. The information was mainly collected in project meetings and then further
developed.
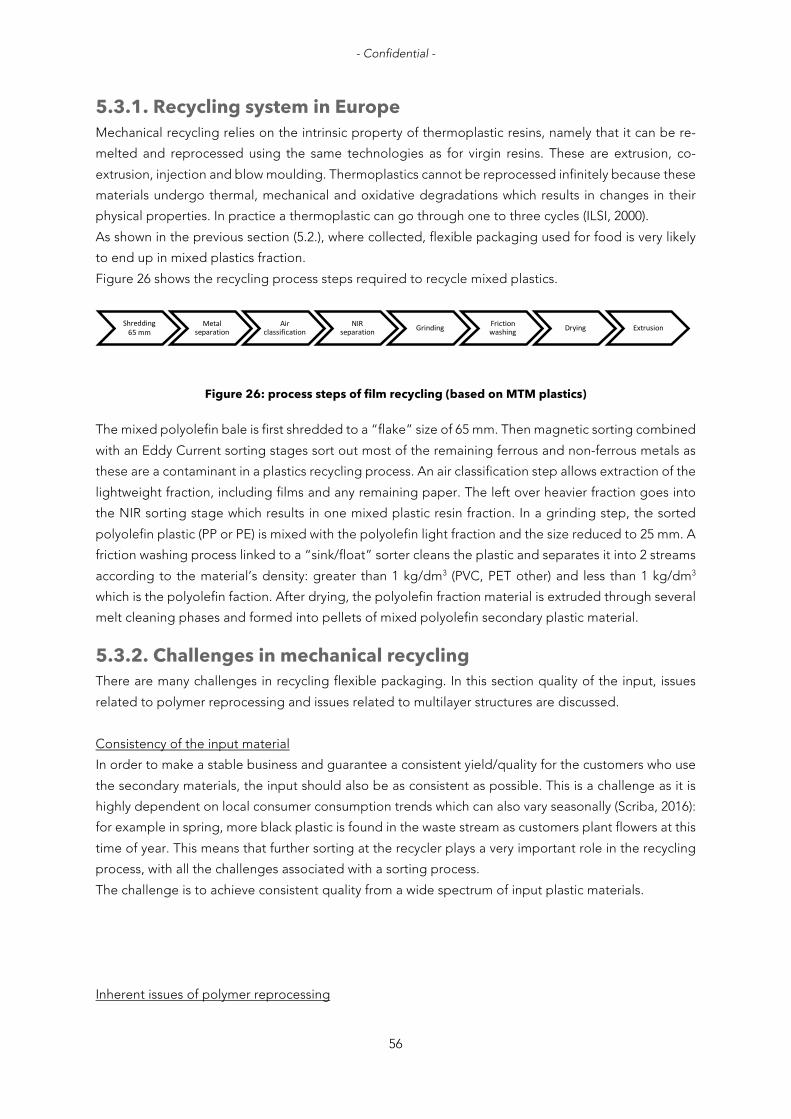
- Confidential -
56
5.3.1. Recycling system in Europe Mechanical recycling relies on the intrinsic property of thermoplastic resins, namely that it can be re-
melted and reprocessed using the same technologies as for virgin resins. These are extrusion, co-
extrusion, injection and blow moulding. Thermoplastics cannot be reprocessed infinitely because these
materials undergo thermal, mechanical and oxidative degradations which results in changes in their
physical properties. In practice a thermoplastic can go through one to three cycles (ILSI, 2000).
As shown in the previous section (5.2.), where collected, flexible packaging used for food is very likely
to end up in mixed plastics fraction.
Figure 26 shows the recycling process steps required to recycle mixed plastics.
Figure 26: process steps of film recycling (based on MTM plastics)
The mixed polyolefin bale is first shredded to a “flake” size of 65 mm. Then magnetic sorting combined
with an Eddy Current sorting stages sort out most of the remaining ferrous and non-ferrous metals as
these are a contaminant in a plastics recycling process. An air classification step allows extraction of the
lightweight fraction, including films and any remaining paper. The left over heavier fraction goes into
the NIR sorting stage which results in one mixed plastic resin fraction. In a grinding step, the sorted
polyolefin plastic (PP or PE) is mixed with the polyolefin light fraction and the size reduced to 25 mm. A
friction washing process linked to a “sink/float” sorter cleans the plastic and separates it into 2 streams
according to the material’s density: greater than 1 kg/dm3 (PVC, PET other) and less than 1 kg/dm3
which is the polyolefin faction. After drying, the polyolefin fraction material is extruded through several
melt cleaning phases and formed into pellets of mixed polyolefin secondary plastic material.
5.3.2. Challenges in mechanical recycling There are many challenges in recycling flexible packaging. In this section quality of the input, issues
related to polymer reprocessing and issues related to multilayer structures are discussed.
Consistency of the input material
In order to make a stable business and guarantee a consistent yield/quality for the customers who use
the secondary materials, the input should also be as consistent as possible. This is a challenge as it is
highly dependent on local consumer consumption trends which can also vary seasonally (Scriba, 2016):
for example in spring, more black plastic is found in the waste stream as customers plant flowers at this
time of year. This means that further sorting at the recycler plays a very important role in the recycling
process, with all the challenges associated with a sorting process.
The challenge is to achieve consistent quality from a wide spectrum of input plastic materials.
Inherent issues of polymer reprocessing
Shredding!65!mm
Metal!separation
Air!classification
NIR!separation Grinding Friction!
washing Drying Extrusion

- Confidential -
57
•! Polymer degradation
During the life span of thermoplastics, they are exposed to various types of degradation. In the
(re)processing, thermoplastics undergo thermo-mechanical and/or thermo-oxidation whose
consequences are diverse (Al Salem, 2010). Thermo-mechanical degradation due to temperature and
shear in the process causes polymer chain scission. This results in a drop of the molecular weight (Mw)14.
It should be noted that the higher the Mw of the primary polymer, the greater the melt processing
degradation. This phenomenon happens randomly on macromolecules with low Mw while it is selective
for macromolecules with high Mw. A drop in Mw has several consequences on the properties of the
final material: lower intrinsic viscosity, reduced melt strength and processability occurs. Further, a drop
in Mw also causes an increase of crystallization capacity, reduces the density and can change the colour
(the material becomes opaque when highly degraded). In contrast, thermo-oxidation tends to lead the
formation of free radicals, thus favouring crosslinking (meaning increase in Mw).
To prevent polymer degradation during the service life of the plastic, stabilisers such as antioxidants
and UV stabilisers are added to the polymer matrix. When reprocessing polymers, it is common practice
to again add stabilisers, which should be compatible with the resin mix.
Conclusion: Polymer degradation is inevitable and causes change in material properties. The main
challenge is to limit the degradation. To do this, it is necessary to gain more understanding the
mechanisms of degradation and the influence of blending additives together.
•! Polymer grades and contaminants
A polyolefin fraction containing only one type of polymer actually contains several different grades of
that polymer. Each grade has a specific molecular distribution (weight-average molecular weight Mw
and number-average molecular weight Mn) and a variety additives (stabilisers, modifiers, inks…)
(Barlow, 2013). Blending different grades will impact the processability and the resulting mechanical
properties of the secondary materials. Adding more additives risks causing further material degradation
and needs to be studied as previously mentioned.15
•! Compatibility/Miscibility
Despite sorting, impurities always remain. For example, in the specification DKR 310 for large plastic
films, the minimum allowed purity is 92% by weight. This means that 8% of other materials (including
other plastics) might remain. In a mix of polymers A and B, chains of A and B tend to group apart from
each other. This is due to the difference in structure and in polarity. Some plastics are not compatible
with each other because of their immiscibility at the molecular level. Table 9 shows the compatibility of
polymers based on whether they are the excess component or the additive component. It is essential
to achieve the most compatible and homogeneous blends in order to preserve the material properties.
One method to address this is to use “compatibilisers” to increase quantity and quality of the final
materials.
Table 9: Material Selection – Use of compatible materials (Eco3E, 2016) Green: good compatibility; orange: partial compatibility; red: incompatibility without addition of compatibilisers
14 Note: This is true for polyester or polyamides. Polyolefins like PE will increase in molecular weight first and create gels.
15 Note: Recycling stabiliser additives are available to address this.

- Confidential -
58
Excess component
PA PE PET PP PS PVC TPU
Additive
component
PA
PE
PET
PP
PS
PVC
TPU
Additional issues specific to multi-material flexible packaging (representing c.a. 20% of the flexible
packaging market volumes)
•! Several polymer types are combined in multi-layers.
A larger variety of polymer grades are used in flexible packaging to achieve a unique set of properties.
The ability to combine different materials is a key feature of the performance of flexible packaging.
However, this leads to higher chance of having incompatible/immiscible polymers combined together
in the same pack. This is why recycling of industrial and commercial films is more viable as there are
fewer polymer types in the collected stream: c.a. 95%v are either LDPE, HDPE or PP. Whilst these
polymers are easily separated from the others using density separation, they are difficult to be
separated from each other. (Barlow, 2013)
•! Combinations of thermoplastics with non-thermoplastic materials
In flexible packaging, thermoplastics may be laminated with other materials such as paper and
aluminium foil. Generally, the more complex the plastic stream is, the more difficult it is to recycled
mechanically. Also, the more contaminated the input material stream is with food and other materials,
the lower the yields on a per ton/bale basis which impacts profitability. In addition, these multi-layer
materials are assembled using adhesives (PUR or acrylate adhesives), which, as there is currently no
separation step in the process, normally prevents their separation during recycling into the respective
polymer fractions.
Paper is found to give lumps in the melt fraction. It is technically challenging to remove 100% of the
paper fibres in a hydro-pulping pre-step. Remaining fibres negatively impact the final material
properties. It also absorbs humidity and food which might contributes to a “bad odour” in the final
material.
Aluminium, another commonly used layer in flexible packaging (for the provision of excellent barrier
properties and other functionality), does not melt at the recycling process temperatures and results in
off colour (isolated spots of different colours) in the final product (Scriba, 2016). Melt filters can be used
to remove some level of the heterogeneities, but are not designed to remove large quantities. For this
reason, it is preferable to remove these materials prior to the extrusion and pelletizing stage.
- Confidential -
59
•! Effect of combination of materials on specific density
In a recycling process, separation steps have to be made to further increase the purity of the polymer
streams. One of the key technologies is separation based on density (float-sink, hydrocyclone). In a
multilayer laminate, plastics of different densities are combined in various proportions resulting in an
“averaged” final density which might interfere/contaminate streams of a single polymer with the same
density. The use of mineral fillers can cause the same issue.
•! Heavily printed materials
The effects of printing inks on final mechanical properties are not believed to cause a mechanical
deterioration of the secondary material. However, printing inks contribute to the final colour obtained
(greenish/grey) as the pigments remain. Furthermore, printing inks influence the selection of the
extruding process: specialised extruders need to be used for recycling printed films as many of the ink
components are volatized during the extruding process and gases that are formed must be vented to
avoid gas bubbles in the final product. More understanding is needed to understand the magnitude of
the printing ink issue in determining the final material colour compared to the colour coming from the
master batch in the virgin plastic.
5.3.3. Potential solutions for recycling In the same way as explained in section 5.1.3, ideas for potential solutions to improve the quality and
the quantity of secondary materials coming out of the recycling process are proposed. They are also
classified according to the same Action Priority Matrix.
Change or improvements to the flexible packaging recycling process
•! Filtration technologies
o! Melt filtration in series with decreasing screen dimensions to remove all kind of lumps [1]
o! Develop a process similar to Size Exclusion Chromatography to separate polymers by
molecular weight ! get homogeneous melt and controlled mechanical properties [2]
o! Develop filtration for fine particle removal such as fine Al and pigments [2]
•! Odour removal/neutralisation [1]
o! Add (encapsulated) fragrances in the extrusion of the secondary material (e.g. citrus, vanilla)
o! Add microporous additives (e.g. activated carbon, aluminosilicates, zeolites)
o! Neutralizing agent to reduce volatility of compounds
o! Stripping agents =degassing in the extruder to remove volatile compounds
•! Improve cleaning process to remove paper, glue, remaining food/other contaminants [1]
o! Temperature (Hot and Cold wash)
o! pH variations (NaOH, THF, HF, HClO4)
o! Surfactants
o! Friction washers
•! Develop a specific recycling process for multilayer packaging e.g. detaching the adhesive
between the layers ala the Saperatec technique to recover the individual polymer layers [2]
o! Sequential dissolution in solvent
•! Compatibilizers in the recycled material to improve the properties of the secondary material [1]
o! built in compatibilisers - replace crosslinked adhesives by thermoplastic coextrudable

- Confidential -
60
adhesive systems
•! Combination of processes [2]
o! Combine mechanical recycling and fermentation = remove paper and compostable materials
by fermentation first, then recycle
o! Combination chemical recycling and mechanical recycling (e.g. depolymerise PET and
recover aluminium and other thermoplastics)
Focus on adhesives
•! Screen potential new technology offers [2]
o! E.g. Magnetic nanoparticles
o! E.g. Patent FR 2852965. A foaming agent is added in the adhesive. Under the appropriate
energy input, this agent liberates gas at the interface, thus facilitating the delamination.
o! E.g. Patent EP 2408871 A1. Method for detachable gluing for porous materials
o! Saperatec
•! Find alternative to current adhesives [1] [2]
o! Adhesives compatible with the recycling washing process (e.g. water soluble glue 60°C-80°C)
o! Alkali-soluble hot melt adhesives (see paper industry and patent US 4289669)
o! Thermoplastic coextrudable tie layers (which can also be used as compatibiliser in the final
recycling process).
o! Natural glue (wax)
o! Reversible thermoset adhesives (reversible crosslinking using Diels Alder reaction, Patent US
9260640 B1)
•! Other laminating technology [2]
o! Extrusion / tie layer
o! Ultrasonic welding
o! Thermal sealing
o! Physical adsorption
•! Delamination [1] [2]
o! Degrade polyurethane adhesives above 200°C16
o! Separating multi-layer materials by micro-emulsion technology (e.g. Saperatec)
o! Use solvent to dissolve adhesives (e.g. acetone at 50°C)
o! Hydrolysis of polyurethane
o! Enzyme or bacteria to breakdown glue
o! Microwave induced delamination
Focus on Inks and pigments
Ink removal
•! Colour removal by flotation (see practices in paper industry) [3]
•! Evaluate Starlinger recoSTAR technologies for heavily printed plastics [1]
•! Clean the inks using supercritical fluid [2]
•! Washing out inks with solvents [1]
•! If using organic inks, check potential for decolouration by hydrogenation, bleaching, UV light to
16 Note: Considered sub-optimal because of needing to deal with the resulting degradation products.

- Confidential -
61
destabilise the double bonds [1]
•! If using inorganic inks, check potential of chelates, magnetic separation, develop a technology
that enables pigments filtration [2]
Ink developments
•! Water soluble ink, compatible with both the functional performance requirements and the
recycling washing process [2]
•! Thermochromic ink/thermolabile sublimable colorant compatible with the recycling process [2]
•! Design ink changing with external changes: UV light change, pH change, temperature [2]
•! Design a colour change with size reduction [2]
•! Ink that covers all the others [1]
Change in packaging design and its manufacturing
•! Sacrificial layer (to have all the recycling disruptors on one side, and the recyclable part on the
other) (unproven) [2]
•! Packaging lamination [1] [2]
o! Apply adhesives only where needed, only at the sealing points
o! Decrease amount of adhesive used (check if specifications are not set too high)
o! Create a loose pouch inside the packaging, detachable by consumer
o! Layer separation by consumers
o! Use thermoplastic adhesives that serve as recycling additive/compatibiliser
o! Replacing laminates by co-extruded structures to facilitate recycling later
•! Clean at home [1]
•! Design super slick coating to empty completely (e.g. LiquiGlide MIT) [2]
•! Go for lighter colours [1]
•! Material selection [2]
o! Biopolymers
o! Reduce or eliminate paper in combination with plastics
o! Use Aluminium foil instead of metallised substrate
o! Compatible Polymers
o! Include recycled content (when non-food application)
•! Regulation [2]
o! Polymer standardisation
o! Determine a unique specific density for multi-layer materials
5.3.4. Conclusions for recycling This project focuses on mechanical recycling as this would appear to offer the most promising results
economically and environmentally. The mechanical recycling process consists of further sorting of the
materials at the flake level and re-melting of the sorted plastic resin. A lot of challenges need to be
overcome to achieve both high quality and high quantity of secondary materials from flexible
packaging. The quality is mainly influenced by the natural degradation of plastics during lifespan and
during its (re)processing, but also by the blending of materials from different sources and of different
composition, giving inconsistent quality. This greatly changes the microscopic structure and influences
the final properties of the materials.

- Confidential -
62
A lot of solutions could be implemented or would be worth investigating further. However, discussions
on how to improve plastic packaging mechanical recycling remain theoretical unless the issues of wider
collection and better sorting are addressed first.
5.4. Classification of the challenges to achieve quality secondary materials In this section the challenges are classified according to two different approaches. First the challenges
are distributed along the supply chain. This highlights the impact of each stakeholder group on the
final quality and quantity of secondary materials. The result of this work will help in allocating future
projects to solve specific issues.
Secondly, the challenges are classified by order of importance. Previous sections of this report have
identified a number of challenges to be overcome in the supply chain. In order to map future work it is
important to know which challenges if solved offer the most potential benefits and should be
prioritised.
5.4.1. Contribution from the supply chain A series of challenges have been identified in each step post-consumption: collection, sorting, and
recycling. The Kepner-Tregoe method was used to identify in a systematic way the root of the issues
and to assess the contribution from the supply chain to these issues.
The Kepner-Tregoe method consists of asking for each member of the flexible packaging supply chain
the following questions:
•! What do you have/do that impact the quality of the secondary material?
•! What are the impacts on the quality of secondary material?
•! How big are these impacts?
The input to this table comes from the Kick-off meeting discussion among the stakeholders. Results
are found in the Table 10.
Table 10: Kepner-Tregoe method to assess the contribution of the supply chain
Who?
What do they have that impact
quality and/or quantity of
secondary materials?
What are the impacts/levers?
How big is
the
impact?
Polymer and
film supplier
Polymer technology Wide variety of RM, polymer blends
Multilayer polyolefin films ++
Plastics additives May be source of contamination / degradation +
Adhesive
supplier
Laminating adhesives
Extra material type to the packaging (although it
might be compatible with PET and PA).
Challenge to separate layers
Non thermoplastic material (however might flow
in extruder)
+++
Ink supplier Inks, varnishes and primers Determine colour of recycled material ++
Converter
Produce polymer films from a
wide range of polymer grades High mix of grades at the recyclers ++
Laminating processes
(primers and adhesives)
Difficulty to separate layers
! Retrieve pure materials? ++
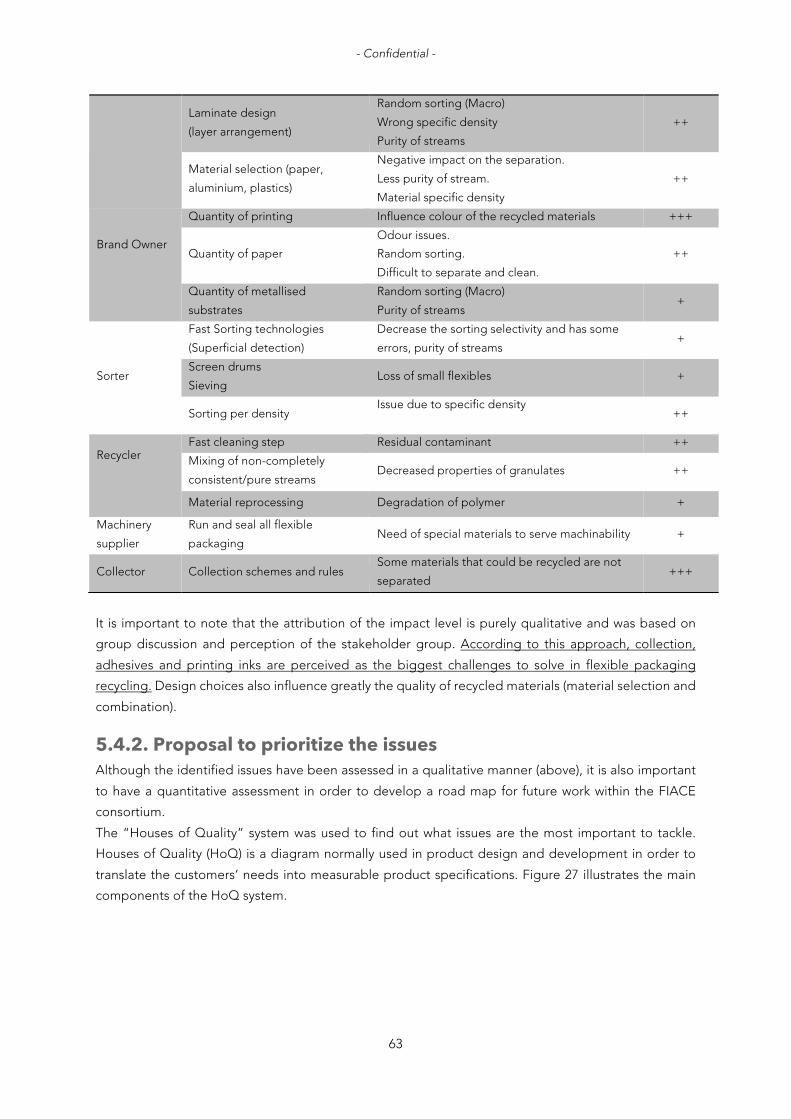
- Confidential -
63
It is important to note that the attribution of the impact level is purely qualitative and was based on
group discussion and perception of the stakeholder group. According to this approach, collection,
adhesives and printing inks are perceived as the biggest challenges to solve in flexible packaging
recycling. Design choices also influence greatly the quality of recycled materials (material selection and
combination).
5.4.2. Proposal to prioritize the issues Although the identified issues have been assessed in a qualitative manner (above), it is also important
to have a quantitative assessment in order to develop a road map for future work within the FIACE
consortium.
The “Houses of Quality” system was used to find out what issues are the most important to tackle.
Houses of Quality (HoQ) is a diagram normally used in product design and development in order to
translate the customers’ needs into measurable product specifications. Figure 27 illustrates the main
components of the HoQ system.
Laminate design
(layer arrangement)
Random sorting (Macro)
Wrong specific density
Purity of streams
++
Material selection (paper,
aluminium, plastics)
Negative impact on the separation.
Less purity of stream.
Material specific density
++
Brand Owner
Quantity of printing Influence colour of the recycled materials +++
Quantity of paper
Odour issues.
Random sorting.
Difficult to separate and clean.
++
Quantity of metallised
substrates
Random sorting (Macro)
Purity of streams +
Sorter
Fast Sorting technologies
(Superficial detection)
Decrease the sorting selectivity and has some
errors, purity of streams +
Screen drums
Sieving Loss of small flexibles +
Sorting per density Issue due to specific density
++
Recycler
Fast cleaning step Residual contaminant ++
Mixing of non-completely
consistent/pure streams Decreased properties of granulates ++
Material reprocessing Degradation of polymer +
Machinery
supplier
Run and seal all flexible
packaging Need of special materials to serve machinability +
Collector Collection schemes and rules Some materials that could be recycled are not
separated +++

- Confidential -
64
Figure 27: Houses of Quality
Introduction to the methodology
The methodology has been modified to prioritize the issues in the following manner. The “customer
requirements” are the ones needed by a plastic recycler (e.g. Mtm Plastics), whose goal is to achieve
high quality and high quantity of recycled materials. Based on the group discussion, these requirements
were defined to be:
o! The secondary material is odourless
o! It is as light in colour as possible and ideally transparent
o! Mechanical properties should be as close as possible to virgin materials’ ones (e.g. impact
strength)
o! The secondary material should have good processability (e.g. melt flow index)
o! Large quantities/volumes should be produced
The HoQ methodology was used in a systematic way to find the causes and factors that influence the
recyclers’/customers’ needs.
In the first House of Quality, a set of factors were identified as the factors preventing the recycler from
achieving good quality and quantity of final product. A relationship matrix is used to observe the inter-
relationship between the customer requirements and the causal factors. In the roof of the house, there
is another relationship matrix to see if the causal factors are interrelated. In the second house of quality,
the causal factors obtained from the first HoQ are listed out in the column on the left, and the process
repeated. The two HoQ’s can be found in the APPENDIX 8 .
Results & Conclusions
This methodology allowed the largest challenges that negatively influence the quality of secondary
materials to be identified.

- Confidential -
65
•! The first HoQ shows that the two main factors influencing the quality of the final product are the
homogeneity of the melt in the extruder as well as the physical contamination remaining on the
plastics when it enters the recycling facility. What is interesting to note is that these two challenges
are positively related: decreasing the physical contamination of the plastics entering the process
simultaneously helps the homogeneity of melt. No trade-off is needed here.
•! The second HoQ more specifically identifies the factors that most influences the quality of the
secondary materials. Per order of importance, these factors are:
o! Compatibility/Miscibility between in the polymer blend (578,9)
o! The number of thermoplastics of different nature (454.4)
o! The amount of material that is not thermoplastics (e.g. aluminium, paper, adhesive…)
(440.7)
o! Sorting Efficiency at the flake level (430.9)
o! Polydispersity index (344.1)
o! The amount of printing ink (306.4)
o! The amount of environmental dirt (sand, dust, decayed food) (306.2)
Changing flexible packaging design keeping these parameters in mind could help mitigate the issues
observed in the recycling process and improve the quality of the secondary materials.
5.5. Chapter conclusion The chapter has provided an overview on how collection, sorting and mechanical recycling is currently
done in Europe. Furthermore, it has identified the challenges that flexible packaging faces in each of
these steps. To summarise:
•! In the collection step, it is believed that flexible packaging is not widely collected because
some EPR schemes selectively collect the heavier and more material intensive packaging
fractions in order to meet their recycling obligations .
•! When it comes to sorting, flexible packaging is currently extracted in order to “purify” the rigid
plastic stream, but does not undergo further sorting. Moreover, flexible packaging is usually
not found to be an interesting/valuable fraction to sort due to low volume and high
contamination among others. When sent for recycling, flexible packaging is usually sorted into
the mixed plastic fraction. To further sort the small flexible packaging removed during the first
size sort will require investment in additional sorting capacity and capability
•! A large part of the recycling process is dedicated to further sorting at the flake level.
•! The biggest challenge identified for flexible packaging recycling comes from the multi-
materials of flexible packaging (which represents c.a. 20% of the post-consumer flexible
packaging volume).
•! Flexible packaging faces the same challenges as other plastics in reprocessing the materials.
Finally, the challenges have been classified in two ways. First, the challenges have been distributed
among the supply chain actors and their ability to influence the challenge(s) assessed qualitatively.
Secondly, the challenges have been classified by order of priority. It is hoped that these two
perspectives will facilitate the briefing and allocation of future projects.

- Confidential -
66
6 Design of two
packaging examples
An important part of the project is to try to incorporate the learnings from the previous chapters into
the design of two flexible packaging examples to see if/how their design could be improved to make
them easier to recycle i.e. producing higher value and volumes of secondary materials. The chapter first
details the methodology followed for the design and explains the framework used. Then the two
packaging examples are presented in more detail: their structure, their current manufacturing process
and the way they are currently circulating post-consumption in the sorting and recycling processes.
After generating multiple ideas and concepts, the most promising design solutions are presented and
evaluated.
6.1. Design methodology In order to deliver the two design solutions, it was decided to follow the basic design methodology
derived from the TU Delft course “Advanced Principles in Process and Product Design”.
The methodology has several steps as shown in Figure 28. First, the design problem is defined in order
to capture what the design should solve. Then the stakeholders and their needs are identified: this
allows a first set of criteria to be produced in order to evaluate the design solution. The stakeholders’
needs are often non-tangible desires that a designer should then translate into(measurable)
requirements to assess the design in a scientific manner and to set the specifications. Then design ideas
are generated and combined into concepts. The best concept is selected via an evaluation matrix, and
further evaluated/refined. Finally, conclusions are provided on whether the design meets the
challenges.
Figure 28: Methodology chosen for the design of the two packaging examples
1. Design problem definition
2. Stakeholders and needs
3. Requirements and specifications
4. Creating design ideas
5. Generating concepts
6. Selection7. Evaluation
(Stakeholders)8. Conclusions

- Confidential -
67
6.2. Design framework The BOSCARD method helps to frame the design work by defining the background of the project, the
design objective, the scope of the work, the constraints, the assumptions, the resource of the project
and the deliverables.!
6.2.1. Background As explained in the Introduction Chapter, the Circular Economy has become increasingly important in
the past years. Although flexible packaging is proven to be very resource efficient, it is not (yet) widely
recycled, and this is perceived as a key weakness in a Circular Economy. Challenges in collection,
sorting and recycling have been discussed and potential solutions identified (chapter 5). Using this
learning, the design work aims at testing/evaluating the effectiveness of some of the solutions in
increasing the recyclability of two packaging examples: an aluminium laminated plastic pouch and a
flow wrap. These structures are very challenging in the recycling process due to their multi-material
composition, but they are deemed very important to investigate, as they are widely used in many food
categories including sweet and savoury snack packaging, confectionery packaging, dried processed
food packaging, soup packaging and many others.
6.2.2. Design objective The objective is to (re)design an aluminium laminated plastic pouch and a flow wrap in order to improve
their recyclability whilst maintaining their functionality. The latter means that the product containment,
the product protection, the communication role of packaging and its convenience cannot be
changed/compromised.
With respect to recyclability, the aim is to facilitate the flow of the post-consumer materials through the
current sorting and recycling processes to increase the yield of secondary materials. Additionally, the
designs should help tackling the main issues that were identified in the House of Quality (see section
5.4.2.) and recapped in Table 11.
Table 11: Results of the HoQ shows the issues to be solved, per order of importance
General issues Specific issues
1.! Homogeneity of polymer melt
2.! Physical contamination
1.! Compatibility/Miscibility issue
2.! Number of thermoplastics (grades or nature)
3.! Percentage of materials that are not
thermoplastics (Alu, paper, glue…)
4.! Sorting Efficiency at flakes level
Note: Considering recyclability during design is a way to further support resource efficiency and the
circular economy, potentially improving the overall environmental performance of the pack
(considering the entire life cycle) .
6.2.3. Scope To realise the design of the two packaging examples, the Table 12 gives an overview of the tasks that
are covered by the design work, and the ones that are not.

- Confidential -
68
Table 12: Scope of the design work In scope Out scope
Material considerations Change of processes
Layer arrangement Implementing new technologies
Possibility of immediate change Change of size and shape as it already corresponds
to customers’ preferences
Change on printing inks (need to confirm first the
influence of printing inks on the colour of the final
product)
6.2.4. Constraints The product design needs to cope with both design constraints and time constraints.
Design constraints
The product should adjust to existing processes and current infrastructures.
The design concepts proposed should fit with their current manufacturing/packaging lines (horizontal
form fill seal lines described in APPENDIX 10 ).
The design solutions should fit with current sorting technologies (Attero, Tönsmeier), and fit with
current mechanical recycling processes (MTM plastics).
Time constraints
The design phase of the project is relatively short (± 2 - 3 months), which means that the assessment
will mainly be qualitative.
6.2.5. Assumptions The following assumptions were made for the design.
•! The flow-wrap is assumed to contain a sensitive product such as ice cream or chocolate bars.
•! The aluminium laminated plastic pouch is assumed to contain a dry product (e.g. dry soup, dry
pasta sauce).
•! Food residue in a packaging is a parameter that can influence strongly the quality of the final
material, if the packaging is not sufficiently emptied (by customers) or washed (in the recycling
process). In this design work, it is assumed that the packaging is completely emptied by the
customer. There is no residual food, thus the design does not aim at reducing these
contaminants entering the recycling process. This is also the reason why it is assumed to have
a dry product in the aluminium pouch and a sensitive product like ice cream or chocolate bar
in the flow-wrap, as these products usually give low residue.
•! That all plastic packaging is collected, sorted and sent for recycling.
•! When entering the sorting facility, the packaging returns to a flat shape.
•! In the current situation, it would be satisfactory if the two packaging examples, when sorted,
end up in the mixed plastics (DKR 350) or mixed polyolefin (DKR 323) or films (DKR 310).
Specifications can be found in APPENDIX 9 .

- Confidential -
69
6.2.6. Resources The resources of the project are one designer and the group of stakeholder experts to give necessary
input and feedback on the designs based on their experience.
6.2.7. Deliverables Two design solutions are expected: one for the aluminium plastic pouch and one for the flow wrap with
increased recyclability.
6.3. Analysis of the two packaging examples Before starting the design process, it is important to analyse the two packaging examples. In this
section, the structure of the packaging examples will be described to understand the composition and
the role of the various layers. The current packaging lines will be presented, as the new designs should
filled and sealed on the same lines. Finally, it will be shown how these packs currently go through a
typical fully automated sorting facility and state of the art recycling facility.
6.3.1. Packaging presentation The structure of the aluminium pouch and the flow wrap to be studied are described to understand
their composition and the role of each layer.
Aluminium laminated plastic pouch
The standard aluminium foil laminated plastic pouch is a pack with a high barrier capacity. It is used for
various applications such as drinks, pasta sauce, soup, and stewed fruits. For the FIACE study, it is
assumed to contain a dry product packed via a horizontal form, fill, seal machine (HFFS) (see Packaging
lines in APPENDIX 10 . The pouch is typically made of three main materials:
•! The polyethylene terephthalate (PET) layer (12 µm) on the outside provides transparency, gloss,
good printability, toughness and temperature resistance. The latter is needed for the sealing of the
pack: the outer layer should be capable of handling the temperature until the inner layer is
completely heat-sealed. 3 g/m2 of printing inks is used on the PET for branding and visual
information on the product.
•! The Aluminium foil (7 µm) provides a high barrier to light and gasses, microorganism, and odours.
The aluminium also helps the machinability.
•! The polyethylene (PE) layer (75 µm) on the inside gives a body to the packaging and its stiffness. It
offers good heat sealability, puncture resistance and food compatibility at an affordable price.!!The layers are laminated with 1.5 g/m2 and 3 g/m2 of polyurethane (PUR) adhesives as shown on Figure
29. It is worth noting that the specific density of this packaging is around 1.3 g/cm3.

- Confidential -
70
Figure 29: standard aluminium laminated plastic pouch
Flow wrap
The flow-wrap is a mono-film, which is used for applications such as ice cream on a stick, chocolate
bars, confectionary, and biscuits. For the FIACE product, it is assumed to contain a sensitive product
like an ice cream or a chocolate bar. Products are packed via a Horizontal Form Fill Seal (HFFS) flow
wrapper (see Packaging lines in APPENDIX 10 ). The various constituents of the packaging are the
following.
•! The main component is a layer of oriented polypropylene [OPP] (35 µm). The OPP advantage is due
to its strength and stiffness (increased as compared to normal propylene), its lower elongation
(harder to stretch), its clarity, its easiness to coat, print and laminate. OPP may contain fillers like
titanium dioxide or calcium carbonate in order to provide a white colour, which allows for slower
product deterioration due to external light sources. The white colour might also be an optical
requirement as it facilitates good printing. Moreover, OPP can be cavitated and it is then called
OPPopac. The cavitation is brought by gas injection after the dye in the extrusion process. This
cavitation allows for a decrease in the polymer consumption, an increase in the stability of the pack
(meaning the structure is less flimsy) and makes the film non-transparent. Together with fillers, it
gives a paper effect. It is important to note that the density drops from 0.9 g/cm3 (PP) to a density
comprised between 0.5 and 0.75 due to the cavitation.
•! An optional metallisation layer (0.04 µm Aluminium) can be vapour deposited on the OPP to
provide attractiveness and an impression of quality. This metallisation also allows for barrier
properties (e.g. Ultraviolet light protection, oxygen and moisture).
•! In case of metallisation, a primer (0.5 g/m2) is needed to prepare the surface for printing. Generally,
an acrylic or polyurethane component is used.
•! The print (2 – 3 g/m2) allows for the branding and the visual attractiveness of the packaging.
•! A release lacquer (1.5 g/m2) is used for the outer layer for its anti-scratch properties. It also eases
the unwinding and prevents blocking of the material when stored on the reel. The choice of
materials depends on the type of sealing. In the case of sensitive products, cold sealing is used to
not damage the product. Here polyamide (PA) is a material of choice.
•! On the inner part of the packaging, there is a layer (3.5 g/m2) of cold seal deposited on 40% of the
surface in order to close the packaging. The nature of the cold seal adhesive depends on the
sensitivity of the product and the machinery speed. Usually a cold seal is made of natural rubber
latex, aqueous based (95% of the formulation). Other ingredients include: extenders, anti-oxidant

- Confidential -
71
(as rubber deteriorates rapidly with oxygen). The cold seals seal only to themselves when pressure
is applied. It is important to note that a cold seal can never offer the same product protection and
hermetic seal qualities as a heat seal film, but is a material of choice to deal with heat sensitive
products.
The structure of the flow-wrap is: lacquer/print/primer/(metallized) OPP(opac/cold seal, as shown on
Figure 30.
Figure 30: flow wrap
6.3.2. Packaging in the sorting process In this section it is analysed how the two packaging examples go through a typical post-consumer
packaging sorting process (Figure 31) whose input is co-mingled packaging. This process, which is
detailed in APPENDIX 11 , will serve as reference for the product design. Other sorting processes, which
use the same principles and units but in different sequences, can serve to test the robustness of the
design.

- Confidential -
72
Figure 31: sorting steps
Standard aluminium foil laminated plastic pouch in the
sorting process
•! If collected, the pouch likely ends up in the 20 – 330
mm fraction.
•! In the air classification, the pouch is not as light as
paper and films (density ~ 1.3 g/cm3), and mostly
remains in the heavy fraction.
•! In the Eddy Current sorting/ metal separation, the
pouch is unlikely to be sorted out (according to the
observations made by sorters). It could be that the
Aluminium content is too low to be detected, or
that the shape is not favourable for the detection
and/or ejection of the pouch. Further explanation
is available in APPENDIX 12 .
•! Consequently, most pouches end up in the 2D
fraction, corresponding to the specification for
Mixed Plastics (DKR 350 – DKR 323).
Flow-wrap
•! If collected the flow-wrap will likely end up in the 20 – 330 mm fraction.
•! Most of it is separated in the air classification and ends up in the light fraction and probably sorted into
the following categories:
o! Film fraction
o! Mixed plastics/polyolefin
•! In the case where it is not sorted out in the air classification, it will be sorted by ballistic separation and
will end up in the 2D fraction (Mixed plastics/polyolefin – DRK 350 – DKR323)
6.3.3. Packaging in the recycling process In this section it is analysed how the two packaging examples go through typical recycling processes
as shown on Figure 32 and Figure 33. Details of these processes can be found in APPENDIX 13 .
As a reminder, the Aluminium foil laminated pouch was found to be sorted as part of the mixed plastics
stream, while the flow-wrap is sorted both as film or mixed plastics.

- Confidential -
73
Figure 32: Mixed polyolefin recycling
process
Standard aluminium foil laminated plastic pouch
•! Once the plastic pouch is shredded to a size of 65 mm, the
packaging pouch is likely reduced to a single layer of material (but
made up of multiple layers). When this happens, the aluminium foil
thickness is only c.a. 7 µm, so it is unlikely that the material will be
detected by the Eddy Current sorter17.
•! In the air classification step, more random sorting is observed due
to differences in weight and shape. (The specific density of the
material is around 1.3 g/cm3). Some of the material might be sucked
out of the process while the rest continues to the next step.
•! In the NIR sorting, random sorting is again normally observed. As
above, the now single layer material means that NIR might detect
either the PE or PET layer depending on which is facing upwards to
the camera. If the PET fraction is recognised, it is ejected from the
process while if the PE material is recognised, it will continue to the
next step.
•! In the grinding stage there are no losses of material, only size
reduction after which the material stream goes to the friction
washing step. This washes the materials and separates them
according to density. Most of the non PE/PP material will be sorted
out in this “sink/float” process because the density is larger than
one. The remaining polyolefin fraction, which is then sent to the
extruder, has a density less than 1 g/cm3.
In conclusion, it is very unlikely that the aluminium pouch passing through such a process will remain
in the stream to be recycled as the various sorting steps prior to the extrusion, sort out the non-
polyolefin material. If a small fraction of the material does ends up in the extruder, the aluminium foil
does not melt and will be filtered by melt filtration whilst the PET in a primarily Polyolefin stream will
negatively impact the quality and is undesirable in a polymer blend.
Flow-wrap
•! The flow wrap will likely be sorted in the air classification step, where this material is expected to
be mostly sucked out of the stream due to its relatively low density (0.5 – 0.9 g/cm3)
•! If a small fraction goes through to the NIR, the material would probably be randomly sorted
depending on what is detected: PP, or PA or the cold seal might be detected. Consequently, the
material might be ejected or could be sorted as PP.
•! In the grinding step the material coming from the air classification is mixed together with the
rigid fraction and then goes to friction washing. In this step the material is washed and separated
according to density. Since the density is lower than 1, the material will end up with the polyolefin
fraction to be extruded.
In conclusion, the material is likely to be recycled in a mixed polyolefin process.
17 Note that good sorting efficiency in the Eddy Current separation is observed for aluminium thicknesses larger than 15 um at
recyclers (MTM Plastics)

- Confidential -
74
The film recycling process description (see Figure 33)
Figure 33: Film recycling process
From the sorting process, it has been shown that the flow wrap is possibly
sorted in the film fraction (specification DKR 310). However, it should be noted
that the flow wrap is actually out of specification in the DKR 310 due to its small
size. It is considered as “undesirable” and would act as a disruptor to the
process.
Figure 33 shows the typical sorting steps of a film recycling facility, which are
very similar to the mixed polyolefin recycling process. The flow wrap is unlikely
to be sorted out at any stage of the process and will most likely go to the
extruder.
The flow-wrap will be recycled in a film recycling process, but will degrade the
quality of the secondary material due to the colour and nature of the other
packaging components it contains. In the opinion of a recycler, having flow-
wraps in such process compromises the use of this secondary material for
blown film applications.
6.3.4. General analysis and conclusions Aluminium pouch
The aluminium pouch is made of three main materials: PET, Aluminium foil and PE. Through a sorting
process, this packaging is mainly extracted with the 2D fraction and sent to a recycler as part of a mixed
plastics/polyolefin specification. This is highly problematic in a plastic recycling process as all the issues
identified as important in the House of Quality are present:
Compatibility/miscibility ! compatibility issues between PET and PE
Number of thermoplastics of different
nature ! 2 thermoplastic types: PET and PE
% Materials that are not thermoplastics ! presence of Aluminium foil, PUR adhesives and print
(binder)
Sorting Efficiency at flakes level ! random sorting in NIR
In a plastic recycling process, the aluminium pouch is randomly sorted and is unlikely to be recycled
into other plastic applications. Currently this type of packaging is normally sent to the cement industry
(where the aluminium can be used) or to energy recovery.
Flow wrap

- Confidential -
75
The flow wrap is made of one main material: OPP. In the sorting process, this type of packaging could
end up in one of two different material streams: in the lightweight fraction (plastic film/specification
DKR 310) where it is undesirable, or in mixed plastics/mixed polyolefin (DKR 350/DKR323). In both
streams, the flow wrap has good chance to move through all the sorting steps and reach the extruder.
However, the combination of the several materials in the flow-wrap can/will negatively impact the
quality of the secondary material. Looking at the House of Quality, the following issues are observed:
Compatibility/miscibility ! compatibility issues between PA and OPP
% Materials that are not
thermoplastics ! presence of latex, metallisation, primer, print (binder), PA
The number of thermoplastics and the sorting efficiency are not perceived as issues for this packaging.
Conclusion
To improve the recyclability of the two packaging examples, their design will look at improving the
following challenges: consistent sorting (at sorters and recyclers) and improved quality by tackling those
issues deemed important in the HoQ analysis.
6.4. Stakeholders and stakeholders’ needs An important step in design is to understand who contributes to the design process and who is affected
by the design. A list of stakeholders and their needs was established and can be seen in APPENDIX 14
. The most important needs from a packaging are:
o! Product containment
o! Product protection
o! Communication
o! Convenience
These needs are related to the functionality of a packaging whilst “Recyclability” is normally taken into
account when the functionality needs have been met. As the aim of the FIACE study is to see what
design changes could be implemented, it has been decided to add the recyclability to this list of
important needs. As a reminder from chapter 5, recyclability implies:
o! Collection of the packaging (assumed)
o! Consistent sorting at the sorter (packaging level)
o! Consistent sorting at the recycler (flakes level)
o! Good material compatibility/miscibility
o! Low number of different thermoplastic materials
o! Low amount of non-thermoplastic materials
o! Increased output at recycler
6.5. Requirements and specifications Once the most important stakeholders’ needs are listed, they need to be translated into quantifiable
requirements so specifications can be set. These specifications are measurable goals that a designer
needs to achieve in order to fulfil the stakeholders’ needs. It has been decided to perform a qualitative
assessment based on the stakeholders’ needs as the primary criteria and to further develop the design

- Confidential -
76
concept to increase their recyclability. Any specifications, target values or ranges were defined in
consultation with the industrial partners of the project. Indications of possible quantifiable parameters
can be found in APPENDIX 15 . Furthermore, importance weightings should be attributed to the
criteria.
6.6. Creating design ideas Design ideas were generated using creativity techniques, including:
o! Brainstorming
o! SCAMPER (Substitute, Combine, Adapt, Modify-Magnify-Minify, Put to other uses, Eliminate)
o! Additional ideas found in literature or Internet research.
A list of ideas was generated to improve collection, sorting, inks, adhesives, packaging design and
design of the recycling process. A selection of these ideas was used to generate ideas more specific to
the two packaging examples. These ideas were already reported in Chapter 5 and are summarised in
APPENDIX 16 .
6.7. Concept generation By combining ideas, concepts were generated: three for each of the 2 packaging examples. The key
idea behind these concepts is summarised in Table 13 and Table 14, and a brief description of the
preliminary concepts (not selected) can be found in APPENDIX 17 .
Table 13: Re-design of the aluminium laminated plastic pouch Concept Title Key ideas
Concept A Standard 2.0 Increase aluminium content for better separation from plastics via
Eddy Current Sorting.
Suitable structure for Aluminium recycling.
Concept B Layer shuffling Increased Aluminium content and placement of the aluminium
layer on the external part of the package to favour ECS.
Concept C AlOx Replace the Aluminium foil by a more recyclable barrier (i.e.
Aluminium oxide)
Table 14: Re-design of the flow-wrap Concept Title Key ideas
Concept 1 Minimalist Simplification of structure by removing the metallisation layer and
primer.
Concept 2 PP flow-wrap Ultrasonic sealing replaces the cold sealing
PP lacquer replaces the PA lacquer
Concept 3 Balanced Balanced level of fillers and voids to keep the PP density at 0.9
(g/cm3).
6.8. Design Selection An evaluation matrix was drawn up to qualitatively assess the six design concepts (see APPENDIX 18 ).
The criteria to carry out the evaluation were drawn from the stakeholders’ needs (i.e. Packaging
functionality and recyclability), and were complemented by other criteria that a product designer always

- Confidential -
77
needs to keep in mind (including cost, environment, manufacturing etc.). A summary of these criteria
can be found in Table 15.

- Confidential -
78
Table 15: Design criteria Packaging functionality Recyclability Other design criteria
Containment Consistent sorting at recycler Cost savings (RM)
Protection Consistent sorting at sorter Environmental impact (RM)
Communication Sorting efficiency at flakes level Manufacture of substrate materials
(reel)
Convenience Increased material compatibility Compatibility with HFFS
Decrease use of non TP materials
Decrease number of different TP
Increased output at recycler
6.8.1. Rationale for selection (Aluminium pouch) Concept C (AlOx) was selected to be developed further, as it was found to better address the trade-off
between functionality and recyclability. The qualitative assessment shows that the Concept C does not
change the product functionality: containment, information or convenience. The product protection
and visual appeal could be lower compared to the current structure since the nature of the barrier layer
changes (transparent oxides are used to replace aluminium). This changes both the appearance and
eliminates the light barrier and would need to be assessed to see whether they would be acceptable
to the product. The main advantage of the concept C is that it is potentially more compatible with
current recycling and sorting processes, potentially creating an opportunity to increase the output of a
plastic recycler as per the scope of the design work.
The concepts A and B maintain the same product functionality while potentially enabling more
Aluminium recycling and reducing the disruption to the current recycling process. The rationale to
eliminate concepts A and B (based on thicker layer of aluminium) was based on the following reasons:
•! The increase of the aluminium would increase the total amount of material and goes against
the trend of light weighting. It would need to provide additional functionality (recyclability
could be considered as added functionality) compared to the current structure to compensate
for lower the overall environmental performance.
•! Doubling the amount of Aluminium increases the raw material cost by nearly one third. This is
expected to not be acceptable to Brand Owners.
•! From an economic point of view, it probably does not make sense to increase the aluminium
recycling as the PE layer represents more than 50% of the embedded economic value.
Therefore, PE recycling should be favoured.
•! Increasing the aluminium content might not guarantee an effective sorting by Eddy-Current.
This is a knowledge gap which needs to be better understood.
6.8.2. Rationale for selection (the flow-wrap) The three design concepts are built from one another and proposed to simplify, as much as possible,
the initial structure. For the three concepts, the removal of the metallization layer also reduces the
barrier properties brought by aluminium. In the case of an ice-cream packaging, this layer primarily
serves aesthetic purposes, while for a chocolate bar, this layer might be required. (O2 barrier).
The three concepts appear to enable better recyclability. The selected concept was the one that could
bring the biggest advantage. Concept 3 (Balanced) was selected due to the PP structure combined
with the balance in density.

- Confidential -
79
6.9. Detailed design and evaluation In this section, the final design solutions and the way they solve the design problem are presented.
Then the design was evaluated by a group of stakeholder experts, in order to identify practical issues.
6.9.1. Detailed concept: AlOx
Figure 34: Detailed design
Design description
This design is made of six layers. The external PE layer is used
as a substrate for the Aluminium oxide deposition. This 20
nm thick Aluminium oxide layer serves as barrier for water
vapour and oxygen. As the Aluminium oxide may be brittle,
it can be further protected by an overcoat layer, which also
increases the printability. Finally, a 75µm thick PE layer is
laminated to give strength to the packaging and to enable
the sealing of the pouch.
It should be noted that the external and internal PE are two
different grades; the external one having a higher melting
point than the internal one to facilitate the heat sealing.
Assessment of the functionality
The newly designed pouch should be able to deliver the same functionality (mechanical properties and
sealing can be adjusted by selecting appropriate grades of PE) although the barrier protection will be
(significantly) lower. These grades of PE are selected in such a way that the external PE can handle a
higher temperature than the internal PE, enabling a quality heat seal. PE grades are also selected in
such a way that the stiffness of the pouch is maintained.
! The mechanical robustness of this packaging should be checked with packaging experts.
With respect to product protection, the aluminium oxides have proven relatively good water vapour
and oxygen barriers, at least on PET and OPP (see APPENDIX 19) and the feasibility of coating on PE
was confirmed: “AlOx can metallised on PE but the PE has to be plasma treated with special
combination of gases to increase surface energy” (Ahmed, 2016). However as aluminium oxide coating
is transparent, the UV light barrier properties that were brought by the Aluminium foil are lost. In the
case of a dry product, it could be assumed that UV light is not the most critical degradation factor.
! The level of acceptability in the barrier specifications should be checked with brand owners.
Regarding the communication aspect, visual changes are expected. The packaging will be a printed
transparent pouch. The glossiness might be reduced due to the replacement of PET by PE.
! The acceptability of these changes for consumers needs to be checked with brand owners.
Assessment of the Recyclability

- Confidential -
80
It is believed that the recyclability would be improved in several ways. At sorters, the pouch will be
sorted either as film or as mixed plastics/mixed polyolefin (2D) Both fractions/specifications are sent for
recycling. At the recycler, sorting at the flake level will be significantly improved:
•! As the material is lighter, is more likely to be separated in the air classification;
•! If it goes to NIR, the two external layers will both be recognized as PE and be correctly sorted.
Further, the recyclability of the structure is largely improved because:
•! the compatibility of materials is increased since the pouch is made of a combination PE/PE,
instead of PET/PE previously;
•! AlOx reportedly acts as a “filler” in the extruder and blends in easier to the polymer matrix
while Aluminium foil needs efficient melt filtration;
•! One layer of thermoset adhesive is removed.
To conclude, the yield at the recycler is expected to increase (more material reaches the extrusion) and
the quality of the secondary materials is also expected to increase.
Assessment of the other criteria
Replacing the aluminium foil by aluminium oxide offers also other advantages: the cost of raw materials
should decrease since only few nanometres of aluminium oxide are used. Also the environmental
impact will decrease.
The proposed design is believed to be able to be manufactured by using the same technology as for
the metallisation (Ahmed, 2016). The new design is also believed to be compatible with HFFS lines,
assuming that the heat seal-ability is still possible without the PET layer.
Conclusion
This design proposes several changes which would increase significantly the recyclability of the
structure. The changes in functionality (product protection) still need to be validated/approved by
experts.
Post project insight by project expert: Future optimisation should consider replacing the PE
components with PP alternatives as this is more likely to provide the barrier, stiffness and other
properties.
6.9.2. Stakeholders’ evaluation: AlOx concept The AlOx design was presented to a group of stakeholder experts in order to benefit from their know-
how/experience and to assess the feasibility of the concept and identify the areas of improvement. The
stakeholders’ feedback is in Table 16.

- Confidential -
81
Table 16: Stakeholders' feedback on the AlOx concept
Product containment Drop in the mechanical properties to be expected (stiffness and tensile strength). This will likely need a
change in material thickness to have the stability of packaging.
Product protection
•! Insufficient barrier properties (>100 ccm/m2.d.bar on OPP).
•! Degradation due to UV light should not be underestimated ! shelf-life reduction to be expected.
•! Coating PE with AlOx is not feasible on PE due to the unevenness of the surface structure and the
elasticity.
•! Inorganic coatings on PE, even with an overcoat/varnish layer, have proven to be difficult.
•! Over coating might crack the AlOx layer and destroy it.
Communication •! Bad optical appearance, which will not compete with the current existing laminates.
Convenience •! Drop in the mechanical properties (stiffness and tensile strength) which forces changes in thickness of
materials/size/shape to have the stability of packaging
Consistent sorting at sorters (packaging)
Consistent sorting at recyclers (flakes)
Increased material compatibility
Decrease of number non TP materials
Decrease of number of TP materials
Increased PO output
Cost saving on RM •! Cost will not be saved at the end if all equipment has to be adjusted/modified
Environmental impact (material embedded)
Reel manufacturing
Compatibility HFFS
•! Not as compatible with HFFS
•! Due to less mechanical properties
•! Need for other sealing technique/ risk of flex cracking during heat seal / careful with the temperature
gradient during heat seal
•! Printing, cutting and lamination have to be adapted.

- Confidential -
82
6.9.3. AlOx concept: recommendations and conclusions Based on the expert feedback, the AlOx concept, in the current proposed design, is expected to not
perform sufficiently well to be accepted as a replacement material. It needs to be further improved. The
three main challenges identified are:
•! The barrier properties might not provide sufficient product protection to be acceptable
•! The current structure will not provide similar mechanical properties to the standard aluminium
laminated plastic pouch. This has several consequences related to the functionality and on the
ability to be manufactured.
•! The deposition of aluminium oxide on PE might not be feasible.
Recommendations provided for this design are the following:
•! An OPP/PP laminate might be more feasible than PE/PE
•! Consider other barrier systems
o! for water: COC coextruded in seal film
o! for oxygen: EVOH.
6.9.4. Detailed concept: “Balanced” flow-wrap
Design description
The “Balanced” concept for the flow-wrap example alternative is made of three layers. The main
material is OPP. OPP is generally injected with voids in order to provide a non-flimsy structure and to
use the minimum amount of material. In this design it is proposed to balance voids with fillers (CaCO3,
TiO2) so that the specific density remains at 0.9 g/cm3. The OPP is printed and a PP miscible lacquer is
applied on the external layer.
Figure 35: Detailed design
Assessment of the functionality
Regarding the containment function, the mechanical properties might decrease due to the absence of
metallization. However, this reduction is not believed to be critical as other flow-wraps without
metallization do exist. The sealing properties will increase as the ultrasonic sealing creates a stronger
bonding than the cold seal, favouring the containment.
Note: Depending on the product application, this may or may not be an advantage as “cold seal”
technology is often used for its peel-ability facilitating easy open-ability, and extremely fast sealability.

- Confidential -
83
Assuming that in many applications the metallization serves aesthetic purposes more than meeting a
need for barrier properties, it is acknowledged that the proposed structure will lose this “aesthetic”
benefit.
! Need to confirm with Brand Owners that barrier is sufficient and aspect is still satisfying for customers.
Assessment of the recyclability
The recyclability of this packaging will be increased. The changes do not influence the sorting at sorters:
the packaging will still be part of the mixed plastics fraction of the sorted film fraction. At the recycler,
the packaging can be further sorted by density in the air classification or by NIR as the external layers
will be recognized as PP, which will make the sorting more consistent. In the reprocessing of this
packaging, the quality of the secondary material is likely to be greatly improved since the homogeneity
of this material is increased due to the removal of four challenging layers: the cold seal, the primer, the
metallization, and the lacquer.
Assessment of the other criteria
Cost savings on raw materials are realized since several layers are removed. However, it is important to
note that the investment cost for the ultrasonic sealing unit are much higher than for cold seal or heat
seal technology. Furthermore, removing several layers also has a positive environmental impact.
Finally, the design is deemed compatible with existing manufacturing and with HFFS lines: i.e. a retrofit
should be possible on all machines.
6.9.5. Stakeholders’ evaluation: Balanced Flow-wrap The balanced flow-wrap design was presented to a group of stakeholder experts in order to examine
the initial conceptual idea based on their know-how/experience to assess the feasibility of the concept
and identify areas of improvement. Stakeholders’ feedback is reported in Table 17.
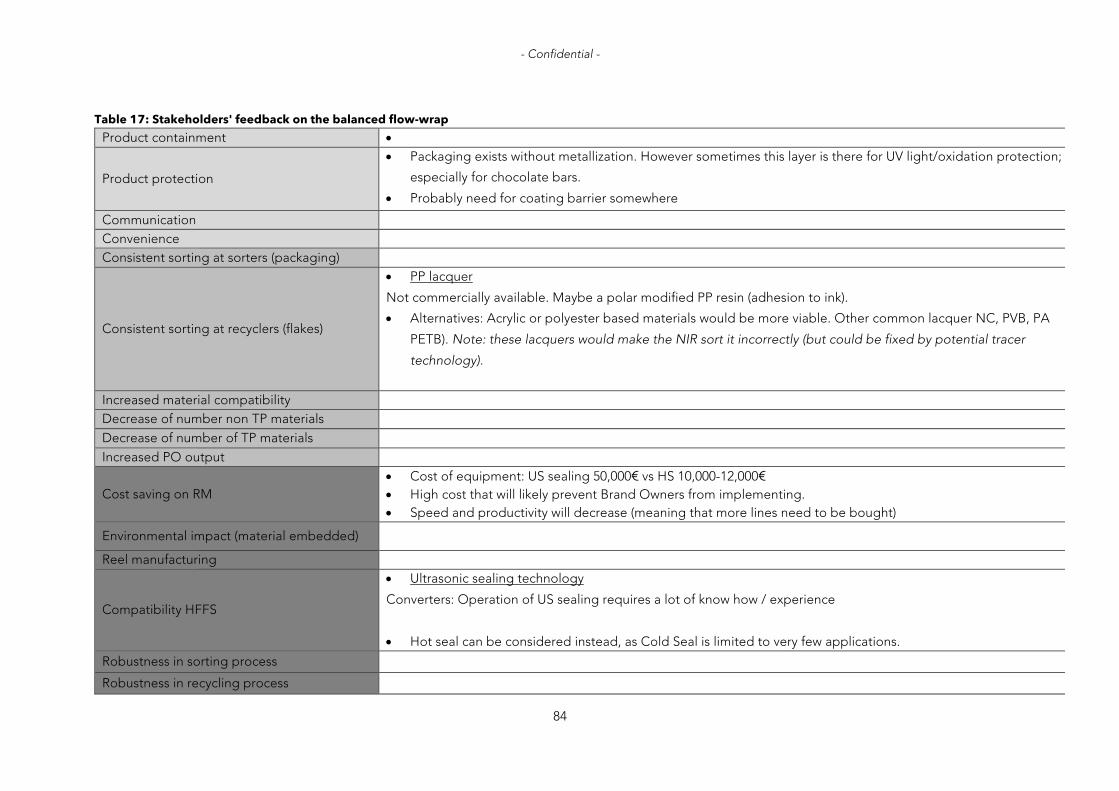
- Confidential -
84
Table 17: Stakeholders' feedback on the balanced flow-wrap
Product containment •!
Product protection
•! Packaging exists without metallization. However sometimes this layer is there for UV light/oxidation protection;
especially for chocolate bars.
•! Probably need for coating barrier somewhere
Communication Convenience Consistent sorting at sorters (packaging)
Consistent sorting at recyclers (flakes)
•! PP lacquer
Not commercially available. Maybe a polar modified PP resin (adhesion to ink).
•! Alternatives: Acrylic or polyester based materials would be more viable. Other common lacquer NC, PVB, PA
PETB). Note: these lacquers would make the NIR sort it incorrectly (but could be fixed by potential tracer
technology).
Increased material compatibility Decrease of number non TP materials Decrease of number of TP materials Increased PO output
Cost saving on RM •! Cost of equipment: US sealing 50,000€ vs HS 10,000-12,000€ •! High cost that will likely prevent Brand Owners from implementing. •! Speed and productivity will decrease (meaning that more lines need to be bought)
Environmental impact (material embedded)
Reel manufacturing
Compatibility HFFS
•! Ultrasonic sealing technology
Converters: Operation of US sealing requires a lot of know how / experience
•! Hot seal can be considered instead, as Cold Seal is limited to very few applications.
Robustness in sorting process
Robustness in recycling process

- Confidential -
85
6.9.6. “Balanced” flow-wrap concept: recommendations and conclusions Re-designing the flow-wrap design by simplifying the structure can improve greatly the recyclability of
the structure. Three points require further attention:
•! The acceptability of the removal of the metallisation needs to be discussed with brand owners
to ensure that the functionality is not lost.
•! Ultrasonic sealing requires high investment cost and also know-how. The challenges related to
the shift towards this technology needs to be better understood.
•! PP based lacquers are not typical i.e. don’t exist. Other technologies are more commonly used:
polyester resins and polyacrylates/styrene acrylates. This might compromise the sorting.
Post project expert observation was that the big challenge for the flow-wrap materials is to collect
and sort the small wrappers so that they enter the recycling process.
6.10. Conclusions on the design work Re-designing an aluminium laminated plastic pouch and a flow-wrap i.e. Design for Recycling, appears
to be significantly more challenging than anticipated. The existing structures are the result of years of
Research and Development to achieve the best trade-off between packaging functionalities and costs.
Flexible packaging has been designed to achieve very specific properties in a thin material where each
layer plays a role. Any design adjustment to facilitate recycling is difficult without adversely affecting
the packaging functionalities, economic performance or even overall environmental impact of the
whole value chain. The proposed design solutions provide better recyclability, but at the expenses of
some functionality and/or ability to manufacture. The design solutions could be further improved by
iterating the design process (concept generation and evaluation by stakeholder experts) for a specific
product. In the case where it is not possible to further improve the design of the flexible packaging
without reducing the overall sustainability, then the sorting/recycling technologies would need to be
improved/adapted to effectively sort and recycle existing flexible packaging materials.
For some multi-material flexible packaging, energy recovery could also be considered a sustainable
solution.
Note: Since flexible packaging is not yet widely collected for recycling in many European countries,
designing them to be recycled more easily has not been a requirement. If flexible packaging was widely
collected, sorted and likely to be recycled, then this exercise has shown that improvements are possible
but that these are not normally straight forward, can require investment and need to be considered
together with the product that it will protect.
Whilst not resulting in concrete proposals for each of the examined packs, this design exercise to
facilitate increased recyclability has resulted in a process which future re-design projects can use.

- Confidential -
86
7 Knowledge gaps
and recommendations for future projects
The FIACE project had dual objectives: to capture the value added by flexible packaging in a Circular
Economy and to identify challenges and opportunities to further close the loop via mechanical
recycling. The wide project scope has resulted in the whole flexible packaging supply chain being
reviewed from both the value adding perspective and the recyclability perspective. This has identified
a number of knowledge gaps as well as other recycling routes to explore. This chapter aims at providing
recommendations for future work.
7.1. Market analysis The FIACE study proposed to focus on small (<A4) primary food packaging. This was difficult as it is
hard to find robust numbers (material volumes and structures) for the following reasons:
o! Lack of definition in market figures (only material value is reported) and lack of detail in the
categories included (e.g. does it include drinks? Is it only primary packaging? If so, is it only the
small formats?)
o! At the end-of-life, flexibles from all kinds of applications are collected together, so the statistics
don’t distinguish small (<A4) primary food packaging from the rest.
For a future study, it is necessary to understand:
o! How much flexible packaging is put on the EU market (in tons of materials), country by country?
o! The overall flexible packaging market structure
o! How much is multi-material; how much is mono-material?
o! What is the definition of multi-material?
It is therefore suggested that a detailed market analysis be carried out, country per country, with the
same scope and consistent definitions, consistent reference year. Suggested contact: GVM.
7.2. Value added by flexible packaging in the supply chain The attempt to quantify the value added at different stages of the supply chain is well covered in the
report. Evidence found in literature tends to focus on the mass advantage i.e. material savings, offered
by flexible packaging and this implication for environmental impacts, such as CO2 emissions, water
footprint, Abiotic Depletion Potential. Other parameters (e.g. economic and social factors) could be

- Confidential -
87
further investigated to see where flexible packaging adds social and economic value. Additionally, it is
considered important to develop a robust methodology to systematically quantify the value added by
flexible packaging so that this can be clearly communicated externally.
During the consumption phase, the value added by flexible packaging lies primarily in its indirect effect
of food waste reduction through better food protection and portioning. While this is intuitive, it is also
very difficult to quantify due to the availability of reliable data on in-home consumption food waste. In
the future, it is deemed important to further quantify this effect, but several knowledge gaps remain:
o! What is the relative impact of consumers’ behaviour on food waste versus role of packaging in
food protection?
o! Collect robust data on the amount of avoided food waste in relation to the packaging type.
o! When is packaging protection needed and for what shelf-life?
o! Find ways to robustly include a food waste component in product LCAs. Taking into account
the food loss in an LCA has proven to drastically change the outcome of a study. Therefore, it
is considered essential to include the impact of a whole packaging/product system. In some
cases, it would be preferable for the pack to have a higher environmental impact if the
environmental impact of the total food/packaging system decreases.
It is recommended to follow/support research on the relationship between packaging and (avoided)
food waste (e.g. group of Helen Williams at Karlstad University).
With respect to the value added by flexible packaging at the end of life, flexible packaging offers
significant advantages compared to alternative rigid packaging solutions. Also to:
o! Quantify the relative value added by flexible packaging before and after it becomes waste.
o! Quantify the value added in mechanical recycling versus other end-of-life scenarios (pyrolysis,
chemical recycling, waste-to-energy…).
7.3. Indicators for a Circular Economy The chapter on indicators for the Circular Economy has identified the need for tools and relevant
indicators for a Circular Economy in order to compare different packaging solutions. The indicator
developed by FPE appears robust and includes three key parameters, which are important to
characterise the resource efficiency of a pack. It seems important to expose these newly developed
indicators to other members of the packaging industry and to reach a consensus to use them for
packaging and to make it a widely accepted tool. A recommended future study could be to more
extensively review the indicators available for Circular Economy and include other indicators (e.g. TU
Delft Circular Economy Indicator based on economic value).
7.4. Collection The collection was found to be heterogeneous at the European level. Several knowledge gaps were
identified:
o! What is the best collection scheme (for flexible packaging) and how to decide this?
o! Fractions sent for recycling are currently selectedbased on whether they provide with sufficient
volumes/weight of materials. However, the study revealed that flexible packaging might have
a considerably higher recycling potential than expected (80% recyclable). In that light, it seems

- Confidential -
88
important to advocate for collection for all flexible packaging at European level. To support
this request (and get it included in a European Directive), there are a few points that should be
clarified:
o! What would the “collection of all packaging” cost? What would be the additional
incremental EPR fee based on a per pack basis? (Cost analysis)
o! Evaluate the ability of current sorting and recycling infrastructure to adapt to this
potential change and verify availability of infrastructures.
o! Provide guidelines on best practices for collection (e.g. avoid commingled collection
with plastic/paper and plastic/metal)
o! Encourage consumers via communication/education
7.5. Sorting Sorting of plastic packaging is currently performed mainly in order to remove flexible packaging from
more “valuable” rigid packaging stream. Beside the large flexible packaging (mainly PE), all smaller
plastic packaging ends up in the mixed plastics fraction or goes to energy recovery. A general question
that needs to be addressed is how to further sort flexible packaging either as a distinct recyclable
stream or so that the predominantly PE or PP flexible packaging ends up being recycled with the similar
rigid plastic packaging materials. Several routes can be explored:
o! Tracers/markers technologies: can they be used to “clean” the current stream of the more
difficult to recycle multi-material laminates? Could a standard invisible “Tracer” be used on the
outer layer for multilayer materials to facilitate easy identification?
o! Can additional metal detection systems be integrated to the process to separate aluminium
containing packaging?.
o! Gain a deeper understanding on Eddy Current Sorting for thin materials
o! Benchmark the different sorting technologies to evaluate their potential to increase flexible
packaging sorting and/or to cope with the limitation of NIR (which reads only the most external
layer).
o! How to consistently eject very lightweight materials?
o! Risk analysis/scenarios: what would happen if all flexible packaging was collected? (e.g. on
sorting capacity and the impact on the price of sorted materials)
7.6. Recycling Mechanical recycling of flexible packaging was found to be challenging. There are a lot of routes which
should be further explored as a continuation of this project:
o! Practical work to validate which factors most influence the quality of secondary materials (to
validate House of Quality). Deeper understanding is required on:
o! Behaviour of (PUR) adhesives in the extruders
o! Contribution of printing inks vs. pigments from master batch to the end recyclate
colour
o! Understand the impact of other source of contamination (e.g. additives)
o! Can the multi-material layers be separated, liberated and effectively sorted into material
streams to be recycled?
o! Design of an adhesive which (selectively) delaminates in sorting/recycling process

- Confidential -
89
o! Benchmarking new technologies (e.g. Saperatec) /conceptual design for multi-layer
recycling.
o! Benchmarking technologies that have already made advances in the field of flake
sorting (MDS) and understand what impact better sorting technologies would have.
o! Understand the complementary benefits of chemical recycling, and other technologies such as
pyrolysis.
o! What does chemical recycling offer today and in the future?
o! Understand the impact of a stronger cleaning process and design a process for better flakes
washing and de-inking.
o! Explore/ review the “Compatibiliser” technologies and better understand the potential to
improve the quality of secondary materials
o! Understand the potential markets and their needs (quantities/qualities/Specification) for
secondary plastic materials from flexible packaging
7.7. Packaging design o! Inventory all major multilayer structures: how many distinguishable combinations / types are
there?
o! Develop an agreed recommended list of the preferred polymers/materials used in
flexible packaging. Understand if and how far the standardisation of polymer grades
would help?
o! Re-designing flexible packaging was found to be very challenging. If the recyclability needs to
improve, there is a need for a trade-off on the functionality.
o! Deeper understanding of how much barrier is actually needed to deliver the required
product protection and understand the ability of alternative barrier layers to deliver
this
o! Inks: are lighter colours acceptable? Are the printing requirements for flexible packaging
(= short lifespan product) too high?
o! Adhesives: are standards for performance too high? Would it be possible to laminate
differently (e.g. only on sealing points)?
o! Collection of know-how and experience to develop a robust agreed flexible packaging design
guidelines for a circular economy (e.g. APR guide for plastics) Note: Design for recycling
guidelines was felt to be too simplistic as it does not reflect the product needs/impact.
o! Food loss was found to have a relatively strong environmental impact. Further value would be
added by flexible packaging providing an “easy to empty” functionality: either by the
shape/design or by a coating that promotes emptying?

- Confidential -
90
8 Conclusion
The transition towards a Circular Economy is accelerating in Europe. It is spurred by the European
Commission, as well as active initiatives such as the Ellen MacArthur Foundation. Packaging is a global
challenge and has become a main point of attention for government, media and consumers due to the
visibility of the waste it generates. Despite its high resource efficiency, the perceived non-recyclability
of flexible packaging risks precluding it from being a relevant packaging solution in a Circular Economy.
In that light the goal of this project was to capture the value added by flexible packaging and identify
opportunities to further close the loop via mechanical recycling.
Flexible packaging was found to add significant value in the supply chain in terms of Resource Efficiency
and waste prevention. Specifically:
•! Raw materials: due to its lightweight, flexible packaging makes use of the minimum amount of
materials to deliver highly (resource) efficient packaging solutions, which is shown by very
favourable Packaging-to-Product Weight ratio.
•! Transportation: This efficiency also translates the benefit in transportation, as it allows space
savings, and consequent cost savings and reduction in the environmental impact (carbon footprint).
•! Consumption:
o! Flexible packaging, like all other packaging solutions, contributes to food waste prevention
across the supply chain by protecting the product its environment and by communicating
relevant information to consumers.
o! The biggest value added by flexible packaging is the versatility of flexible packaging, which
enables it to deliver the optimum pack design: it provides customers with fit-for-purpose
solutions (e.g. optimised barrier for shelf-life extension, customisability in shape, size and
appearance), while using the minimum amount of material.
o! From an environmental perspective, flexible packaging contributes (normally) to less than
10% of the total environmental impact of the food/packaging system. In the case of food
waste, the environmental impact of the wasted food is generally much higher than the
environmental impact of the packaging. However, without robust data on food waste
during consumption on any difference between that prevented by a flexible pack versus a
non-flexible pack, quantification of this benefit is not possible.
•! End-of-life: When flexible packaging is “disposed” of at end of life (and not recycled), it normally
has a lower environmental impact than non-flexible packaging this also depends on the material
structure used, for example mono or multi-material)

- Confidential -
91
Besides capturing the value added by flexible packaging, it was also deemed important to identify the
opportunities for flexible packaging to further close the loop via mechanical and other recycling routes
eg Chemical recycling.
•! Market analysis: Currently four million tons of flexible packaging is used for food application in
Europe. The market analysis suggested that 80% (by weight) of flexible packaging has potential to
be recycled using existing plastic EoL infrastructure. The resulting secondary material would likely
find a market (e.g. recycled flexible packaging are well suited for injection moulding application),
provided that flexible packaging is widely collected and sorted, and sent for recycling.
•! Collection in Europe is very heterogeneous and today, flexible packaging is not considered
sufficiently “valuable” by national EPR schemes to be widely collected. Collection is a pre-requisite
to increasing recycling and this needs to be addressed by all European countries in order to
increase the recycling of flexible packaging and the yield of secondary materials.
•! Sorting of plastic packaging embraces a wide number of technologies, however the current sorting
facilities are primarily designed for rigid plastics. In that context flexible packaging is only extracted
to « purify » the rigid plastic stream and to safeguard the quality of those plastic streams as distinct
from increasing the quantity of flexible packaging going to recycling. Flexible packaging itself
undergoes very minor/no further sorting, and therefore ends-up mainly in the low-value streams
(e.g. mixed plastics)
•! Recycling presents many challenges, including further sorting at speed at the flake level and the
blending of plastic resins for consistent properties/quality. Advances in recycling are possible and
will likely be facilitated by improvements in the upstream infrastructure (collection/sorting) in quality
and quantity of the sorted bales of post-consumer flexible packaging.
•! Packaging design: Recyclability is usually a secondary consideration taken into account in
packaging design. However, as flexible packaging is not (yet) widely collected, designing them for
recyclability is not yet common practise as agreed guidelines to do this do not exist. The preliminary
re-design work on two multi-layer packaging examples has highlighted the difficulty in obtaining a
satisfactory trade-off between functionality, manufacturability and recycling. This recognises the
significant progress flexible packaging has made to reach a customised optimum structure for each
product application. The conclusion is that the design process must be iterative and must involve
the evaluation of all the players from the supply chain to develop realistic design concepts.
All the feedback and learning collected during the project and gathered in this report could serve
to create draft “Guidelines”; not only for the designing flexible packaging for recyclability, but
potentially also recognising the significantly value added along the whole value chain and
integrating this into “Design for a Circular Economy” guide.
To conclude, this first phase of the FIACE project provided a helicopter view on where and how flexible
packaging adds value in the supply chain. It has identified challenges, opportunities, and
recommendations to help scoping future/more detailed (sub) projects. The most important ones are:
•! Detailed market analysis to map the structure of the flexible packaging market in each country in
Europe by weight, and to confirm the ratio material and mono/multi material laminates.
•! Developing a robust methodology to quantify the economic and environmental “value added” by
flexible packaging before and after it becomes waste.

- Confidential -
92
o! Building understanding on where flexible packaging adds value based on factors other
than packaging material reduction and to quantify its role with respect to (avoided) food
waste.
•! Understanding how post-consumer flexible packaging waste is managed today by country across
Europe with a view to making recommendations for the collection of post-consumer flexible
packaging from households. Collection of flexible packaging is a pre-requisite for it to be recycled.
•! Understanding and developing technologies that can enable better flexible packaging sorting and
recycling. It is recommended that efforts to increase collection, sorting and recycling should be
done in parallel in order to increase both the quantity and quality of secondary materials. The
economic feasibility still needs to be demonstrated and it is also important to consider the benefit
of mechanical recycling relative to alternative end-of-life options, such as chemical recycling,
pyrolysis, waste to energy.
•! Re-designing multi-layer flexible packaging to facilitate mechanical recyclability can be done.
However, this exercise is not trivial and requires the co-operation of all value chain actors so as to
avoid increasing recycling at the expense of the functionality. To do this it is essential to gain a
deeper understanding on the food and other supply chain requirements. This work can result in
valuable design guidelines for a Circular Economy.

- Confidential -
93
References Advisory Committee on Packaging (2008). Packaging in Perspective.
Ahmed (2014). Review and evaluation of AlOx clear barrier production processes. Retrieved http://www.idvac.co.uk/review-and-evaluation-of-alox-clear-barrier-production-processes/
Ahmed (2016). Personal communication.
Al-Salem, S. M., Lettieri, P., & Baeyens, J. (2010). The valorisation of plastic solid waste (PSW) by primary to quaternary routes: From re-use to energy and chemicals. Progress in Energy and Combustion Science, 36(1), 103-129.
American Plastics Council (1996). Understanding plastic film. Its uses, benefits and waste management option.
AMI Consulting (2012). The polyethylene film extrusion industry in Europe.
AMI Consulting (2014). The global market for PE films products.
Attero (2016). Presentation for FIACE.
Barlow, C. Y., & Morgan, D. C. (2013). Polymer film packaging for food: An environmental assessment. Resources, Conservation and Recycling, 78, 74-80.
Barnes, D. K., Galgani, F., Thompson, R. C., & Barlaz, M. (2009). Accumulation and fragmentation of plastic debris in global environments. Philosophical Transactions of the Royal Society of London B: Biological Sciences, 364(1526), 1985-1998.
BioBag (2016). Biodegradable and compostable. Retrieved from https://biobagworld.com/environment/biodegradable-and-compostable/
BIPRO (2015). Assessment of separate collection schemes in the 28 capitals of the EU.
Bollegraaf Recycling Solution (2016). Film grabber. Retrieved from (https://www.bollegraaf.com)
Büsser S. and Jungbluth N. (2009) The role of flexible packaging in the life cycle of coffee and butter. Int J LCA. DOI 10.1007/s11367-008-0056-2
Büsser, S., Steiner, R., Jungbluth, N. 2007: LCA of Food Products/Packed Goods: Coffee, butter, spinach.
Büsser S. and Jungbluth N. (2009) LCA of Chocolate Packed in Aluminium Foil Based Packaging
Büsser S. and Jungbluth N. (2011) LCA of Ready-to-Serve Goulash Soup Packed in Stand-Up Pouches.
Canadian Plastics Industry Association (2013). Analysis of Flexible Film Plastics Packaging Diversion Systems.
The Consumer Goods Forum (2011). A Global Language for Packaging and Sustainability. A framework and measurement system for our industry.

- Confidential -
94
Dainelli D. (2008). Recycling of food packaging materials: an overview.
Denkstatt (2016). How packaging contributes to food waste prevention.
Eco3E (2016). Materials – plastics. Retrieved from http://eco3e.eu/materials/plastics/
The Ellen MacArthur Foundation [EMF] (2016). The New Plastics Economy: Rethinking the future of plastics.
Ellen MacArthur Foundation [EMF] (2015). Circularity indicators. An approach to measuring circularity.
European bioplastics (2016). Bioplastics market data. Retrieved from http://www.european-bioplastics.org/market/
European Commission (2015). Resource Efficiency. Retrieved from: http://ec.europa.eu/environment/resource_efficiency/
The European Commission 2016 http://ec.europa.eu/environment/circular-economy/index_en.htm
European Environmental Agency [EEA] (2011). Resource efficiency in Europe. Policies and approaches in 31 EEA member and cooperating countries.
Europen (2013). Packaging supply chain’s good practices to prevent food waste.
Europen (2016). Extended Producer Responsibility. Retrieved from http://www.europen-packaging.eu/policy/9-extended-producer-responsibility.html
EUROSTAT 2014]: Eurostat website, http://epp.eurostat.ec.europa.eu/, 2014
Eurostat (2015). Packaging waste statistics.
Flexible Packaging Association [FPA] (2013). Flexible Packaging Contribution to Sustainability. Fewer Resources. Less Footprint. More value.
Flexible Packaging Association [FPA] (2009). Flexible packaging: contributing to sustainability. Retrieved from: http://www.slideshare.net/excelpkg/flexible-packaging-presentationdec2013
Flexible packaging Europe [FPE] (2015). Flexible packaging – A Resource Efficient solution for a Circular Economy.
Flexible Packaging Europe [FPE] (2015). Flexible packaging – A resource efficient solution for a Circular Economy (Graham Houlder’s presentation).
Flexible Packaging Europe [FPE]. The Perfect Fit. Flexible solution for a more sustainable packaging industry.
FUSIONS (2016). Estimates of European food waste levels.
Gerngross T., Slater S. (2000). Des plastiques extraits des plantes. Pour la science N276.
Glenroy (2016). Flexible packaging definitions. Retrieved from http://www.glenroy.com/

- Confidential -
95
Gustavsson, J., Cederberg, C., Sonesson, U., Van Otterdijk, R., & Meybeck, A. (2011). Global food losses and food waste. Food and Agriculture Organization of the United Nations, Rom.
GVM (2016). Personal conversation.
K. Hausmann, “Compatibilizers, Polymeric(Recycling of Multilayer Structures)”, Polymeric Materials Encyclopedia, CRC Press, New York, 1996, vol. 2, pp. 1364-1377.
Ifeu (2016). Resource Efficient Packaging.
Ifeu (2014). Potential packaging waste prevention by the usage of flexible packaging and its consequences for the environment.
ILSI Europe (2000). Recycling of plastics for food contact use.
ILSI Europe (2011). Multilayer packaging for food and beverages.
Kliaugaitė, D. (2013). Comparative life cycle assessment of high barrier polymer packaging for selecting resource efficient and environmentally low-impact materials. World Academy of Science, Engineering and Technology, International Journal of Environmental, Chemical, Ecological, Geological and Geophysical Engineering, 7(11), 742-750.
Kummu, M., De Moel, H., Porkka, M., Siebert, S., Varis, O., & Ward, P. J. (2012). Lost food, wasted resources: Global food supply chain losses and their impacts on freshwater, cropland, and fertiliser use. Science of the Total Environment, 438, 477-489.
Lindh, H., Williams, H., Olsson, A., & Wikström, F. (2016). Elucidating the Indirect Contributions of Packaging to Sustainable Development: A Terminology of Packaging Functions and Features. Packaging Technology and Science.
Liqui-box (2016). Sustainability. Retrieved from http://www.liquibox.com/about/sustainability/
Marsh, K., & Bugusu, B. (2007). Food packaging—roles, materials, and environmental issues. Journal of food science, 72(3), R39-R55.
McKeen (2013). Introduction to use of Plastics in Food Packaging. Plastic films in food packaging: materials, technology and applications. Elsevier.
Morris, B. A. (2016). The Science and Technology of Flexible Packaging: Multilayer Films from Resin and Process to End Use. Saint Louis: Elsevier Science..
NVC experts (2016). Personal Communication
Parfitt, J., Barthel, M., & Macnaughton, S. (2010). Food waste within food supply chains: quantification and potential for change to 2050. Philosophical Transactions of the Royal Society B: Biological Sciences, 365(1554), 3065-3081.
Parini (2015). Ballistic separator. Retrieved from http://www.parinisrl.it/
Pira (2007). Developments in Biodegradable polymers for flexible packaging.
Pira (2011). Recycled Plastics in Packaging Applications.

- Confidential -
96
Pira (2011). The future of Global Packaging. Market forecasts to 2010.
Pira (2015). Global flexible packaging market sees rapid growth.
PlasticsEurope (2015). Plastics – the Facts 2015. An analysis of European plastics production, demand and waste data.
Scriba (2016). Personal communication.
Sealed Air (2014). Grocery Shoppers and Food Waste in the United States.
Secondi, L., Principato, L., & Laureti, T. (2015). Household food waste behaviour in EU-27 countries: A multilevel analysis. Food Policy, 56, 25-40.
Silvenius, F., Katajajuuri, J. M., Grönman, K., Soukka, R., Koivupuro, H. K., & Virtanen, Y. (2011). Role of packaging in LCA of food products. In Towards Life Cycle Sustainability Management (pp. 359-370). Springer Netherlands.
Stancu, V., Haugaard, P., & Lähteenmäki, L. (2016). Determinants of consumer food waste behaviour: Two routes to food waste. Appetite, 96, 7-17.
Tartakowski, Z. (2010). Recycling of packaging multilayer films: New materials for technical products. Resources, Conservation and Recycling, 55(2), 167-170.
Tönsmeier (2016). Sorting Process for Consumer Plastic Packaging
Toppan (2016). GL Film Pamphlet. Retrieved from http://www.toppan-usa.com/products/barrier_film/
Ventour, L. (2008). The food we waste (Vol. 237). Banbury/Oxon: WRAP.
Verghese, K., Lewis, H., Lockrey, S., & Williams, H. (2013). The role of packaging in minimising food waste in the supply chain of the future: Prepared for: CHEP Australia.
Wikipedia, 2016. Resource efficiency. Retrieved from https://en.wikipedia.org/wiki/Resource_efficiency
Williams, H. (2011). Food Packaging for Sustainable Development.
Williams, H., & Wikström, F. (2011). Environmental impact of packaging and food losses in a life cycle perspective: a comparative analysis of five food items. Journal of Cleaner Production, 19(1), 43-48.
Williams, H., Wikström, F., Otterbring, T., Löfgren, M., & Gustafsson, A. (2012). Reasons for household food waste with special attention to packaging. Journal of Cleaner Production, 24, 141-148.
Wikström, F., & Williams, H. (2010). Potential environmental gains from reducing food losses through development of new packaging–a life! cycle model. Packaging Technology and Science, 23(7), 403-411.
Wikström Fredrik, Williams Helén, Verghese Karli, Clune Stephen. The influence of packaging attributes on consumer behaviour in food-packaging LCA studies – a neglected topic. Journal of Cleaner Production 2014, 73: 100-108.
World Food Programme [WFP]. (2016) Hunger statistics. Retrieved from https://www.wfp.org/hunger/stats
- Confidential -
97
WRAP (2008). Kerbside Recycling: indicative costs and performance.
WRAP (2010). Near Infrared sorting of household plastic packaging.

- Confidential -
98
APPENDIX 1 ! Bioplastics
Bioplastics are a fast growing industry that should be discussed in this assessment of flexible packaging
in a Circular Economy because they have the potential to decouple plastics from fossil feedstocks. In
2007 biopolymers represented less than 3% of all polymer production worldwide, but it is expected
that there will be an ever-increasing need for bioplastics driven by the following reasons (Pira, 2007):
•! Fossil fuel costs increase relative to bio-based materials.
•! Bio renewable materials are believed to be an important aspect of improving environmental
sustainability.
•! Growing public acceptance of packaging materials based on renewable resources and public
perception that biodegradable plastics are better for the environment than non-
biodegradable.
•! Interest from retailers and brand owners in switching their packaging from petrochemical-
based polymers to bio-based materials, product and technology improvements to biopolymers
(Pira, 2007).
Figure 36 shows that packaging (flexible and rigid) is an important market for bioplastics.
Figure 36: global production capacities of bioplastics 2014 (European bioplastics, 2016)
Three groups of materials actually fall under the name “bioplastics” and need to be clarified:
•! Bio based and biodegradable like PLA, PHA, PHB, starch-based
•! Fossil based and biodegradable such as PCL
•! Bio-based and non-biodegradable; for example bio-based PE, PET
Bio-based polymer gained a lot of interest because they seem to offer a significant advantage
according to the life cycle analysis. Bio-based polymers emit carbon dioxide at the end of life, whether
they are incinerated or biodegraded. However, this amount can be neglected in an LCA because it is
considered as being the same amount required to the plant growth to perform photosynthesis. In other
words, there is no contribution to the greenhouse gas production. This rationale often does not take
into account the non-renewable resources that are used for the culture: fuel needed to run agricultural

- Confidential -
99
machinery or non-renewable resources needed to produce pesticides and fertilisers for examples. A
study showed that use of non-renewable energy was three times more than the PE manufacture from
fossil fuels (Gerngross, 2000). In that light, it is questionable whether there is a real environmental
benefit in using bio-based plastics. It cannot be concluded in a straightforward manner that bio based
is always better than fossil based. One should remember to look at the scope and the boundaries of
the LCA study to draw conclusions.
Biodegradable polymers also gained a lot of attention. They are perceived by consumers as
environmentally friendly materials, which would prevent plastic leakage in nature. However there is
often a misconception about the term biodegradable, which should be specified. Biodegradation starts
with fragmentation at macroscopic level, followed by step of degradation of macromolecules into
monomers or oligomers that can be assimilated by micro-organisms found in natural environment. The
resulting products of reaction are carbon dioxide, methane and water molecules, depending on the
environmental conditions of the process. “Biodegradable” is often misused to describe materials,
which are reduced to small invisible particles, without any proof that these particles can be up taken by
microorganisms. This is notably the case of photodegradable and oxo-(bio)degradable plastics. In that
light, biodegradable materials face also recycling challenges, and do not have necessarily a superior
environmental profile. Consequences of the accumulation of very small plastic particles/fragments in
nature are not measured yet: little is known about their longevity and impacts on organisms (Barnes,
2009). The term "composting" is often used informally to describe the biodegradation of packaging
materials. Composting is the process of breaking down organic waste by micro-organism digestion,
resulting in compost. Unlike biodegradation, composting however has a legal definition described by
the European Norm EN 13432:
•! Biodegradability: the conversion of > 90% material into carbon dioxide and water by the action
of micro-organisms within 6 months.
•! Desintegrability, the fragmentation of 90% of the original mass to particles that then pass
through a 2 mm sieve.
•! Absence of toxic substances and other substances that impede composting (BioBag, 2016)
To sum up, bio-based plastics can be used as alternative to conventional plastics because they offer
the same properties. However environmental benefit of it should be demonstrated case by case. For
the purpose of the study, biodegradable plastics are considered out of scope, because their chemical
nature differ from conventional plastics and thus disrupt the conventional mechanical recycling process.

- Confidential -
100
APPENDIX 2 ! Estimates for multilayers fraction It has been a challenge to find estimates for the ratio multi-material / mono-materials. It is however
important to know these numbers to get a feel of the flexible packaging recycling potential. This
appendix gathers various attempts to estimate the volume of multi-material flexible packaging.
Approach 1: Literature number Tartakowski et al. reported in 2010 that “currently 17% of the world film production is multilayer films.”
Plastic Information Europe reported that the European Plastics Demand for Flexible in 2011 is about
10.8 mt.
Considering that these numbers are sufficiently robust, the total multi-layer production is 1.84 mt,
regardless of the final application. Food packaging being 37% if the European plastic demand, multi-
materials represent 0.68 mt.
This could be a low end estimate according to food packaging experts who tend to say that a large
part of food flexible packaging is actually multi-layer (NVC experts, 2016).
Approach 2: Numbers provided by a sorter (Attero) A study presented the composition of post-consumer waste in the Netherlands and made a distinction
between flexible packages and laminated flexible packages (i.e. made by 2 or more materials). From
the Figure 37, it can be read that flexible packages account for roughly 26%w of the post-consumer
waste, while laminated flexible packaging account for roughly 4% by weight. Based on these numbers,
it can be calculated that laminated flexible package represents 13% of post-consumer materials,
regardless of the final application.
!! Based on the European consumption of flexible packaging, the range of multi-layer
packaging is between 0.52 and 1.4 mt.
Figure 37: Estimated plastic potential in the Netherlands
Approach 3: Analysis of Dutch MSW The complete data cannot be reported here as it is confidential. The study makes the analysis of Dutch
Municipal Solid Waste. It was found that laminated flexible packaging account for between 9 and 13%
of all flexible packaging. Although the stream is likely to be mainly food packaging, there is no
distinction between, primary packaging and the rest.

- Confidential -
101
Approach 4: study by Nextek The composition of mixed films was reported. From the waste film stream, multi-layer materials account
for 8% by weight. Removing the moisture and contamination, this number becomes 9.2%.
In black bags, multi-layer materials account for 15% by weight, which corresponds to 19% by weight
once moisture and contamination are removed. Assuming that black bags contain mainly post-
consumers waste and food application products, this number gives a feel of the ratio multi-layer/mono-
layer. However, no distinction is made between primary packaging and the rest.
Estimated range for multilayers: 0.368 mt – 0.76 mt.
Figure 38: Composition of mixed films (Nextek) Discussion It is very difficult to find accurate estimates of how much multi-material/multi-layer materials are actually
used for primary food packaging as defined in the project scope. This is due to the fact that post-
consumption, all types of packaging are collected together blurring the statistics.
Several analyses of post-consumer waste tend to show that multi-layer materials represent no more
than 20% by weight of the total flexible fraction. The Nextek study showed the composition of a black
bag, where it can be assumed that such post-consumer waste contains mainly primary food packaging.
Multi-layer materials account for 19% by weight of the mixed film fraction. This 19% kept for the recap
graph, but with a high uncertainty.
Food packaging specialists and recyclers seem to agree that this number is low according to their
experience. Therefore, it is highly recommended to lead further investigation to refine these numbers
by redefining a scope and clarify all definition for multi-layer materials.

- Confidential -
102
APPENDIX 3 ! Food Losses and waste in Europe
Food loss is defined by a decrease of the physical mass of food throughout the food supply chain while
food waste refers more specifically to the amount of food lost at the end of the food chain, including
retail and consumption (Gustavsson, 2011). Food waste can be further classified into two categories:
•! Avoidable waste, meaning edible food which is thrown away
•! Unavoidable waste, which is waste deriving from food preparation and not edible (e.g. bones)
(Secondi, 2015).
Causes of food waste across the supply chain The cause of food loss depends on the stage of the supply chain at which the waste occurs, as shown
in the following Table 18 (Ventour, 2008).
Table 18: Reasons for food waste across the supply chain Stage of the food supply
chain
Potential reasons for loss/waste
Agricultural production Crop diseases, bad weather, out of specifications harvest
Post-harvest handling Out of specification harvest (size and appearance), spillages,
degradation
Processing and packaging Food preparation waste, production line start-up, batch error
Distribution/retail Damage due to packaging failure, out of specifications products,
damages during handling, inadequate shelf life (poor stock
management or low sales).
Food service Loss in preparation, plate leftover, wrong food management
Home Food preparation waste/trimmings, food spoilage, preparing too
much, past use-by or best before dates, plate leftovers.
Food losses estimates Recent studies estimate that one third of all food produced is lost globally. This corresponds to 1.3
billion tonnes per year (Gustavsson, 2011)18. Of these, around 90 million tonnes of food are “wasted” in
Europe every year (FUSIONS, 2016). The Table 19 shows the breakdown per capita of these losses,
taken from various sources.
Table 19: Food waste Fusions report
(Fusions, 2016) Other references
Total food waste in Europe (million tonnes)
88 ± 14 90 (Denkstatt, 2016)
Total food loss per capita (kg)
173 ± 27 280-300 (Gustavsson, 2011)
Household waste per capita (edible and inedible part) (kg)
92 ± 9 95-115 (Gustavsson, 2011)
18$Some studies prefer reporting the losses in kcal to connect to the number of meals that are lost. In this metric, it is found that almost a quarter of all food available for human consumption is wasted/lost globally. (Kummu, 2012)$

- Confidential -
103
Household waste per capita (edible part) (kg) - 76 (Secondi, 2015)
Consumers’ role in food loss Consumers’ behaviour plays an important role in the food waste generation in Europe. Factors that
contribute to waste generation are (Parfitt, 2010):
•! A relatively low price of food (compared to income),
•! High expectation in terms of food cosmetic
•! The lack of awareness about food chain and all the effort it takes to produce food.
•! The way food is managed. Direct reasons given by consumers are: ‘lack of a plan’, ‘a change
of plans’, ‘buying too much’, ‘do not want to eat leftovers’ or ‘do not know what to do with
them’ or ‘high sensitivity to food hygiene’ (Williams, 2011).
In regard to the food waste issue in Europe, the European Commission has estimated that “If we carry
on using resources at the current rate, by 2050 we will need the equivalent of more than two planets to
sustain us” (Europen, 2013). The sustainability consequences are multifaceted (Fusions, 2016):
•! Environmental: waste of limited resources and energy, climate change…
•! Social and ethical: food access and equality, knowing that one ninth of the worldwide
population does not have enough food to live a healthy active life (WFP, 2016)
•! Economic: price volatility, increasing costs for consumers, waste management, commodity
markets
In order to address this, Europe has proposed to reduce food waste by 30 % by 2025.

- Confidential -
104
APPENDIX 4 ! End-of-life Modelling
End of life scenario 2012, as described in the NewInnoNet report: “100% of the waste is collected, 20% is non-recyclable waste and goes directly to energy recovery or
landfill.
After collection of waste:
• 23% of the generated waste goes direct to landfill;
• 26% of the generated waste goes direct to energy recovery;
• 52% of the generated waste is collected separated and goes to a pre-treatment installation.
Pre-treatment has a yield of 82%. From the pre-treatment output
• 20% is exported outside the EU;
• 80% is sent to a recycling plant.
• The losses go to landfill (47% of the losses) or energy recovery (53% of the losses).
Recycling has a yield of 73%.
• The recycling output is sold as recycled plastics.
• The losses go to landfill (47% of the losses) or energy recovery (53% of the losses)”
Interpreted flow diagram
figure 39: Mass flow diagram based on the NewInnoNet report

- Confidential -
105
APPENDIX 5 ! Global plastic protocol indicators List of indicators to be used at packaging level:

- Confidential -
106
APPENDIX 6 ! Material Circularity Indicator tool

- Confidential -
107
APPENDIX 7 ! Cost of manual sorting
Assuming one worker needs 3 seconds to recover a unit, one worker can sort 1,200 units per hour.
Assuming one tonne contains 300,000 film units (Canadian Plastics, 2013), it would take one worker 250
hours to hand pick one tonne. Table 20 shows the cost associated to manual sorting in different regions.
Table 20: cost of manual sorting in different regions
Region Labour cost (Euro/Hours)
(Rem, 2016) Price for one tonne
Western Europe 20 5,000
Eastern Europe 3 750
Asia 1 250

- Confidential -
108
APPENDIX 8 ! House of Quality to prioritize the issues House of Quality 1

- Confidential -
109
House of Quality 2

- Confidential -
110
APPENDIX 9 ! Specifications for the sorted fraction

- Confidential -
111
Produktspezifikation 04/2009 Fraktions-Nr. 350
Sortierfraktion: M i s c h k u n s t s t o f f e
A Spezifikation/Beschreibung
Gebrauchte, restentleerte, systemverträgliche Artikel aus verpackungstypischen Kunststoffen (PE, PP, PS, PET) inkl. Nebenbestandteilen wie Verschlüssen, Etiketten usw. Das Beiblatt ist Bestandteil dieser Spezifikation!
B Reinheit
mindestens 90 Masse-% gemäß Spezifikation/Beschreibung.
C Störstoffe
Maximaler Gesamtstörstoffanteil 10 Masse-%
Metallische und mineralische Störstoffe mit einem Stückgewicht > 100 g dürfen nicht enthalten sein!
Papier, Pappe, Karton < 5 Masse-% Sonstige Metall-Artikel < 2 Masse-% PET-Flaschen, transparent < 4 Masse-% PVC-Artikel, die keine Verpackung sind < 0,5 Masse-% Sonstige Reststoffe < 3 Masse-%
Störstoffbeispiele: - Glas - PPK-Verbundmaterialien (z. B. Flüssigkeitskartons) - Fremdmaterialien (z. B. Gummi, Steine, Holz, Textilien, Windeln) - kompostierbare Abfälle (z. B. Lebensmittel, Gartenabfälle)
D Lieferform
- transportfähige Ballen - Abmessungen und Dichte der Ballen sind so zu bemessen, dass ein Planen-LKW
(Ladefläche 12,60m x 2,40m; seitl. Durchladehöhe min 2,60m) mit einer Mindestauslastung von 21 t beladen werden kann
- trocken gelagert - Herstellung durch handelsübliche Ballenpressen - Kennzeichnung durch Ballenanhänger versehen mit Sortieranlagen-Nr., Fraktions-
nummer und Produktionsdatum

- Confidential -
112

- Confidential -
113
APPENDIX 10 !Horizontal Form Fill Seal Packaging lines The two packaging examples are transformed from reel to final product via horizontal form, fill, and
seal (HFFS) packaging lines. The understanding of these lines might influence the design choices as
the newly design packaging should fit with the same processes.
Horizontal Form Fill Seal for the Aluminum laminated plastic pouch The Aluminium laminated plastic pouch is formed in horizontal form fill seal packaging line as shown
on Figure 40. A reel of printed standard aluminium foil laminated plastic is the input of the process. An
unwind roll holder rolls the film out and pre-folds the packaging. The film goes to a dual sealing station
that creates side and bottom seals (heat sealing). Another station cools down and set the seal. Then a
notch can be added if required, to ease the opening of the final product. Then the pre-shaped
packaging is cut to form individual pouches. After cutting, the pouches proceed through a transfer belt
where they are placed into clamps that hold them on both sides. A vacuum station opens each pouch
using a vacuum system with an air blast assist. The pouches are then filled with product via funnel. If
nitrogen application is required, pouches are pre-flushed prior to sealing. And an additional flush can
be done after filling. Pouches travel to a de-duster and then move to the top sealer and cooler. Final
packed products are discharged from the clamps.
Figure 40: simplified scheme for HFFS
Horizontal form fill seal for flow wrapping The horizontal form fill seal flow wrapping is shown on Figure 41. The food product to be packed is
placed on an infeed conveyor (manually or automatically). The infeed conveyor has pushers, which allow
for fixed spacing between two products and move the product forward into a forming area. As the
product travel through the former, the OPP film is wrapped into a tube around the product with the
two outside edges of the film mated together at the bottom. These two mating edges of film pass
between rotating fin seal wheels, which pull the film and product through the former and seal it together
with pressure. The cutting head consists of a pair of rotating shafts, which seal the front of one package
and the back of another, and cut the products apart in one motion. The knife can be either straight or
serrated for an easy open feature.

- Confidential -
114
Figure 41: flow wrapping (Bosch packaging brochure)

- Confidential -
115
APPENDIX 11 !Detailed description of the sorting process Description of a typical sorting process The sorting process is done according to the steps shown in Figure 42. First, the collected packaging
arrives at the sorting plant and undergoes a conditioning step, which serves to make the various items
loose. Then the packaging is sorted according to size via drum screens to select packaging sizes
comprised between 10 and 330 mm. Then an air classification step sucks out the lightweight packaging
such as films and paper. The heavier fraction continues to a metal separation step: a magnet extracts
the ferrous components while an Eddy Current sorts the aluminium-containing constituents. The output
fraction is concentrated in plastics and goes to a ballistic separation where the 2D shaped packaging
are separated from the 3D ones. The 3D fraction continues to Near Infrared (NIR) sorting, which allows
for sorting per plastic type. Finally, a manual sorting can take place before baling the sorted packaging.
Figure 42: Sorting process (Tönsmeier)

- Confidential -
116
APPENDIX 12 !Eddy Current Sorting (Steinert) Question: What is the sensitivity of the Eddy Current sorting? Are structures containing more than 15 microns of Aluminium well separated by Eddy Current? What are the key parameters, which influence the sorting (food remaining? thickness of surrounding plastics?)? The question regarding the separation of thin aluminium coated polymers reveals the limits of what is physically possible with eddy current separation technology. In general it is possible to induce an eddy current into thin layers of aluminium, even in very thin layers, because aluminium is a good conductor with about 0.35 108 Ω-1 m-1. But of course this depends on several parameters with regards to the poledrum system itself, like the used magnetic material and therefore the realized magnetic force and the pole changing frequency of the magnetic field. However, the utilized repulsion force is influenced in many different ways by the material and the objects itself. Main parameters here are, the thickness of the conductive layer within one object, the particle shape, the particle’s weight and the ratio of the specific electric conductivity to the material’s density. In a physical separation process all these parameters are influencing each other. On top there are also some more factors from the machinery itself, that has to be taken into account, like the conveying speed, the position of the eccentric pole drum and therefore the point of origin of the repulsion force, the position of the splitter plate and of course the particle distribution ideally in a mono layer on the surface of the conveyor belt. If a separation task has to be successful, the resulting repulsion force has to be high enough to shift the particle trajectories of the conductive materials sufficiently. One major parameter with regards to your specific material is the particle shape. As this is a light and flat material, it will tend to glide with regards to the air drag. Recently we did some trials with similar materials as described below and it showed, that we could induce eddy currents into that material. A proper separation result was still not possible, because of two major findings. (1) The particle’s shape prevented a proper physical separation with regards to the low specific weight of each particle and the high 2D-area. (2) Another finding on ultra-thin layers is, that the so called skin effect may occur. This effect influences the resulting repulsion force in a negative way. Hence, the repulsion force is reduced. In conclusion, it can be pointed out, that a repulsion force could be created by eddy current, but that repulsion force was in interference with other forces that prevented a physical separation. Question: the “thickness of the conductive layer within one object, the particle shape, the particle’s weight and the ratio of the specific electric conductivity to the material’s density” are important factors to consider. Would you have any estimates of what these values should be to be sorted with current best commercial equipment? Or does this need further testing/trials to find critical value? The arguments I pointed out in my former e-mail can be adapted on every material that shows similar characteristics with regards to conductivity, specific weight and shape. Therefore the influence on enhancing sortability of an eddy current separator (ECS) by designing another thin layered material is very limited. It will still be a flexible, thin layered film. For future film materials we expect, that the material gets even more thinner with regards to material savings. That means for us, that we also have to expect less aluminium in those films. As films with foil are difficult to separate with an ECS in general, this would imply even worse chance with this technology. However, the aim of a separation process always has to follow the potential target recycling process (e.g. material or energetic recovery). As these subsidiary processes always have to be assessed with regards to future markets and legislation, it is always difficult to forecast.

- Confidential -
117
The estimation of minimal thicknesses of a conductive foil in a multi-layer film is difficult, because that only works theoretically. In real recycling applications the different forces are interfering with each other as I explained earlier.
APPENDIX 13 !Detailed description of recycling process
The mixed plastics recycling process description (Stakeholder contribution) (see Figure 43) The mixed polyolefin bale is first shredded to a particle size of 65 mm. Then a magnetic sorting
combined with an Eddy Current sorting allow for sorting out ferrous and non-ferrous metals. An air
classification step allows extracting the lightweight fraction, including films and remaining paper. The
heavier fraction goes to the NIR sorting which results in one plastic resin fraction. In a grinding step,
the sorted polyolefin plastic (PP or PE) is mixed with the polyolefin light fraction and size reduced to 25
mm. A friction washing process cleans the plastic and separates according to material’s specific density.
After drying, the material is extruded.
The film recycling (Figure 44) Figure 44 shows the typical sorting steps of a film recycling facility, which are very similar to the mixed
polyolefin process. The main difference is that the NIR sorting is not performed for two reasons:
"! The film is very likely to be PE
"! The ejection of lightweight materials is challenging
Figure 43: Mixed Plastics recycling
Figure 44: Film recycling

- Confidential -
118
APPENDIX 14 !Stakeholders and their needs Suppliers of raw materials (Plastics resins, Aluminium foil, paper, adhesives, printing inks…) for
converting industry. The packaging…
Includes respective RM in the final packaging (1)
Includes commonly produced RM (1)
Allows for recognition of the quality of the RM supplied (1)
Packaging converters. The packaging… Manufacturing is compatible with current packaging lines (4)
Meets the performance requirements of the Brand Owners (and further, consumers) (5)
Allows for recognition of the quality of the converting process (3)
Is sold at competitive price (4)
Does not generate much waste in the process (3)
Could serve different market/applications (3)
Packaging filling companies. The packaging… is compatible with current filling/sealing lines (4)
offers good containment of the product (5)
is easy to handle in the process (4)
has low failure (3)
Could serve different market/applications (3)
Easy to pack for transportation (pallet) (3)
Packaging machinery supplier. The packaging… simplicity/complexity fits the capabilities of machineries/ or requires minor changes (3)
Brand Owners. The packaging… Protects the product (prevent breakages, spoilages, contamination, increase shelf-life, guarantee
health and safety) (5)
Contains the product (long term mechanical properties, compatibility packaging/product) (5)
Promotes (product description, product features, branding, green image) (5)
Informs (Product ingredient list, preparation & usage, nutritional data, storage data, safety warning,
contact info, opening instruction, disposal advices) (5)
Is convenient (portioning, product storage, product preparation/usage) (5)
Is fit-for-purpose (4)
Is easy to handle (transportation, handling throughout supply chain, point of display) (3)
Meets consumers’ demands and choices (5)
Meets market criteria (cost, performances, environmental impact) (4)
Transporters. The packaging…

- Confidential -
119
Is easy to transport (pallet) (3)
Is easy to handle (3)
Retailers. The packaging… Is easy to handle (3)
Is resistant to chocks (4)
Has standard size for shelves (3)
Is attractive (5)
Meets customers’ needs (5)
Consumers. The packaging… Attractive (4)
Is easy to handle (4)
Is easy to use (e.g. open) (4)
has consumer friendly features (Easy to open/reclose, indication of freshness) (4)
Has adjusted size to needs (5)
Is informative (storage time, ingredients, nutritional facts) (4)
Allows for extended shelf-life (5)
is eco-friendly (4)
Cheap (5)
Collection. The packaging… Fits the collection schemes (3)
Can be distinguished by consumers to sort in the right collecting points (if source separation) (3)
Is efficiently recoverable after use (3)
Sorters. The packaging…
Is not randomly separated in the sorting process (4)
Is easily separated from other streams (5)
Made from materials which have a positive market value (5)
Has a simple composition (mono-materials) (4)
Recyclers. The packaging…
Has a simple composition (mono-materials) (5)
Low food contamination remaining (easy to empty) (3)
Easy to shred (3)
Right/compatible combination of materials (5)
Easy sorting in the recycling process (4)
High material value (4)
Governments/ (Environmental) NGOs. The packaging…
Is recyclable (4)
Is informative (3)
Food approved/safe (5)

- Confidential -
120
Compatible with waste management options (3)
Made from responsibly sourced materials (4)
Manufacturing using clean production technologies (3)

- Confidential -
121
APPENDIX 15 !Translating needs into measurables
Needs Quality characteristics Measurable Unit
Contain
Mechanical properties
Tensile strength MPa Elongation % Elastic modulus MPa or N/mm2 Surface energy J/m2 Thickness m Density g/cm3 Impact strength J/m2 Puncture resistance N … …
Sealing properties Heat seal and hot tack strength
N/cm
Seal integrity
Protect Barrier properties
Water vapour transmission
g/m2.day
Oxygen transmission Cm3/m2.day Light transmission % Migration Ø
Thermal properties Thermal conductivity W/(Mk)
Communication Visual appeal /branding/ promotion
Gloss GU Hue (pure color in therms of green, red, magenta.
°
Saturation % Lightness %
Information Printed area %
Convenience
Openability / open /reclose feature
Tear strength kN/m
Portionability (amount/size)
Dimension M2 Product weight g
Unpacking/gripability Surface roughness? Ease of emptying % residue (w) % Recyclability See report Machinability Coefficient of friction Ø Fill rate Volume utilisation % Ease of transport/ stacking
Volume air transported
%

- Confidential -
122
APPENDIX 16 !Idea generation This is the list of ideas generated in the Basis of Design report. Ideas in red are the ones relevant for the design work. !
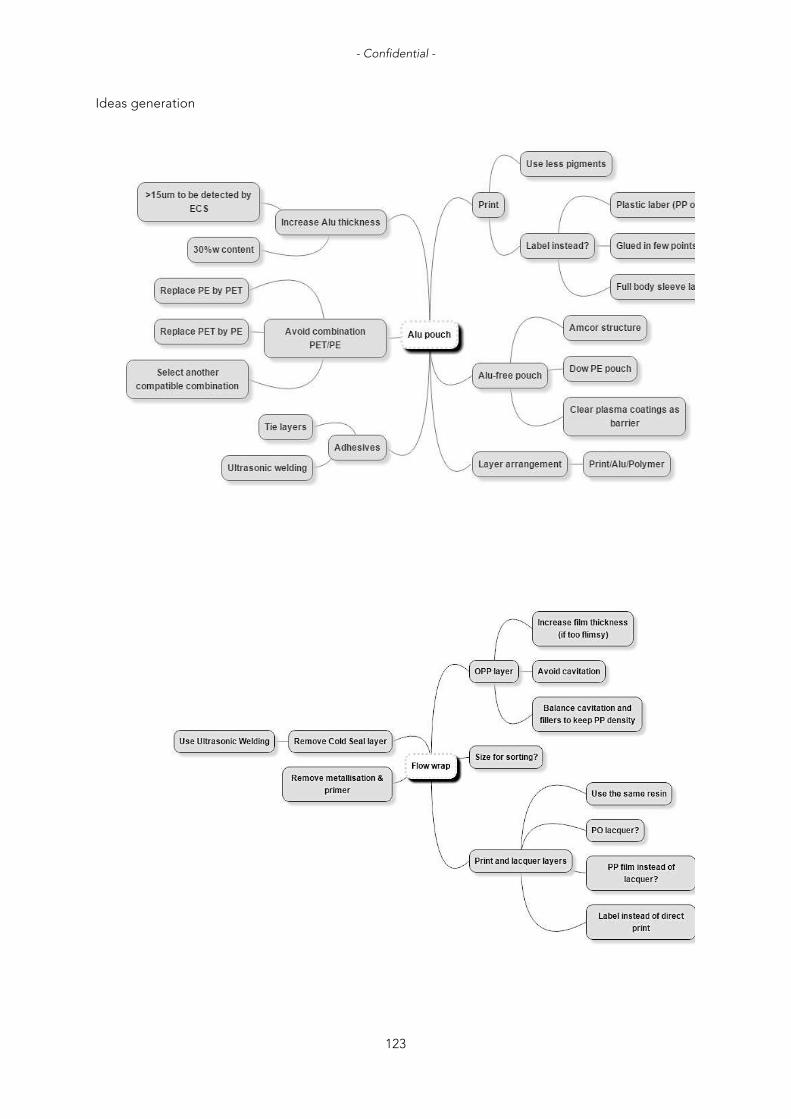
- Confidential -
123
Ideas generation

- Confidential -
124
APPENDIX 17 !Concept generation Few preliminary concepts are proposed here based on the idea generation. One concept of each
packaging will be further developed later in the project, with the input of stakeholder experts.
Aluminium laminated plastic pouch For the aluminium pouch example, it was shown that the structure tends to disrupt the recycling
process, while the sorting process is quite straightforward. The aim of the design is to provide with
more consistent sorting at the recycler and solve some issues from the HoQ. Two approaches are
possible: designing for aluminium recycling or designing for PE recycling.
Current structure: PET 12/print/PUR/Alu 7/PUR/PE 75
Concept A: «Standard 2.0»
In this concept, the aluminium thickness is increased to help extracting the packaging from the waste
stream and to have a product that satisfies requirements for aluminium recycling. According to the
observations made by plastics recyclers, packaging which contains an aluminium layer of 15 um or
above are certainly sorted by Eddy Current. From an aluminium recycler perspective, a material whose
aluminium content is higher than 30% by weight is worth recycling. Thus the first concept is the
following: PET 12/print/PUR/ALU 13-15/PUR/PE 75.
$Concept B: «Layer re-shuffling»
Different ways to arrange the layers were investigated. Considering that four main materials had to be
arranged (PET, print, aluminium foil and PE), 24 combinations were possible. Eliminating all impossible
combinations led to a final possibility, which is: Lacquer/print/ALU 7-15/PUR/PE.
In this concept, the sorting is favoured by the fact that the aluminium layer is closer to the outer layer,
so possibly better detected by Eddy Current. The thickness of the aluminium can also be increased in
such a way that the Eddy Current separation is highly efficient.
Concept C: «AlOx»
In this concept, it is proposed to replace the aluminium foil by transparent oxides coating. Aluminium
oxide and silicon oxide, among others, have demonstrated to have also good moisture and water
barrier properties. Oxides are not found to cause issues at recyclers. To improve further the recyclability
of the aluminium pouch, the choice of material to be coated could be PE in order to create a PE pouch.
Aluminium oxide is the chosen material for the barrier as it can be deposited using similar equipment
than the one used for metallisation.
The proposed structure is: Clear plasma coated PE (Alox)/print/adhesive/PE.

- Confidential -
125
Flow wrap For the flow wrap example, the structure does not disrupt the sorting and recycling process, but the
different constituents of the packaging may have a large impact on the quality of the secondary
material. In the current packaging structure, six layers of different nature are superposed. Once melted
these layers create blends, leading to a decrease in the homogeneity of the polymer flow. The design
concepts aim at simplifying the structure, by reducing the number of different materials.
Current structure: PA lacquer/print/metallization/primer/OPP/Cold seal
Concept: 1 «Minimalist»
In this concept, the layer of metallisation is removed, preventing also the use of a primer. It is believed
that the metallisation in flow wrap tends to be used for visual purposes rather than for the
barrier/functional properties offered. The structure can then be simplified as follow: PA
lacquer/print/OPP/cold seal.
Concept 2: “PP flow-wrap”
This concept aims at removing the cold seal layer because it is believed that the rubber/latex
composition of the cold seal has a negative impact on the homogeneity of the polymer melt in the
extrusion step. One way to remove the Cold Seal is to use ultrasonic welding as sealing technology.
This technology allows sealing two similar materials together. Thus the OPP could be sealed to OPP,
and the structure becomes: PA lacquer/print/OPP. Furthermore, as the PA lacquer is usually chosen in
combination with the latex cold seal, this means that the lacquer can now be chosen differently. It is
thus suggested to use a PP lacquer, which allows for reducing further the number of different materials
used. The final structure for the concept 2 is: PP lacquer/print/OPP.
Concept 3: “Balanced”
This concept aims at further improvement of the concept 2 and could help the robustness of the design
in other processes. For that the voids and fillers in the OPP structure are balanced in order to keep the
specific density equal to the one of OPP: PP lacquer/print/OPP (density=0.9g/cm3).

- Confidential -
126
APPENDIX 18 !Evaluation matrix
Aluminium pouch Flow wrap
Concept A Concept B Concept C Concept 1 Concept 2 Concept 3
Standard 2.0 Layer re-shuffling
AlOx Minimalist PP flow-wrap Balanced
Product containment
0 0 0/- 0 0 0
Product protection + + 0/- 0/- 0/- 0/-
Communication 0 0 0/- 0/- 0/- 0/-
Convenience 0 0 0 0 0 0
Consistent sorting at sorters
0 0 0 0 0 0
Consistent sorting at recyclers
+ + + 0 0 0
Sorting efficiency at flake level
+ + + 0 + +
Increased material compatibility
0 + + 0 + +
Decrease of number non TP
materials 0 + 0 + + +
Decrease of number of TP
materials 0 0 + 0 0 0
Increased PO output
0 0 + 0 + +
Cost saving on RM - - + + + +
Environmental impact (material
embedded) - - + + + +
Reel manufacturing 0 0 0 0 0 0
Compatibility HFFS 0 0 0 0 0 0

- Confidential -
127
APPENDIX 19 !AlOx barrier properties
Figure 45: Transparent oxides on PET show good barrier properties (Ahmed, 2014)
Figure 46: Toppan films show excellent barrier properties (Toppan, 2016)