
mapping the benthos in victoria’s marine national parks · Parks Victoria Technical Series No. 41...
46
PARKS VICTORIA TECHNICAL SERIES NUMBER 41 Mapping the Benthos in Victoria’s Marine National Parks Volume 2: Point Hicks Marine National Park K.W. Holmes, B. Radford, K.P. Van Niel, G.A. Kendrick and S.L. Grove October 2007 PARKS VICTORIA TECHNICAL SERIES • NUMBER 41 Mapping the Benthos in Victoria’s Marine National Parks • Volume 2: Point Hicks Marine National Park
-
Upload
duongduong -
Category
Documents
-
view
215 -
download
0
Transcript of mapping the benthos in victoria’s marine national parks · Parks Victoria Technical Series No. 41...

p a r k s v i c t o r i a t e c h n i c a l s e r i e s
number 41
mapping the benthos in victoria’s marine national parks
volume 2: point hicks marine national park
K.W. Holmes, B. Radford, K.P. Van Niel,
G.A. Kendrick and S.L. Grove
October 2007
Parks Victoria is responsible for managing the Victorian protected
area network, which ranges from wilderness areas to metropolitan
parks and includes both marine and terrestrial components.
Our role is to protect the natural and cultural values of the parks
and other assets we manage, while providing a great range of
outdoor opportunities for all Victorians and visitors.
A broad range of environmental research and monitoring activities
supported by Parks Victoria provides information to enhance park
management decisions. This Technical Series highlights some of
the environmental research and monitoring activities done within
Victoria’s protected area network.
Healthy Parks Healthy People
For more information contact the Parks Victoria Information Centre
on 13 1963, or visit www.parkweb.vic.gov.au
par
ks v
icto
ria
tech
nic
al ser
ies • nu
mb
er 41 m
ap
pin
g th
e b
en
tho
s in v
ictoria
’s ma
rine
na
tion
al p
ark
s • vo
lum
e 2
: po
int h
icks m
arin
e n
atio
na
l pa
rk

© Parks Victoria
All rights reserved. This document is subject to the Copyright Act 1968, no part of this publication may be reproduced, stored in a retrieval system, or transmitted in any form, or by any means, electronic, mechanical, photocopying or otherwise without the prior permission of the publisher.
First published 2007
Published by Parks Victoria Level 10, 535 Bourke Street, Melbourne Victoria 3000
Opinions expressed by the Authors of this publication are not necessarily those of Parks Victoria, unless expressly stated. Parks Victoria and all persons involved in the preparation and distribution of this publication do not accept any responsibility for the accuracy of any of the opinions or information contained in the publication.
Authors:
Karen W. Holmes – Research Fellow, University of Western Australia Ben Radford – Research Fellow, University of Western Australia Kimberly P. Van Niel – Lecturer, University of Western Australia Gary A. Kendrick – Associate Professor, University of Western Australia Simon L. Grove – Research Officer, University of Western Australia
Additional financial support for this study was provided by:
National Library of Australia Cataloguing-in-publication data
Includes bibliography. ISSN 1448-4935
Citation
Holmes, K.W., Radford, B., Van Niel, K.P., Kendrick, G.A. and Grove, S.L. (2007) Mapping the Benthos in Victoria’s Marine National Parks, Volume 2: Point Hicks. Parks Victoria Technical Series No. 41. Parks Victoria, Melbourne.
Printed on environmentally friendly paper
Parks Victoria Technical Paper Series No. 41
Mapping the Benthos in Victoria’s Marine National Parks
Volume 2: Point Hicks MNP
Karen W. Holmes Ben Radford
Kimberly P. Van Niel Gary A. Kendrick Simon L. Grove
The University of Western Australia
October 2007

Parks Victoria Technical Series No. 41 Mapping the Benthos in Victoria’s MNPs
2
EXECUTIVE SUMMARY Maps and models of the marine benthos provide the first available information on
basic seafloor physical properties and deep-water biology across Cape Howe, Point
Hicks, Point Addis, Twelve Apostles, and Discovery Bay Marine National Parks
(MNPs). These maps will supply information for MNP management, such as
identifying fish habitats, potential habitat for invasive species, and areas particularly
sensitive to physical and chemical disturbance.
The five Victorian Marine National Parks were hydroacoustically surveyed in
2004/05, and continuous coverage bathymetry and substrate texture maps were
produced for 20,000 ha of seafloor. Underwater tow video footage was collected over
more than 350 kilometres; the imagery was analysed and used to construct a
database of substrate and biological benthos characteristics for habitat modelling and
mapping. Substrate and biological categories were modelled using Classification and
Regression Trees as a function of datasets derived from the hydroacoustic surveys
to provide a framework for predicting values in areas where no observations are
available.
Basic maps of substrate composition (reef, sediment) and sessile biota (vegetation,
sessile invertebrates) presence and extent facilitate regional comparisons across the
series of MNPs. For each MNP, all identified benthos classes with sufficient numbers
of observations for statistical modelling were mapped, including sediment texture and
relief, reef structures, vegetation types, and different classes of sessile invertebrates.
Due to site-to-site differences in habitats, not all classes were mapped at all MNPs.
The layout of video transects, complexity of the benthos, and clarity of the imagery
influenced the accuracy and completeness of the video observations, and hence
model and map accuracy.
The mapping prediction accuracy is reported for all MNPs. This provides map users a
guideline for interpreting the attribute reliability of the final maps. The statistical
modelling and predictive mapping approach developed for this project is an objective,
quantitative alternative to traditional manually delineated marine habitat maps.

Parks Victoria Technical Series No. 41 Mapping the Benthos in Victoria’s MNPs
3
Contents
EXECUTIVE SUMMARY ...................................................................................... 2 INDEX OF TABLES AND FIGURES .................................................................... 4 Tables .................................................................................................................. 4 Figures ................................................................................................................. 5 Figures ................................................................................................................. 5 1 INTRODUCTION .............................................................................................. 6 2 MAPPING METHODS ...................................................................................... 7
2.1 PREPARATION OF SECONDARY DATASETS ................................... 7 2.2 TOW VIDEO OBSERVATIONS ............................................................. 7 2.3 CLASSIFICATION TREE MODELLING AND SPATIAL EXTENSION .. 9 2.4 MAPS .................................................................................................. 10
3 RESULTS POINT HICKS MARINE NATIONAL PARK ................................. 14 3.1 Maps.................................................................................................... 14 3.2 Tow video observations ....................................................................... 14 3.3 Classification tree modelling and spatial extension ............................. 15
4 DISCUSSION AND RECOMMENDATIONS ................................................... 39 4.1 MAP APPLICATIONS AND INTERPRETATION ................................. 39 4.2 OUTCOME ISSUES AND SUGGESTIONS ........................................ 40
5 CONCLUSION ................................................................................................ 41 ACKNOWLEDGEMENTS .................................................................................. 42

Parks Victoria Technical Series No. 41 Mapping the Benthos in Victoria’s MNPs
4
INDEX OF TABLES AND FIGURES
Tables Table 1. Description of datasets, both primary and secondary, included in the modelling process as predictors of seafloor substrate and biota. .................... 8 Table 2. Substrate and biota categories commonly identified through video analysis. Those modelled and mapped are indicated (Map), as are additional categories whose locations were plotted for general interest (Point IDs). Notes concerning class descriptions are included. ................................................... 12 Table 3. Point Hicks: summary of video quality by major biota and substrate category ......................................................................................................... 16 Table 4. Point Hicks: Proportion of video frame descriptions in each fine scale (A) Biota and (B) Substrate category. Proportions are relative to the 2173 video frames described in total. ..................................................................... 17 Table 5. Point Hicks: Substrate and Biota model evaluation using 25% blind validation data removed from the original video survey database.................. 19 Table 6. Point Hicks: Contribution of each model variable as a percent of total variance explained by each substrate and biota model ................................. 19

Parks Victoria Technical Series No. 41 Mapping the Benthos in Victoria’s MNPs
5
Figures Figure 1. Data entry form developed in Excel VBA for single frame descriptions of tow video footage. .................................................................... 9 Figure 2. Point Hicks: General substrate map for inter-Park comparison with integrated pure and mixed substrate classes. ................................................ 20 Figure 3. Point Hicks: General biota map for inter-Park comparison with integrated pure and mixed classes of benthic sessile biota. .......................... 21 Figure 4. Point Hicks: Substrate map with all classes successfully modelled across the Park. Note that Shell and Sand, subcategories of Sediments, have been mapped separately. .............................................................................. 22 Figure 5. Point Hicks: Sessile biota map with all classes successfully modelled across the Park. Note that Sponges, a subcategory of Sessile Invertebrates, has been mapped separately. ................................................ 23 Figure 6. Point Hicks: Probability of occurrence of Reef substrate. .............. 24 Figure 7. Point Hicks: Probability of occurrence of Shell substrate. .............. 25 Figure 8. Point Hicks: Probability of occurrence of Sand substrate. .............. 26 Figure 9. Point Hicks: Probability of occurrence of Macroalgae. ................... 27 Figure 10. Point Hicks: Probability of occurrence of Sessile Invertebrates identifiable from video. ................................................................................... 28 Figure 11. Point Hicks: Probability of occurrence of Sponges....................... 29 Figure 12. Point Hicks: Locations of detailed macroalgae identifications overlain on the bathymetry. ............................................................................ 30 Figure 13. Point Hicks: Locations of Sea Whips, Gorgonians, and undifferentiated Soft Corals identified in tow video frames, overlain on the bathymetry. .................................................................................................... 31 Figure 14. Point Hicks: Locations of Bryozoa, Ascidians, and the sponge Tethya identified in the tow video footage, overlain on the bathymetry. ......... 32 Figure 15. Point Hicks: Locations of Turritellidae molluscs identified in the tow video footage, overlain on the bathymetry. .................................................... 33 Figure 16. Point Hicks: Density of Macroalgae cover observed in video frames, overlain on the map of modelled Macroalgae presence. ................... 34 Figure 17. Point Hicks: Density of Sessile Invertebrate cover observed in video frames, overlain on the map of modelled Sessile Invertebrate presence. ....................................................................................................................... 35 Figure 18. Point Hicks: Tow video sampling plan for the Park. ..................... 36 Figure 19. Point Hicks: Final layout of tow video footage collected. .............. 37 Figure 20. Point Hicks: Locations of poor visibility video along transects collected. ........................................................................................................ 38

Parks Victoria Technical Series No. 41 Mapping the Benthos in Victoria’s MNPs
6
1 INTRODUCTION Maps and models of the marine benthos provide the first available information on basic seafloor physical properties and deep-water biology across Cape Howe, Point Hicks, Point Addis, Twelve Apostles, and Discovery Bay Marine National Parks. These maps will supply information for MNP management, such as identifying fish habitats, potential habitat for invasive species, and areas particularly sensitive to physical and chemical disturbance. The joint venture between Parks Victoria and the Coastal CRC (major contributions by the University of Western Australia and Fugro Survey Pty Ltd) was formed to facilitate state of the art surveying and mapping of near-shore benthic habitats in five of Victoria’s Marine National Parks (MNPs) spanning five bioregions (IMCRA, 1998). More than 20 000 ha of the seafloor have been surveyed with hydroacoustic equipment at high resolution and processed to produce full coverage maps of bathymetry and textural information. Underwater tow video footage has been collected over more than 350 linear kilometres. Point Addis MNP was used as a pilot study to develop methods for mapping in the most efficient, objective, and ecologically meaningful way possible. Based on trials with data from Point Addis and existing datasets from Western Australia, including Marmion MNP, predictive modelling was chosen as the most appropriate technique for bridging the divide between high resolution quantitative geophysical information, and qualitative video observations of substrate composition and the vegetation and organisms visible on the seafloor to produce detailed (1:25,000) maps of the seafloor for management purposes. Basic maps of substrate composition (reef, sediment) and sessile biota (vegetation, sessile invertebrates) presence and extent facilitate regional comparisons across the series of MNPs. For each MNP, all identified benthos classes with sufficient numbers of observations for statistical modelling were mapped, including sediment texture and relief, reef structures, vegetation types, and different classes of sessile invertebrates. Due to site-to-site differences in habitats, not all classes were mapped at all MNPs. The layout of video transects, complexity of the benthos, and clarity of the imagery influenced the accuracy and completeness of the video observations, and hence model and map accuracy. The mapping prediction accuracy is reported for all MNPs. This provides map users a guideline for interpreting the attribute reliability of the final maps. The statistical modelling and predictive mapping approach developed for this project is an objective, quantitative alternative to traditional manually delineated marine habitat maps. Presented here is an overview of the predictive modelling approach to seafloor mapping, followed by results for the Point Hicks MNP. Deviations from the general methodology are noted in the results.

Parks Victoria Technical Series No. 41 Mapping the Benthos in Victoria’s MNPs
7
2 MAPPING METHODS The predictive modelling approach consists of three main components following the hydroacoustic surveys and video footage collection:
(1) Data preparation: a. Development of secondary datasets from bathymetry that provide
unique textural information about the seafloor; b. Design and execution of a video analysis plan for modelling; these
observations are the primary data identifying the seafloor substrate and biological features;
(2) Modelling: Model development for all substrate and biological categories as a function of bathymetry and derived datasets to provide a framework for predicting values in areas where no observations are available;
(3) Mapping: Application of the models to all areas surveyed with hydroacoustics to predict the most likely substrate and biological features in locations where no field observations (video data) were available, creating full coverage maps.
2.1 PREPARATION OF SECONDARY DATASETS The bathymetry and backscatter datasets (resolution ranging from 1- to 2.5-m pixels) derived from the hydroacoustic surveys in 2005 constituted the core full-coverage datasets for modelling the spatial distribution of seafloor characteristics and for producing habitat maps. The bathymetry data were used to develop a variety of textural datasets (Table 1). This involved applying algorithms to the bathymetry data using “moving window” kernels (5, 10, 25 and 50 cell radius circles) to reveal textural differences. The algorithms calculate the relationship between the central cell and its neighbours within the kernel, and were run for every cell in the bathymetry grid.
2.2 TOW VIDEO OBSERVATIONS Video observation and interpretation took place in two phases. First “coarse classification” was carried out, which involved describing the seafloor along transect and assigning the description of distinct marine habitats to segments of video footage. This information was used to identify areas of high spatial heterogeneity (i.e. large number of transitions between habitats) and homogeneity (i.e. few transitions). The second phase involved “point interpretation”, during which individual georeferenced video frames were described in detail, and were entered into a database for statistical analysis (Figure 1). The frames were selected randomly, but their spatial distribution was weighted by the spatial heterogeneity noted during the coarse classification phase, leading to higher density samples located in complex areas. Approximately one frame per 20 metres was described in high spatial variability areas and one frame per 60 metres in low variability areas. To capture multi-scale spatial variability, clusters of 8 to 10 frames separated by short distances were analysed. An additional 100 frames were randomly selected as cluster starting points, stratified by the overall proportion of heterogeneous and homogenous areas. Prior to statistical modelling of seafloor characteristics, the video observations were georeferenced, and a random 25% split of the total observations was removed for use in model validation.

Parks Victoria Technical Series No. 41 Mapping the Benthos in Victoria’s MNPs
8
Table 1. Description of datasets, both primary and secondary, included in the modelling process as predictors of seafloor substrate and biota. Predictor datasets Definition Source or AlgorithmBathymetrym (Depth)
Elevation relative to the Australian Height Datum (AHD)
Reson 8101 Mulitbeam, Fugro Geomatics
Backscatter Second return from Multibeam (textural information) Reson 8101 Mulitbeam, Fugro Geomatics
Depth Residual Difference between the bathymetry and a linear surface fitted to the bathymetry defined by gridded depth measurements at point locations
ArcGIS Arc/Info 9.1
Standard Deviation* Standard deviation of elevation (local neighbourhood analysis)
ArcGIS Arc/Info 9.1
Slope First derivative of elevation: Average change in elevation/distance
ArcGIS Arc/Info 9.1
Aspect Azimuthal direction of steepest slope ArcGIS Arc/Info 9.1
Profile Curvature Second derivative of elevation: Concavity/convexity parallel to the slope
ArcGIS Arc/Info 9.1
Plan Curvature Second derivative of elevation: Concavity/convexity perpendicular to the slope
ArcGIS Arc/Info 9.1
Curvature Combined index of profile and plan curvature ArcGIS Arc/Info 9.1
Hypsometric index* Indicator of whether a cell is a high or low point within the local neighbour
ArcGIS Arc/Info 9.1
Moran's I* r = 5 A weighted correlation coefficient used to detect spatial dependence. Calculated from the residuals from a linear trend surface.
Laffan, 1998
Local relief (Range)* Maximum minus the minimum elevation in a local neighbourhood
ArcGIS Arc/Info 9.1
Rugosity (surface area)
Surface area of the local neighbourhood Jenness, 2006
Topographic Position Index**
Standard landform slope classification Jenness, 2006
Landform Index Standard Landform topographic variability classification
Jenness, 2006; Weiss 2001
** Local neighbourhood analysis; run on doughnut shaped kernels:a) inner radius 15 pixels, outer radius 30 pixels, and b) inner radius 25 pixels, outer radius 50 pixels
* Local neighbourhood analysis; run on circular kernels of radius 5,10,25 and 50 pixels

Parks Victoria Technical Series No. 41 Mapping the Benthos in Victoria’s MNPs
9
Figure 1. Data entry form developed in Excel VBA for single frame descriptions of tow video footage.
2.3 CLASSIFICATION TREE MODELLING AND SPATIAL EXTENSION Exhaustive sampling over large sites is prohibitively expensive, and generally not possible. To infer where things are across the site, we need to sample part of the environment in detail using the combination of video and the hydroacoustic surveys, then based on this snapshot, predict where other similar areas might be using only the hydroacoustic information. This process is predictive modelling. Video observations provide the basic information detailing what is actually found on the seafloor, while bathymetry and textural datasets provide information on environmental characteristics, and give full coverage of the MNP. In predictive modelling, the observations are reported for all benthic classes of interest that are

Parks Victoria Technical Series No. 41 Mapping the Benthos in Victoria’s MNPs
10
possible to identify from video (Figure 1), and their relationships with environmental characteristics defined through statistical modelling to predict class presence or absence at unsurveyed sites. The relationships between the video observations and the bathymetry-derived datasets were characterised using classification and regression tree modelling (CART) (Breiman et al., 1984). Classification trees are well suited to dealing with complex ecological datasets that contain correlated predictor variables and display non-linear relationships. A detailed description of the application of this method with marine ecological data is outlined in De’ath and Fabricius (2000). The final trees were constructed based on the results of ten-fold cross validation to determine the optimal tree size and to prevent over-fitting. This ensures that the model is representative of the area as a whole, and is not biased toward any particular subset of data. Plots of tree size (number of branches) versus classification error were used to select the appropriate tree size without over fitting (Breiman at al., 1984). S-plus and the library “tree” were used for tree construction and graphics (Version 6.2 (2003) Insightful Corp). Models are simplifications of complex real world systems and must be validated, ideally with independent data collection, or less desirable, with statistical methods. In this case, the CARTs were evaluated using a subset of the video observations reserved prior to modelling (25% of the full dataset). Specifically, the model accuracy was assessed by predicting the values of the blind validation dataset and analysing the performance using ROC (receiver-operator characteristics) analysis. ROC are commonly visualised as plots of model sensitivity (classification accuracy) versus specificity (false positive rate). The larger the area under the curve (AUC), the more robust the model for prediction. Models with AUC greater than 0.8 have high predictive power, values between 0.7 and 0.8 are acceptable and models with AUC of 0.5 or less have no power of discrimination (Hosmer and Lemeshow 2000). The probability maps (values ranging between 0.0 to 1.0) were simplified to binary presence/absence maps (values equal or 0 or 1) for mapping. The threshold used to produce the binary maps was determined statistically using ROC. The probability value (P) used as a threshold was determined to avoid extreme over- or under-prediction (P-fair). P-Fair provides a good balance between false presence, false absence, and model accuracy particularly when the numbers of true presence values in a dataset are small. However, in the case where a large number of true presence values are recorded, the P-Kappa value provides a more balanced cutoff value for presence / absence values. Model evaluation and determination of thresholds for creating binary maps were conducted using the ROC AUC software package (Schröder 2004). The classification tree models for each biological and substrate class were extended over the secondary datasets (pixel resolution 2.5 x 2.5 m) to map the probability of class presence. The binary maps were overlain to produce multi-class, full coverage maps of the study area.
2.4 MAPS Two final habitat maps were produced for each park that present general classes common to all the parks for (1) physical substrate and (2) biota. These maps contain both pure and mixed categories (mixed categories are formed when more than one class is present at a location). In addition, maps of all classes identifiable from the video in sufficient numbers for statistical modelling are presented in logical groupings (e.g. all subcategories of vegetation) (Table 2). Probability maps for all classes modelled are presented along with maps showing the extent mapped as “present” for each class. Some features could be occasionally identified from video, but too few were found for statistical modelling (e.g. Soft corals or genus-level identification of

Parks Victoria Technical Series No. 41 Mapping the Benthos in Victoria’s MNPs
11
macroalgae). The locations of these observations are mapped as points for general interest. It is important to note that for all categories, the number and distribution of observations are largely dependent on the methods used for data collection (tow video), the conditions during data collection, and methods used recording observations.

Parks Victoria Technical Series No. 41 Mapping the Benthos in Victoria’s MNPs
12
Table 2. Substrate and biota categories commonly identified through video analysis. Those modelled and mapped are indicated (Map), as are additional categories whose locations were plotted for general interest (Point IDs). Notes concerning class descriptions are included.
Categories
Point Hick
s
Cape H
owe
Twelve A
postles
Discove
ry Bay
Notes
GeneralReef Map Map Map Map Hard substrate, undifferentiatedSediment Map Map Map Map Soft substrate, undifferentiated (<
64 mm)Sessile Invertebrates (SI)
Map Map Map Map Sessile Invertebrates, undifferentiated
Macroalgae Map Map Map Map Macroalgae, undifferentiated
ReefBroken/Fragmented Map Map Fractured, fissured, and complex
outcropping reef.Solid Map Map Continuous, relatively low relief reef
outcrops. Commonly wave cut limestone platforms or granite.
Boulders Map Boulders / small outcrops, generally fitting within a video frame.
SedimentSand Map Map Map Map Approximate grainsize 0.05 - 2mmSand (low relief) MapSand (high relief) MapCoarse ripples MapFine ripples Map MapShell (Gravel) Map Map Coarse sand and gravel of biogenic
composition: largely shell fragments. Extensive areas identified at Cape Howe and Point Hicks
Gravel/Cobble Map 16-64 mm / 64-250 mm: Only identified at Twelve Apostles, granite substrate
AlgaeRed Algae Point IDs Point IDs Map Point IDsBrown Algae Point IDs Point IDs MapGreen Algae Point IDs Point IDs Point IDsTurf Algae Point IDsKelp Point IDs Point IDs Point IDs Map Subset of Brown AlgaeEcklonia Point IDs Point IDs Map Map Subset of Kelp, which is a subset of
Brown AlgaeSargassum Point IDs Brown AlgaeScytothalia Point IDs Brown AlgaeCaulerpa Map Point IDs Point IDs Green AlgaeCrabweed Point IDsSeagrass (Posidonia) Point IDsRhodoliths Red coralline algae; Noted in
continuous classification for Cape Howe and Point Hicks.
Parks Victoria Technical Series No. 41 Mapping the Benthos in Victoria’s MNPs
13
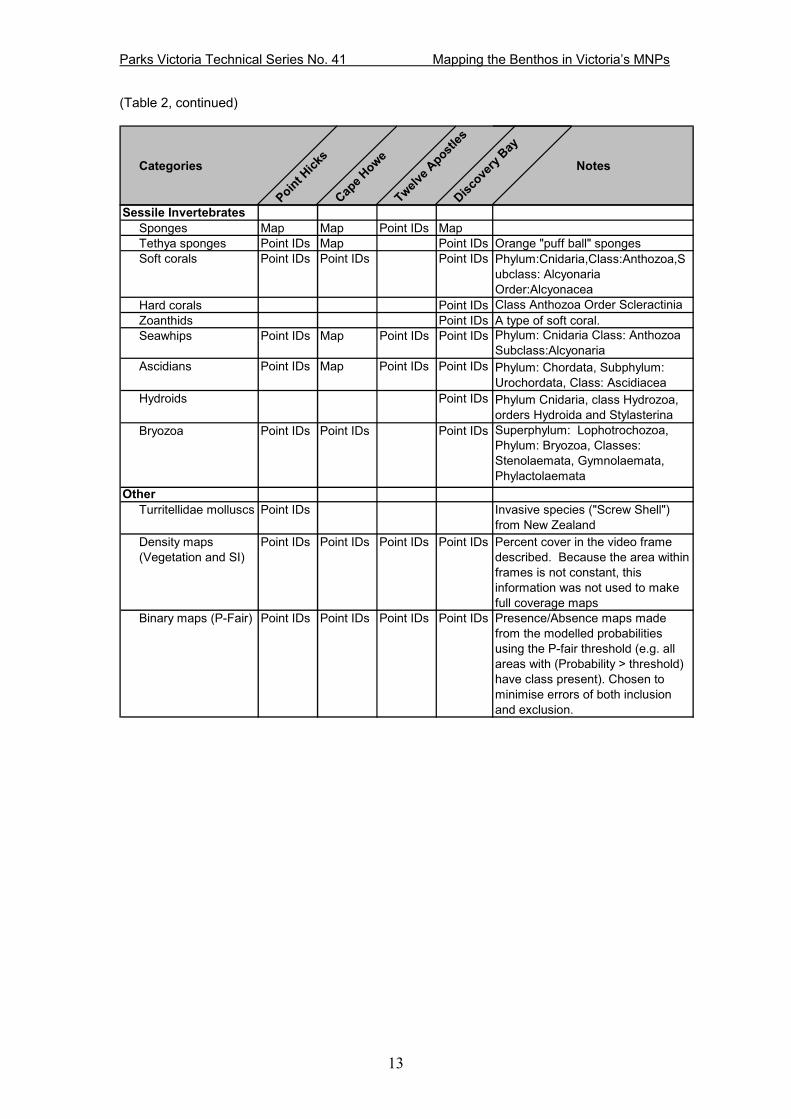
(Table 2, continued)
Categories
Point Hick
s
Cape H
owe
Twelve A
postles
Discove
ry Bay
Notes
Sessile InvertebratesSponges Map Map Point IDs MapTethya sponges Point IDs Map Point IDs Orange "puff ball" spongesSoft corals Point IDs Point IDs Point IDs Phylum:Cnidaria,Class:Anthozoa,S
ubclass: Alcyonaria Order:Alcyonacea
Hard corals Point IDs Class Anthozoa Order ScleractiniaZoanthids Point IDs A type of soft coral. Seawhips Point IDs Map Point IDs Point IDs Phylum: Cnidaria Class: Anthozoa
Subclass:AlcyonariaAscidians Point IDs Map Point IDs Point IDs Phylum: Chordata, Subphylum:
Urochordata, Class: AscidiaceaHydroids Point IDs Phylum Cnidaria, class Hydrozoa,
orders Hydroida and StylasterinaBryozoa Point IDs Point IDs Point IDs Superphylum: Lophotrochozoa,
Phylum: Bryozoa, Classes: Stenolaemata, Gymnolaemata, Phylactolaemata
OtherTurritellidae molluscs Point IDs Invasive species ("Screw Shell")
from New ZealandDensity maps (Vegetation and SI)
Point IDs Point IDs Point IDs Point IDs Percent cover in the video frame described. Because the area within frames is not constant, this information was not used to make full coverage maps
Binary maps (P-Fair) Point IDs Point IDs Point IDs Point IDs Presence/Absence maps made from the modelled probabilities using the P-fair threshold (e.g. all areas with (Probability > threshold) have class present). Chosen to minimise errors of both inclusion and exclusion.

Parks Victoria Technical Series No. 41 Mapping the Benthos in Victoria’s MNPs
14
3 RESULTS POINT HICKS MARINE NATIONAL PARK
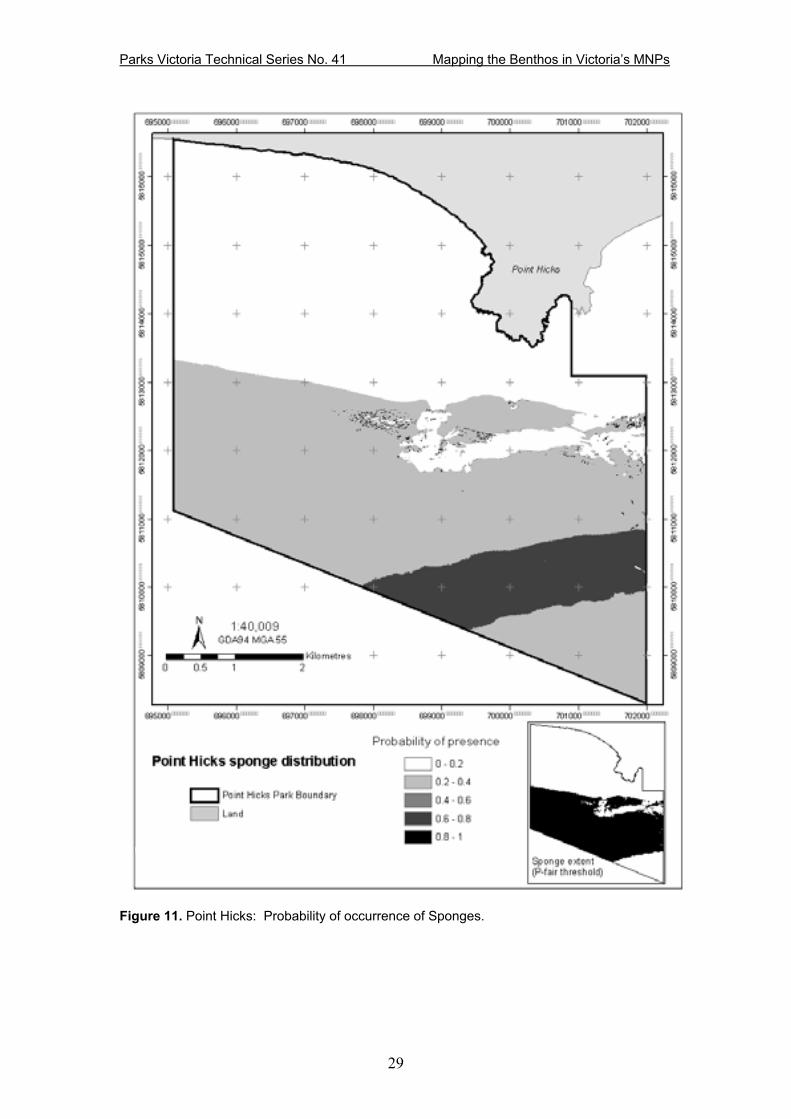
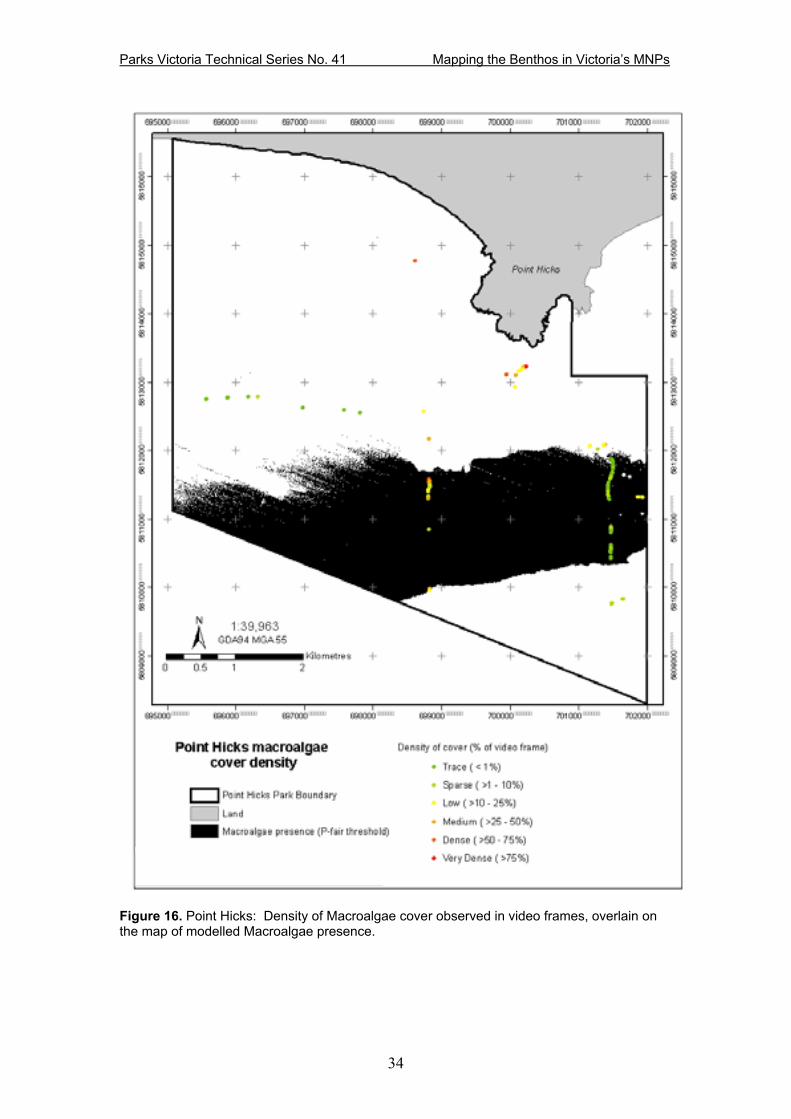
3.1 Maps Maps were constructed for the generalized substrate and biological classes common across all of the Parks (Figure 2; Figure 3). These covered Reef and Sediment, and Macroalgae and Sessile Invertebrates for the biota. A second set of maps were produced that include all classes that were possible to statistically model, resulting in more detailed classification of the seafloor. At Point Hicks, for substrate this includes Reef, Gravel (primarily gravel-sized shell fragments), and Sand (high and low relief categories) (Figure 4). For biota, this includes Macroalgae (undifferentiated), Sessile Invertebrates (undifferentiated), and Sponges, a subset of Sessile Invertebrates (Figure 5). Individual maps for each class illustrate the modelling results of predicted probability of class presence across the full study area (Figures 6 - 11). A number of more detailed and/or rare biological identifications were made during the tow video interpretation, but were too few for statistical modelling. Their occurrences have been mapped as points along the video transects. These include subcategories of macroalgae, namely Kelp (subset of brown algae), Turf, green algae, brown algae, and Ecklonia (subset of Kelp) (Figure 12), Sea Whips, Gorgonians and Soft Corals (undifferentiated) locations (Figure 13), and Ascidians, Bryozoa and Tethya sponge locations (Figure 14). Finally, locations of positive identification of the invasive Turritellidae molluscs (New Zealand screw shell) are noted in Figure 15. The density of biota coverage was described, but could not be included in the general presence/absence modelling and mapping. The distribution of these density observations was plotted overlying the modelled distribution of biota extent for reference (Figure 16 (Macroalgae); Figure 17 (Sessile Invertebrates)).
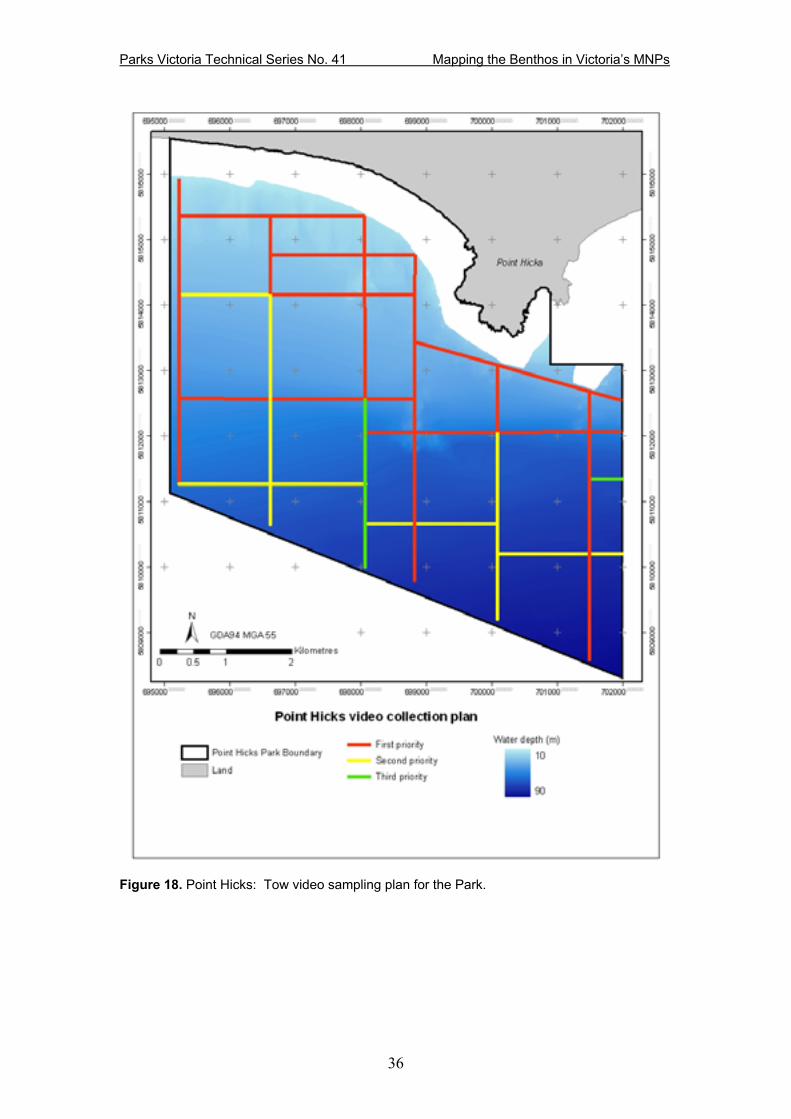
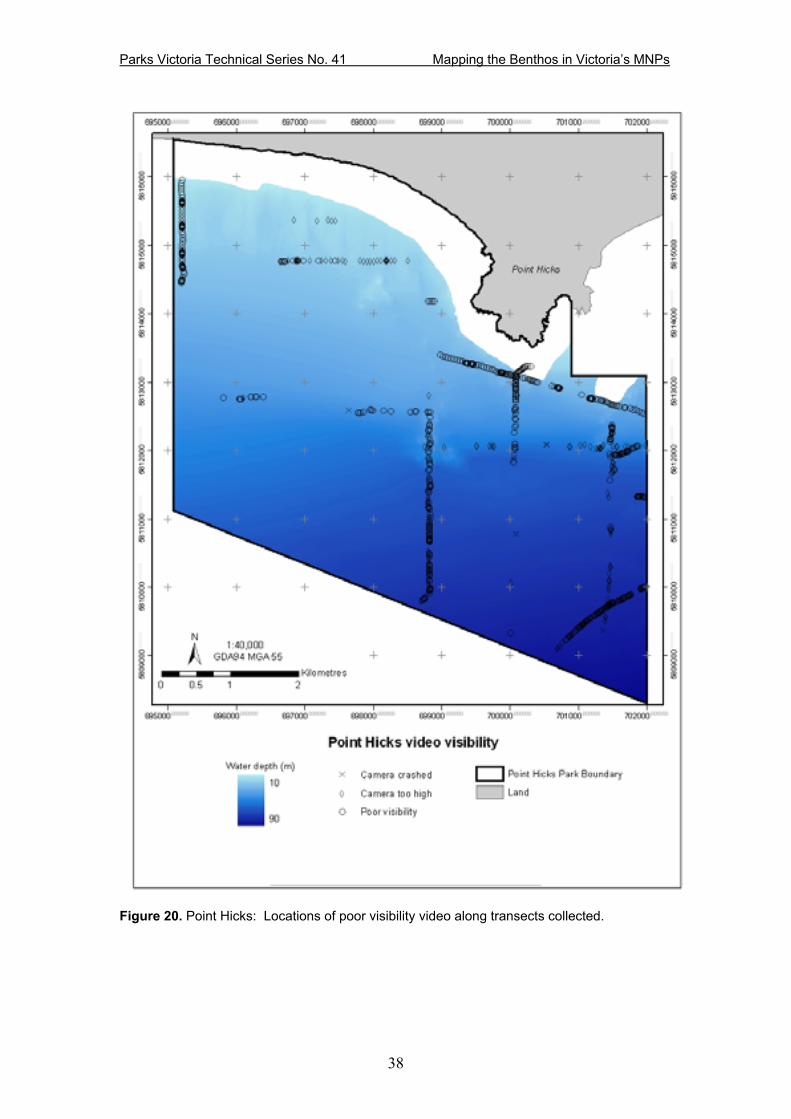
3.2 Tow video observations The video survey design for Point Hicks MNP (Figure 18) originally entailed collecting 56 kilometres of tow video. However due to logistical and weather constraints 28.5 kilometres of video footage were collected (Figure 19). Of the 28.5 kilometres of video footage, approximately 60% (17.1 km) was classified as having highly variable benthic distributions, and the other 40% (11.4 km) as relatively homogeneous. In total 2173 georeferenced video frames were described and recorded. In approximately 34% of these samples, identification of biota and substrate categories was uncertain due to poor visibility (Figure 20; Table 3). In 11% of the frames described, the video camera was too high or in contact with the substrate, and in 23% of the remaining frames, there was poor visibility through the water column. The major substrate categories identified were reef, gravel, and sand. The gravel category refers exclusively to shells, largely shell fragments, and the map units have been adjusted to reflect this. Although some variation in substrate texture and structure was recorded, there were too few samples to model as separate substrate layers (Table 4B). The major biota groups included macroalgae and sessile invertebrates (the dominant biotic group), particularly sponges. As found for the substrate, more detailed biota categories were identified but there were too few to model separately (Table 4B). General observations were made on segments of video prior to the detailed description of individual frames which contain potentially useful information. The following general description of habitats includes both Point Hicks and Cape Howe. Areas with boulders tended to be urchin barrens with many Sea Urchins, no Macro-algae, and few if any sessile invertebrates. Sessile invertebrates if present on boulders tended to be encrusting flat sponges, with some vertical tall sponges. Solid

Parks Victoria Technical Series No. 41 Mapping the Benthos in Victoria’s MNPs
15
reef areas were a mixture of heavily populated reefs and urchin barrens. The area classified as ‘shell’ (gravel) consisted of whole and broken shells covering the ocean floor, often encrusted in pink algae. Shell areas tended to have many small Tethya (orange ball sponges) in amongst the shells. Sometimes vertical sponges were also present, attached to larger shells. The areas classified as sand had three different appearances: flat sand, fine rippled sand (in regular or irregular patterns) and coarse rippled sand (usually in a regular pattern). Often the areas with rippled sand also contained shells in the ripple troughs. These shells were usually covered in pink encrusting algae, possibly indicating the presence of rhodoliths in these areas. Sand areas tended to be bare, although if vegetation was present, it was usually clumps of Caulerpa. Some areas of sand were inhabited by sessile invertebrates; however, as the species of invertebrates observed must attach to a hard substrate, it was assumed that the sand formed a thin veneer over reef. The predominant sessile invertebrate class, sponges, was identified as having three different characteristics: flat (referring to sponges encrusting reef), tall (referring to erect sponges) and Tethya (ball sponges). The different types of algae were predominantly observed on reef areas, with the exception of Caulerpa which was found on sand and shell (gravel) substrate. The comments from both the coarse and the detailed video classifications list GPS time stamps for high quality or interesting bits of video footage, examples of habitats, locations of schools of fish or other sites of interest including hermit crabs, crinoids, comb jellies, urchins, fish, wrack, sea stars, and sting rays.
3.3 Classification tree modelling and spatial extension The final models used for mapping are described in Table 5. The general reliability of the model can be interpreted from the “Correct classification” column, which indicates the percent of observations in the validation dataset classified correctly. The validation datasets consisted of 25% of the total video observations, which were not used in constructing the models. The next two columns give the false positive (negative) rates, meaning the percentage of points where a class was modelled as present (absent) but were actually absent (present). This can be used as a guideline to understand whether the area mapped for a class is likely to be an over- or under-estimate of the actual distribution. The value used as the threshold for mapping class presence/absence from the probability maps is listed in the last column (“Cut-off value”). Rather than using the 0.5 probability, which does not take into account the relative number of presences versus absences (which affects predictability), these numbers were determined to balance the risk of over-predicting a class with under-predicting the class. This probability value is called “P-fair”. Any pixel in the class probability map with a value greater than P-fair is labelled as class present, if the value is equal to or less than P-fair, they are labelled as class absent. These binary maps of class presence/absence are combined to make the final integrated substrate and biota maps. The modelling process, besides providing a quantitative approach for mapping, also supplies some information for ecological interpretation. The importance of each of the environmental descriptor datasets used as independent variables for modelling class presence are listed in Table 6. The percentage listed is the percent of the total variability in the class model (table columns) that was explained by a particular environmental dataset (table rows). The two original datasets produced from the hydroacoustic survey are Depth and Backscatter. The other datasets are all derived from the bathymetry (Depth), and highlight different aspects of seafloor rugosity. The datasets calculated over large windows (e.g. park_hyp50, 125-m radius) generally are important for areas dominated by reef, with strong, well-defined environmental or ecological gradients. Small window datasets (e.g. park_std_5, 12.5-m radius) were

Parks Victoria Technical Series No. 41 Mapping the Benthos in Victoria’s MNPs
16
typically stronger predictors for flat, sediment-dominated areas. In reality, these different datasets are acting as proxies for physical and ecological gradients that have not been measured directly, such as the depth of light penetration and wave or current exposure. Table 3. Point Hicks: summary of video quality by major biota and substrate category
VIDEO OBSERVATION Camera crashed
Camera too high Fine Poor
visibilityTotal
RecordingsNumber of video frames 13 218 1432 510 2173
% of total frames described 1% 10% 66% 23% 100%
Reef 0% 4% 61% 35% 46Reef and sediment 0% 10% 53% 37% 83Sediment 1% 11% 64% 24% 1925Non-visible hard substrate inferred from biota 0% 0% 100% 0% 51
No biota visible 0% 14% 44% 42% 546Vegetation 0% 0% 100% 0% 16Vegetation, Unsure if inverts present 0% 9% 60% 31% 35Vegetation & Invertebrates 0% 0% 72% 28% 69Sessile invertebrates 0% 1% 91% 7% 946Sessile invertebrates, Unsure if veg present 0% 5% 60% 35% 82

Parks Victoria Technical Series No. 41 Mapping the Benthos in Victoria’s MNPs
17
Table 4. Point Hicks: Proportion of video frame descriptions in each fine scale (A) Biota and (B) Substrate category. Proportions are relative to the 2173 video frames described in total.
A. BIOTA
Sessile invertebrates Proportion of samples
Ascidians 0.09%Bryozoans 0.28%Sea Whips 0.18%Sponges 2.12%Sponges, Ascidians 0.18%Sponges, Ascidians, Bryozoans 0.14%Sponges, Ascidians, Sea Whips 0.05%Sponges, Bryozoans 0.51%Sponges, Bryozoans, Sea Whips 0.05%Sponges, Tethya 0.05%Tethya 0.41%Undifferentiated invertebrates 18.04%Undifferentiated inverts, Bryozoans 0.05%Undifferentiated inverts, Sea Whips 0.09%Undifferentiated inverts, Sponges 24.21%Undifferentiated inverts, Sponges, Ascidians 0.28%Undifferentiated inverts, Sponges, Ascidians, Bryozoans 0.28%Undifferentiated inverts, Sponges, Ascidians, Bryozoans, Sea Whips 0.05%Undifferentiated inverts, Sponges, Ascidians, Sea Whips 0.09%Undifferentiated inverts, Sponges, Bryozoans 1.84%Undifferentiated inverts, Sponges, Bryozoans, Sea Whips 0.14%Undifferentiated inverts, Sponges, Sea Whips 0.55%Undifferentiated inverts, Sponges, Soft corals, Gorgonians, Sea Whips 0.05%Undifferentiated inverts, Sponges, Tethya 0.23%Undifferentiated inverts, Tethya 0.55%
Macroalgae Proportion of samples
Kelp(undifferentiated) 0.05%Mixed brown algae, Mixed red algae 0.05%Mixed red algae 0.69%Turf algae 0.05%Undifferentiated Algae 4.05%Undifferentiated Algae, Ecklonia 0.23%Undifferentiated Algae, Kelp (undifferentiated), Ecklonia 0.05%Undifferentiated Algae, Kelp (undifferentiated), Mixed brown algae 0.05%Undifferentiated Algae, Turf algae 0.32%

Parks Victoria Technical Series No. 41 Mapping the Benthos in Victoria’s MNPs
18
B. SUBSTRATE
Sediment Proportion of samples
Can't discern 7.27%Can't discern, Biogenic structures 0.05%Can't discern, Ripples (Coarse) 0.05%Flat 80.12%Flat, Biogenic structures 0.83%Flat, Ripples (Coarse) 0.18%Flat, Ripples (Fine) 0.14%Ripples (Coarse) 1.56%Ripples (Fine) 4.51%Ripples (Fine), Ripples (Coarse) 0.05%
Sediment Texture Proportion of samples
Can't Discern 3.96%Can't Discern, Coarse(Gravel)? 0.32%Can't Discern, Medium(Sand) ? 0.41%Coarse(Gravel) 4.83%Coarse(Gravel), Medium(Sand) 52.37%Medium(Sand) 32.54%N/A 5.25%Very Coarse(Cobble), Coarse(Gravel) 0.18%Very Coarse(Cobble), Medium(Sand) 0.14%
Reef Proportion of samples
Can't Discern 2.35%Can't Discern, Steep 0.09%Flat 0.28%Flat, Gentle 0.41%Flat, Gentle, Steep 0.05%Gentle 0.87%Gentle, Steep 0.64%Gentle, Steep, Vertical (>70) 0.18%Steep 0.74%Steep, Vertical (>70) 0.28%Vertical (>70) 0.05%
Reef Cohesion Proportion of samples
Broken/Fragmented 0.32%Can't discern 5.06%Solid 0.55%

Parks Victoria Technical Series No. 41 Mapping the Benthos in Victoria’s MNPs
19
Table 5. Point Hicks: Substrate and Biota model evaluation using 25% blind validation data removed from the original video survey database
SUBSTRATE
Area Under Curve (AUC)*
p-value for AUC-
critical
Correct Classification
Rate
False Positive Rate (1-specificity)
False Negative Rate (1- sensitivity)
Kappa Cut-off value**
Reef 0.70984 > 0.05 93% 2% 53% 0.51 0.16Gravel (Shell) 0.8423 > 0.05 77% 25% 22% 0.59 0.76Sand 0.70931 > 0.05 70% 34% 30% 0.32 0.88
BIOTAAlgae 0.83913 < 0.01 79% 21% 17% 0.25 0.04Sponge 0.71917 > 0.05 64% 41% 29% 0.27 0.34Sessile Invertebrates 0.79197 < 0.0001 74% 41% 13% 0.47 0.35
** Cut-off value based on P-Fair except Sessile Invertebrates which is based on P-Kappa
* AUC < 0.5 No discrimination, 0.7 < AUC < 0.8 Acceptable, 0.8 < AUC < 0.9 Excellent, AUC > 0.9 Outstanding (Hosmer and Lemeshow 2000)
Table 6. Point Hicks: Contribution of each model variable as a percent of total variance explained by each substrate and biota model
Variable Variable CODE Algae Gravel Reef Sand Sessile Invertebrates Sponge
Aspect ph_asp 0% 0% 33% 0% 0% 0%Backscatter phsnip 35% 4% 0% 0% 0% 0%Curvature ph_curv 2% 0% 0% 0% 0% 0%Depth phdepth 20% 64% 8% 46% 55% 61%Hypsometric index (12.5m radius) ph_hyp5 0% 0% 0% 0% 3% 0%Hypsometric index (25 m radius) ph_hyp10 0% 0% 0% 0% 0% 0%Hypsometric index (62.5 m radius) ph_hyp25 0% 0% 0% 0% 13% 0%Hypsometric index (125 m radius) ph_hyp50 7% 0% 0% 0% 0% 0%Landform Index landform 0% 0% 0% 0% 0% 0%Morans I (12.5 m radius) ph_mor5 0% 0% 0% 0% 0% 0%Morans I (25 m radius) ph_mor10 0% 0% 0% 0% 0% 0%Morans I (62.5 m radius) ph_mor25 0% 0% 0% 0% 0% 0%Morans I (125 m radius) ph_mor50 0% 0% 0% 0% 0% 0%Plan Curvature ph_plan 0% 0% 0% 0% 0% 0%Profile Curvature ph_prof 2% 0% 0% 0% 0% 0%Range (12.5 m radius) ph_rng5 0% 0% 0% 47% 0% 0%Range (25 m radius) ph_rng10 0% 0% 53% 0% 18% 0%Range (62.5 m radius) ph_rng25 0% 0% 0% 0% 4% 0%Range (125 m radius) ph_rng50 8% 6% 0% 0% 0% 0%Rugosity ph_surf_area 0% 0% 0% 0% 0% 0%Rugosity Ratio ph_surf_ratio 0% 0% 0% 0% 0% 0%Slope ph_slp 0% 0% 0% 0% 0% 0%Standard Deviation (12.5 m radius) ph_std5 0% 0% 0% 0% 0% 12%Standard Deviation (25 m radius) ph_std10 0% 0% 3% 0% 3% 26%Standard Deviation (62.5 m radius) ph_std25 2% 0% 0% 0% 0% 0%Standard Deviation (125 m radius) ph_std50 0% 6% 4% 0% 4% 0% Topographic position index (37.5 m inner, 75 m outer radius) tpi15r30 6% 0% 0% 7% 0% 0%
Topographic position index (62.5 m inner, 125 m outer radius) tpi25r50 18% 20% 0% 0% 0% 0%

Parks Victoria Technical Series No. 41 Mapping the Benthos in Victoria’s MNPs
20
Figure 2. Point Hicks: General substrate map for inter-Park comparison with integrated pure and mixed substrate classes.

Parks Victoria Technical Series No. 41 Mapping the Benthos in Victoria’s MNPs
21
Figure 3. Point Hicks: General biota map for inter-Park comparison with integrated pure and mixed classes of benthic sessile biota.

Parks Victoria Technical Series No. 41 Mapping the Benthos in Victoria’s MNPs
22
Figure 4. Point Hicks: Substrate map with all classes successfully modelled across the Park. Note that Shell and Sand, subcategories of Sediments, have been mapped separately.

Parks Victoria Technical Series No. 41 Mapping the Benthos in Victoria’s MNPs
23
Figure 5. Point Hicks: Sessile biota map with all classes successfully modelled across the Park. Note that Sponges, a subcategory of Sessile Invertebrates, has been mapped separately.

Parks Victoria Technical Series No. 41 Mapping the Benthos in Victoria’s MNPs
24
Figure 6. Point Hicks: Probability of occurrence of Reef substrate.
Parks Victoria Technical Series No. 41 Mapping the Benthos in Victoria’s MNPs
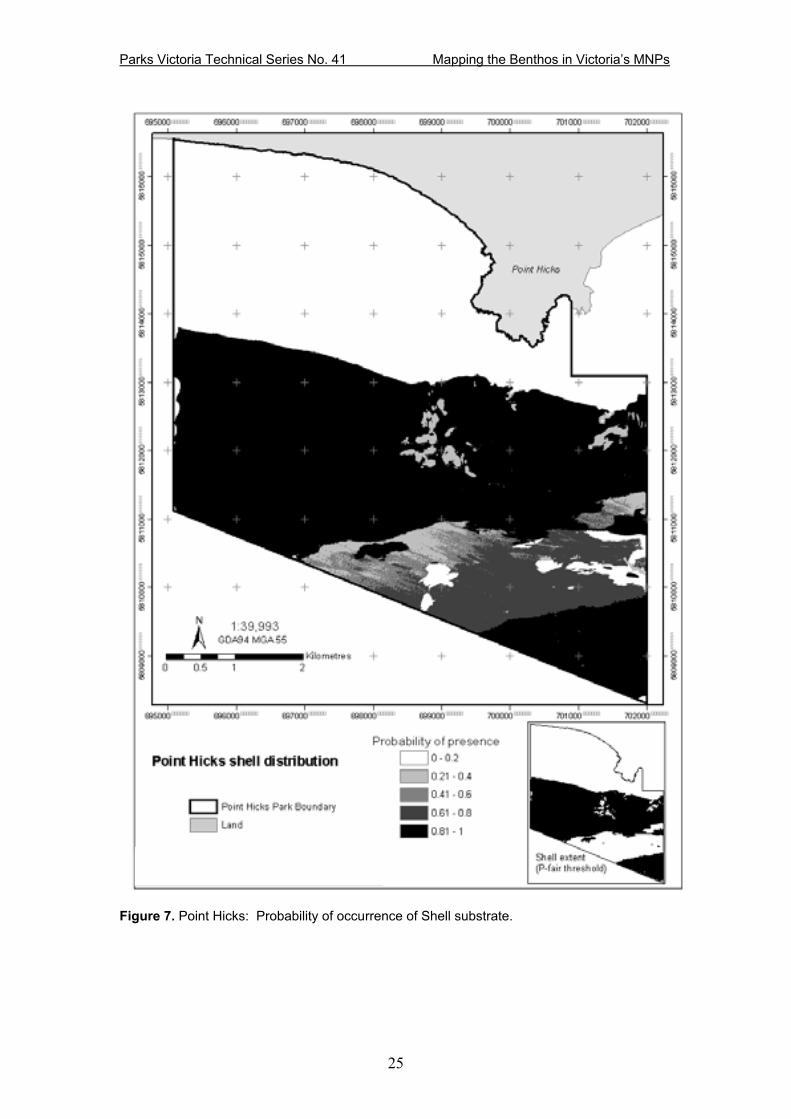
25
Figure 7. Point Hicks: Probability of occurrence of Shell substrate.
Parks Victoria Technical Series No. 41 Mapping the Benthos in Victoria’s MNPs
26
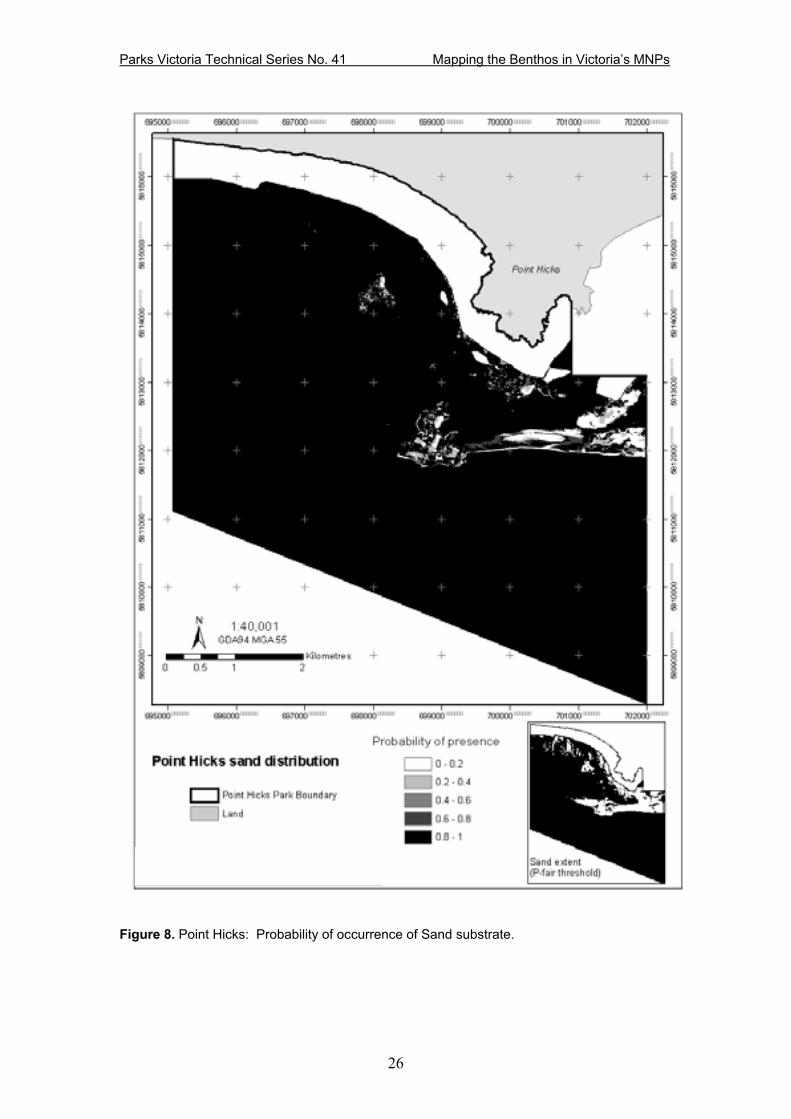
Figure 8. Point Hicks: Probability of occurrence of Sand substrate.

Parks Victoria Technical Series No. 41 Mapping the Benthos in Victoria’s MNPs
27
Figure 9. Point Hicks: Probability of occurrence of Macroalgae.

Parks Victoria Technical Series No. 41 Mapping the Benthos in Victoria’s MNPs
28
Figure 10. Point Hicks: Probability of occurrence of Sessile Invertebrates identifiable from video.
Parks Victoria Technical Series No. 41 Mapping the Benthos in Victoria’s MNPs
29
Figure 11. Point Hicks: Probability of occurrence of Sponges.

Parks Victoria Technical Series No. 41 Mapping the Benthos in Victoria’s MNPs
30
Figure 12. Point Hicks: Locations of detailed macroalgae identifications overlain on the bathymetry.

Parks Victoria Technical Series No. 41 Mapping the Benthos in Victoria’s MNPs
31
Figure 13. Point Hicks: Locations of Sea Whips, Gorgonians, and undifferentiated Soft Corals identified in tow video frames, overlain on the bathymetry.

Parks Victoria Technical Series No. 41 Mapping the Benthos in Victoria’s MNPs
32
Figure 14. Point Hicks: Locations of Bryozoa, Ascidians, and the sponge Tethya identified in the tow video footage, overlain on the bathymetry.

Parks Victoria Technical Series No. 41 Mapping the Benthos in Victoria’s MNPs
33
Figure 15. Point Hicks: Locations of Turritellidae molluscs identified in the tow video footage, overlain on the bathymetry.
Parks Victoria Technical Series No. 41 Mapping the Benthos in Victoria’s MNPs
34
Figure 16. Point Hicks: Density of Macroalgae cover observed in video frames, overlain on the map of modelled Macroalgae presence.

Parks Victoria Technical Series No. 41 Mapping the Benthos in Victoria’s MNPs
35
Figure 17. Point Hicks: Density of Sessile Invertebrate cover observed in video frames, overlain on the map of modelled Sessile Invertebrate presence.
Parks Victoria Technical Series No. 41 Mapping the Benthos in Victoria’s MNPs
36
Figure 18. Point Hicks: Tow video sampling plan for the Park.

Parks Victoria Technical Series No. 41 Mapping the Benthos in Victoria’s MNPs
37
Figure 19. Point Hicks: Final layout of tow video footage collected.
Parks Victoria Technical Series No. 41 Mapping the Benthos in Victoria’s MNPs
38
Figure 20. Point Hicks: Locations of poor visibility video along transects collected.
Parks Victoria Technical Series No. 41 Mapping the Benthos in Victoria’s MNPs
39
4 DISCUSSION AND RECOMMENDATIONS The Park management goals of assessing ecosystem health, monitoring natural and human-induced ecosystem changes through time, and coordinating research and recreation activities require a clear understanding of the potential for an area to contain particular kinds of marine habitat, estimates of what types of organisms are currently found in the region, their abundance, and their distribution. The joint venture between Parks Victoria and the Coastal CRC has led to a series of marine benthic maps and models that provide the first comprehensive, landscape-scale information available for Victoria’s MNPs, and insights into drivers of benthos ecology. The majority of the substrate at Point Hick MNP is sediment (33 sq. km); reef outcrops in nearshore shallower water (< 55 m) (1 km sq), and typically has a transition zone of mixed reef and sediment grading into all sediment. The sediment is composed primarily of sand and biogenic gravel, largely shell fragments, which occasionally covers extensive areas. Sessile invertebrates are common from approximately 30-m depth, and macroalgae is modelled as present over an extensive band at moderate water depths.
4.1 MAP APPLICATIONS AND INTERPRETATION The marine bentic mapping approach developed for the Parks Victoria/Coastal CRC joint venture uses statistical modelling and spatial prediction to provide a more objective, quantitative alternative to traditional manually delineated marine habitat maps. Individual benthic class models have proven effective for extending information derived from towed-video footage over broader areas based on correlations with derivatives of the bathymetry. Video observations: The database of tow video observations assembled for modelling also supplies a useful tally of the video footage content for use in other projects. For example, it provides an index of georeferenced site descriptions, detailed information on classes not included in the maps and other information such as good video footage. It will be useful for planning monitoring and sample collection, if a particular benthos or substrate is required. Models: Classification and regression tree (CART) models supply a robust and readily interpretable framework for assessing the relative importance of environmental drivers over broad spatial scales. In addition, the individual class model accuracy information (AUC, misclassification rate, etc.) assists in understanding which maps are contributing the most error, and can help guide how the maps are combined for multi-class mapping. Knowledge gained from the modelling process can be used, in combination with sound biological and ecological information, to better understand the causes and predictability of landscape scale distribution patterns. Presence/Absence maps: The maps of class presence and absence can be used for targeting specific classes in the field for monitoring and/or assessment (eg. find all locations where macroalgae is present on reefs), or for locating class overlap by combining multiple maps. Probability maps: Maps of probability of class presence are useful for targeting future surveys, especially when individual classes are being considered. Additionally, areas with probability values close to the cutoff for presence/absence may be targeted in future surveys to improve presence/absence predictions. In the final maps, areas which were not predicted as present by any of the individual class models were left as undetermined.
Parks Victoria Technical Series No. 41 Mapping the Benthos in Victoria’s MNPs
40
It is not recommended that users combine probability maps for GIS-style numeric or standardised binary overlay. Probability values produced by different models cannot be interpreted in the same way. For example, in models for reef and algae, a probability of 0.35 could mean likely presence for reef and likely absence for algae. The binary presence/absence maps always should be used for this purpose. The field sites in this study cross five bioregions. Given this, different biota will be responding to different ecological drivers and show varying degrees of predictability across the MNPs. It is important to remember that bathymetry-derived datasets are indirect drivers; they are not true physical drivers (e.g. light attenuation) which are known to influence the distribution of biota. Thus, they are not necessarily directly comparable for ecological interpretation across broad areas. While some of the biotic classes mapped at higher taxonomic or hierarchical levels are the same at all MNPs (e.g. Kelp), it is likely that many of the species comprising those classes differ from site to site. This can also contribute to the determination of different dominant drivers through the modelling process.
4.2 OUTCOME ISSUES AND SUGGESTIONS This project has supplied the first full coverage maps of the substrate and benthic sessile biota across several marine bioregions in Victoria; however, as with all research there remains room for improvement and there are several issues to keep in mind while working with the final maps. The accuracy of the final maps in how well they represent the present day benthos is directly linked to the spatial layout and subsampling of the video footage. At Point Hicks, Twelve Apostles, and Discovery Bay, the video footage collected did not cover all features noted in the bathymetry, nor did it adequately characterise areas parallel and perpendicular to expected ecological gradients. This means the majority of the benthos data used for modelling were not necessarily representative for the entire field area, leading to weaker models and potentially higher map error, particularly in areas with few observations. There are several general issues in using video transects for statistical modelling that influence model and map accuracy. One is that the changing quality of the video along transect leads to inconsistent observations of detailed characteristics (e.g. presence of filter feeders – only identifiable when the camera is very close to the seafloor), which leads to false absences being used in the modelling process. The point location maps provide information about where these features are most likely to be found based on the data available, but the maps generally underestimate the true extent of distributions. The ratio of the number of presences to absences for a single class has a significant impact on model development and ultimately on map accuracy. For important but less abundant classes (e.g. invasive species), gathering additional data with tow video or other collection methods may improve the models. Using validation data from the same video transects used for modelling means the data are not wholly independent. This can inflate the correct classification rates for the models, giving an unrealistic impression of high mapping accuracy. In future work this can be addressed by collecting a second, independent dataset for validation. Other issues related to using transect-based sampling, such as orthogonal tow lines and excessive spatial autocorrelation, may also impact models and their outputs, and require further investigation. The accuracies reported refer to overall model accuracy. It should be noted that spatial variability in the model fit may lead to extreme map errors in some areas. As is common in large collaborative efforts, different types of equipment and field teams were used to collect the field data that supports the study. In this case, the video footage for Discovery Bay and Twelve Apostles were collected by Deakin University using different equipment. The angle of the camera and width of the lens

Parks Victoria Technical Series No. 41 Mapping the Benthos in Victoria’s MNPs
41
resulted in a much wider field of view, which limited the ability to see detail and small organisms in the same way as was done at Point Addis, Cape Howe, and Point Hicks. While the presence/absence and combined maps provided the essential full coverage information on general benthos features, other types of information would also be useful for management, such as density of benthic vegetation and organisms. Unfortunately, the changing size of the field of view in the towed video surveys meant that each video frame shows a different (unmeasured) area, and prevents meaningful comparisons of density. Further investigation is needed before recommendations can be made for improving this aspect of the survey. The backscatter data was found to be a strong predictor for some variables, particularly macroalgae, but the processed imagery contained a number of artefacts or errors in the data detectable as unrealistic linear features. When the dataset was used to spatially extend the model over the full study area, these artefacts are transferred to the final maps, as can be seen in Figure 3 for the mixed macroalgae and sessile invertebrate class, particularly on the northwestern portion of the unit. This type of striping can be seen in most of the other maps as well.
5 CONCLUSION The marine benthos maps and models provide extensive information on basic seafloor physical properties and biology across Cape Howe, Point Hicks, Point Addis, Twelve Apostles, and Discovery Bay MNPs. Basic maps of substrate composition (reef, sediment) and biota (vegetation, sessile invertebrates) presence and extent were produced to allow for regional comparisons. For each MNP, all identified benthos classes with sufficient numbers of observations for statistical modelling were mapped, showing the extent and patterns of distribution for subclasses of sediment texture and relief, reef structures, vegetation types, and different classes of sessile invertebrates. The layout of video transects, complexity of the benthos, and clarity of the imagery influenced the accuracy and completeness of the video observations. The models and maps reflect only what could be discerned from the video footage; in areas where turbidity, distance from the bottom, or camera angle reduced visibility, the recorded observations are likely not wholly accurate, but as the only available information, were used for modelling and mapping. The Cape Howe models and maps are the most robust. This is directly related to the total kilometres of video data collected as specified in the video sampling design. Across all of the MNPs, the models were strong for Macroalgae (undifferentiated), with higher prediction accuracy than the majority of the other categories. This is likely due to the strong process link between algae, depth (i.e. light attenuation), and topographic features, which were the majority of the predictor (independent) datasets available for modelling.

Parks Victoria Technical Series No. 41 Mapping the Benthos in Victoria’s MNPs
42
ACKNOWLEDGEMENTS
Logistics assistance: Dale Appleton (PV)
Video interpretation: Linda Heap, Ben Piek, Janet Oswald (UWA)
Equipment design and field work: Andy Bickers (UWA)
Additional video collection: Dan Ierodiaconou and others (Deakin University)
Discussions on video classification and mapping: David Ball (MAFRI)
Hydroacoustic data collection and processing: Fugro Pty. Ltd., Perth, WA
Metadata and reporting assistance: Henry Bache (UWA)
Parks Victoria – Coastal CRC joint venture (UWA, Fugro Pty Ltd, Parks Victoria), with
special thanks to Des Lord for overseeing the collaboration.

Parks Victoria Technical Series No. 41 Mapping the Benthos in Victoria’s MNPs
43
REFERENCES
Breiman L, Friedman JH, Olshen RA, Stone CG (1984) Classification and
Regression Trees, Vol. Wadsworth International Group, Belmont, California, USA
Cochrane GR, Lafferty KD (2002) Use of acoustic classification of sidescan sonar
data for mapping benthic habitat in the Northern Channel Islands, California. Continental Shelf Research 22:683-690
De'ath G, Fabricius KE (2000) Classification and regression trees: A powerful yet
simple technique for ecological data analysis. Ecology 81:3178 Hosmer DW, Lemeshow S (2000) Applied logistic regression, Vol. Wiley, New York Jenness, J (2002) Surface Areas and Ratios from Elevation Grid (surfgrds.avx)
Extension for ArcView 3.x v. 1.2. Jenness Enterprises. Available at http://www.jennessent.com/arcfiew/surface_areas.htm.
Laffan, S (2003) Conversion of Splus/R decision tree into ArcInfo grid format. Arc
Macro Language
Liu C, Berry PM, Dawson TP, Pearson RG (2005) Selecting thresholds of occurrence in the prediction of species distributions. Ecography 28:385-393
Shokr ME (1991) Evaluation of second-order texture parameters for sea ice
classification from radar images. Journal of Geophysical Research 96:10625-10640
Schröder B, Richter O (1999) Are habitat models transferable in space and time? Z.
Okologie u Naturschutz 8:195-205

p a r k s v i c t o r i a t e c h n i c a l s e r i e s
number 41
mapping the benthos in victoria’s marine national parks
volume 2: point hicks marine national park
K.W. Holmes, B. Radford, K.P. Van Niel,
G.A. Kendrick and S.L. Grove
October 2007
Parks Victoria is responsible for managing the Victorian protected
area network, which ranges from wilderness areas to metropolitan
parks and includes both marine and terrestrial components.
Our role is to protect the natural and cultural values of the parks
and other assets we manage, while providing a great range of
outdoor opportunities for all Victorians and visitors.
A broad range of environmental research and monitoring activities
supported by Parks Victoria provides information to enhance park
management decisions. This Technical Series highlights some of
the environmental research and monitoring activities done within
Victoria’s protected area network.
Healthy Parks Healthy People
For more information contact the Parks Victoria Information Centre
on 13 1963, or visit www.parkweb.vic.gov.au
par
ks v
icto
ria
tech
nic
al ser
ies • nu
mb
er 41 m
ap
pin
g th
e b
en
tho
s in v
ictoria
’s ma
rine
na
tion
al p
ark
s • vo
lum
e 2
: po
int h
icks m
arin
e n
atio
na
l pa
rk


