Mapping Subnational Boundaries: the GRID3 Approach
27
Mapping Subnational Boundaries: the GRID3 Approach Linda Pistolesi, Marc Levy, Olena Borkovska, Emilie Schnarr, & Kevin Tschirhart Center for International Earth Science Information Network (CIESIN)
Transcript of Mapping Subnational Boundaries: the GRID3 Approach

Mapping Subnational Boundaries: the GRID3 Approach
Linda Pistolesi, Marc Levy, Olena Borkovska, Emilie Schnarr, & Kevin Tschirhart
Center for International Earth Science Information Network (CIESIN)

Geo-Referenced Infrastructure and Demographic Data for Development (GRID3): A global partnership
Oversight and Decision Making
Technical Expertise and Capacity Strengthening
Technical Support and Advocacy
Coordinating PartnerImplementing PartnersFunding Partners

Subnational
boundaries
High-resolution
population
estimates
Housing census &
hybrid census
support
Comprehensive
settlement
locations
Locating critical
infrastructure
Strengthening
capacity
Our Vision:
Mapping a path to
sustainable
development for
everyone.
Our mission:
To build spatial data
solutions that make
development goals
achievable.

Functional Areas
• One of 14 global fundamental geospatial
data themes adopted by the United
Nations Committee of Experts on Global
Geospatial Information Management
(UN-GGIM)
• Designed to facilitate the measurement,
monitoring, and management of
sustainable development in a consistent
way over time to facilitate evidence-
based decision- and policy-making.
http://ggim.un.org/meetings/GGIM-committee/9thSession/documents/Fundamental_Data_Publication.pdf

Functional Areas
• One of 14 global fundamental geospatial
data themes adopted by the United
Nations Committee of Experts on Global
Geospatial Information Management
(UN-GGIM)
• Designed to facilitate the measurement,
monitoring, and management of
sustainable development in a consistent
way over time to facilitate evidence-
based decision- and policy-making.
“It’s also the key to informing stakeholders on the status of international, national, and sub-national
policy objectives and programmegoals/deliverables.”
http://ggim.un.org/meetings/GGIM-committee/9thSession/documents/Fundamental_Data_Publication.pdf

Functional Areas
• One of 14 global fundamental geospatial
data themes adopted by the United
Nations Committee of Experts on Global
Geospatial Information Management
(UN-GGIM)
• Designed to facilitate the measurement,
monitoring, and management of
sustainable development in a consistent
way over time to facilitate evidence-
based decision- and policy-making.
“Linking data to administrative and functional geographies provides the spatial component that
further enables data integration and broader comparability.”
http://ggim.un.org/meetings/GGIM-committee/9thSession/documents/Fundamental_Data_Publication.pdf

GRID3 Approach to Subnational Boundaries
Two strategies comprise the current GRID3 approach to improving subnational boundaries.
1. Facilitating the opening up of the boundary-generation process to local managers and officials for whom the boundaries constitute a central part of their operational responsibilities.
2. Facilitating coordinated, integrated participation in the boundary-generation process across government institutions that have formal authority for managing boundaries.

Vaccination Tracking System
(VTS)
Compiled and maintained by eHealth Nigeria
POIs
Settlements
Ward Boundaries
INPUT
Created by Novel-t and maintaind by eHealth
Operational Database
Strategy 1, Nigeria Case Study:Data for Vaccination Campaign Planning

Strategy 1, Nigeria Case Study:Data for Vaccination Campaign Planning
• Wards are the smallest administrative units in Nigeria
• They aggregate to local government areas (LGAs) and then to states.
• Currently, no open-source or government-accepted ward boundary data set exists
• GRID3 Nigeria goal: produce a quality data set of ward boundaries that can be officially accepted and used by the Nigerian government.
9002 Wards
744 Local
Government
Areas (LGAs)
36 States

GRID3 Nigeria Ward Boundary Validation
CIESIN evaluated the eHealth Nigeria ward boundaries using a set of data integrity checks.
• Unique operational ward ids
• Valid geometries and topology
• Alphanumeric ward codes (i.e. XYZ123)
• Multipart polygons
• Ward boundaries extending past the Nigeria country boundary

Image 1 Image 2 Image 3
POI Spatial Anomaly (left) and Validation in Built Up Areas (BUAs, right)
Each point of interest and settlement feature should be located within the spatial limits of the ward and LGA specified in the point attribute table.
The highlighted line segment is following the road→ No Error
Boundaries should follow a natural or man made
feature (e.g. road, rails, rivers, etc)
The highlighted line segment crosses over multiple buildings→ ErrorErrors reports for all checks were sent back to
eHealth to address, and then boundaries re-checked.

Ward Boundary Outcomes
• As of April 1, 2019, the boundaries are complete, free of topology errors, and consistently named across administrative levels and points of interest.
• The GRID3 Nigeria geodatabase will be hosted by the National Space Research and Development Agency (NASRDA) which has the mandate for managing the NSDI
• As such they have a “government stamp”, but do not have official status until reviewed and approved by the mandated agencies.
• The entire process was accomplished in the open, under the auspices of a multi-agency steering committee, and the boundaries are already in use.
GRID3 Nigeria

• Health service delivery is organized at the Health Area (HA) level.
• 20-30 HAs aggregate to Health Zones (HZs) and then to Provinces.
• GRID3 DRC goal: produce a quality data set of health area and health zone boundaries that can be officially accepted and used by the DRC ministry of health.
Health Areas
Health Zones
Provinces
Strategy 1, DRC Case Study:A participatory mapping approach in Haut-Lomami and Tanganyika Provinces

Geopode portal
3-day mapping event
Provincial coordinators work to address issues
CIESIN compiles available health
facility & settlement point data
Mappers & Local Health Workers
• validate compiled data• delineate health area boundaries
settlements & health facilities
CIESIN QAQC of data
received
settlements, health facilities & boundaries
Health workers collect additional settlement and
POI data
settlementsboundaries
settlements, health facilities, & POIs
7-10 days field work
settlementsboundaries
Additional QAQC by CIESIN and field
teams to finalize data sets
Data deliveredActivity
settlements, health facilities
& POIsField data
Strategy 1, DRC Case Study:A participatory mapping approach in Haut-Lomami and Tanganyika Provinces
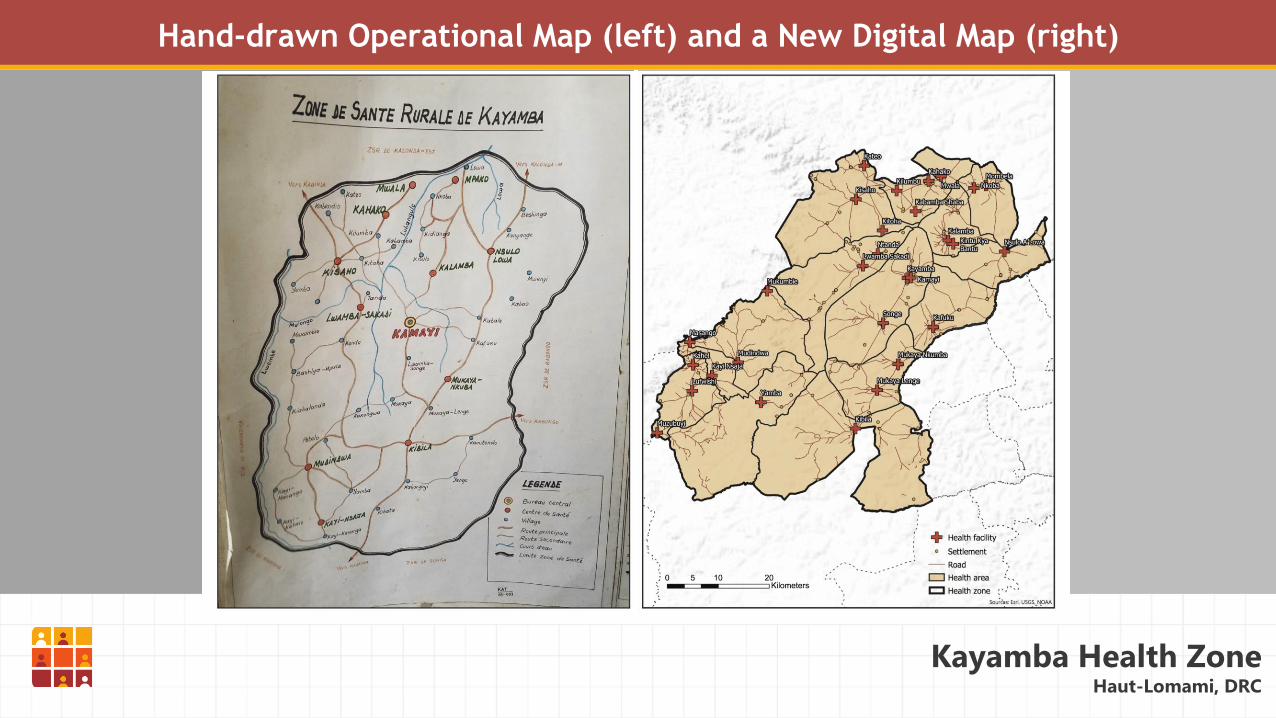
Kayamba Health ZoneHaut-Lomami, DRC
Image 1 Image 2
Hand-drawn Operational Map (left) and a New Digital Map (right)

Delineation of Kitenge Health Areas(Haut-Lomami Province, DRC)
Image 1 Image 2 Image 3
Compilation of Existing Data
& Field CollectionsDelineation of Health AreasBaseline data from OpenStreetMaps
Named settlement locations collected
during the April 2019 VTS polio vaccination
campaign. Points are symbolized by color
according to health area.

Image 1 Image 2
Haut-Lomami Health Zones, Before and After Field work

National
Provinces
Districts
Constituencies
Wards
Administrative
BoundariesResponsible Agency
Census Enumeration
Areas
Office of Surveyor General (OSG)
Ministry of Local Government & Housing
(MLGH)
Electoral Commission of Zambia (ECZ)
Central Statistical Office (CSO)
Strategy 2, Zambia Case Study:Inter-agency boundary harmonization

Gaps Overlaps
Administrative Boundary Misalignments
District
boundary
Ward
boundary
Area of
Overlap

Boundary Harmonization Plan
● Following the GRID3 mission to Lusaka November 2018, CIESIN worked with OSG, CSO, & ECZ to develop a work plan.
● GRID3 National Coordinator met with NSDI Project Manager, ECZ GIS technicians, the Head of Census Mapping, and Surveyor General finalize the work plan
● Focus on harmonizing districts, based on district narratives, and any wards that share a boundary with a district
Conducted by CIESIN with a custom tool built in ArcGIS model builder.
Identify misalignments between districts, and between districts and wards sharing a boundary
Eliminate gaps and overlapsless than 500 meters square in order to reduce the number of manual edits to complete during the workshops.
Coordination & Work Plan Development
Boundary Analysis Workshop Goals
● Bring together members from all responsible agencies
● Reconcile district boundaries to official narratives and align to topographic features
● Reconcile ward boundaries shared with district boundaries

Boundary Harmonization Workshop 1
Participants
OSG, MLGH, ECZ, CSO and UNZA
One government representative
read aloud the narrative for a
district and its neighboring
districts, while a GIS specialist
panned around the map to
follow the narrative description
Ward boundaries were matched
to the districts by referring to
natural features, roads, farm
plots, and beacons from the
narratives
Red areas represent areas of misalignment

A gap or overlap polygon from the editable
layer was either merged to the correct
district or retraced
Edits were documented in the point layer
as either 1) change made to ward
boundary, 2) change made to district
boundary, or 3) retracing of the boundary.
Boundary Harmonization Workshop 1

Before Boundary Harmonization After Boundary Harmonization
Boundary Harmonization Worksop 1

Workshop participants split into five groups of three
people
One person in the trio was responsible for reading the
district narratives and referencing the topographic
map and imagery, the second person performed the
edits, and the third member recorded the edits in the
point layer
Workshop: Editing Session II Boundary Harmonization Workshop 2
Participants
OSG, MLGH, ECZ, CSO and UNZA

Outcomes from the Workshops
All 116 district boundaries were
aligned
Wards sharing a boundary with a
district were aligned
Consensus reached on code
assignments to the provinces and
districts (OSG with input from ECZ
and CSO)
Errors in the narratives were identified
for correction

For more information, contact us: [email protected]
Or follow our partners on Twitter at @Flowminder, @WorldPopProject, @PopDevUNFPA, and @CIESIN
For project updates and announcements, visit us online at:
@GRID3Global www.grid3.org