Mapping phreatophytes on the Eyre Peninsula phreatophytes on the Eyre Peninsula Melissa White, Megan...
52
Mapping phreatophytes on the Eyre Peninsula DEWNR Technical report 2014/04
Transcript of Mapping phreatophytes on the Eyre Peninsula phreatophytes on the Eyre Peninsula Melissa White, Megan...
Mapping phreatophytes on the Eyre Peninsula
DEWNR Technical report 2014/04
Mapping phreatophytes on the Eyre Peninsula
Melissa White, Megan Hancock, Judy Tan and David Deane
Department of Environment, Water and Natural Resources
February 2014
DEWNR Technical Report 2014/03
DEWNR Technical Report 2014/03 i
Department of Environment, Water and Natural Resources
GPO Box 1047, Adelaide SA 5001
Telephone National (08) 8463 6946
International +61 8 8463 6946
Fax National (08) 8463 6999
International +61 8 8463 6999
Website www.environment.sa.gov.au
Disclaimer
The Department of Environment, Water and Natural Resources and its employees do not warrant or make any representation
regarding the use, or results of the use, of the information contained herein as regards to its correctness, accuracy, reliability,
currency or otherwise. The Department of Environment, Water and Natural Resources and its employees expressly disclaims all
liability or responsibility to any person using the information or advice. Information contained in this document is correct at the
time of writing.
© Crown in right of the State of South Australia, through the Department of Environment, Water and Natural Resources 2014
This work is Copyright. Apart from any use permitted under the Copyright Act 1968 (Cwlth), no part may be reproduced by any
process without prior written permission obtained from the Department of Environment, Water and Natural Resources.
Requests and enquiries concerning reproduction and rights should be directed to the Chief Executive, Department of
Environment, Water and Natural Resources, GPO Box 1047, Adelaide SA 5001.
ISBN 978-1-922174-54-3
Preferred way to cite this publication
White M, Hancock M, Tan J and Deanne D, 2014, Mapping phreatophytes on the Eyre Peninsula, DEWNR Technical Report
2014/03, Government of South Australia, through Department of Environment, Water and Natural Resources, Adelaide
Download this document at: http://www.waterconnect.sa.gov.au

DEWNR Technical Report 2014/03 ii
Foreword
The Department of Environment, Water and Natural Resources (DEWNR) is responsible for the management of the State’s
natural resources, ranging from policy leadership to on-ground delivery in consultation with government, industry and
communities.
High-quality science and effective monitoring provides the foundation for the successful management of our environment and
natural resources. This is achieved through undertaking appropriate research, investigations, assessments, monitoring and
evaluation.
DEWNR’s strong partnerships with educational and research institutions, industries, government agencies, Natural Resources
Management Boards and the community ensures that there is continual capacity building across the sector, and that the best
skills and expertise are used to inform decision making.
Allan Holmes
CHIEF EXECUTIVE
DEPARTMENT OF ENVIRONMENT, WATER AND NATURAL RESOURCES
DEWNR Technical Report 2014/03 iii
Acknowledgements
The Eyre Peninsula Natural Resources Management Board for funding this piece of work.
Natural Resources Eyre Peninsula regional staff:
Rob Covevntry from Elliston who provided wetland data from the district and valuable field knowledge
Luke Nettle from Wudinna for local information
Pat Walsh and Leigh Amey from Streaky Bay for valuable local knowledge of park access, heritage and groundwater well
knowledge
Greg Kerr for providing a review of the report
Vic Semeniuk (V & C Semeniuk Research Group) and Dr Margaret Brock (University of Tasmania) for their valuable knowledge
of Eyre Peninsula wetlands and the detailed conversation of the region and geological processes
Department of Environment, Water and Natural Resources staff:
James Cameron, David Hart and David Tonkin for their invaluable knowledge and assistance for helping with the
methodology to undertake the remote sensing component
Jason Nicol, Steve Barnett and Phil Pisanu for their comments in reviewing the report
Jason VanLaarhoven, Volmer Berens, Darren Oemcke, Tom Carrangis, Nicola Connor and Sarah Bennets for providing project
management and support.
DEWNR Technical Report 2014/03 iv
Contents
Foreword ii
Acknowledgements iii
Context statement 1
Summary 2
1 Mapping phreatophytes 3
1.1 Introduction 3
1.1 Study location 8
1.2 Methodology 12
1.3 Results and discussion 19
1.4 Conclusion and recommendations 25
2 Case study: The interaction of water table dynamics and vegetation zonation at
Lake Hamp 27
2.1 Summary 27
2.2 Introduction 27
2.3 Methodology 27
2.4 Results 28
3.1 Discussion 32
4 Appendix 34
A. Hydrogeological desktop study results 34
5 Units of measurement 39
1.1 Units of measurement commonly used (SI and non-SI Australian legal) 39
6 References 40

DEWNR Technical Report 2014/03 v
List of figures
Figure 1. From Eamus et al. (2006) A conceptual model of impact on phreatophyte community from
groundwater drawdown 6
Figure 2. Eyre Peninsula NRM Region and locality of wetlands 9
Figure 3. Classification of ecosystems on the Eyre Peninsula as reported by SKM (2009) 10
Figure 4. Vegetation communities that could potentially access groundwater to meet part of their
environmental water requirements (SKM, 2009) 11
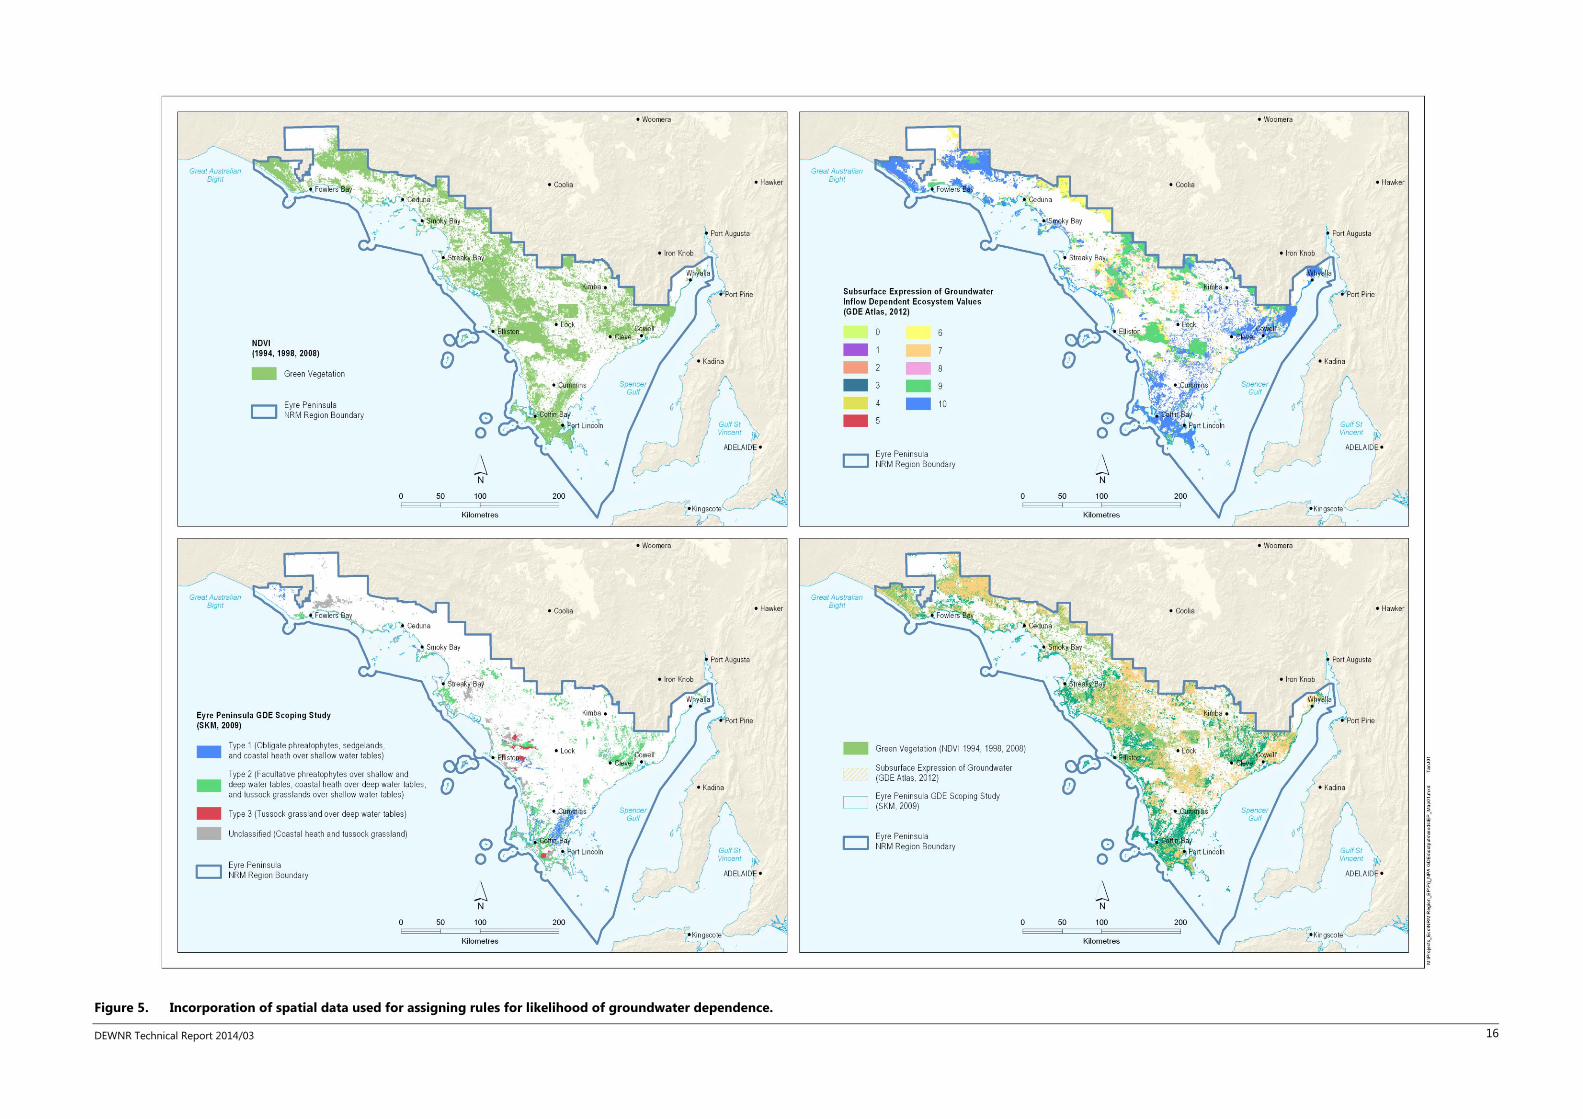
Figure 5. Incorporation of spatial data used for assigning rules for likelihood of groundwater dependence. 16
Figure 6. The ‘intersect’ approach used to determine very high likelihood of groundwater dependence 17
Figure 7. The ‘intersect’ approach used to determine high likelihood of groundwater dependence 17
Figure 8. The ‘intersect’ approach used to determine moderate likelihood of groundwater dependence 18
Figure 9. The ‘intersect’ approach used to low likelihood (therefore unlikely) of groundwater dependence. 18
Figure 10. Example of classification of Type 3 GDE (tussock grassland over deep watertable) (SKM, 2009) in
this case being Austrostipa sp. grassland 21
Figure 11. Interpolated groundwater and salinity trends during the Landsat imagery capture period 1994–
2008 22
Figure 12. A current perspective of interpolated groundwater and salinity levels 2010–13 23
Figure 13. Output of the four different types of groundwater dependence from attribute data from NDVI,
GDE Atlas (2012) and SKM (2009) using the developed GIS data rules 24
Figure 14. Monthly depth to water (m) relative to lake surface (Piezo A, Lake Hamp north shore) 28
Figure 15. Mean monthly depth to water (m) and standard deviation in the mean 29
Figure 16. Estimated daily rates of rise and fall calculated by month over the whole period of record 29
Figure 17. Boxplot of observed elevation where indicated species were recorded. An elevation of 0 is with
respect to the observations well data ground datum. 30
Figure 18. The probability that Melaleuca halmaturorum was observed as a function of elevation. Elevation
here is relative to the zero (ground level) datum for water table fluctuations at the site. 31
Figure 19. Depth-duration curve for Lake Hamp piezometer A 2007–12 (solid line) and the range of water
table preference range for Melaleuca halmaturorum at the site (dashed line) 32
DEWNR Technical Report 2014/03 1
Context statement
Six South Australian Natural Resources Management (NRM) Boards entered into an agreement under the National Partnership
Agreement on Coal Seam Gas and Large Coal Mining Development (https://www.waterconnect.sa.gov.au/Industry-and-
Mining/CSG-Coal-Mining/SitePages/Home.aspx) to deliver a project (Stage 1) on the formation of a Water Asset Database.
Water Assets were uniquely identified for each NRM region with the following water assets identified for the Eyre Peninsula
from a regional expert workshop at Port Lincoln in 2012:
Farm Dams
SA Water Pipeline
Tod Reservoir
Watercourses
Tod River
Catchments
Sub-catchments
Wetlands (inland)
Wetlands (estuarine)
Groundwater Dependent Ecosystems
Freshwater upwellings
Sheeted catchments
Prescribed Wells Area
Monitoring Bores
Aquifers
Abandoned water schemes
Southern Basin and Musgrave lenses
Town water supply bores
Denny and Berens (2013) report on the spatial distribution of the above water assets across the Eyre Peninsula NRM Region as
the outputs of Stage 1. The mapping of groundwater dependent ecosystems for the Water Asset Database utilised the
Groundwater Dependent Ecosystem (GDE) Atlas which had the following two final layers (GDE Atlas, 2012):
Ecosystems that rely on the surface expression of groundwater (rivers, wetlands, springs)
Ecosystems that rely on the subsurface presence of groundwater (vegetation)
Denny and Berens (2013) utilised the GDE Atlas layer of ‘surface expression of groundwater’ to map the [Water Source]
attribute of wetlands as groundwater dependent ecosystems on the Eyre Peninsula.
Stage 2 (reported here) mapped the ‘subsurface expression of groundwater’ on the Eyre Peninsula with the output mapping of
phreatophytes being fed back into the Water Asset Database (Denny & Berens, 2013). The information reported within this
document is broken into two sections:
Section 1: reports on subsurface expression of groundwater ie. vegetation (herein called phreatophytes)
Section 2: is a case study at Lake Hamp that reports on the linkage of wetlands (surface expression of groundwater) with
vegetation zonation. This case study focuses on Melaleuca halmaturorum which has been identified as a phreatophyte
(SKM, 2009).
The aim of this report is for the Water Asset Database (Stage 1) to be updated to include information on terrestrial vegetation
likelihood of groundwater dependence. This information can also be used by the EP NRM Region for water planning purposes.
Stage 3 is reported in Deane and White (2014) and follows on from Stage 2 – Section 2 case study at Lake Hamp. Deane &
White (2014) build on the knowledge of GDE function and their environmental water needs, and propose a monitoring
approach for GDEs in the Prescribed Water Areas (PWAs) within the EP NRM Region.
DEWNR Technical Report 2014/03 2
Summary
As stated within the Context Statement, this report is broken into two sections that report on:
subsurface expression of groundwater (phreatophytes)
the linkage of wetlands (surface expression of groundwater) with vegetation zonation.
Specifically, Section 2 undertook a case study on Melaleuca halmaturorum which has been identified as a phreatophyte (SKM,
2009).
Section 1 provided the opportunity to pull together existing spatial data for further analysis to achieve a greater cohesive
understanding of GDEs for water planning and management for the Eyre Peninsula Natural Resources Management Region.
The aim of this study was to use the outputs of two previous bodies of work (SKM, 2009 and GDE Atlas, 2012) plus undertake
remote sensing and ground-truthing to gain a regional perspective of groundwater interactions of phreatophytes on the Eyre
Peninsula. Geographic Information System (GIS) rules were defined so that the outcomes of all three studies (NDVI vigour
mapping, SKM (2009) and GDE Atlas (2012)) could be integrated to provide an overall likelihood of vegetation groundwater
dependence. The outcome of the work was a more detailed map of groundwater dependence of phreatophytes on the Eyre
Peninsula.
It was integral to this study that a ground-truthing component was undertaken, this allowed for the NDVI methodology to be
checked against SKM (2009) and the GDE Atlas (2012) mapping. Five main field observations were identified which improved
the knowledge and understanding of mapping phreatophytes on the Eyre Peninsula:
1. Patch size and density – a larger patch size may have been beneficial to this study for detecting vegetation vigour at a
more comprehensive scale
2. Spatial variation – Mallee woodland dominated vegetation vigour in the drier more northern region whereas the southern
region mapping aligned with SKM (2009) and GDE Atlas (2012) detection of Sugar Gum and Blue Gum vegetation
associations.
3. Topographic occurrences – density of Mallee woodlands in sand dune country affected the output of vigour detection on
swales, slopes and ridges. Also SKM (2009) classification of tussock grassland over deep watertables seemed unlikely to be
groundwater dependent.
4. Groundwater processes – landscape detection of groundwater recharge and discharge points, and salinity in the
landscape.
5. Effects of salinity – further investigation required of wetland salinity processes in regards to groundwater discharge and
local rainfall perching (this was followed up with a case study in Section 2 of this report, and a further report of Deane &
White (2014).
Section 2 presents data from a case study undertaken on the water table and vegetation dynamics of Lake Hamp near Elliston
in the Musgrave Prescribed Wells Area. This wetland was used as a case study to investigate a hypothesis that vegetation
around saline wetlands may persist partly due to groundwater and the perching of rainfall. During field investigations it was
considered that a shallow rainfall-derived freshwater layer may be perching above the denser saline groundwater table at some
wetlands on the Eyre Peninsula. The aim of this study was to trial a method to link groundwater level data to existing
vegetation by recording the elevation preference for key species. By linking the ground level where plants are found to water
table dynamics data, an indication of the preferred water regime for those plant species can potentially be obtained. The
results from the case study were not conclusive, but indicate that water table dynamics and vegetation zonation in relation to
elevation align with each other. Even though the results of the case study were not conclusive, the tested methodology proved
successful and gave reason for a follow-up field-trip. The follow-up field trip, described as Stage 3 in the Context Statement, is
reported in Deane & White (2014) and proposes design and implementation principles for establishing a monitoring program
for GDEs within at least the prescribed areas on the Eyre Peninsula.
DEWNR Technical Report 2014/03 3
1 Mapping phreatophytes
1.1 Introduction
Ecosystems depend upon water supply and in much of Australia groundwater is a vital water source for ecosystems.
Increasingly much of Australia’s extensive groundwater supplies are being extracted for agriculture, industry and potable water.
Water managers are being challenged to balance the amount of groundwater used for human use with environmental water
requirements. Groundwater management is required to preserve the flora and fauna that groundwater dependent ecosystems
(GDEs) support.
GDEs are defined as ecosystems that require access to groundwater to meet all or some of their water requirements to
maintain a community of plants and animals, ecological processes, and ecosystem services they provide. According to Eamus
(2006) GDEs can generally be divided into the following three classes:
1. ecosystems residing within groundwater (aquifers and caves)
2. ecosystems dependent on surface expression of groundwater (springs, wetlands, rivers, estuaries, and near-shore marine
ecosystems)
3. ecosystems dependent on subsurface expression of groundwater (terrestrial vegetation excluding aquatic, submerged and
emergent vegetation).
This report focuses on the vegetation belonging to the third class, and specifically on phreatophytes, defined here as plants
that have roots that can penetrate the capillary fringe and saturated zone. The report also considers groundwater processes on
the Eyre Peninsula that support wetlands.
The three-stage assessment framework for determination of environmental water requirements (EWRs) of GDEs proposed by
Richardson (2011) provides the basis to this study on the Eyre Peninsula. The focus is to gain understanding of where potential
GDEs exist, conceptualisation of the hydrogeologic setting, the level of groundwater dependence that an ecosystem requires to
maintain its ecological function, and understanding ecological responses to changes in groundwater levels. These processes in
relation to phreatophytes are further discussed below.
1.1.1 Ecological consequences of changes in groundwater dynamics
Evidence is available within the scientific literature as to the likely impacts of reduced groundwater availability on GDEs
(Stromberg et al. 1992; 1996; LeMaitre, 1999; Eamus, 2006). Impacts may depend on the following:
nature of the ecosystem (surface or sub-surface expression of groundwater)
timing of the disturbance relative to temporal reliance of biota on groundwater
characteristics and severity of the impact (both in terms of magnitude and duration).
Ecosystems relying on the surface expression of groundwater may have highly complex dependence on water from different
sources. This may include a combination of rainfall, channel flow, overbank flooding and groundwater. Within this context,
impacts of a change in a single source (for example groundwater) may be difficult to predict. Vegetation associations with a
phreatophytic component are relatively straightforward in terms of their reliance on groundwater and the resulting water
balance. As a result of this, studies from other locations can be used to illustrate some general response patterns typically
resulting from changes in groundwater availability. These are discussed in the following section after a brief review of some
morphological characteristics of phreatophyte species.
1.1.2 Phreatophyte root structure and growth
In order to appreciate the types of impacts that may occur, understanding phreatophyte root structures is useful. A typical
characteristic of phreatophyte species is a dimorphic root structure, with deep tap roots able to access groundwater and
shallow lateral roots, which provide access to soil nutrients and rainfall (Le Maitre 1999, Eamus et al. 2006). Owing to elongate
xylem vessels, tap roots exhibit greatly increased hydraulic conductivity (Pate et al. 1995; Dawson & Pate 1996) allowing water
DEWNR Technical Report 2014/03 4
from considerable depth to be accessed by the plant to meet their water requirements. These roots can reach surprising
depths with 35 m recorded as accessing water tables (Stone and Kalisz 1991) and 68 m the deepest recorded (Canadell et al.
1996).
Phreatophytes respond to fluctuations in water tables through differential rates of root growth allowing tap roots to remain in
contact with saturated layers (Le Maitre et al. 1999, Eamus et al. 2006). As a result phreatophytes are sensitive to sudden
lowering of water tables where draw down rates exceed those of root extension (Rood & Mahoney 1990; Mahoney & Rood
1992; Stromberg 1992). Rapid root growth is commonly observed among phreatophytes, and both drought and fluctuating
water tables have been correlated with increases in the growth rates of roots over those observed under static water tables
(Amlin & Rood 2002). Experimental evidence has found drawdown rates exceeding 2 cm/d decreased the growth of roots and
as a result the condition of two northern hemisphere phreatophyte genera Populus and Salix, evidence as a reduction in
transpiration, leaf number and area (Mahoney & Rood 1992; Amlin & Rood 2002). In South Australia, Mensforth & Walker
(1994) also observed plasticity in root growth for the wetland phreatophyte Melaleuca halmaturorum. In this instance growth
was concentrated at different areas of the soil profile as water tables varied over the year. This observation was however at
least in part attributed to the plant looking to exploit areas of lower soil water salinity rather than seeking to follow declining
water levels.
Where groundwater is found at greater depths, more of the plants available energy may be directed to root growth (Mahoney
& Rood 1992). This may lead to the characteristics of the observed phreatophyte community depending on the depth of
groundwater. Stromberg et al. (1993) note that the growth form of Prosopis velutina, a northern hemisphere phreatophyte,
changed as a function of the depth to groundwater. Where water tables were less than six metres below the surface Prosopis
grew as a tree, while at depths of 12–15 m the species took the form of a shrub. Other vegetative characteristics, such as leaf
number and area also changed.
An important ecological consequence of the dimorphic root structure is the benefits non-phreatophytes obtain as a result of
hydraulic redistribution. This process occurs where root systems passively (that is, without any use or benefit being derived by
the host plant) re-distribute water in three-dimensional space through the soil profile according to the relative dryness of the
soil. A special case of redistribution is known as hydraulic lift (Caldwell et al. 1998; Le Maitre 1999; Orellana 2012), where
phreatophytes in contact with the water table re-distribute water to shallow surface soils. This re-distribution means plant roots
in shallow soils have access to water where nutrient concentrations are higher but uptake depends on shallow root competition
and water becomes available for the use of all plants. Grasses and shrubs located close to phreatophytes have been reported
to benefit from this process, performing better than more distant plants without access to the additional water source (Filella
and Penuelas 2004; Ludwig et al. 2003). In other words, a loss of connection with groundwater may have implications for the
vegetation association beyond that of any phreatophyte species themselves.
1.1.3 General impacts resulting from groundwater lowering
Predicting the results of a change to water table dynamics, as with all disturbances, will depend on the nature of the
perturbation itself (Lake 2000). As the duration and magnitude of any perturbation increases impacts will become more likely
and more evident. From the perspective of phreatophytic vegetation, a short term, pulse type disturbance to water table
dynamics, or equally to water quality, will likely lead to a reduction in various measures of the performance of individuals.
Impacts of extraction and drawdown from the aquifer may lead to changes in plant water potential, leaf size and/or number,
canopy height, and the ratio of living to dead vegetation volume (Stromberg et al. 1992; 1996; Eamus 2006). Such impacts as
these may not be immediately apparent to managers even where a typical vegetation monitoring program was in place. The
shorter the duration of the pulse, the more likely this would only be apparent in variables such as canopy volume, leaf water
potential or growth increments. Hence such early warning impacts are of a lower detection likelihood.
As the duration of a perturbation in groundwater supply continued, or its severity increased, a lack of recruitment success may
be observed, especially in riparian systems (Le Maitre 1999). Younger trees are less able to extend root systems to reach, or
keep pace with declining groundwater levels, hence the loss of this age class may occur early on. It should be noted that the
process of recruitment is often opportunistic in nature and is also sensitive to land management, hence a lack of recruits within
a red gum woodland size class distribution for example may not in itself indicate impacts on groundwater.
Continued groundwater draw-down would likely then result in the partial to complete mortality of older individuals unable to
maintain demand to support their full canopy (Le Maitre 1999). Mid-age, actively growing trees will likely be most resistant to
shorter-term disturbances with high root growth potential and smaller canopy demand to maintain. While all dependent
DEWNR Technical Report 2014/03 5
vegetation will suffer a decrease in performance with a disturbance to groundwater dynamics, mid-age trees at least may
persist for several seasons. Ultimately, if the disturbance is not ameliorated, loss of all phreatophytes will likely occur with
successional replacement by terrestrial species. Note that if the pre-impact water table is located at depth a level of hysteresis
is highly likely to be observed. It is unknown if a return to phreatophytic vegetation would occur as a natural succession even if
water table dynamics were restored once a shallow non-phreatophyte terrestrial plant community had established.
Concurrent with the loss of access to water provided via hydraulic lift from deep-rooted phreatophytes, it is reasonable to
anticipate impacts on understorey species. Any understorey reliant upon hydraulic lift would be extirpated following the loss of
phreatophyte connection with groundwater. Such a change in community structure and composition may be gradual and
typical vegetation monitoring data will likely be a lag indicator of many impacts. The most easily detected early warning signals
may well relate to simple groundwater monitoring data. Provided that pre-impact data are collected to indicate the range of
variability in groundwater level and salinity, deviation from this can be taken as an indicator that phreatophyte communities
may be under stress. This can be used to trigger more detailed investigations if considered necessary. Characterising both
vegetation structure and density and observed water table variations while a groundwater dependent community is considered
to be self-sustaining is a good natural resource management approach to establishing a baseline. Such information can be
used as a benchmark guide to avoiding impact under multiple development scenarios.
As suggested above, phreatophyte root systems need to be able to maintain contact with the water table or capillary fringe,
hence along with annual minima and maxima, seasonal rates of water table decline are critical variables to estimate under pre-
impact conditions.
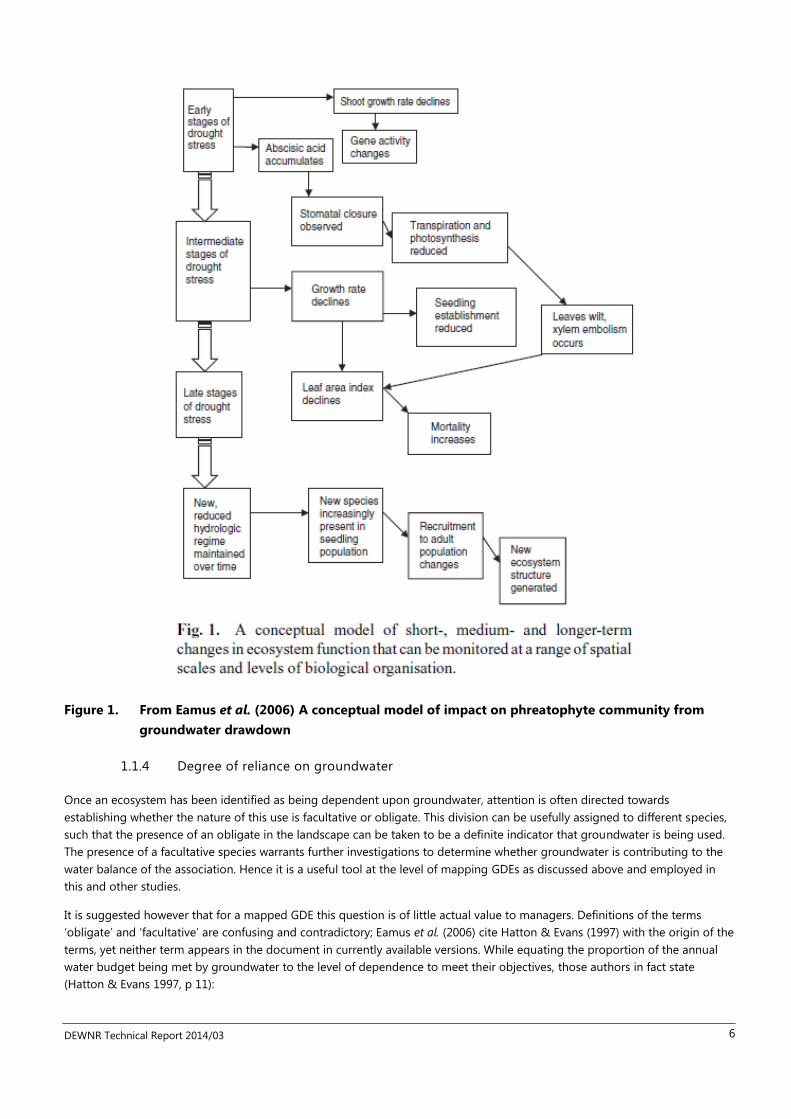
Eamus et al. (2006) present a conceptual model of the manner in which impacts become apparent along a gradient of
increasing severity or duration. It is reproduced here to underline some of the concepts discussed above (Figure 1).
DEWNR Technical Report 2014/03 6
Figure 1. From Eamus et al. (2006) A conceptual model of impact on phreatophyte community from
groundwater drawdown
1.1.4 Degree of reliance on groundwater
Once an ecosystem has been identified as being dependent upon groundwater, attention is often directed towards
establishing whether the nature of this use is facultative or obligate. This division can be usefully assigned to different species,
such that the presence of an obligate in the landscape can be taken to be a definite indicator that groundwater is being used.
The presence of a facultative species warrants further investigations to determine whether groundwater is contributing to the
water balance of the association. Hence it is a useful tool at the level of mapping GDEs as discussed above and employed in
this and other studies.
It is suggested however that for a mapped GDE this question is of little actual value to managers. Definitions of the terms
‘obligate’ and ‘facultative’ are confusing and contradictory; Eamus et al. (2006) cite Hatton & Evans (1997) with the origin of the
terms, yet neither term appears in the document in currently available versions. While equating the proportion of the annual
water budget being met by groundwater to the level of dependence to meet their objectives, those authors in fact state
(Hatton & Evans 1997, p 11):
DEWNR Technical Report 2014/03 7
‘Thus it is unlikely that there are ecosystems in Australia that exist in the presence of groundwater that have no
dependence upon it, and were groundwater to be made less available, would not suffer. Were it to be shown that a
woodland derived only 10% of its annual transpiration from groundwater, it may be unsafe to assume that denial
of this resource would have only a trivial impact.’
Eamus et al. (2006), citing O’Grady et al. (2006) adopt the following definition:
‘Facultative dependency occurs when groundwater is used when it is available but its absence does not cause the
loss of this vegetation element from that site’.
In the direct absence of empirical evidence this may be of limited value and examples given by Eamus et al. (2006) potentially
misleading. O’Grady et al. (2006) does not use the term ‘facultative’ but does suggest that some tree species use groundwater
opportunistically over a five month study, while others were more obligate in their use of the resource. Few, if any, ecologists
would be comfortable equating the term ‘opportunistic’ with the phrase ‘ecologically unimportant’. Indeed, many critical
ecological processes are highly opportunistic, yet nonetheless essential for population viability. Flood-based recruitment of
floodplain trees or dispersal events are good examples.
A theme within Eamus et al. (2006) is the difficultly in establishing a level of dependency. Eamus et al. (2006) indicate that
groundwater may become critical at irregular intervals for the maintenance of a given population. An example is given that a
six month requirement for groundwater every 10-20 years is an obligate usage. The implication is that a short-term study
would be extremely fortunate to observe one of these irregular events that define an obligate level of dependence. The
argument that groundwater use can be both critically important and highly irregular and a conclusion of ‘facultative’ use by a
vegetation association after a single year of study are incompatible; groundwater may periodically become obligate (only rely
on groundwater) under circumstances outside those times not observed during the period of a short term study. Logically, only
studies spanning several cohorts could reliably indicate a ‘facultative’ use.
Clifton et al. (2007) provides a different definition of a facultative GDE as:
‘Facultative GDEs require access to groundwater in some landscapes, but in other landscapes can utilise alternate
sources of water to maintain ecosystem function, i.e. the presence or absence of groundwater is not critical in
determining ecosystem occurrence’.
This definition mixes a species level and habitat level designation. Note that this is not the same as saying that removal of
groundwater access at the site in question will not impact the ecosystem. Yet researchers regularly conclude the opposite: that
where groundwater is present, it will be used by the ecosystem to maintain structure and function (Hatton and Evans 1997; Le
Maitre 1999; Murray et al. 2003). The fact is that whether in some locations a given vegetation association is found where
groundwater is not present; the structure of both the facultative phreatophytes and any reliant understorey species would be
fundamentally different if no groundwater were present. Indeed, Canham et al. (2009) identified a degree of plasticity in traits
related to water stress resistance, with a facultative species of Banksia from a site where groundwater was available not
differing from that of an obligate Banksia. If facultative users develop a comparable series of traits to those of obligate plants
when groundwater is available, then loss of groundwater could be predicted to have similar consequences at a site, whether
the species is a facultative user or not.
The presumed implication in delineating a facultative from an obligate GDE is that the loss of this ecosystem is of lesser
importance because in places it is found where groundwater does not occur. Determining the exact features of ecosystem
structure and function that are reliant upon groundwater is a costly and uncertain business. George et al. (2005) presents a
good example, where riparian tree species are facultative users of groundwater, with other sources preferred, with the
exception of long periods of drought, where the entire ecosystem relies entirely on groundwater to persist. Put another way, to
classify an ecosystem as facultative implies some (anthropocentric) element of choice on behalf of the organism.
It is arguable that any dependence on groundwater should be viewed as essential to maintain the current characteristics of the
ecosystem. Moreover observed facultative use may speak as much to the ability of scientists to identify all uses of groundwater
as much as the ability of the ecosystem to do without. At ecosystem level the question of ‘obligate’ vs ‘facultative’ loses
relevance and as such, management should focus on the values and risks to the systems they have and how groundwater
supply figures in these. In other words, where groundwater dependence is recognised, there are more fruitful questions to
focus on than the temporal usage pattern. Some suggested actions are provided for GDE managers in Section 2.

DEWNR Technical Report 2014/03 8
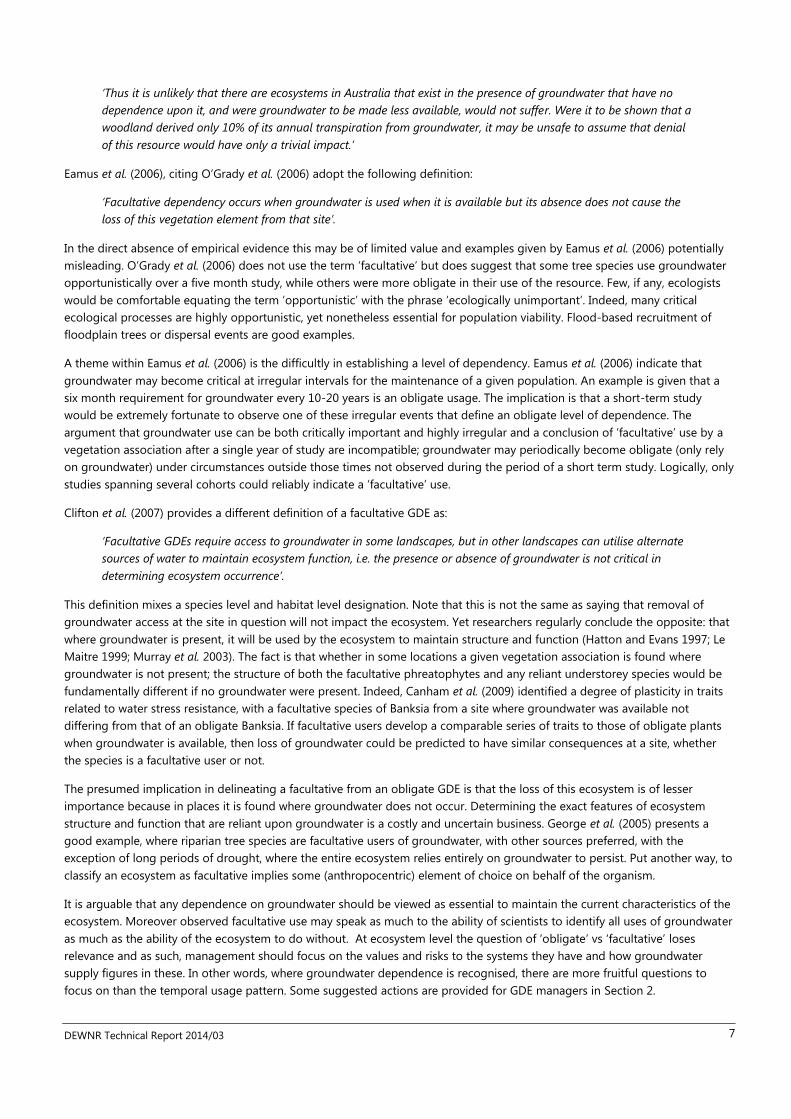
1.1 Study location
The Eyre Peninsula NRM region (Figure 2) covers a large proportion of South Australia (80 000 square km/8 million ha) and
includes a diverse range of water dependent ecosystems that persist across the region, from coastal marine to inland arid
areas. Much of Eyre Peninsula has limited surface water due to relatively low rainfall, high evaporation, permeable soils and flat
landscapes, though it still supports a variety of wetlands that offer critical refugia in a largely fragmented agricultural
landscape; wetlands may exist as lakes, swamps, streams, springs, rock holes, salt marshes, mangroves or estuaries.
Eyre Peninsula has a characteristic Mediterranean climate, with warm dry summers, and cool wet winters. Mean annual rainfall
ranges from 250 mm in the north and northwest to more than 500 mm in the south of the region.
There are two main sedimentary sequences containing groundwater that overlie basement rocks on the Eyre Peninsula, being
the Quaternary Limestone aquifer and the Tertiary Sands aquifer. More detailed information and conceptual understanding on
the hydrogeology of the region can be found in the groundwater status reports (https://www.waterconnect.sa.gov.au/Science-
and-Research/Monitoring/SitePages/State%20and%20Condition%20Reports.aspx).
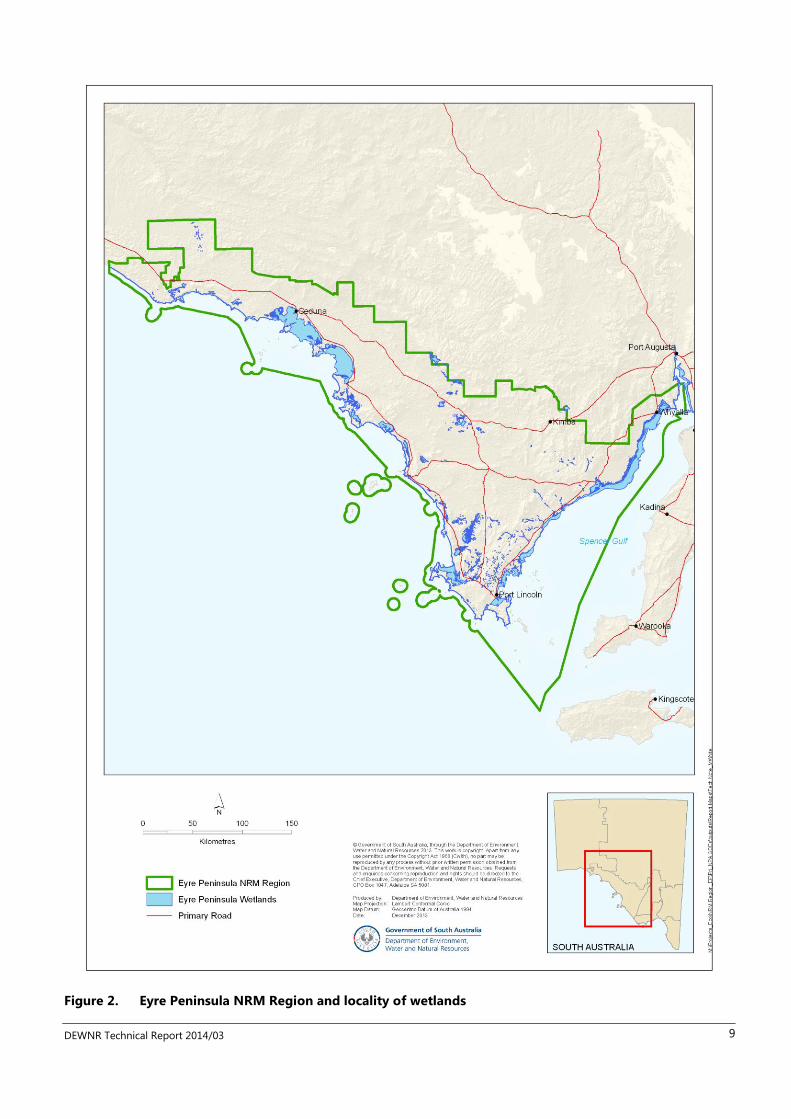
In 2009, the Eyre Peninsula NRM region contracted Sinclair Knight Merz (SKM) to undertake a scoping study on groundwater
dependent ecosystems on the Eyre Peninsula which aimed to classify 10 ecosystems; saline swamps, saline lakes, springs and
underground water soaks, grasslands and sedgelands, hypogean, hyporheic and collapsed sinkhole ecosystems, phreatophytes,
freshwater lakes, damp coastal and sub-coastal heaths (SKM, 2009) with the project delivering six of these classifications due to
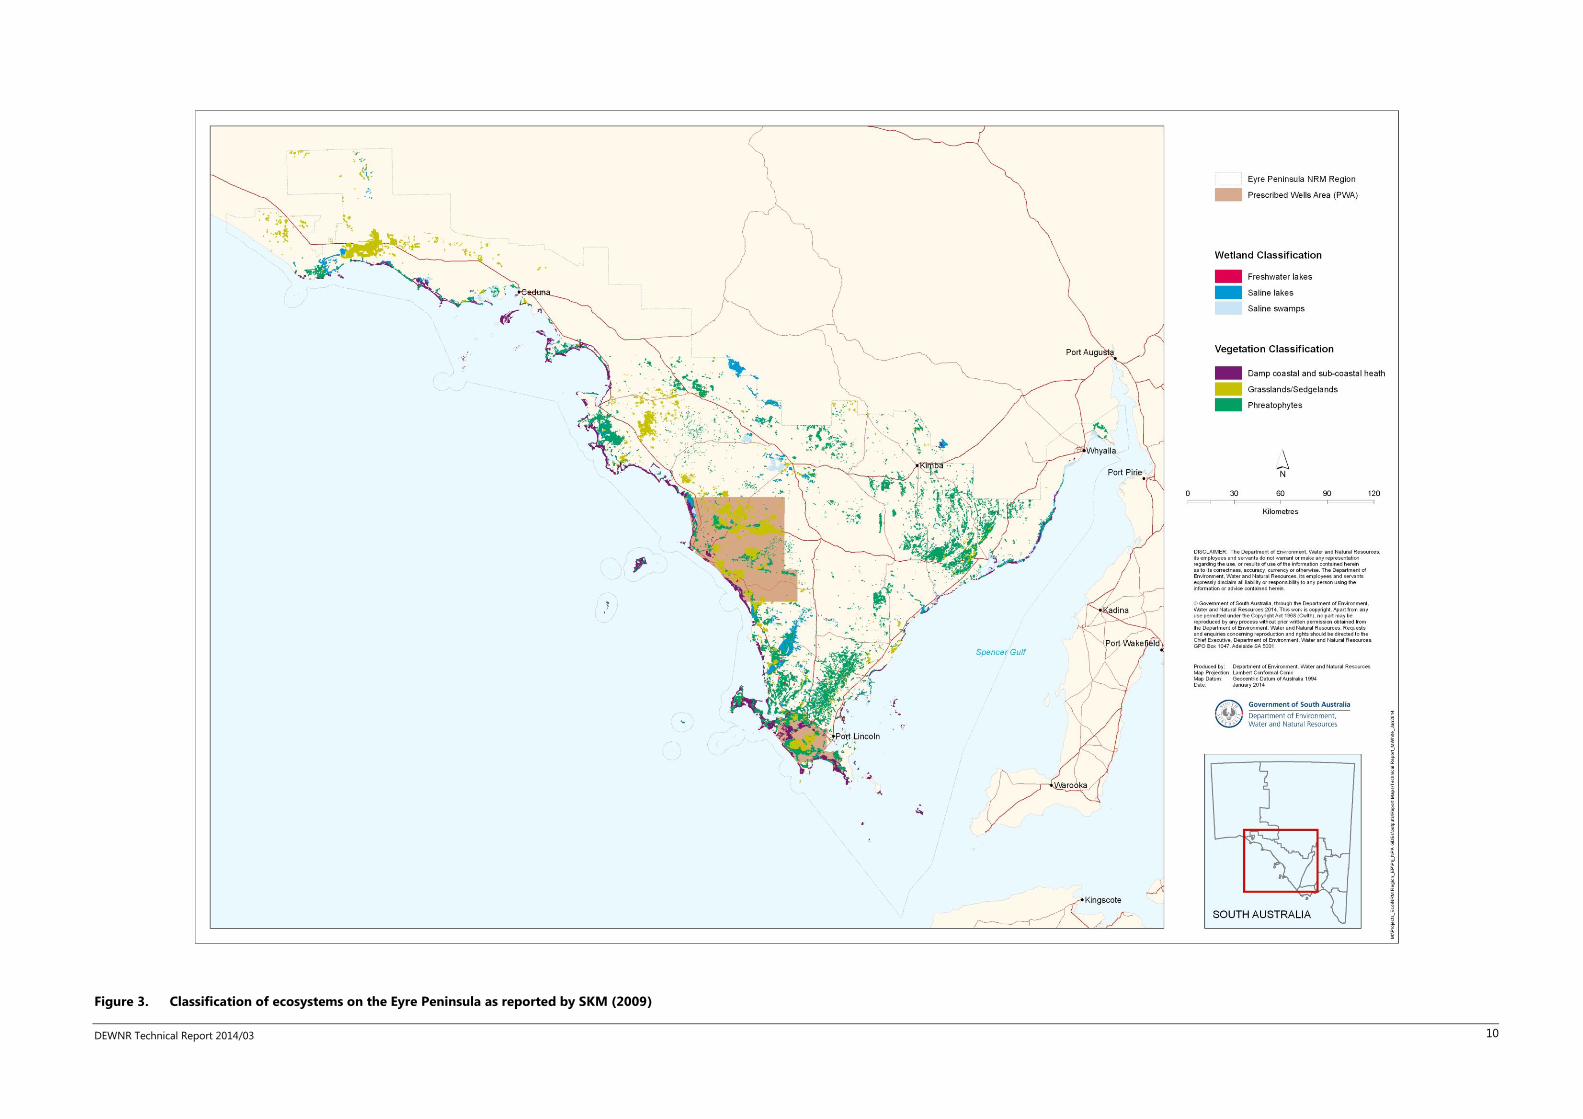
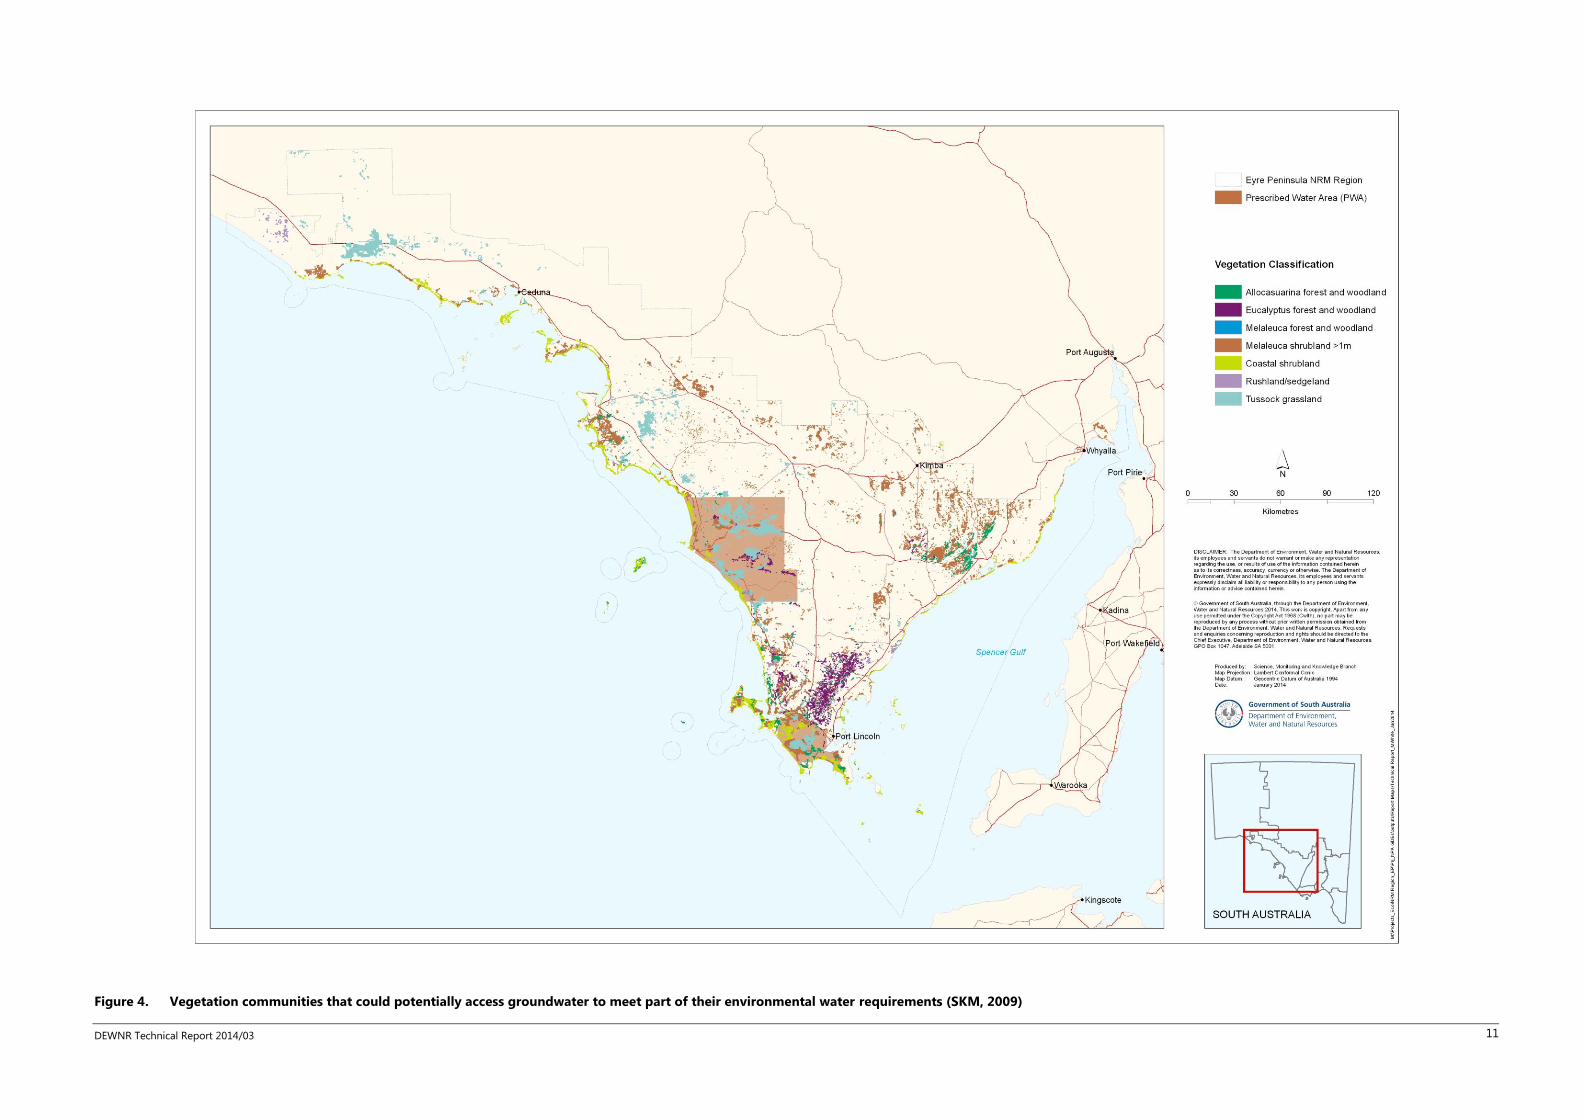
desktop data availability (Figure 3). The scoping study also investigated vegetation communities that could potentially access
groundwater to meet some part of their environmental water requirements, these were considered to include; Eucalyptus forest
and woodland, Melaleuca forest and woodland, Melaleuca shrubland >1 m, Allocasuaria forest and woodland,
rushland/sedgeland, tussock grassland, and coastal shrubland.
Due to the SKM (2009) study being desktop based, this study built-on the existing knowledge base to undertake some field
validation of phreatophyte mapping and to also undertake an initial assessment of wetland function in relation to
understanding groundwater dependency on the Eyre Peninsula (Section 2) which was further investigated with a follow-up field
trip and technical report (Deane and White, 2014).
DEWNR Technical Report 2014/03 9
Figure 2. Eyre Peninsula NRM Region and locality of wetlands
DEWNR Technical Report 2014/03 10
Figure 3. Classification of ecosystems on the Eyre Peninsula as reported by SKM (2009)
DEWNR Technical Report 2014/03 11
Figure 4. Vegetation communities that could potentially access groundwater to meet part of their environmental water requirements (SKM, 2009)
DEWNR Technical Report 2014/03 12
1.2 Methodology
1.2.1 Exisiting mapping
There have been two studies that have mapped potential GDEs on the Eyre Peninsula.
As previously stated, SKM (2009) undertook a scoping study conceptualising, mapping and prioritising GDEs and their
environmental water requirements, this study included surface expression of groundwater in wetlands and subsurface
expression of groundwater as phreatophytes but did not include springs, soaks, sinkholes or caves where groundwater and
their dependent ecosystems also exist.
In 2012, SKM and CSIRO undertook the GDE Atlas project that mapped surface and subsurface expression of groundwater at a
National scale. The Atlas used pre-existing mapping, incorporated statewide data and knowledge, and used remote sensing
and GIS to create an Inflow Dependent Ecosystem (IDE) layer to determine existence of potential ecosystems using
groundwater across the Australian landscape (GDE Atlas, 2012). The GDE Atlas divided Australia into eight work package zones
which were again divided into eco-hydrogeological zones. The Eyre Peninsula NRM Region is within one work package area
but is spread across four eco-hydrogeological zones, which illustrates the climate and groundwater complexity of Eyre
Peninsula.
1.2.2 Additional investigations
This study provided the opportunity to pull together existing data and provide further analysis to achieve a greater cohesive
understanding of GDEs for water planning and management for the EPNRM Region that builds on work undertaken by DEWNR
in 2012 (Doeg et al., 2012). The aim of this study was to use the outputs of the two previous studies (SKM, 2009; GDE Atlas,
2012) plus undertake remote sensing and ground-truthing to gain a regional perspective of groundwater interactions of
phreatophytes and wetlands on the Eyre Peninsula.
This study will follow a similar approach to that of Overton (2006) whereby four main questions from NCC (1999) were
addressed. For this study these questions have been broken into the two methodologies that were undertaken.
Section 1: Mapping and understanding phreatophytes on the Eyre Peninsula:
Is vegetation known to sustain growth through drought seasons?
Does the vegetation remain lush throughout the year in an arid environment?
Section 2: Understanding wetland GDEs on the Eyre Peninsula through the presentation of a case study:
Is the water table within the ecosystem root zone at any time in the natural cycle?
Are there any indicator species which indicate groundwater dependency?
1.2.2.1 Normalised Difference Vegetation Index (NDVI)
The Normalised Difference Vegetation Index (NDVI) are derived from satellite data and a measure of the amount of live green
vegetation. Live green vegetation absorbs visible light (solar radiation) as part of photosynthesis and at the same time plants
scatter (reflect) solar energy in the near infrared. This difference in absorption is quite unique to live vegetation and provides a
measure of the greenness of the vegetation. NDVI is an index which measures this difference, providing a measure of
vegetation density and condition. NDVI is calculated from the red and near-infrared reflectances rRed and rNIR as:
NDVI = (rNIR - rRed) / (rNIR + rRed)
Its value is always between -1 and +1. Vegetation NDVI in Australia typically ranges from 0.1 up to 0.7, with higher values
associated with greater density and greenness of the plant canopy. NDVI decreases as leaves come under water stress, become
diseased or die. Bare soil and snow values are close to zero, while water bodies have negative values.
The methodology for this study follows that of Overton (2006) whereby:

DEWNR Technical Report 2014/03 13
If vegetation remains lush during a dry period it could indicate that the vegetation has an alternate water supply which could
be groundwater.
Using this as a hypothesis, this study used a dry time-series (epoch) approach as the landscape would be at its driest and
therefore any vegetation that is using groundwater during these periods could be identified via NDVI. The constraints of the
epochs for Eyre Peninsula were as follows:
(1) Landsat acquisition post 1980
(2) Annual rainfall below average
(3) Image capture Autumn (February–April), the post-summer period when vegetation that is possibly using
groundwater will have higher vigour than surrounding rainfall dependant vegetation
(4) Also finding cloud-free periods across a 6–8 week period, as it usually took Landsat up to sixweeks to cover the
nine scenes required to cover the whole of the EPNRM Region
(5) The two months prior to image capture also had to have average or below average rainfall, so the vegetation in
the imagery will not be responding to a summer rainfall flush. The methods to determine the best low rainfall
periods for Landsat image capture were:
(6) Rainfall station data was aligned with the stations that are used for the annual Groundwater Status Reports on
the Eyre Peninsula (http://www.waterconnect.sa.gov.au/GSR/) this was deemed appropriate as the Musgrave
PWA exists in the drier part of the peninsula, while the Southern Basins covers the higher rainfall area of the
southern peninsula. The rainfall stations used were Elliston (18069) and Big Swamp (18017).
(7) Bureau of Meteorology (BOM) data was manually queried to find annual below average rainfall years with either
average or below average rainfall over the two-month period late summer (Jan–Feb) for both the Elliston and Big
Swamp stations.
Years matching the criteria were: 1991, 1993, 1994, 1998, 1999, 2008. These years were then shortlisted to best match cloud-
free imagery and to also have below average rainfall two months prior to Landsat image capture; 1998, 2008 and 1994 best
matched the criteria.
To determine if the above three dates where the best dates to undertake the analysis, we additionally looked at evapo-
transpiration, cumulative deviation from annual rainfall and soil moisture trends on the Eyre Peninsula at Elliston and Big
Swamp using SILO data; the general trend showed that a declining rainfall period occurred from 1992–2010 and evapo-
transpiration increasing in response to declining rainfall especially from 2004-2010.
The NDVI analysis threshold was used for vegetative ecosystems known to support GDE’s on the Eyre Peninsula i.e. vegetation
surrounding groundwater dependent wetlands. The final mosaic was a dataset that intersected vigorous growth in all three dry
years which gave a more conclusive dataset indicating where vegetation may have an alternate source of water other than
rainfall.
1.2.3 Hydrogeology
1.2.3.1 Wetland cross-sections
As part of this project, additional desktop work was undertaken to provide further conceptual understanding of the
hydrogeological setting and groundwater processes occurring around a number of wetlands.
Doeg et al. (2012) assessed the Environmental Water Requirements (EWRs) for wetlands on the Eyre Peninsula and selected
representative wetlands where future monitoring should be targeted. The representative wetlands included Sleaford Mere,
Lake Pillie, Round Lake, Lake Newland, Poelpena and the under-represented and rarely studied springs on the Eyre Peninsula.
Semeniuk and Semeniuk (2007a) previously installed piezometers around a number of these wetlands which have had some
monitoring since 2005 though limited access to these data exists.

DEWNR Technical Report 2014/03 14
The hydrogeological desktop study targeted Lake Hamp, Lake Newland and Samphire Flat as depth to groundwater data have
been collected since 2005 by Rob Coventry (DEWNR NRM Officer, Elliston) and was made available. Poelpena was also selected
due to its proximity to the Polda groundwater lens. Hydrostratigraphic cross sections and a hydrogeological summary for these
wetlands are provided in Section 3, Appendix. Aerial maps displaying recent groundwater data from nearby wells are also
provided. With the exception of Poelpena, where groundwater data in the proximity of each wetland are generally sparse and
predates 2000.
To construct the interpreted cross sections, information was collated from 1:50 000 surface geology mapping (Flint 1989; Flint
& Rankin 1989; Rankin & Flint 1989), drillhole lithology data collected during historical drilling activities (SA Geodata, 2013),
hydrostratigraphic 3D spatial layers (DEWNR, in prep.), wetland lithology and groundwater data (NRM Region monitoring
piezometers; Semeniuk & Semeniuk, 2007a&b) and regional groundwater data (WaterConnect, 2013). Cross section
construction was completed digitally using the GIS software package ArcMap™ and extension package Exacto V2.0©. A vertical
exaggeration of 1:20 was used to aid display of information.
The hydrostratigraphic cross sections provide an indication of the likely water source for the specific wetlands studied using
existing drillhole lithology and groundwater data. Whilst no hydrochemical sampling was undertaken as part of the current
study, bores within each wetland’s proximity were assessed for future inclusion into a sampling program.
1.2.3.2 Groundwater mapping
To support the NDVI analysis and subsequent field work, groundwater level and salinity maps were produced for the time
periods 1994 to 2008, and 2010 to 2013 respectively. These maps are included in Appendix.
The interpolated groundwater level and salinity maps were constructed using the most recent groundwater level and salinity
data collected during the specified time period, and archived in the state’s groundwater information database (WaterConnect,
2013). The information was presented digitally using GIS software package ArcMap™ and the Inverse Distance Weighted (IDW)
interpolation extension tool (cell size 50 m). As groundwater data from the EP NRM region are sporadic both spatially and
temporally, it was necessary to increase the number of data points (and hence confidence in the interpolation method) by
selecting for a date range rather than a specific year. Buffer distances were constructed around each data point to display
confidence in the interpolation method: <2 km (high); 2–5 km (moderate); and >5 km (low).
1.2.4 Field ground-truthing
It was integral to this study that a ground-truthing component was undertaken, this allowed for the NDVI to be checked
against SKM (2009) and the GDE Atlas (2012) mapping of GDEs on the Eyre Peninsula. The ground-truthing methodology
included driving across various landscape and climatic regions of the Eyre Peninsula to get a good understanding of what
vegetation, geology, elevation and groundwater processes may be occurring and how these vegetation patches matched
against the desktop GDE mapping. It was recorded during the ground-truthing where the different methodologies matched or
did not match.
During the field ground-truthing a case study looking at the interaction of water table dynamics and vegetation zonation was
undertaken at Lake Hamp near Elliston. Depth to groundwater had been monitored monthly at Lake Hamp for the last five
years, with Section 2 presenting the methods and results of this case study. The aim of this study was to trial a method to link
groundwater level data to existing vegetation by recording the elevation preference for key species. By linking the ground level
where plants are found to the water table dynamics data as an indication of the preferred water regime for those plant species
can potentially be obtained.
1.2.5 Collating information
The aim of this study is to incorporate the outputs of the NDVI analysis with the GDE Atlas (2012) and SKM (2009) to gain a
regional perspective of groundwater interactions with phreatophytes and wetlands on the Eyre Peninsula.
The NDVI analysis undertaken in this study used a dry time-series approach as the landscape would be at its driest based on
inferred vigorous growth signatures. The final mosaic was a dataset that intersected vigorous growth in all three dry years
which gave a more accurate indication of where vegetation may have an alternate source of water other than rainfall.
DEWNR Technical Report 2014/03 15
The GDE Atlas was produced by SKM and CSIRO in 2012 by processing remote sensing data to produce a gridded inflow
dependence layer (IDE) using a rating system between 1–10 to determine the likelihood that vegetation utilises a source of
water other than direct rainfall (ratings of 10 indicated landscapes that are highly likely to be accessing an additional source of
water other than rainfall). The final assignment for potential groundwater interaction for any mapped ecosystem used a series
of GIS processing rules based on existing spatial data and from the IDE layer to produce a classification of high/moderate/low
potential for groundwater interaction. GDE Atlas (2012: pp. 44) note that more complex measures of reliability could have been
developed, however, it was concluded that this would not have made the Atlas more useable and they state that:
“The Atlas is a management tool designed for use in the early stages of the planning process to indicate the
location of potential GDEs”.
This context should be borne in mind when considering the reliability of the information and forms the reasoning behind using
the remotely sensed IDE ratings for our analysis as opposed to the inferred high/moderate/low classification for potential
groundwater interaction.
The Eyre Peninsula GDE Scoping Study (SKM, 2009) used the remote sensing technique NDVI to interpret whether each of the
potentially groundwater dependent vegetation communities had access to groundwater based on inferred water stress
signatures. NDVI was high where potential groundwater dependent vegetation (obligate and facultative) communities were
mapped over shallow water tables suggesting that these vegetation communities have access to groundwater. Where
facultative groundwater dependent vegetation communities occurred over deep water tables, NDVI was found to be low
suggesting no access to groundwater and a low soil water store. Some inconsistencies were found, and it was suggested that
vegetation health and density, and perched groundwater systems would be contributing factors needing to be considered.
1.2.6 Rules developed for assigning groundwater dependence
This section describes the methodology used to identify potential GDEs by integrating the spatial datasets within a GIS
environment. The purpose of the GIS analysis was to intersect the different feature layers to present an ecosystem dataset layer
with assigned groundwater dependence. The likelihood of groundwater dependence was assigned the categories of very high,
high, moderate and unlikely, which was determined by attribute data within the three spatial datasets; NDVI analysis, GDE Atlas
(SKM, 2012), and the Eyre Peninsula GDE Scoping Study (SKM, 2009). Figure 5 demonstrates the overlap in data from the three
spatial datasets.
Within the GDE Atlas shapefile download an IDE value is given in the attribute table. The IDE value was determined from the
gridded remote sensing layer with the values indicating a likelihood rating between 1 and 10. The higher likelihood rating (6 to
10) suggest that the landscape is more likely than not to be using an additional source of water, such as groundwater. Ratings
of 10 indicate landscapes that are highly likely to be accessing an additional source of water.
The scoping study that SKM undertook (SKM, 2009) classified the vegetation mapping using the outputs from their NDVI
analysis into four ecosystem types. These ecosystems types consist of obligate and facultative phreatophytes and unclassified
systems.
DEWNR Technical Report 2014/03 16
Figure 5. Incorporation of spatial data used for assigning rules for likelihood of groundwater dependence.

DEWNR Technical Report 2014/03 17
1.2.6.1 Very high likelihood of groundwater dependence
To determine a very high likelihood of groundwater dependence, ecosystems with an IDE value of 10 and were classified Type
1 (obligate phreatophytes, sedgelands, and coastal heath over shallow water tables), and also had NDVI from the dry-years
mosaic occurring within the intersected patch were rated as very high (Figure 6).
Figure 6. The ‘intersect’ approach used to determine very high likelihood of groundwater dependence
1.2.6.2 High likelihood of groundwater dependence
To determine a high likelihood of groundwater dependence, ecosystems with an IDE value of 6 to 9 and were classified Type 1
(obligate phreatophytes, sedgelands, and coastal heath over shallow water tables), and also had NDVI from the dry years
mosaic occurring within the intersected patch were rated as high (Figure 7).
Figure 7. The ‘intersect’ approach used to determine high likelihood of groundwater dependence

DEWNR Technical Report 2014/03 18
1.2.6.3 Moderate likelihood of groundwater dependence
To determine a moderate likelihood of groundwater dependence, ecosystems with an IDE value of 6 to 10 and were classified
Type 2 (facultative phreatophytes over shallow and deep water tables, coastal heath over deep water tables, and tussock
grasslands over shallow water tables), and also had NDVI from the dry years mosaic occurring within the intersected patch
were rated as moderate (Figure 8).
Figure 8. The ‘intersect’ approach used to determine moderate likelihood of groundwater dependence
1.2.6.4 Unlikely to be groundwater dependent
To determine if an ecosystem is unlikely to be groundwater dependent, ecosystems with an IDE value of 1 to 5 or ecosystems
classified Type 3 (tussock grassland over deep water tables) were determined to unlikely to be groundwater dependent (Figure
9).
Figure 9. The ‘intersect’ approach used to low likelihood (therefore unlikely) of groundwater
dependence.
DEWNR Technical Report 2014/03 19
1.3 Results and discussion
1.3.1 Hydrogeology
The hydrogeological setting on the Eyre Peninsula has been described in detail in Berens et al. (2011). The hydrogeological
desktop study for the current investigation targeted Lake Hamp, Lake Newland, Samphire Flat and Poelpena. The results are
presented in Appendix A and include hydrostratigraphic cross sections and interpretations, aerial maps displaying recent
groundwater data near each wetland, and depth to water and salinity mapping for the broader EP NRM region to support the
NDVI analysis and subsequent ground-truthing.
The hydrostratigraphic cross sections are essentially non-quantitative conceptual models that provide an initial assessment of
source water, and may be applied to other sites of interest, e.g. other representative wetlands as identified by Doeg et al.
(2012); stands of phreatophyte vegetation (red gums); or other wetlands in the potential zone of influence of proposed mine
sites.
The current study did not include hydrochemical sampling for age or source water indicators, which would provide another line
of evidence of source water for each wetland. However existing bores were assessed for potential inclusion in a future sampling
program. Groundwater data in the Non-Prescribed areas of the EP NRM region are spatially and temporally sporadic. Where
data are available, it usually predates 2000 and often only depth to water readings are reliable as bore construction details are
insufficient or unavailable. In the vicinity of Samphire Flat and Lake Hamp, there is generally a paucity of nearby existing wells
that are screened in one aquifer and are suitable for reliable hydrochemistry sampling .
The wetland monitoring piezometers installed Semeniuk & Semeniuk (2007a) near the majority of representative wetlands (as
listed in Hydrogeology section 1.2.3) are potentially suitable for future hydrochemical sampling. It is recommended that these
piezometers be surveyed to allow for comparison of levels against a datum, their current condition (eg. casing) needs to be
assessed for future monitoring potential, and monitoring data be collated and stored in the state’s groundwater database
(SAGeodata) to allow for inclusion in future resource assessments and modelling.
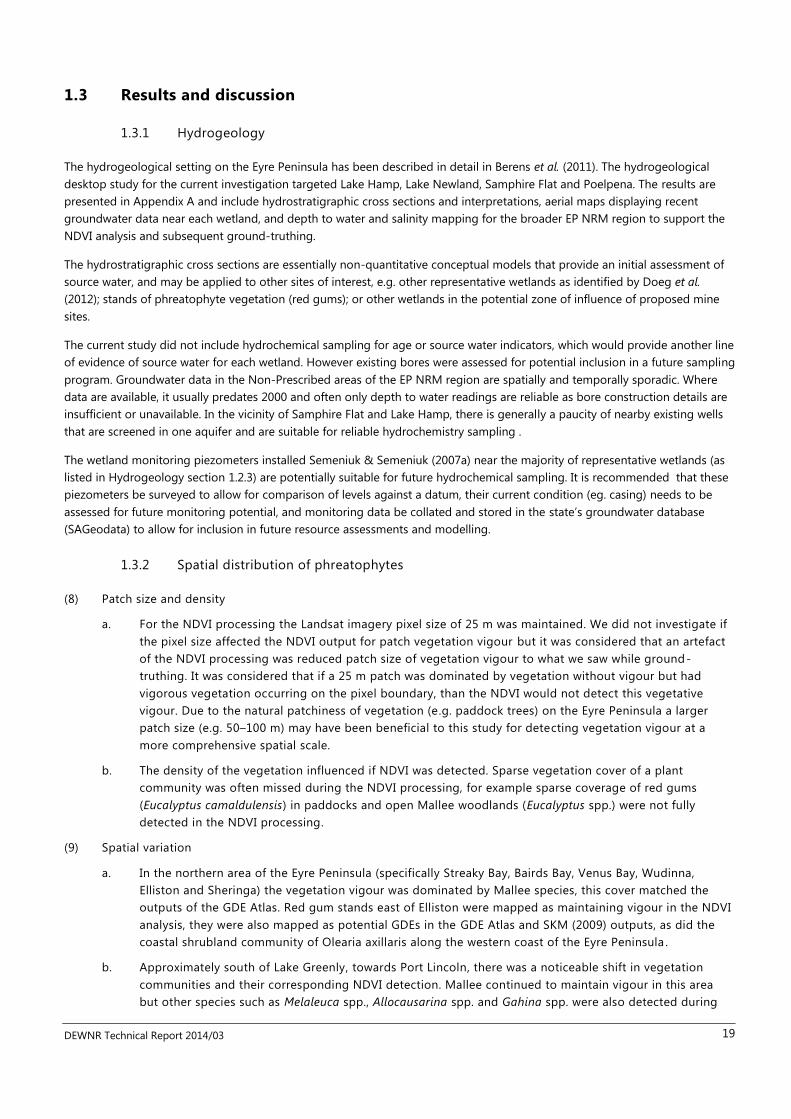
1.3.2 Spatial distribution of phreatophytes
(8) Patch size and density
a. For the NDVI processing the Landsat imagery pixel size of 25 m was maintained. We did not investigate if
the pixel size affected the NDVI output for patch vegetation vigour but it was considered that an artefact
of the NDVI processing was reduced patch size of vegetation vigour to what we saw while ground-
truthing. It was considered that if a 25 m patch was dominated by vegetation without vigour but had
vigorous vegetation occurring on the pixel boundary, than the NDVI would not detect this vegetative
vigour. Due to the natural patchiness of vegetation (e.g. paddock trees) on the Eyre Peninsula a larger
patch size (e.g. 50–100 m) may have been beneficial to this study for detecting vegetation vigour at a
more comprehensive spatial scale.
b. The density of the vegetation influenced if NDVI was detected. Sparse vegetation cover of a plant
community was often missed during the NDVI processing, for example sparse coverage of red gums
(Eucalyptus camaldulensis) in paddocks and open Mallee woodlands (Eucalyptus spp.) were not fully
detected in the NDVI processing.
(9) Spatial variation
a. In the northern area of the Eyre Peninsula (specifically Streaky Bay, Bairds Bay, Venus Bay, Wudinna,
Elliston and Sheringa) the vegetation vigour was dominated by Mallee species, this cover matched the
outputs of the GDE Atlas. Red gum stands east of Elliston were mapped as maintaining vigour in the NDVI
analysis, they were also mapped as potential GDEs in the GDE Atlas and SKM (2009) outputs, as did the
coastal shrubland community of Olearia axillaris along the western coast of the Eyre Peninsula .
b. Approximately south of Lake Greenly, towards Port Lincoln, there was a noticeable shift in vegetation
communities and their corresponding NDVI detection. Mallee continued to maintain vigour in this area
but other species such as Melaleuca spp., Allocausarina spp. and Gahina spp. were also detected during
DEWNR Technical Report 2014/03 20
the NDVI processing. Those species not found on the more northern section of the west coast, such as
sugar gum (Eucalyptus cladocalyx) and blue gum (Eucalyptus petiolaris), were also detected as maintaining
vigour. These findings aligned with the GDE Atlas and SKM (2009)
(10) Topographic occurances
a. Mallee communities characterised by rolling sand-dune landforms tended to detect vegetation vigour just
in the swales, but in some instances vigour was detected across the whole landform i.e. swale, slope and
ridge especially in instances when there was dense vegetation cover across the whole landform.
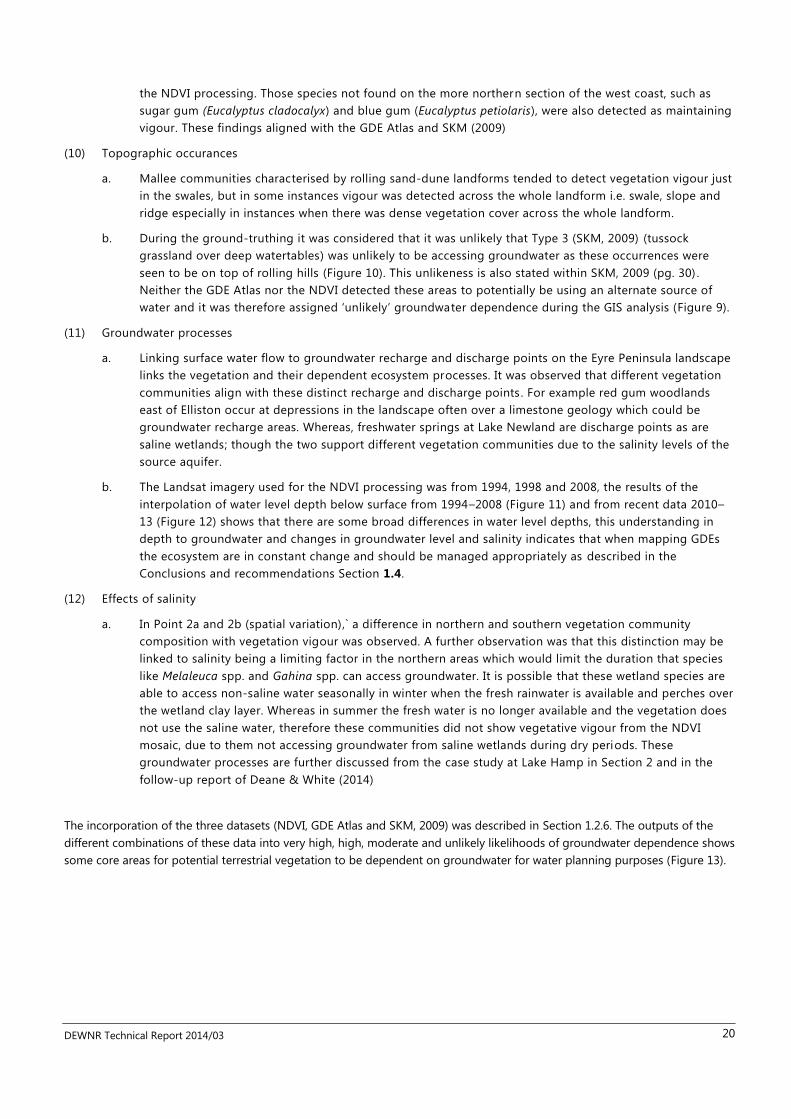
b. During the ground-truthing it was considered that it was unlikely that Type 3 (SKM, 2009) (tussock
grassland over deep watertables) was unlikely to be accessing groundwater as these occurrences were
seen to be on top of rolling hills (Figure 10). This unlikeness is also stated within SKM, 2009 (pg. 30) .
Neither the GDE Atlas nor the NDVI detected these areas to potentially be using an alternate source of
water and it was therefore assigned ‘unlikely’ groundwater dependence during the GIS analysis (Figure 9).
(11) Groundwater processes
a. Linking surface water flow to groundwater recharge and discharge points on the Eyre Peninsula landscape
links the vegetation and their dependent ecosystem processes. It was observed that different vegetation
communities align with these distinct recharge and discharge points . For example red gum woodlands
east of Elliston occur at depressions in the landscape often over a limestone geology which could be
groundwater recharge areas. Whereas, freshwater springs at Lake Newland are discharge points as are
saline wetlands; though the two support different vegetation communities due to the salinity levels of the
source aquifer.
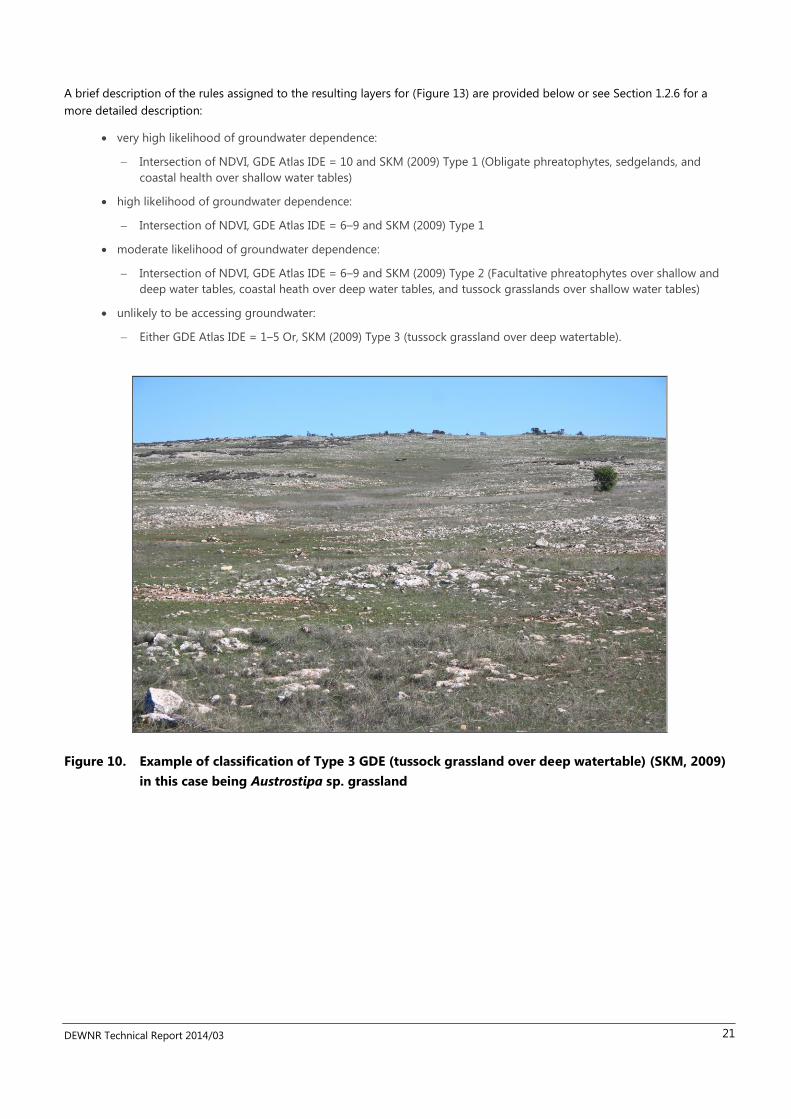
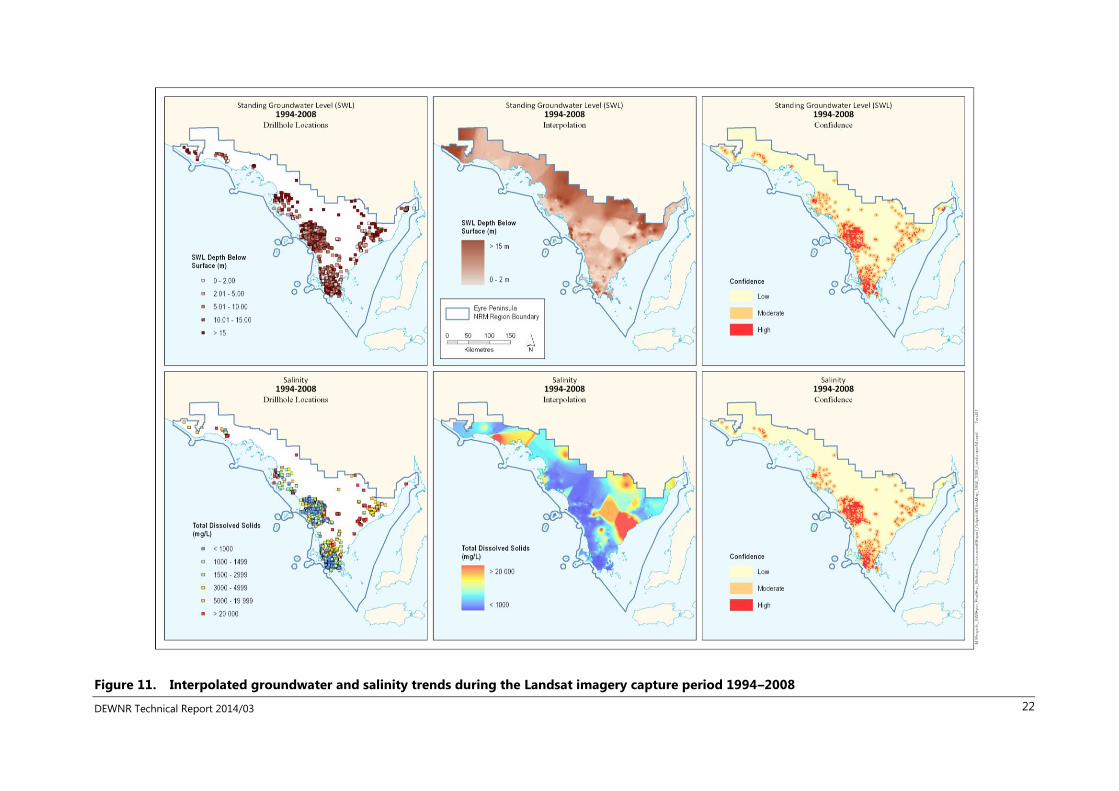
b. The Landsat imagery used for the NDVI processing was from 1994, 1998 and 2008, the results of the
interpolation of water level depth below surface from 1994–2008 (Figure 11) and from recent data 2010–
13 (Figure 12) shows that there are some broad differences in water level depths, this understanding in
depth to groundwater and changes in groundwater level and salinity indicates that when mapping GDEs
the ecosystem are in constant change and should be managed appropriately as described in the
Conclusions and recommendations Section 1.4.
(12) Effects of salinity
a. In Point 2a and 2b (spatial variation),` a difference in northern and southern vegetation community
composition with vegetation vigour was observed. A further observation was that this distinction may be
linked to salinity being a limiting factor in the northern areas which would limit the duration that species
like Melaleuca spp. and Gahina spp. can access groundwater. It is possible that these wetland species are
able to access non-saline water seasonally in winter when the fresh rainwater is available and perches over
the wetland clay layer. Whereas in summer the fresh water is no longer available and the vegetation does
not use the saline water, therefore these communities did not show vegetative vigour from the NDVI
mosaic, due to them not accessing groundwater from saline wetlands during dry periods. These
groundwater processes are further discussed from the case study at Lake Hamp in Section 2 and in the
follow-up report of Deane & White (2014)
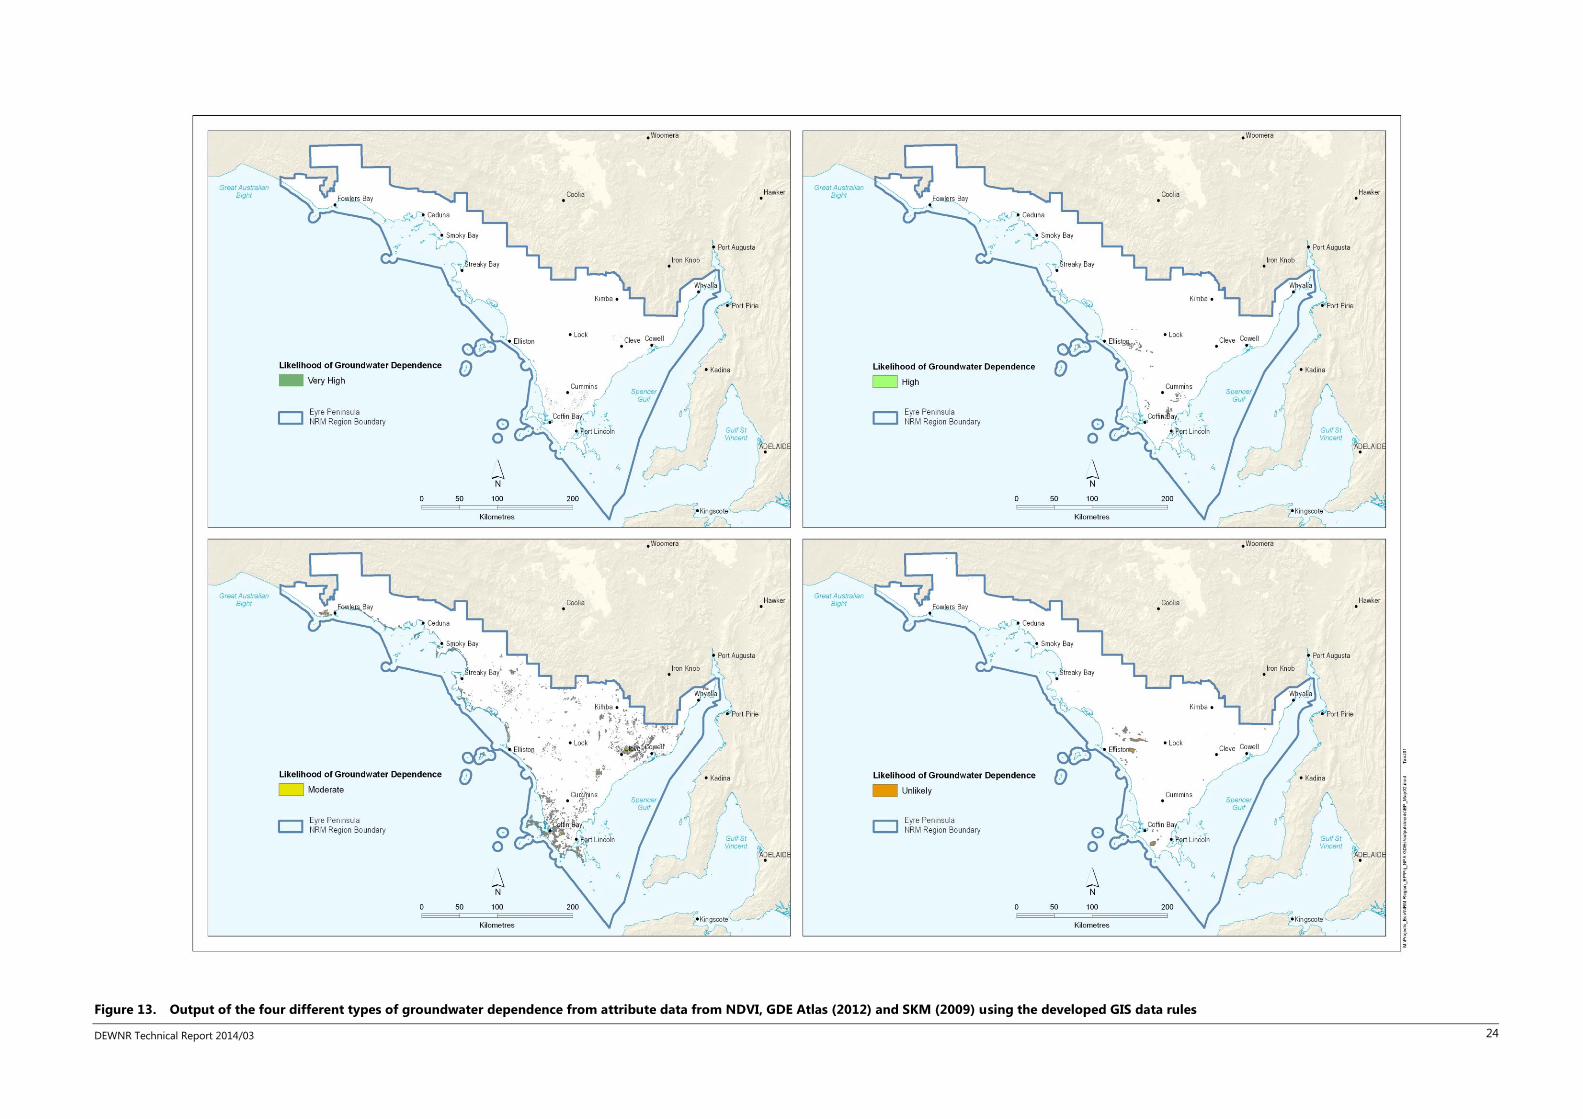
The incorporation of the three datasets (NDVI, GDE Atlas and SKM, 2009) was described in Section 1.2.6. The outputs of the
different combinations of these data into very high, high, moderate and unlikely likelihoods of groundwater dependence shows
some core areas for potential terrestrial vegetation to be dependent on groundwater for water planning purposes (Figure 13).
DEWNR Technical Report 2014/03 21
A brief description of the rules assigned to the resulting layers for (Figure 13) are provided below or see Section 1.2.6 for a
more detailed description:
very high likelihood of groundwater dependence:
Intersection of NDVI, GDE Atlas IDE = 10 and SKM (2009) Type 1 (Obligate phreatophytes, sedgelands, and
coastal health over shallow water tables)
high likelihood of groundwater dependence:
Intersection of NDVI, GDE Atlas IDE = 6–9 and SKM (2009) Type 1
moderate likelihood of groundwater dependence:
Intersection of NDVI, GDE Atlas IDE = 6–9 and SKM (2009) Type 2 (Facultative phreatophytes over shallow and
deep water tables, coastal heath over deep water tables, and tussock grasslands over shallow water tables)
unlikely to be accessing groundwater:
Either GDE Atlas IDE = 1–5 Or, SKM (2009) Type 3 (tussock grassland over deep watertable).
Figure 10. Example of classification of Type 3 GDE (tussock grassland over deep watertable) (SKM, 2009)
in this case being Austrostipa sp. grassland
DEWNR Technical Report 2014/03 22
Figure 11. Interpolated groundwater and salinity trends during the Landsat imagery capture period 1994–2008
DEWNR Technical Report 2014/03 23
Figure 12. A current perspective of interpolated groundwater and salinity levels 2010–13
DEWNR Technical Report 2014/03 24
Figure 13. Output of the four different types of groundwater dependence from attribute data from NDVI, GDE Atlas (2012) and SKM (2009) using the developed GIS data rules
DEWNR Technical Report 2014/03 25
1.4 Conclusion and recommendations
1.4.1 Management of GDEs and phreatophytes
Given the uncertainty of determining whether a GDE is facultative, the following guidelines are suggested:
(1) Assume that all potential GDEs are obligate in the first instance
(2) Work to understand the distribution of groundwater flow systems. GDEs located within local, intermediate or
regional scale flow systems have different risks, values and management options. It is important to determine
their recharge and discharge points (including phreatophytic vegetation) and all GDEs which may rely on the
water from recharge to discharge.
(3) Identify which aquifer systems may be vulnerable to accelerated anthropogenic change. Local systems may be
totally beyond management intervention, while regional scale systems may require multiple approaches.
Recharge areas may be subject to planting; aquifers may be de-watered for mining, or pumped for agriculture.
(4) Characterise the water table dynamics within each of the major flow systems supporting different GDE types
recognising more than one GDE may rely on the same groundwater flow system. This provides a baseline for
assessment of development proposals to determine an appropriate level of impact.
(5) Do not allow a prior designation of the title ‘facultative’ to permit a loss of groundwater availability – whether
facultative or obligate, the ecosystem will likely change as a result of its loss (Hatton & Evans 1997; Murray et al.
2003; Eamus et al. 2006).
1.4.2 Monitoring
Many of the indicators that may provide an early warning of stress such as water potentials require specialist equipment and
training. There is also a need to establish the natural range in values of such indicators over a number of years in order that
deviations of concern will be able to be identified.
1.4.2.1 Site selection for future studies of Environmental Water Requirements (EWRs)
Careful consideration should be given to site selection to ensure the full range of water availability can be sampled. The aim is
to determine the variations in groundwater dynamics that lead to differences in vegetation from obligate wetland species
through to those which are purely terrestrial. Hence an ideal site needs a largely undisturbed vegetation cover across an
elevation gradient that exhibits such a turnover in vegetation types. Such sites may be difficult to locate on the Eyre Peninsula
owing to the limited topographic variation and the high rates of historical land clearance. At the Lake Hamp (Section 2 case
study) for instance, there is a limit to the information that can be gained, because the upper limit to the wetland extent has
been obscured by the presence of roads and agricultural land. These peripheral areas are often heavily cleared, because they
are also suitable for cultivation, but are important for understanding of aquatic plant communities as they represent the driest
areas where wetland plants can survive.
In wetland systems on the Eyre Peninsula, salinity appears to be the major driver at the bottom end of the gradient, the point
where water depth does not seem to determine zonation. A freshwater wetland would not have such limitations and the
method could easily be directly employed in wetlands of depth up to one metre. Recommendations for future sites are
constrained by the availability of water table data, but ideal sites would have the following characteristics:
At least 3–5 years of water table data recorded at least quarterly, preferably monthly.
A number of observation wells placed at the lowest point and at higher points along the dominant elevation gradient
(note the range of water table variations observed should overlap – that is, when a higher gradient position well is dry the
next lowest observation wells should be within its measurement range).
Adjacent to the observation wells vegetation should grade naturally from terrestrial to wetland species – this need not be
pristine native vegetation at the terrestrial end, it can be agricultural plants.
A range of sites across the salinity gradient is ideal, but owing to their rarity and relative diversity freshwater wetlands are
of very high value.

DEWNR Technical Report 2014/03 26
A range of wetland functional groups and life forms (tree, shrub, groundcovers) should be available. Pest plants are no
disadvantage (unless a monocover) and gathering information of the water tolerance of these species can provide
valuable insights for those seeking some level of control via the maintenance of optimal water table dynamics.
This project also undertook a case study on the interaction of water table dynamics and vegetation zonation, which can be
found in Section 2. On a second field trip this assessment of wetland groundwater and vegetation dynamics was continued and
these findings have been reported with a more detailed methodology for undertaking a monitoring program on the Eyre
Peninsula in relation to wetlands and phreatopyhtes (Deane & White 2014).
DEWNR Technical Report 2014/03 27
2 Case study: The interaction of water table
dynamics and vegetation zonation at Lake
Hamp
2.1 Summary
Data were collected on vegetation-elevation relationships at Lake Hamp (near Elliston – See Section 3 maps) where a five year
period of monthly depth to water table data were available. Lake Hamp littoral vegetation shows a limited degree of zonation
within the narrow fringing vegetation band, owing to the small topographic (and therefore water availability) variations over
the surveyed area. The elevation range of the dominant canopy species Melaleuca halmaturorum supports a water regime
within that previously described as constraining the species at the low (‘too deep’) end of the water availability gradient.
Complete interpretation of the zonation observed at the site requires additional information on trends in salinity in addition to
water level. Variations in salinity over the root zone appear to interact with water availability to limit the establishment of non-
halophyte vegetation within the Lake bed itself. The site proved unsuitable for the estimation of upper (‘too dry’) limits owing
to the low variation in elevation relief. The presence of a boundary road and land cleared for agriculture truncated the gradient
masking natural zonation patterns. The methods employed are straightforward and well established in the scientific literature.
These are thought to be applicable to the development of defined hydrological niche dimensions for water dependent
vegetation in the region provided a site with an intact gradient from terrestrial to aquatic/amphibious vegetation can be
identified.
2.2 Introduction
Water regime is well established as exerting a key control over wetland and groundwater dependent vegetation. The concept
of the hydrological niche (Silvertown et al. 1999) holds that a major driver of wetland plant diversity is the variation in the range
of water availability. The more variable the range of conditions at a given site, the broader the niche space, allowing species
with diverse adaptation to co-exist without competitive elimination (Silvertown et al. 1999).
The grouping of aquatic plants into those with a similar tolerance for different depth-duration combinations is an approach
that aids interpretation of functional relationships and different classification systems exist. The currently predominant
classification in southern Australia is attributable to Brock & Casanova (1997) and known as ‘plant functional groups’ (Casanova
& Brock 2000; Casanova 2011). This classification includes both recruitment and maintenance requirements and well adapted
for use in natural resource management research questions.
If managers are to maintain the diversity of vegetation communities of water dependent ecosystems, the maintenance of water
regimes to support the extant range of functional groups is essential. The aim of this pilot study was to trial a method to link
groundwater level data to existing vegetation by recording the elevation preference for key species. By linking the ground level
where plants are found to the water table dynamics data, an indication of the preferred water regime can be obtained.
2.3 Methodology
Vegetation on the north and south bank of Lake Hamp were surveyed with a differential global positioning system (dGPS –
Trimble R8) employing real time kinematic survey (RTK). Indicative accuracy of the instrument in the vertical is between 10 and
20 mm. A 100 m baseline was established along the northern bank of Lake Hamp, adjacent to the location of two monitoring
wells. Ten transects were randomly positioned along the baseline (spaced for a minimum distance of 5 m, to attain a level of
independence based on the typical canopy width of the dominant cover Melaleuca halmaturorum). Elevation data points were
recorded at spacing to limit any potential spatial correlation (notionally 5 linear metres or 0.2 m elevation increments) along
transects and vegetation rooted within 0.5m either side of the data point at the same elevation was recorded. Raw data
DEWNR Technical Report 2014/03 28
collected are presence/absence of vegetation for a given observed elevation. Summary statistics were generated for the range
of elevations where each species was recorded. For the dominant species (M. halmaturorum) adequate data points were
available to fit a quadratic logistic regression that enables probabilistic distribution of elevation preference to be estimated.
The summary elevation distribution data for M. halmaturorum were converted to water table variation and compared with
published water requirements. Key characteristics of the water table were also determined from the time series.
To relate vegetation to water table dynamics as cumulative frequency distribution was plotted for groundwater level. This is
analogous to a flow duration curve for streamflow and provides an indication of the percentage of time the depth to water
exceeds a given value. By adjusting this curve by the observed elevation of groundwater dependent plants relative to the water
table, the curve becomes a graph of the water requirement depth-duration domain.
2.4 Results
2.4.1 Water table dynamics
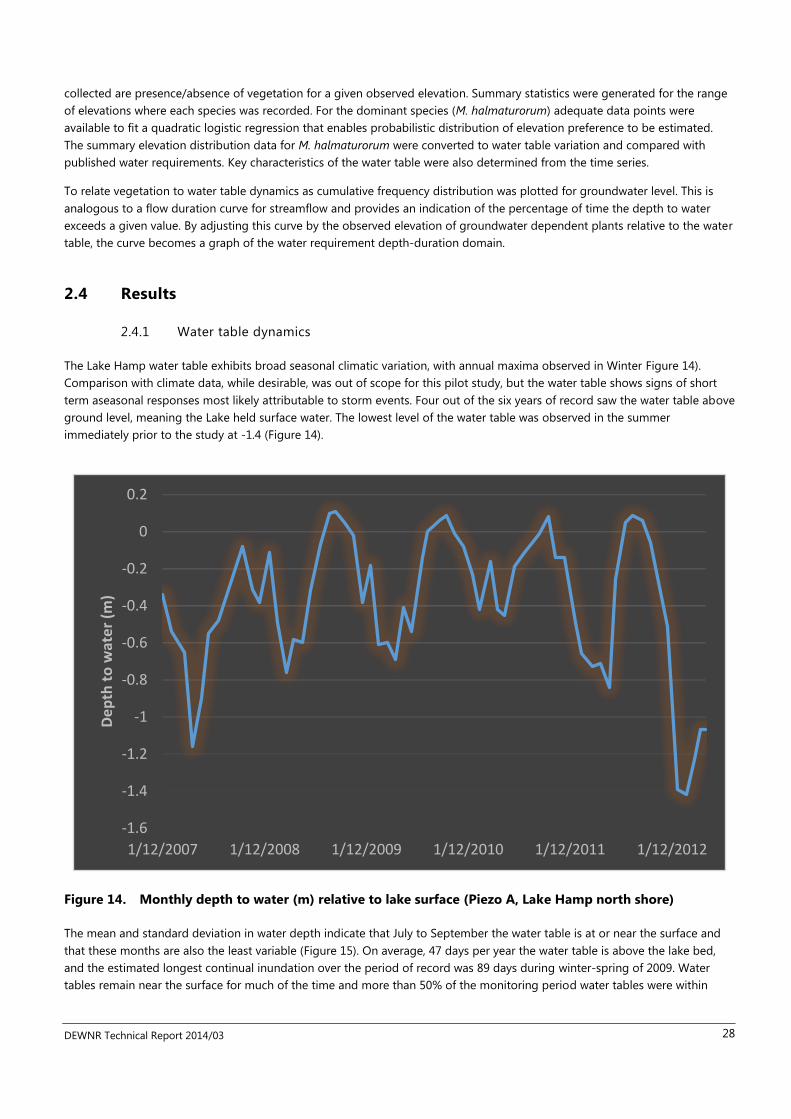
The Lake Hamp water table exhibits broad seasonal climatic variation, with annual maxima observed in Winter Figure 14).
Comparison with climate data, while desirable, was out of scope for this pilot study, but the water table shows signs of short
term aseasonal responses most likely attributable to storm events. Four out of the six years of record saw the water table above
ground level, meaning the Lake held surface water. The lowest level of the water table was observed in the summer
immediately prior to the study at -1.4 (Figure 14).
-1.6
-1.4
-1.2
-1
-0.8
-0.6
-0.4
-0.2
0
0.2
1/12/2007 1/12/2008 1/12/2009 1/12/2010 1/12/2011 1/12/2012
De
pth
to
wa
ter
(m)
Figure 14. Monthly depth to water (m) relative to lake surface (Piezo A, Lake Hamp north shore)
The mean and standard deviation in water depth indicate that July to September the water table is at or near the surface and
that these months are also the least variable (Figure 15). On average, 47 days per year the water table is above the lake bed,
and the estimated longest continual inundation over the period of record was 89 days during winter-spring of 2009. Water
tables remain near the surface for much of the time and more than 50% of the monitoring period water tables were within
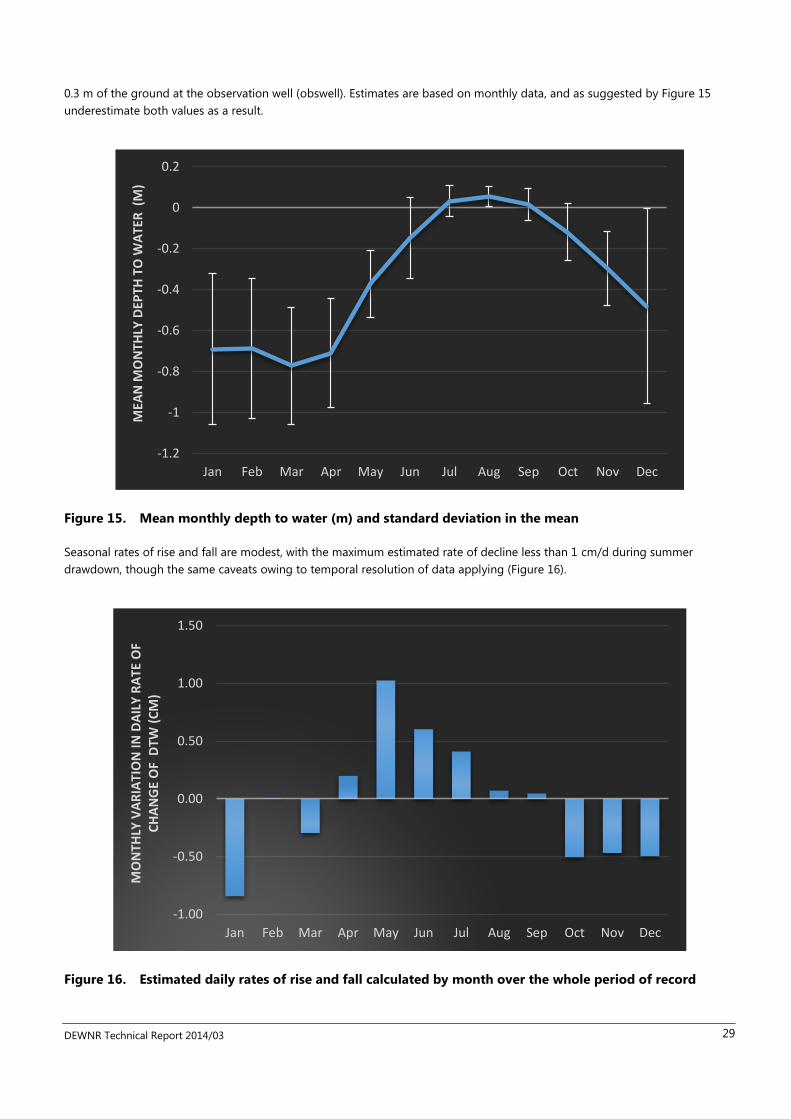
DEWNR Technical Report 2014/03 29
0.3 m of the ground at the observation well (obswell). Estimates are based on monthly data, and as suggested by Figure 15
underestimate both values as a result.
-1.2
-1
-0.8
-0.6
-0.4
-0.2
0
0.2
Jan Feb Mar Apr May Jun Jul Aug Sep Oct Nov Dec
MEA
N M
ON
THLY
DEP
TH T
O W
ATE
R (
M)
Figure 15. Mean monthly depth to water (m) and standard deviation in the mean
Seasonal rates of rise and fall are modest, with the maximum estimated rate of decline less than 1 cm/d during summer
drawdown, though the same caveats owing to temporal resolution of data applying (Figure 16).
-1.00
-0.50
0.00
0.50
1.00
1.50
Jan Feb Mar Apr May Jun Jul Aug Sep Oct Nov Dec
MO
NTH
LY V
AR
IATI
ON
IN
DA
ILY
RA
TE O
F C
HA
NG
E O
F D
TW (
CM
)
Figure 16. Estimated daily rates of rise and fall calculated by month over the whole period of record
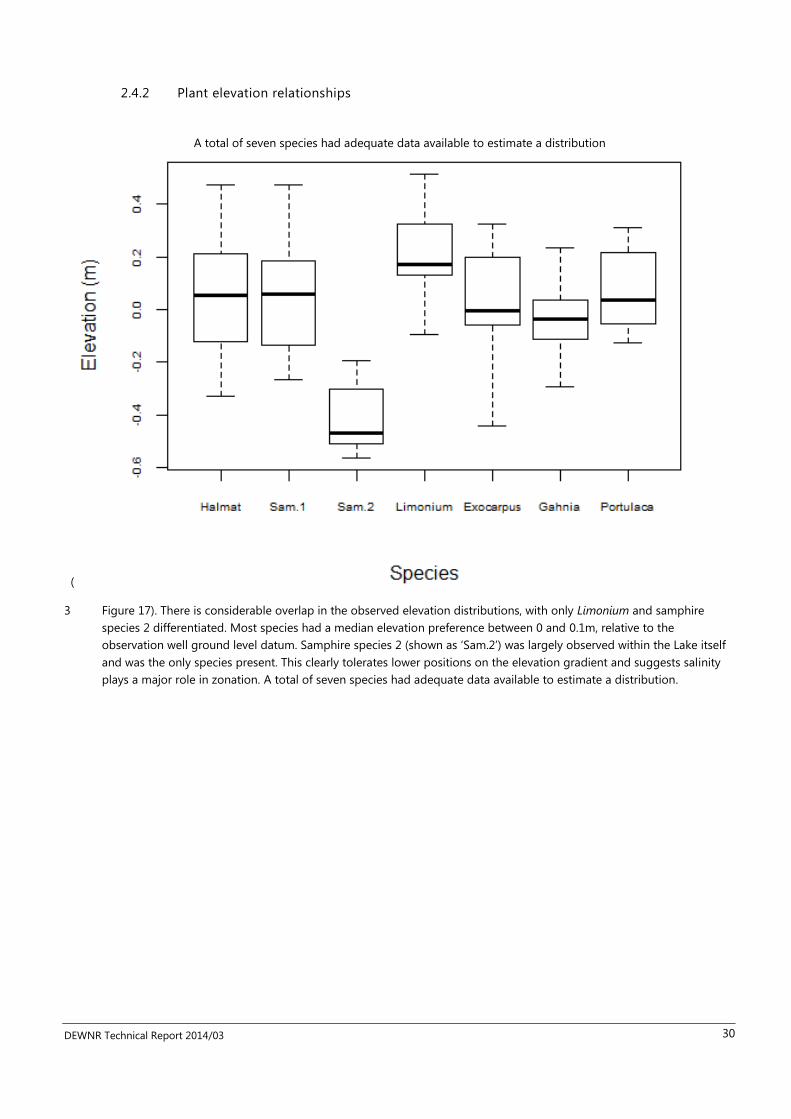
DEWNR Technical Report 2014/03 30
2.4.2 Plant elevation relationships
A total of seven species had adequate data available to estimate a distribution
(
3 Figure 17). There is considerable overlap in the observed elevation distributions, with only Limonium and samphire
species 2 differentiated. Most species had a median elevation preference between 0 and 0.1m, relative to the
observation well ground level datum. Samphire species 2 (shown as ‘Sam.2’) was largely observed within the Lake itself
and was the only species present. This clearly tolerates lower positions on the elevation gradient and suggests salinity
plays a major role in zonation. A total of seven species had adequate data available to estimate a distribution.
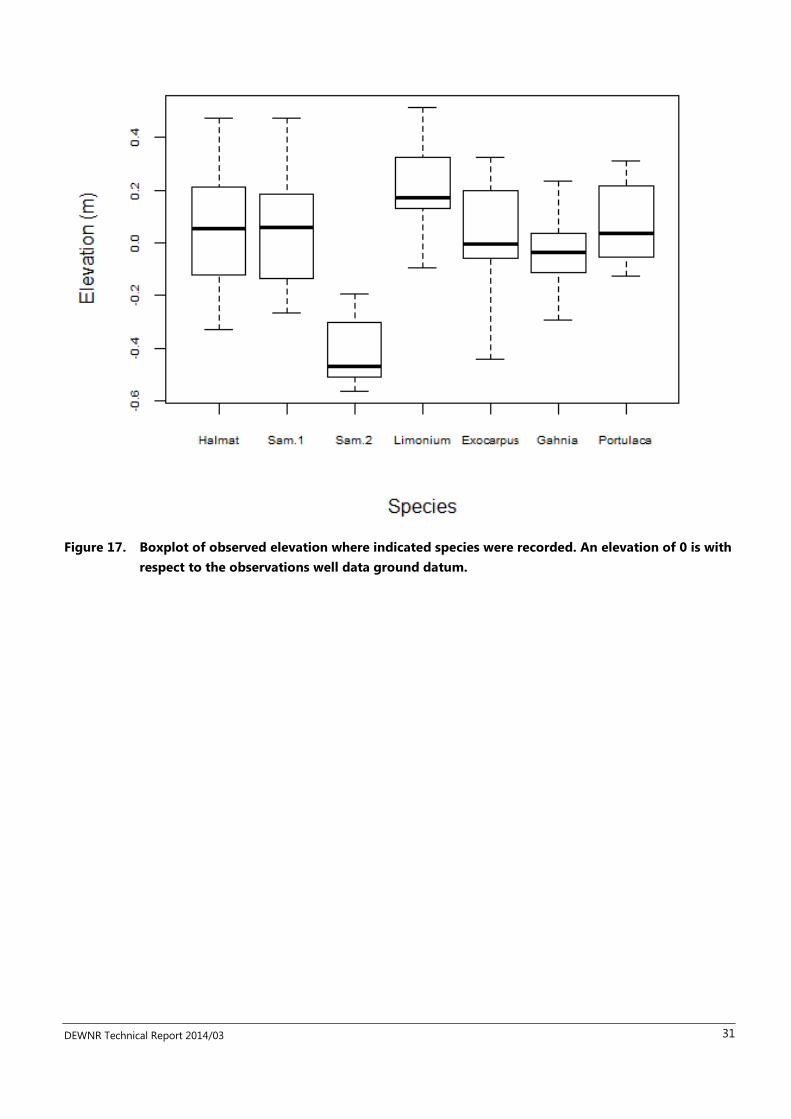
DEWNR Technical Report 2014/03 31
Figure 17. Boxplot of observed elevation where indicated species were recorded. An elevation of 0 is with
respect to the observations well data ground datum.
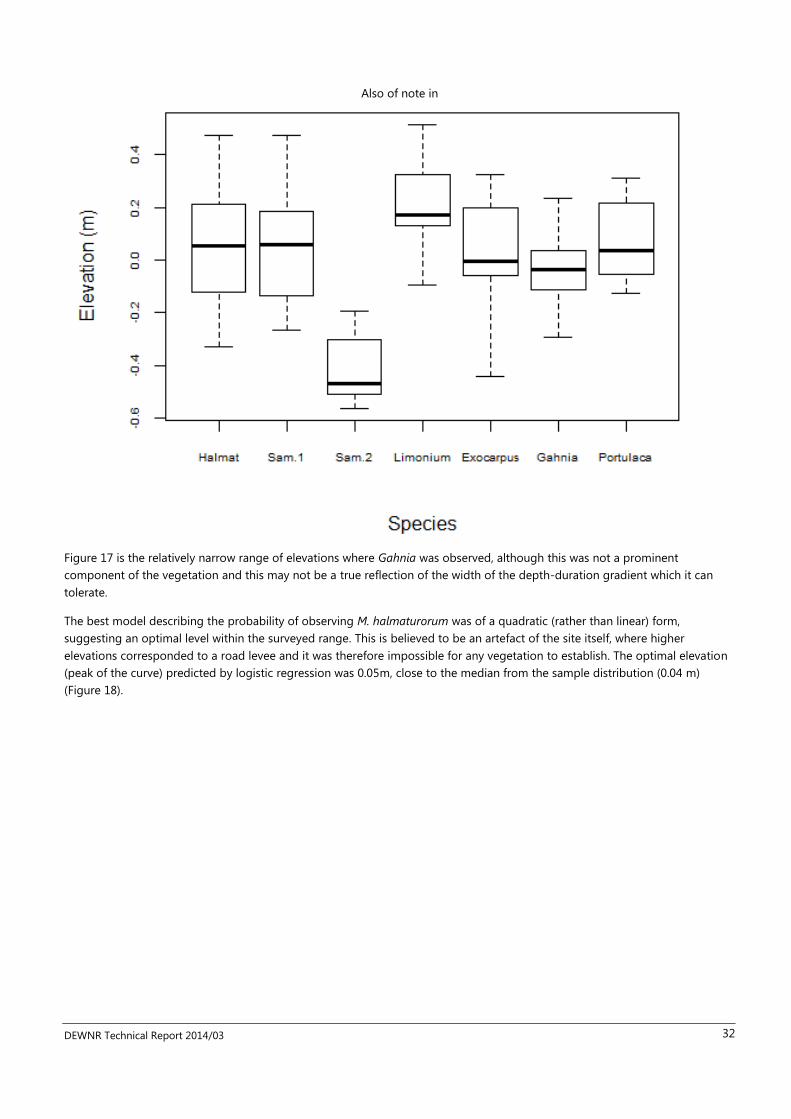
DEWNR Technical Report 2014/03 32
Also of note in
Figure 17 is the relatively narrow range of elevations where Gahnia was observed, although this was not a prominent
component of the vegetation and this may not be a true reflection of the width of the depth-duration gradient which it can
tolerate.
The best model describing the probability of observing M. halmaturorum was of a quadratic (rather than linear) form,
suggesting an optimal level within the surveyed range. This is believed to be an artefact of the site itself, where higher
elevations corresponded to a road levee and it was therefore impossible for any vegetation to establish. The optimal elevation
(peak of the curve) predicted by logistic regression was 0.05m, close to the median from the sample distribution (0.04 m)
(Figure 18).
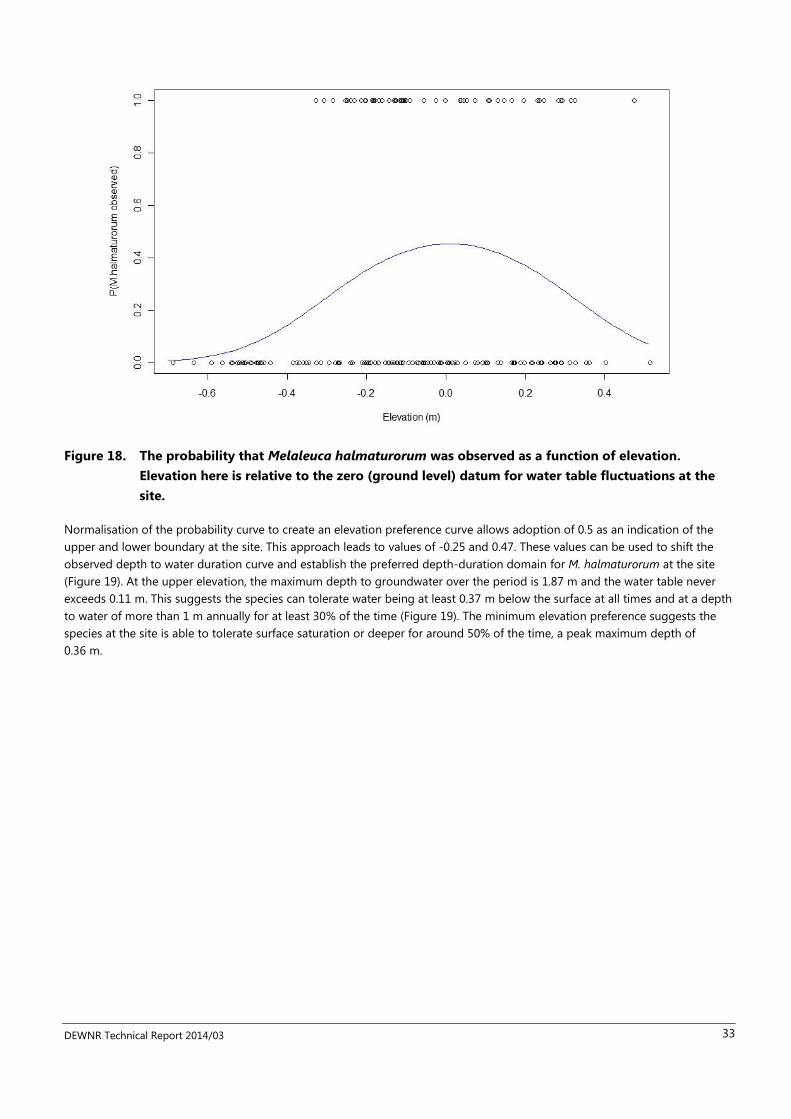
DEWNR Technical Report 2014/03 33
Figure 18. The probability that Melaleuca halmaturorum was observed as a function of elevation.
Elevation here is relative to the zero (ground level) datum for water table fluctuations at the
site.
Normalisation of the probability curve to create an elevation preference curve allows adoption of 0.5 as an indication of the
upper and lower boundary at the site. This approach leads to values of -0.25 and 0.47. These values can be used to shift the
observed depth to water duration curve and establish the preferred depth-duration domain for M. halmaturorum at the site
(Figure 19). At the upper elevation, the maximum depth to groundwater over the period is 1.87 m and the water table never
exceeds 0.11 m. This suggests the species can tolerate water being at least 0.37 m below the surface at all times and at a depth
to water of more than 1 m annually for at least 30% of the time (Figure 19). The minimum elevation preference suggests the
species at the site is able to tolerate surface saturation or deeper for around 50% of the time, a peak maximum depth of
0.36 m.
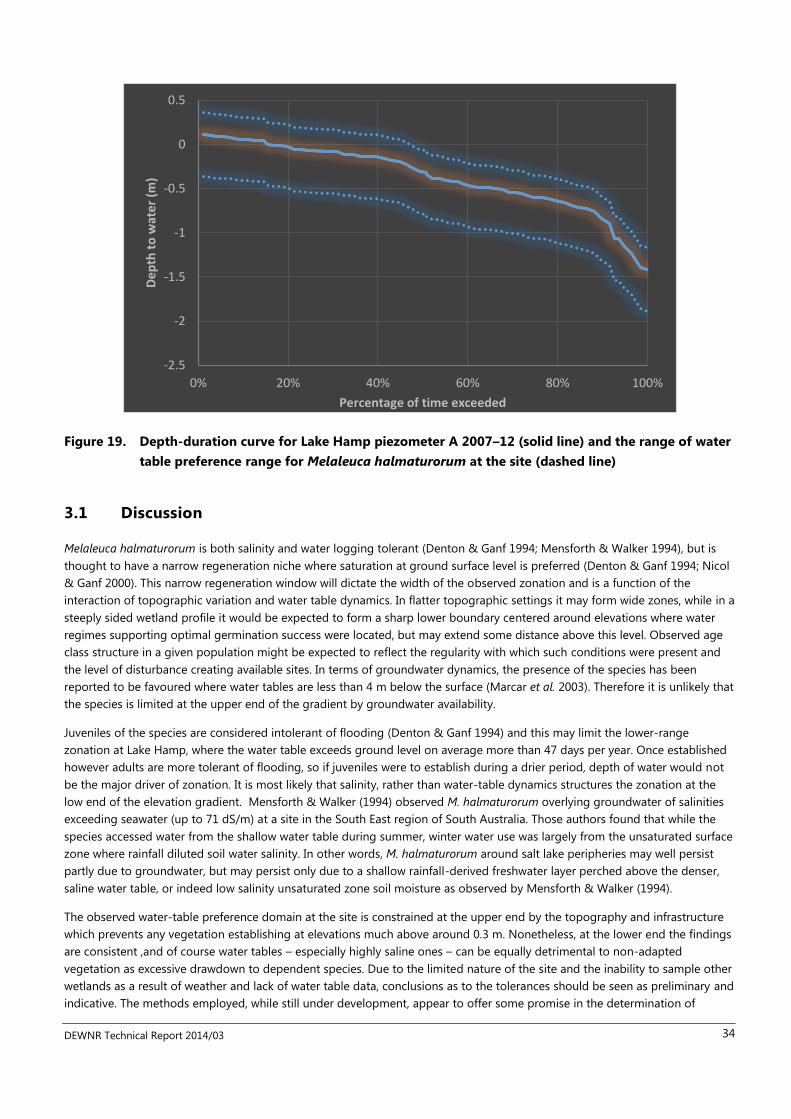
DEWNR Technical Report 2014/03 34
-2.5
-2
-1.5
-1
-0.5
0
0.5
0% 20% 40% 60% 80% 100%
De
pth
to
wat
er
(m)
Percentage of time exceeded
Figure 19. Depth-duration curve for Lake Hamp piezometer A 2007–12 (solid line) and the range of water
table preference range for Melaleuca halmaturorum at the site (dashed line)
3.1 Discussion
Melaleuca halmaturorum is both salinity and water logging tolerant (Denton & Ganf 1994; Mensforth & Walker 1994), but is
thought to have a narrow regeneration niche where saturation at ground surface level is preferred (Denton & Ganf 1994; Nicol
& Ganf 2000). This narrow regeneration window will dictate the width of the observed zonation and is a function of the
interaction of topographic variation and water table dynamics. In flatter topographic settings it may form wide zones, while in a
steeply sided wetland profile it would be expected to form a sharp lower boundary centered around elevations where water
regimes supporting optimal germination success were located, but may extend some distance above this level. Observed age
class structure in a given population might be expected to reflect the regularity with which such conditions were present and
the level of disturbance creating available sites. In terms of groundwater dynamics, the presence of the species has been
reported to be favoured where water tables are less than 4 m below the surface (Marcar et al. 2003). Therefore it is unlikely that
the species is limited at the upper end of the gradient by groundwater availability.
Juveniles of the species are considered intolerant of flooding (Denton & Ganf 1994) and this may limit the lower-range
zonation at Lake Hamp, where the water table exceeds ground level on average more than 47 days per year. Once established
however adults are more tolerant of flooding, so if juveniles were to establish during a drier period, depth of water would not
be the major driver of zonation. It is most likely that salinity, rather than water-table dynamics structures the zonation at the
low end of the elevation gradient. Mensforth & Walker (1994) observed M. halmaturorum overlying groundwater of salinities
exceeding seawater (up to 71 dS/m) at a site in the South East region of South Australia. Those authors found that while the
species accessed water from the shallow water table during summer, winter water use was largely from the unsaturated surface
zone where rainfall diluted soil water salinity. In other words, M. halmaturorum around salt lake peripheries may well persist
partly due to groundwater, but may persist only due to a shallow rainfall-derived freshwater layer perched above the denser,
saline water table, or indeed low salinity unsaturated zone soil moisture as observed by Mensforth & Walker (1994).
The observed water-table preference domain at the site is constrained at the upper end by the topography and infrastructure
which prevents any vegetation establishing at elevations much above around 0.3 m. Nonetheless, at the lower end the findings
are consistent ,and of course water tables – especially highly saline ones – can be equally detrimental to non-adapted
vegetation as excessive drawdown to dependent species. Due to the limited nature of the site and the inability to sample other
wetlands as a result of weather and lack of water table data, conclusions as to the tolerances should be seen as preliminary and
indicative. The methods employed, while still under development, appear to offer some promise in the determination of
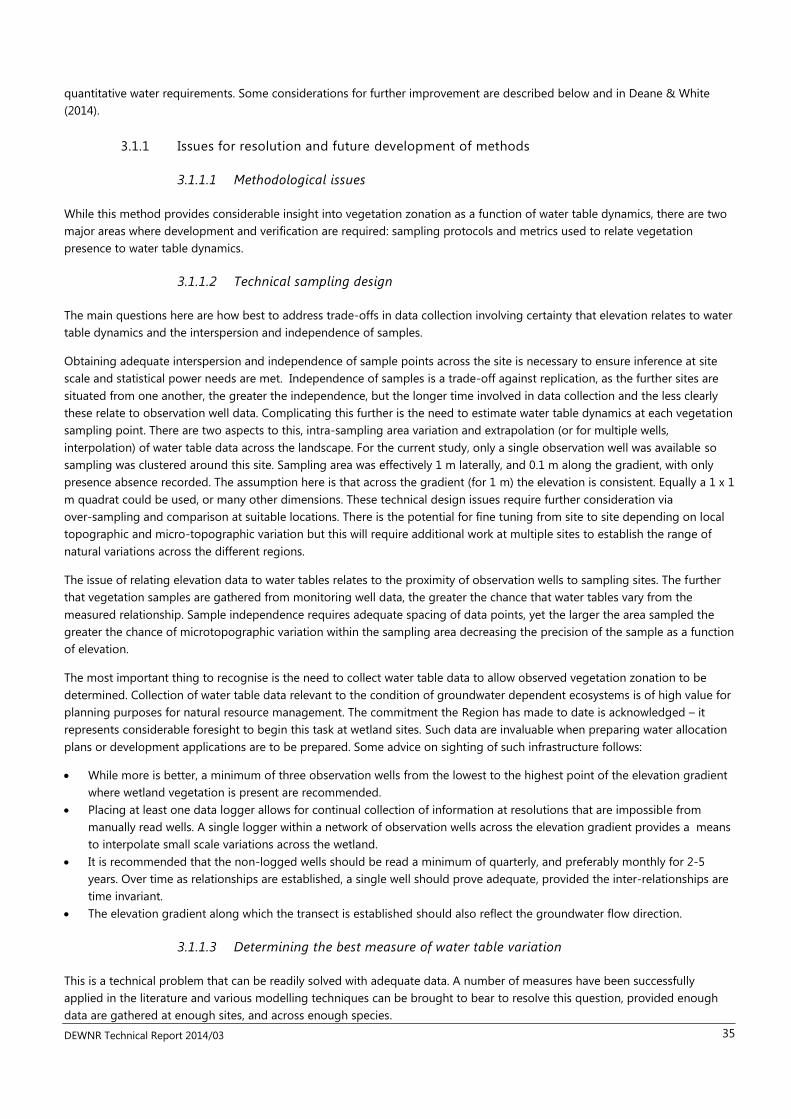
DEWNR Technical Report 2014/03 35
quantitative water requirements. Some considerations for further improvement are described below and in Deane & White
(2014).
3.1.1 Issues for resolution and future development of methods
3.1.1.1 Methodological issues
While this method provides considerable insight into vegetation zonation as a function of water table dynamics, there are two
major areas where development and verification are required: sampling protocols and metrics used to relate vegetation
presence to water table dynamics.
3.1.1.2 Technical sampling design
The main questions here are how best to address trade-offs in data collection involving certainty that elevation relates to water
table dynamics and the interspersion and independence of samples.
Obtaining adequate interspersion and independence of sample points across the site is necessary to ensure inference at site
scale and statistical power needs are met. Independence of samples is a trade-off against replication, as the further sites are
situated from one another, the greater the independence, but the longer time involved in data collection and the less clearly
these relate to observation well data. Complicating this further is the need to estimate water table dynamics at each vegetation
sampling point. There are two aspects to this, intra-sampling area variation and extrapolation (or for multiple wells,
interpolation) of water table data across the landscape. For the current study, only a single observation well was available so
sampling was clustered around this site. Sampling area was effectively 1 m laterally, and 0.1 m along the gradient, with only
presence absence recorded. The assumption here is that across the gradient (for 1 m) the elevation is consistent. Equally a 1 x 1
m quadrat could be used, or many other dimensions. These technical design issues require further consideration via
over-sampling and comparison at suitable locations. There is the potential for fine tuning from site to site depending on local
topographic and micro-topographic variation but this will require additional work at multiple sites to establish the range of
natural variations across the different regions.
The issue of relating elevation data to water tables relates to the proximity of observation wells to sampling sites. The further
that vegetation samples are gathered from monitoring well data, the greater the chance that water tables vary from the
measured relationship. Sample independence requires adequate spacing of data points, yet the larger the area sampled the
greater the chance of microtopographic variation within the sampling area decreasing the precision of the sample as a function
of elevation.
The most important thing to recognise is the need to collect water table data to allow observed vegetation zonation to be
determined. Collection of water table data relevant to the condition of groundwater dependent ecosystems is of high value for
planning purposes for natural resource management. The commitment the Region has made to date is acknowledged – it
represents considerable foresight to begin this task at wetland sites. Such data are invaluable when preparing water allocation
plans or development applications are to be prepared. Some advice on sighting of such infrastructure follows:
While more is better, a minimum of three observation wells from the lowest to the highest point of the elevation gradient
where wetland vegetation is present are recommended.
Placing at least one data logger allows for continual collection of information at resolutions that are impossible from
manually read wells. A single logger within a network of observation wells across the elevation gradient provides a means
to interpolate small scale variations across the wetland.
It is recommended that the non-logged wells should be read a minimum of quarterly, and preferably monthly for 2-5
years. Over time as relationships are established, a single well should prove adequate, provided the inter-relationships are
time invariant.
The elevation gradient along which the transect is established should also reflect the groundwater flow direction.
3.1.1.3 Determining the best measure of water table variation
This is a technical problem that can be readily solved with adequate data. A number of measures have been successfully
applied in the literature and various modelling techniques can be brought to bear to resolve this question, provided enough
data are gathered at enough sites, and across enough species.

DEWNR Technical Report 2014/03 36
4 Appendix
A. Hydrogeological desktop study results
Hydrostratigraphic cross-sections and recent groundwater data
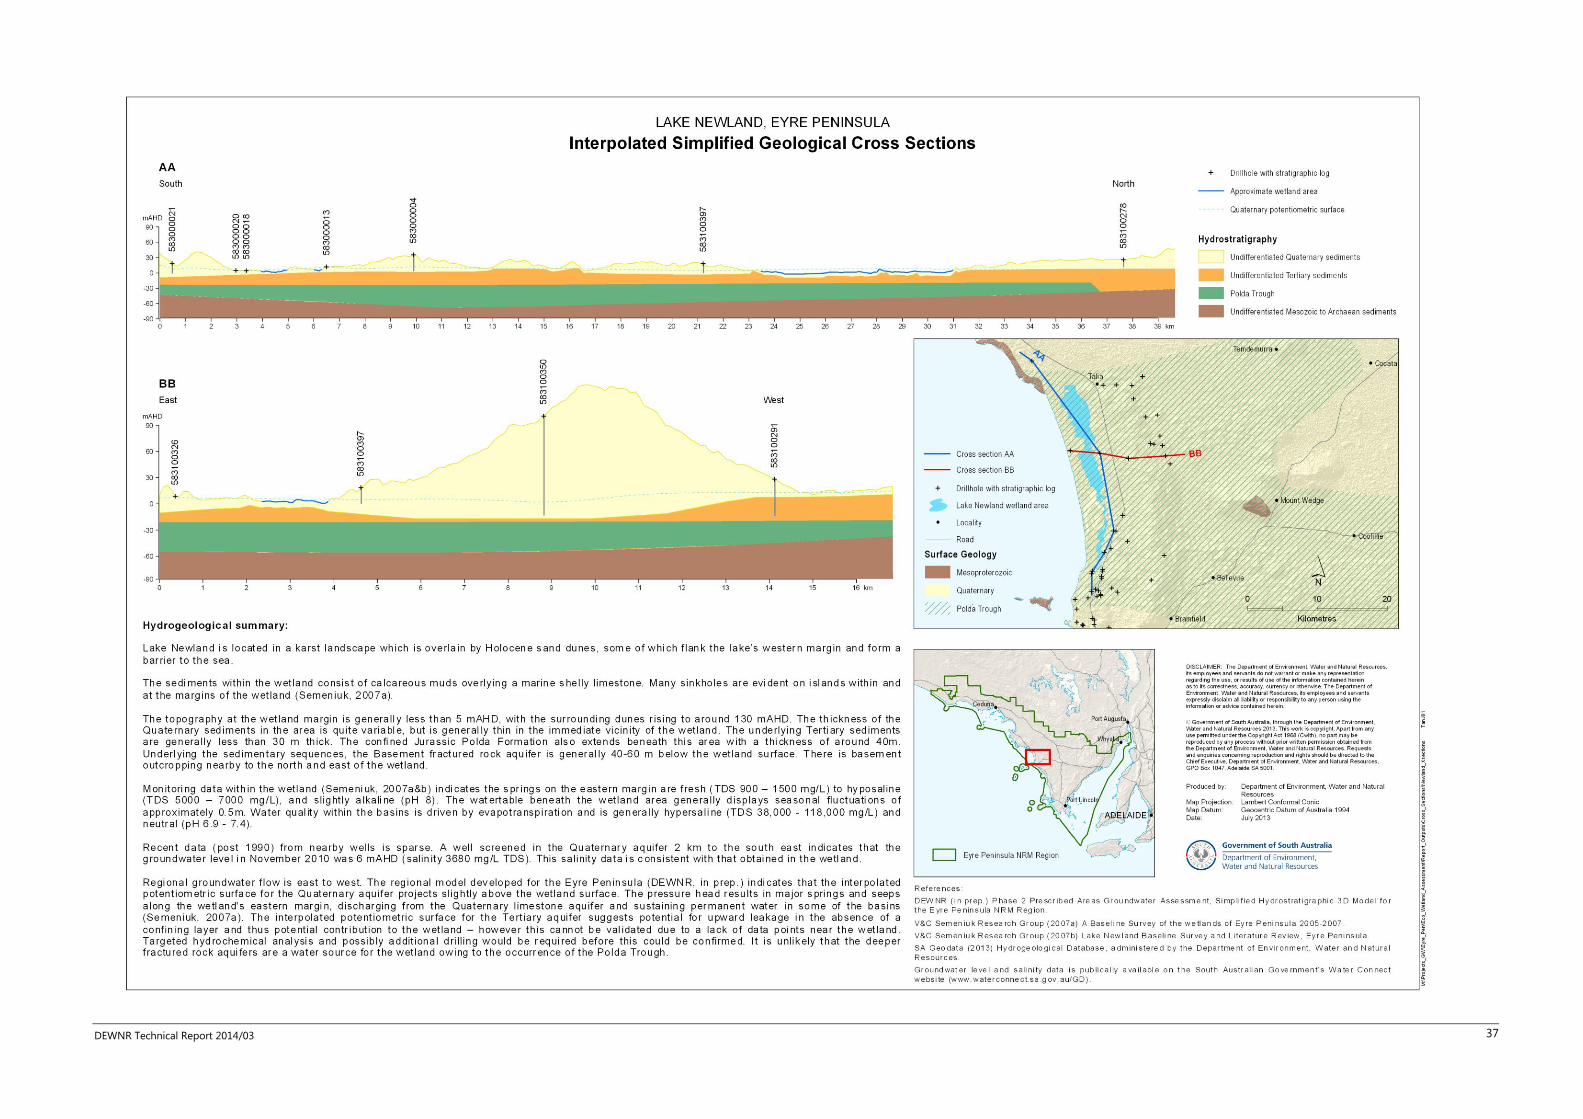
DEWNR Technical Report 2014/03 37
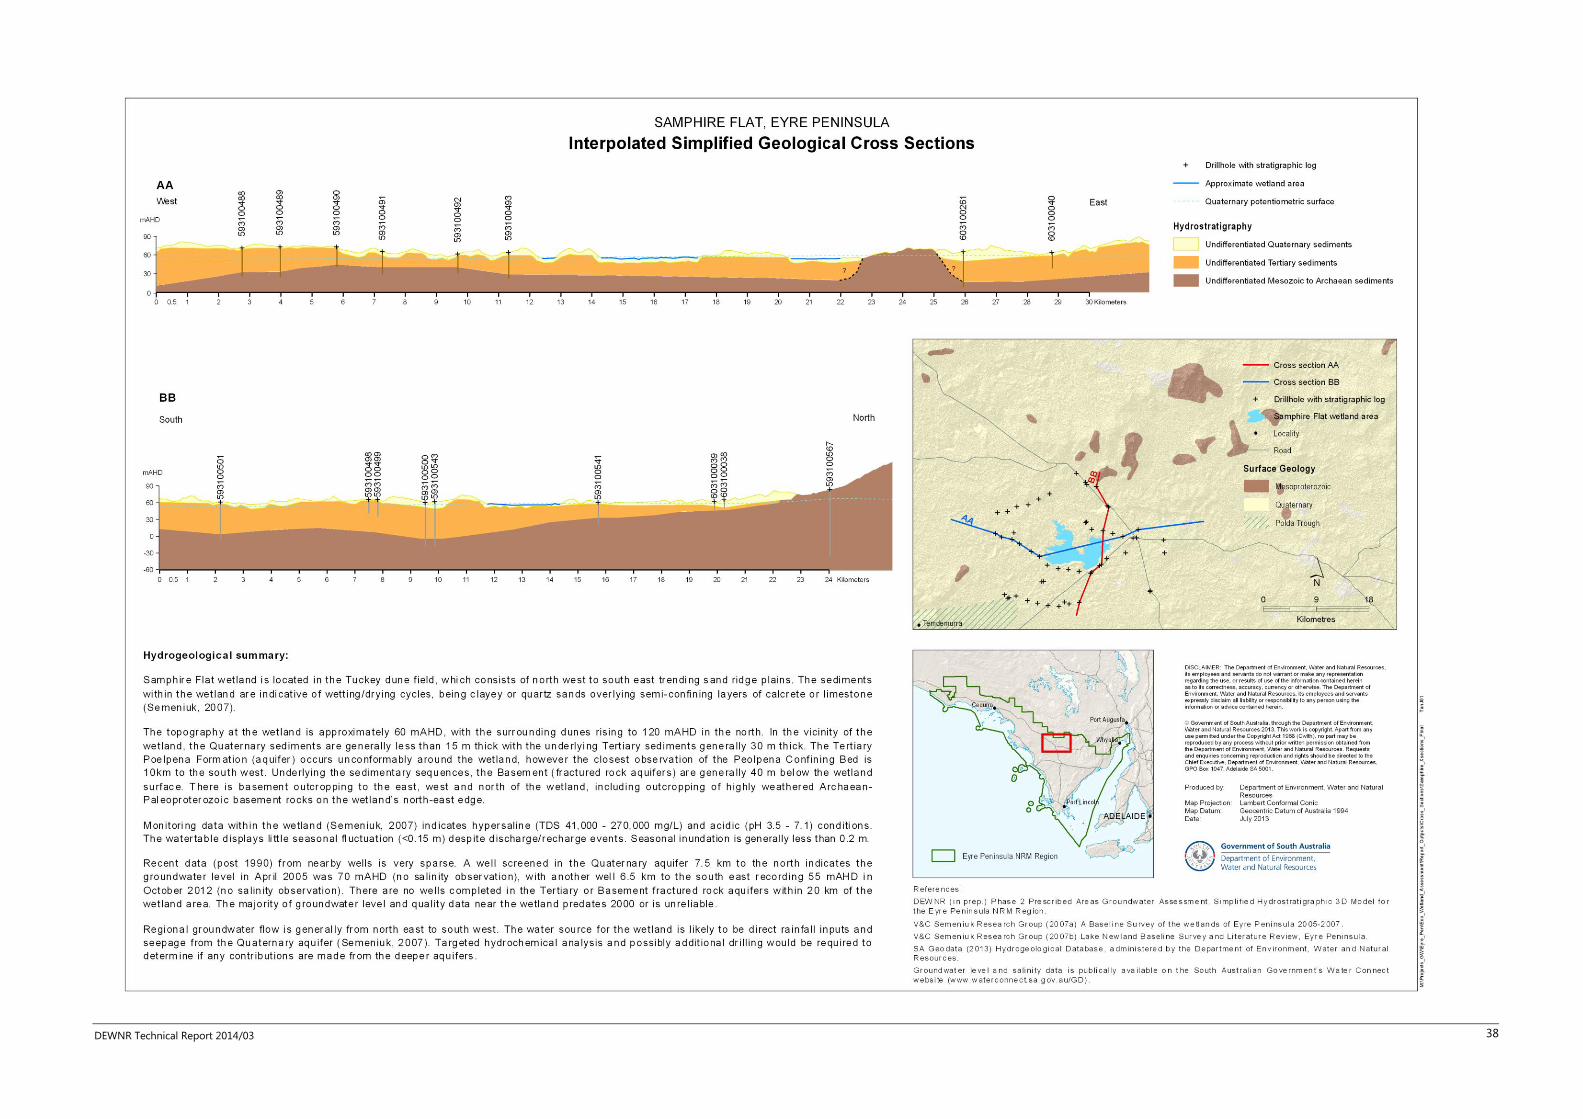
DEWNR Technical Report 2014/03 38
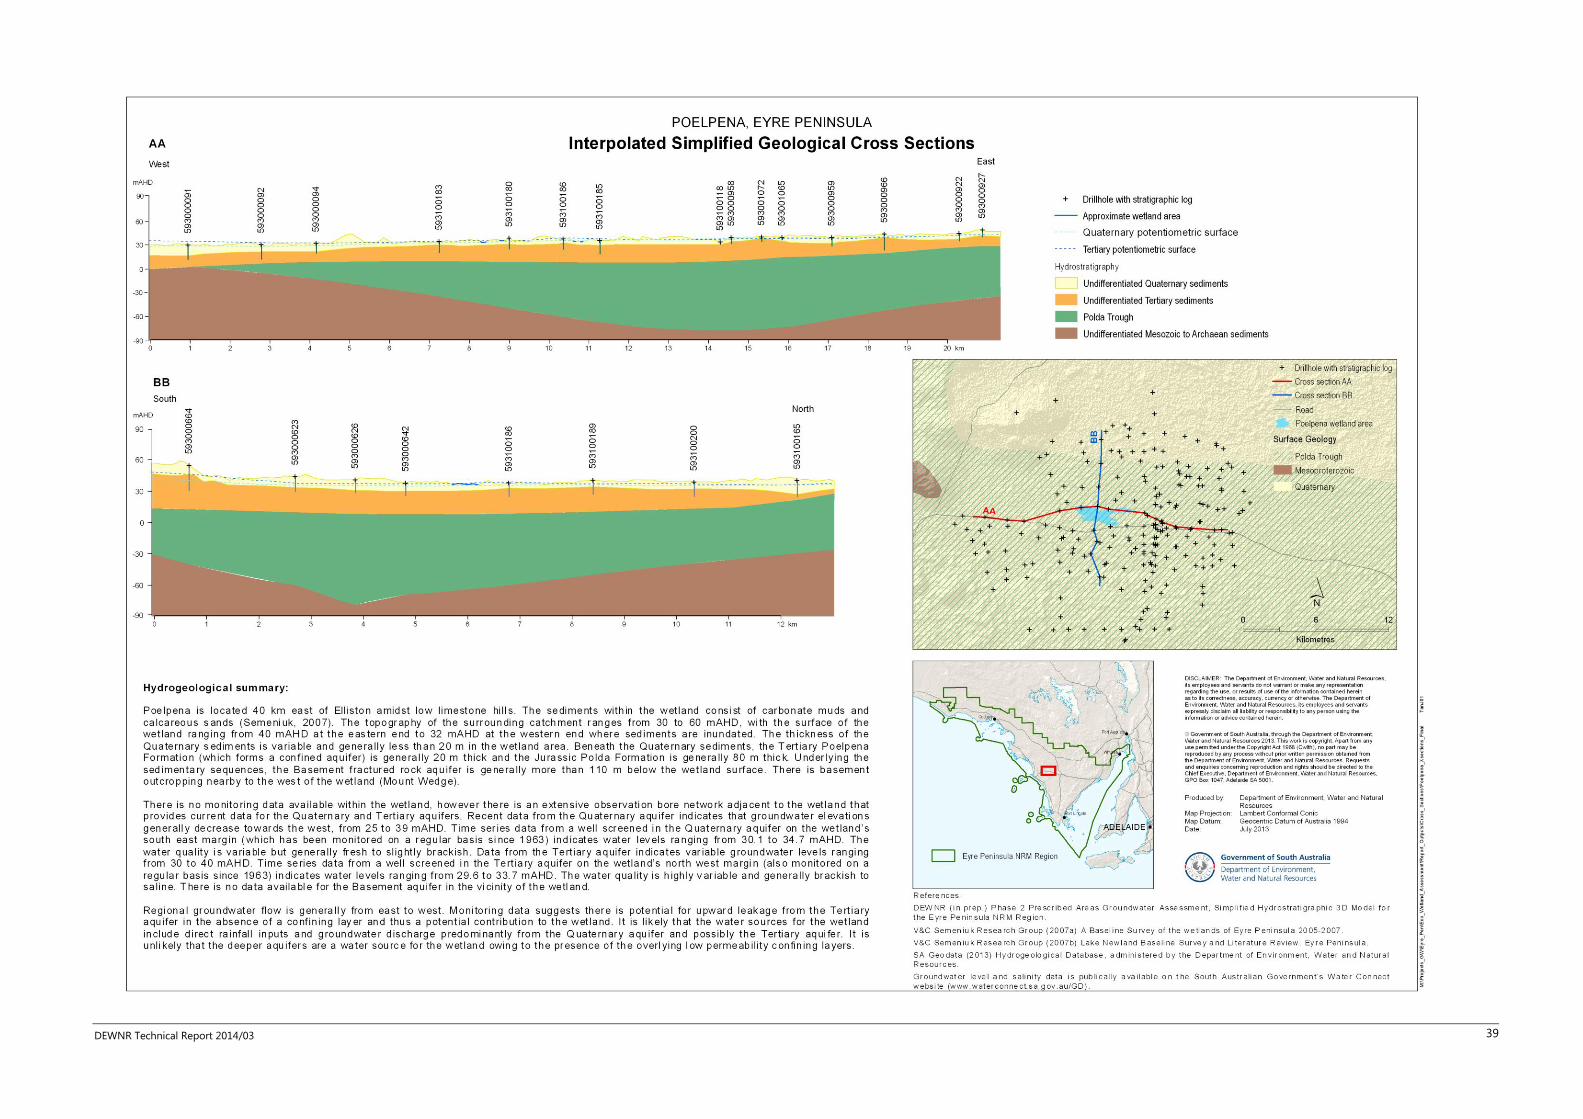
DEWNR Technical Report 2014/03 39
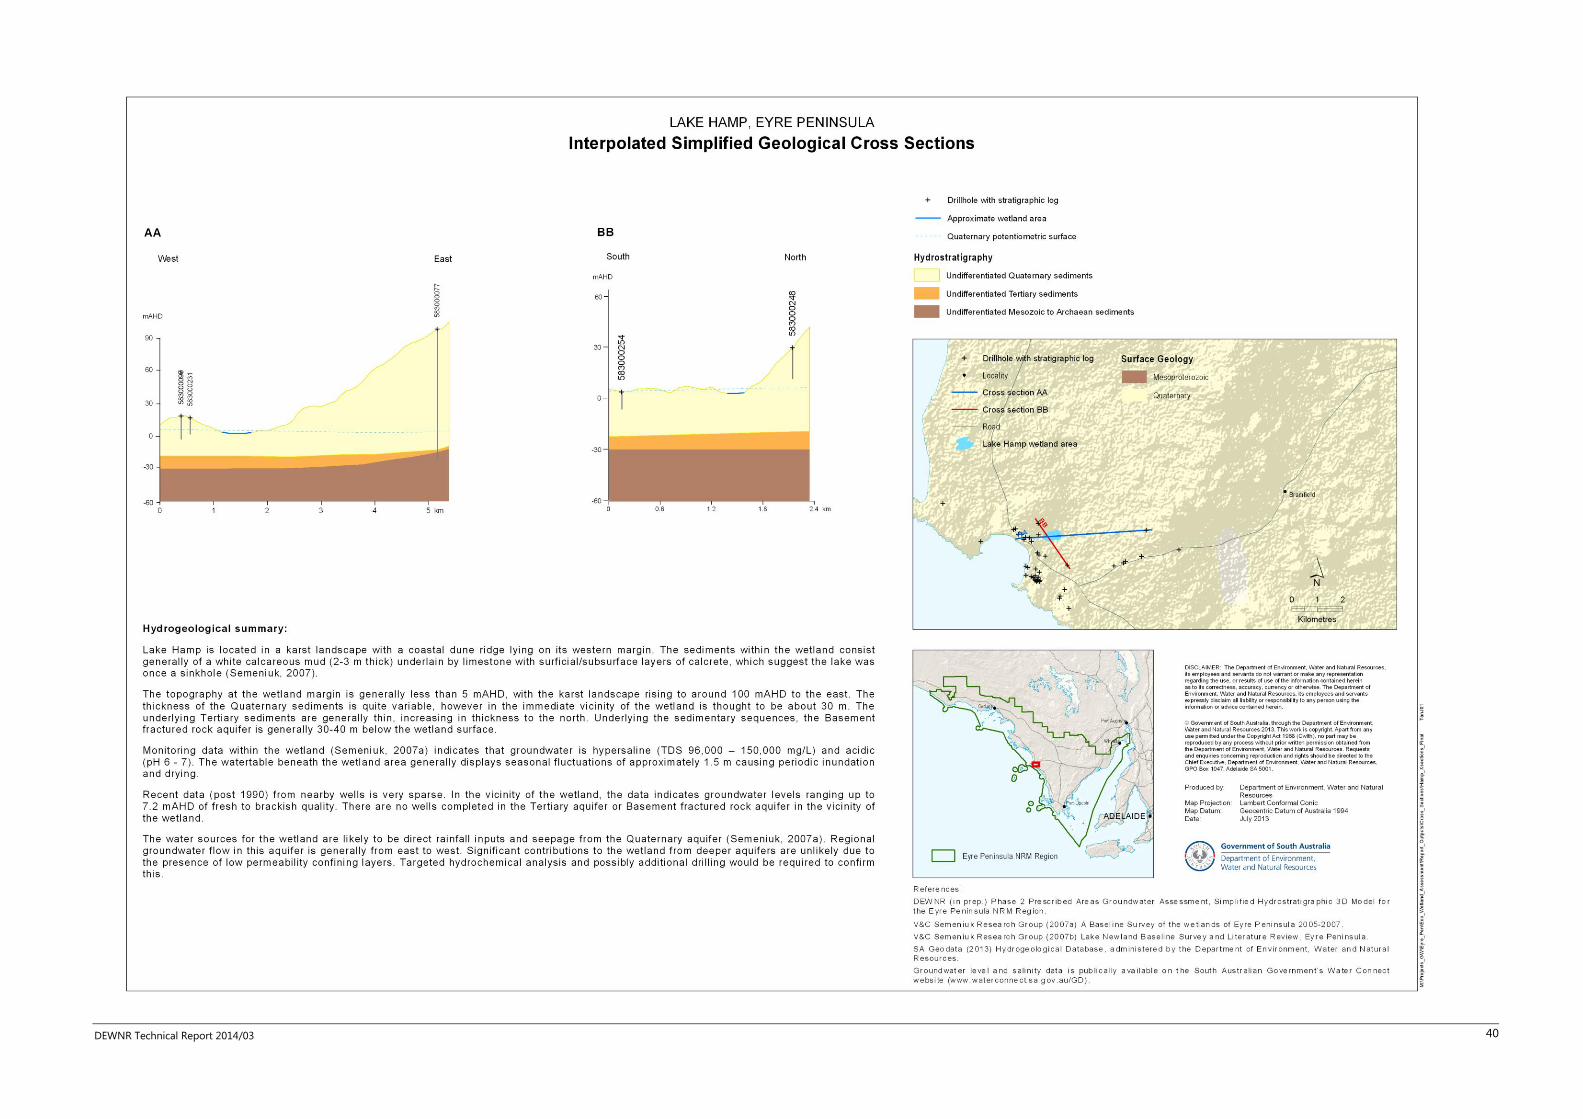
DEWNR Technical Report 2014/03 40
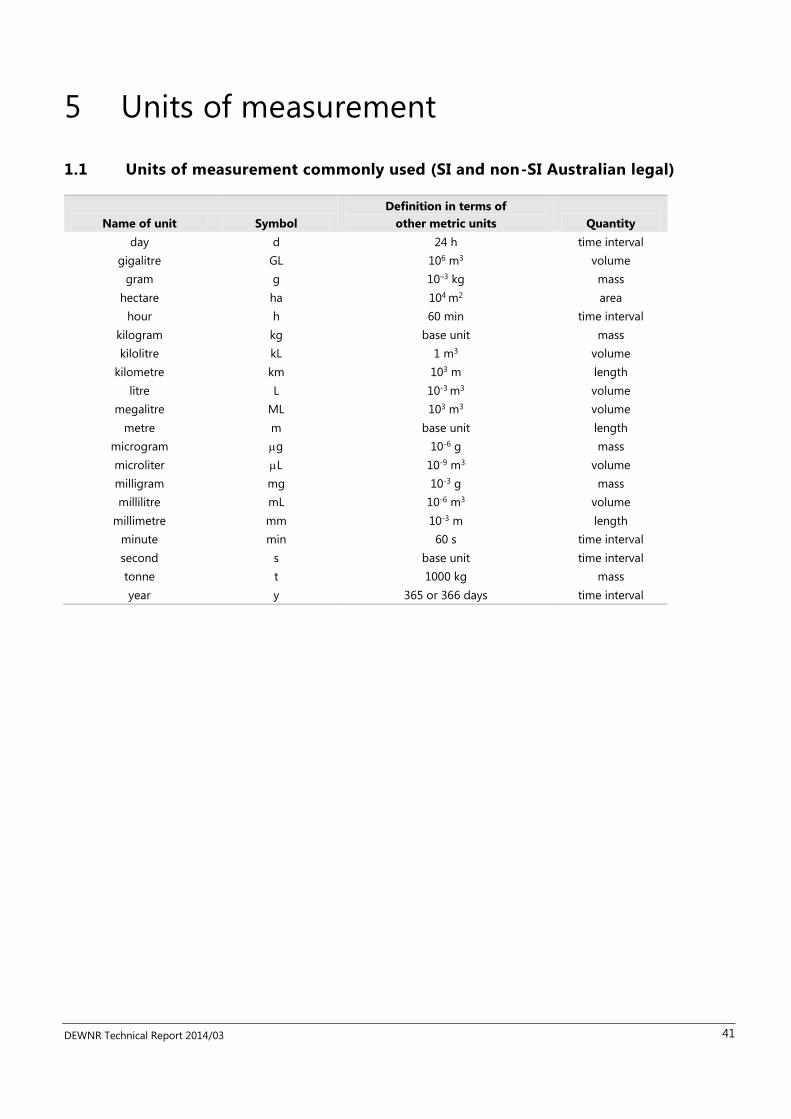
DEWNR Technical Report 2014/03 41
5 Units of measurement
1.1 Units of measurement commonly used (SI and non-SI Australian legal)
Name of unit Symbol
Definition in terms of
other metric units Quantity
day d 24 h time interval
gigalitre GL 106 m3 volume
gram g 10–3 kg mass
hectare ha 104 m2 area
hour h 60 min time interval
kilogram kg base unit mass
kilolitre kL 1 m3 volume
kilometre km 103 m length
litre L 10-3 m3 volume
megalitre ML 103 m3 volume
metre m base unit length
microgram g 10-6 g mass
microliter L 10-9 m3 volume
milligram mg 10-3 g mass
millilitre mL 10-6 m3 volume
millimetre mm 10-3 m length
minute min 60 s time interval
second s base unit time interval
tonne t 1000 kg mass
year y 365 or 366 days time interval
DEWNR Technical Report 2014/03 42
6 References
Berens V, Alcoe DW, Watt EL (2011) Non-prescribed groundwater resources assessment – Eyre Peninsula Natural Resources
Management Region. Phase 1 - Literature and Data Review, DFW Technical Report 2011/16. Government of South Australia,
through Department for Water, Adelaide.
Brock, M. A. & Casanova, M. T. in Frontiers in Ecology: Building the Links (ed N. Klomp, Lunt, I.) 181-192. (Elsevier, 1997).
Canham, C. A., Froend, R. H. & Stock, W. D. Water stress vulnerability of four Banksia species in contrasting ecohydrological
habitats on the Gnangara Mound, Western Australia. Plant Cell and Environment 32, 64-72, doi:10.1111/j.1365-
3040.2008.01904.x (2009).
Casanova, M. T. Using water plant functional groups to investigate environmental water requirements. Freshwater Biology
56, 2637-2652, doi:10.1111/j.1365-2427.2011.02680.x (2011).
Casanova, M. T. & Brock, M. A. How do depth, duration and frequency of flooding influence the establishment of wetland
plant communities? Plant Ecology 147, 237-250, doi:10.1023/a:1009875226637 (2000).
Clifton C, Cossens B and McAuley C (2007), A Framework for assessing the environmental water requirements of
groundwater dependent ecosystems, report prepared for Land and Water Australia
Dawson, T. E. & Pate, J. S. Seasonal water uptake and movement in root systems of Australian phraeatophytic plants of
dimorphic root morphology: A stable isotope investigation. Oecologia 107, 13-20, doi:10.1007/bf00582230 (1996).
Deane D and White M (2014), Verification of water allocation science program: Groundwater Dependent Ecosystems in
Prescribed Wells Areas of the Eyre Peninsula, DEWNR Technical Report 2014/in review, Government of South Australia,
through Department of Environment, Water and Natural Resources, Adelaide.
Denton, M. & Ganf, G. G. RESPONSE OF JUVENILE MELALEUCA-HALMATURORUM TO FLOODING - MANAGEMENT
IMPLICATIONS FOR A SEASONAL WETLAND, BOOL LAGOON, SOUTH-AUSTRALIA. Australian Journal of Marine and
Freshwater Research 45, 1395-1408 (1994).
DEWNR (in prep.), Non-prescribed groundwater resources assessment – Eyre Peninsula Natural Resources Management
Region. Phase 2 – Groundwater Assessment and simplified hydrostratigraphic 3D model. Government of South Australia,
through Department for Environment, Water and Natural Resources, Adelaide.
Doeg, T., Muller, K., Nicol, J. and Vanlaarhoven, J, 2012, Environmental Water Requirements of Groundwater Dependent
Ecosystems in the Musgrave and Southern Basins Prescribed Wells Areas on the Eyre Peninsula, DFW Technical Report
2012/16, Government of South Australia, through Department for Water, Adelaide
Eamus, D., Froend, R., Loomes, R., Hose, G. & Murray, B. A functional methodology for determining the groundwater regime
needed to maintain the health of groundwater-dependent vegetation. Australian Journal of Botany 54, 97-114,
doi:10.1071/bt05031 (2006).
Filella, I. & Penuelas, J. Indications of hydraulic lift by Pinus halepensis and its effects on the water relations of neighbour
shrubs. Biologia Plantarum 47, 209-214 (2003).
Flint, R.B (1989) ELLISTON Map sheet, South Australia. Geological Survey, Geological Atlas 1:250,000 Series, sheet SI 53-6.
Flint, R.B and Rankin, L.R. (1989) KIMBA Map sheet, South Australia. Geological Survey, Geological Atlas 1:250,000 Series,
sheet SI 53-7.
GDE Atlas; Atlas of Groundwater Dependent Ecosystems. CSIRO & SKM, Phas 2. Task 5 Report: Identifying and mapping
GDEs. Report prepared for the National Water Commission, Australian Government (2012).
George, A.K., Walker, K.F., & Lewis, M.M. (2005). Population status of eucalypt trees on the River Murray floodplain, South
Australia. River Research & Applications 21, 271 282.
DEWNR Technical Report 2014/03 43
Henszey, R. J., Pfeiffer, K. & Keough, J. R. Linking surface- and ground-water levels to riparian grassland species along the
platte river in Central Nebraska, USA. Wetlands 24, 665-687, doi:10.1672/0277-5212(2004)024[0665:lsaglt]2.0.co;2 (2004).
Le Maitre, D. C., Scott, D. F. & Colvin, C. A review of information on interactions between vegetation and groundwater.
Water Sa 25, 137-152 (1999).
Ludwig, F., Dawson, T. E., de Kroon, H., Berendse, F. & Prins, H. H. T. Hydraulic lift in Acacia tortilis trees on an East African
savanna. Oecologia 134, 293-300, doi:10.1007/s00442-002-1119-x (2003).
Mahoney, J. M. & Rood, S. B. RESPONSE OF A HYBRID POPLAR TO WATER-TABLE DECLINE IN DIFFERENT SUBSTRATES. Forest
Ecology and Management 54, 141-156, doi:10.1016/0378-1127(92)90009-x (1992).
Marcar, N. E., Crawford, D. F., Hossain, A. & Nicholson, A. T. Survival and growth of tree species and provenances in
response to salinity on a discharge site. Australian Journal of Experimental Agriculture 43, 1293-1302, doi:10.1071/ea02192
(2003).
Mensforth, L. J. & Walker, G. R. Root dynamics of Melaleuca halmaturorum in response to fluctuating saline groundwater.
Plant and Soil 184, 75-84, doi:10.1007/bf00029276 (1996).
Murray B, Zeppel M, Hose G and Eamus D 2003, ‘Groundwater-dependent ecosystems in Australia: it’s more than just water
for rivers’, Ecological Management and Restoration 4(2):110–113.
NCC (1999) Desktop methodology to Identify Groundwater Dependent Ecosystems. Nature Conservation Council of New
South Wales, Sydney.
Nicol, J. M. & Ganf, G. G. Water regimes, seedling recruitment and establishment in three wetland plant species. Marine
and Freshwater Research 51, 305-309, doi:10.1071/mf99147 (2000).
Orellana, F., Verma, P., Loheide, S. P., II & Daly, E. MONITORING AND MODELING WATER-VEGETATION INTERACTIONS IN
GROUNDWATER-DEPENDENT ECOSYSTEMS. Reviews of Geophysics 50, doi:10.1029/2011rg000383 (2012).
Overton, IC 2006, Rapid Ecological Risk Assessment of North Stradbroke Island Groundwater Dependant Vegetation from
Remote Sensing, Report prepared for the Queensland Department of Natural Resources, Mines and Water, CSIRO Land and
Water Science Report.
Pate, J. S., Jeschke, W. D. & Aylward, M. J. HYDRAULIC ARCHITECTURE AND XYLEM STRUCTURE OF THE DIMORPHIC ROOT
SYSTEMS OF SOUTH-WEST AUSTRALIAN SPECIES OF PROTEACEAE. Journal of Experimental Botany 46, 907-915,
doi:10.1093/jxb/46.8.907 (1995).
Rankin, L.R and Flint, R.B (1989) STREAKY BAY Map sheet, South Australia. Geological Survey, Geological Atlas 1:250,000
Series, sheet SI 53-2.
Richardson, S (2011) Australian groundwater-dependent ecosystem toolbox part 1: assessment framework, Waterlines
report, National Water Commission, Canberra.
Rood, S. B. & Mahoney, J. M. COLLAPSE OF RIPARIAN POPLAR FORESTS DOWNSTREAM FROM DAMS IN WESTERN PRAIRIES -
PROBABLE CAUSES AND PROSPECTS FOR MITIGATION. Environmental Management 14, 451-464, doi:10.1007/bf02394134
(1990).
SA Geodata (2013), Hydrogeological Database South Australia. Drillhole stratigraphic logs and well construction details.
Semeniuk,V. and Semeniuk,C. (2007a) A Baseline Survey of the wetlands of Eyre Peninsula 2005-2007. Report to the Eyre
Peninsula Natural Resources Management Board, Port Lincoln, South Australia.
Semeniuk,V. and Semeniuk,C. (2007b) Lake Newland Baseline Survey and Literature Review, Eyre Peninsula. Report to the
Eyre Peninsula Natural Resources Management Board, Port Lincoln, South Australia.
Silvertown, J., Dodd, M. E., Gowing, D. J. G. & Mountford, J. O. Hydrologically defined niches reveal a basis for species
richness in plant communities. Nature 400, 61-63, doi:10.1038/21877 (1999).
SKM (2009) Eyre Peninsula Groundwater Dependent Ecosystem Scoping Study. Sinclair Knight Merz, Adelaide.
DEWNR Technical Report 2014/03 44
Stewart, S., Alcoe, D. and Risby, L. (2012) Science Support for the Musgrave and Southern Basins Prescribed Wells Areas
Water Allocation Plan, DFW Technical Report 2012/15, Government of South Australia.
Stromberg, J. C., Tiller, R. & Richter, B. Effects of groundwater decline on riparian vegetation of semiarid regions: The San
Pedro, Arizona. Ecological Applications 6, 113-131, doi:10.2307/2269558 (1996).
Stromberg, J. C., Tress, J. A., Wilkins, S. D. & Clark, S. D. RESPONSE OF VELVET MESQUITE TO GROUNDWATER DECLINE.
Journal of Arid Environments 23, 45-58 (1992).
Stromberg, J. C., Wilkins, S. D. & Tress, J. A. VEGETATION-HYDROLOGY MODELS - IMPLICATIONS FOR MANAGEMENT OF
PROSOPIS-VELUTINA (VELVET MESQUITE) RIPARIAN ECOSYSTEMS. Ecological Applications 3, 307-314, doi:10.2307/1941833
(1993).
Tunn, Y & Cameron, C. (2008) Wetland mapping in Eyre Peninsula. Environmental Information Directorate, Department for
Environment and Heritage, South Australia.
Wainwright, P. (2008). 2007 Wetland Inventory for the Eyre Peninsula, South Australia. Department for Environment and
Heritage, South Australia.
WaterConnect (2013) Groundwater Information Database South Australia. Groundwater level and salinity data. Publically
available on the Government of South Australia’s WaterConnect website (www.waterconnect.sa.gov.au).