Mapping Out Energy - NARUC
32
Mapping Out Energy Efficiency’s Potential Paul Roberti, Commissioner Rhode Island Public Utilities Commission NARUC/Nigeria Electricity Regulatory Partnership Dubai, United Arab Emirates 3-5 December, 2014
Transcript of Mapping Out Energy - NARUC

Mapping Out Energy
Efficiency’s Potential
Paul Roberti, Commissioner
Rhode Island Public Utilities Commission
NARUC/Nigeria Electricity Regulatory Partnership Dubai, United Arab Emirates
3-5 December, 2014

Rhode Island is the Smallest State in U.S.
2
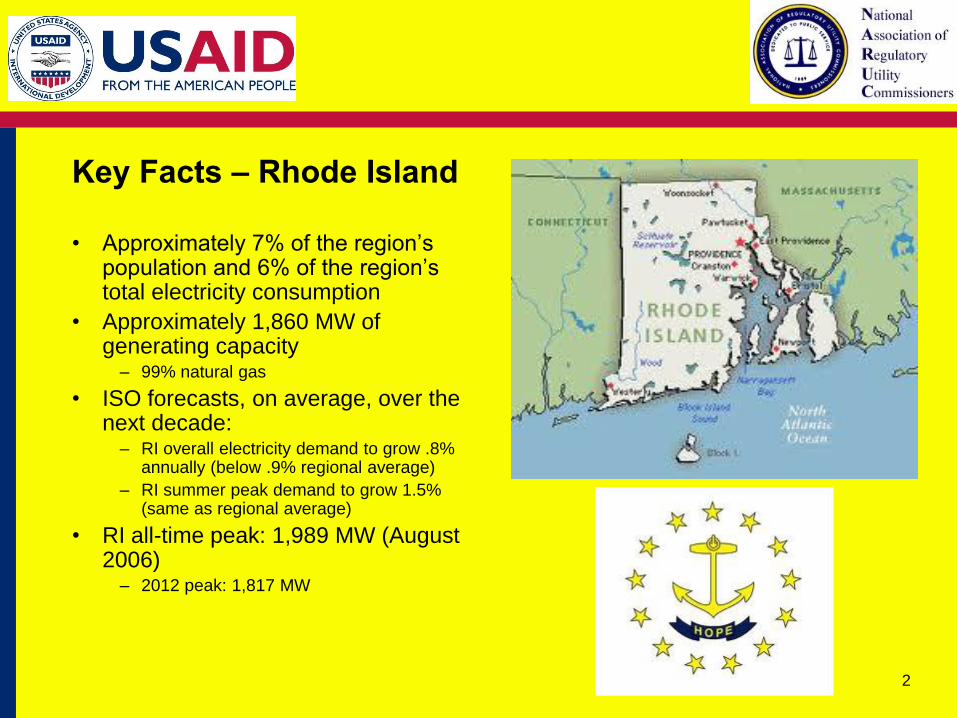
Key Facts – Rhode Island
• Approximately 7% of the region’s population and 6% of the region’s total electricity consumption
• Approximately 1,860 MW of generating capacity
– 99% natural gas
• ISO forecasts, on average, over the next decade:
– RI overall electricity demand to grow .8% annually (below .9% regional average)
– RI summer peak demand to grow 1.5% (same as regional average)
• RI all-time peak: 1,989 MW (August 2006)
– 2012 peak: 1,817 MW
2

New England’s Electric Power Grid at a Glance
• Interconnected Transmission among 6
States and singular bulk power market
• 6.5 million households and businesses;
population 14 million
• 350+ generators
• 8,000+ miles of high-voltage transmission
lines (115 kV and above)
• 32,000 megawatts of total supply and
• 28,130 megawatts all-time peak demand,
set on August 2, 2006
• 500 participants in the marketplace
• $6-8 billion total energy market value in
2012 1

5
Rhode Island Electric and Gas Operations
National Grid serves as Rhode Island’s electric and gas utility
with:
482,000 electric customers
252,000 gas customers
6,000 miles electric distribution lines
3,100 miles gas mains
Note: Map does not indicate area served by Pascoag Utility District

Energy Efficiency
The Promising Theory Behind Energy Efficiency (EE)
Using less energy for the same amount of performance, comfort
and convenience
The cheapest kWh you can buy is the one you don't use.
Creates benefits by procuring the cheapest kWh as a resource
instead of more expensive resources
6

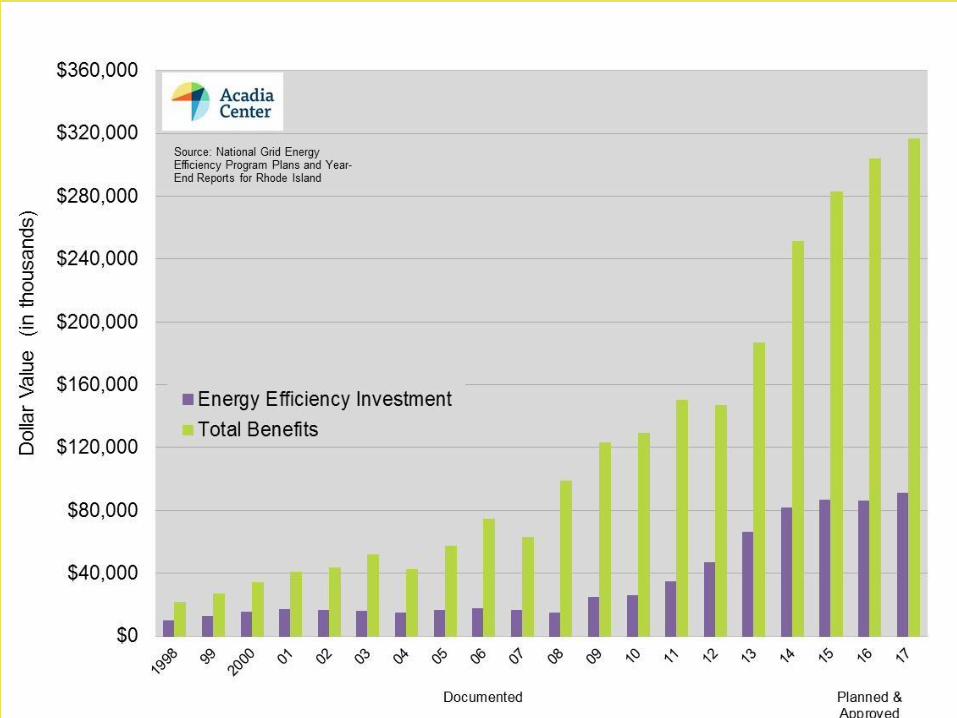
Imbalance in expenditure on high-cost supply vs. low cost efficiency resource
12 ¢
4 ¢
Electric Supply = $1.09 Billion in 2006
2006 RI
Efficiency
Spending is
~ $17.4M
Approx. 7,500,000,000 kWh of power supply Approx. 750,000,000
kWh savings
Current Electric Supply vs. Existing Efficiency vs. Least Cost Efficiency Opportunity
Tim Woolf
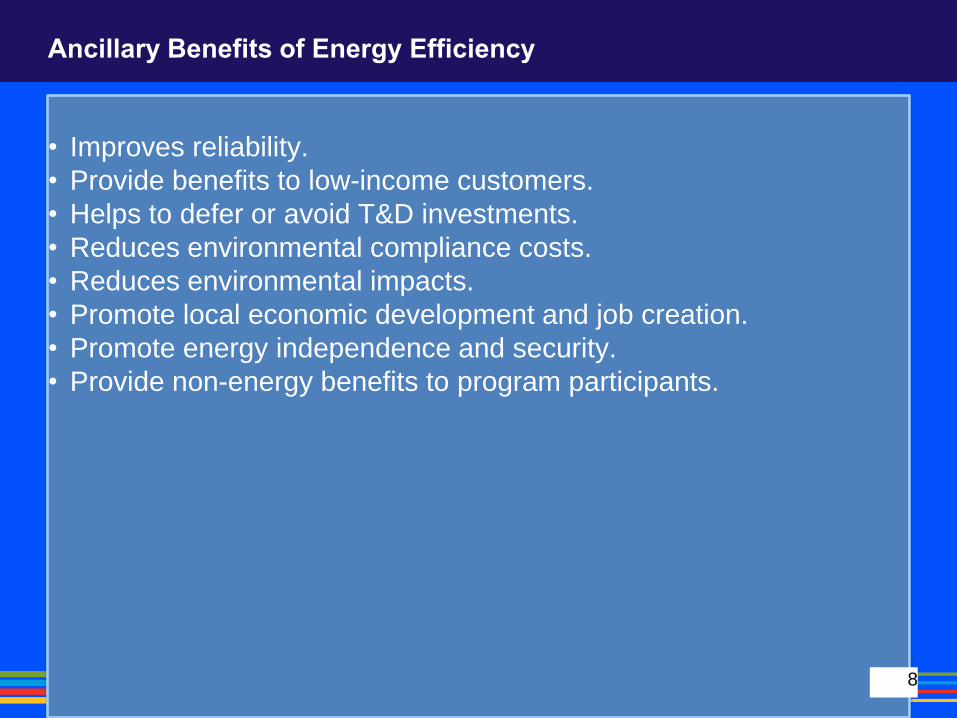
Ancillary Benefits of Energy Efficiency
• Improves reliability.
• Provide benefits to low-income customers.
• Helps to defer or avoid T&D investments.
• Reduces environmental compliance costs.
• Reduces environmental impacts.
• Promote local economic development and job creation.
• Promote energy independence and security.
• Provide non-energy benefits to program participants.
8

10
Why Should Utilities Offer EE Programs?
• Ratepayer funded efficiency programs are needed to overcome the many market barriers to energy efficiency: o Imperfect information.
o Limited availability of efficiency products.
o Lack of access to capital.
o High transaction costs.
o Improper price signals.
o Split incentives.
o Focus on short-term.
o Limited interest, due to electricity bills not being important enough.
o Institutional and regulatory barriers.
o Uncertainty and risk avoidance.
Courtesy of Tim Woolf, Synapse Energy Economics

Courtesy of Tim Woolf, Synapse Energy Economics 11
Energy Efficiency is Systematically Undervalued
• Avoided costs are often understated. o Some avoided costs are ignored altogether.
• Many key benefits are not accounted for. o Especially those that are difficult to quantify.
• Energy policy goals are not accounted for.
o These should be included in each test.
• Discount rates undervalue future benefits. o The utility cost of capital is too high.
• Price impacts are overstated.
o Comprehensive, long-term analysis is required.

12
Components of the Standard Screening Tests
Courtesy of Tim Woolf, Synapse Energy Economics

13
Implications of the Standard Tests
Courtesy of Tim Woolf, Synapse Energy Economics
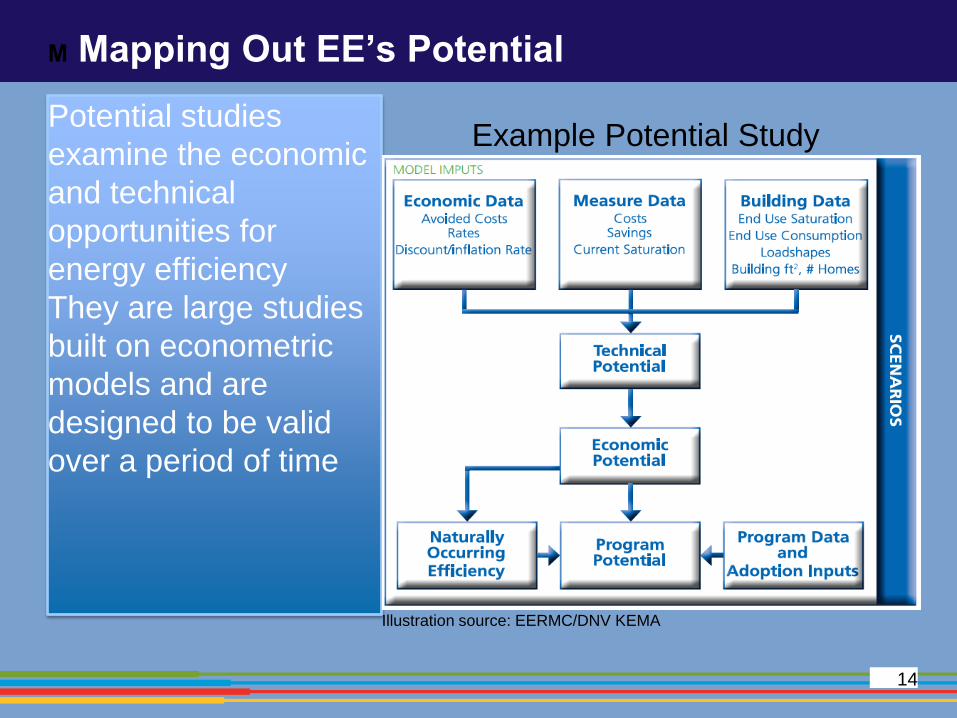
M Mapping Out EE’s Potential
Potential studies
examine the economic
and technical
opportunities for
energy efficiency
They are large studies
built on econometric
models and are
designed to be valid
over a period of time
14
Example Potential Study
Illustration source: EERMC/DNV KEMA

Technical Potential: The total demand-side resource
potential from all measures considered, regardless of
whether those measures are cost effective, and without
regard for market barriers or the ability of programs to
capture it.
Economic Potential: The total demand-side resource
potential over the planning period from all measures that are
cost effective, based on an adopted cost effectiveness test
Achievable Potential: The estimated maximum demand-side
resources that could be captured over the planning period,
given aggressive, well designed, fully-funded programs.
15
Types of Potential

Supply Curves
16
Potential studies
estimate EE supply
curves
Supply curves
provide policy
makers information to
establish:
reasonable savings
targets (X-axis)
reasonable costs (y-
axis)
Illustration source: EERMC/DNV KEMA
Example EE Supply Curve

17
Pick the low hanging fruit first!
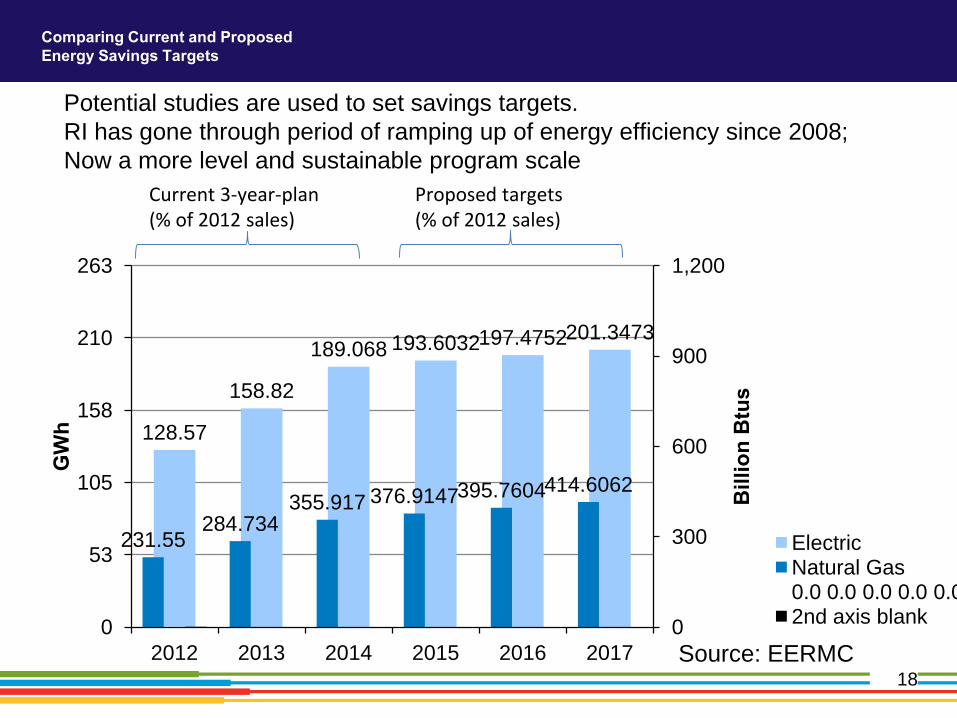
Comparing Current and Proposed
Energy Savings Targets
18
128.57
158.82
189.068 193.6032 197.4752 201.3473
231.55 284.734
355.917 376.9147 395.7604 414.6062
0
300
600
900
1,200
0
53
105
158
210
263
2012 2013 2014 2015 2016 2017
Billio
n B
tus
GW
h
Electric Natural Gas 0.0 0.0 0.0 0.0 0.0 0.02nd axis blank
Current 3-year-plan
(% of 2012 sales) Proposed targets (% of 2012 sales)
Potential studies are used to set savings targets.
RI has gone through period of ramping up of energy efficiency since 2008;
Now a more level and sustainable program scale
Source: EERMC

Without Efficiency
With Efficiency
Rhode Island’s Electric Load Forecast — with and without energy efficiency
Source: ISO-NE Energy Efficiency Forecast Report for 2018-2023


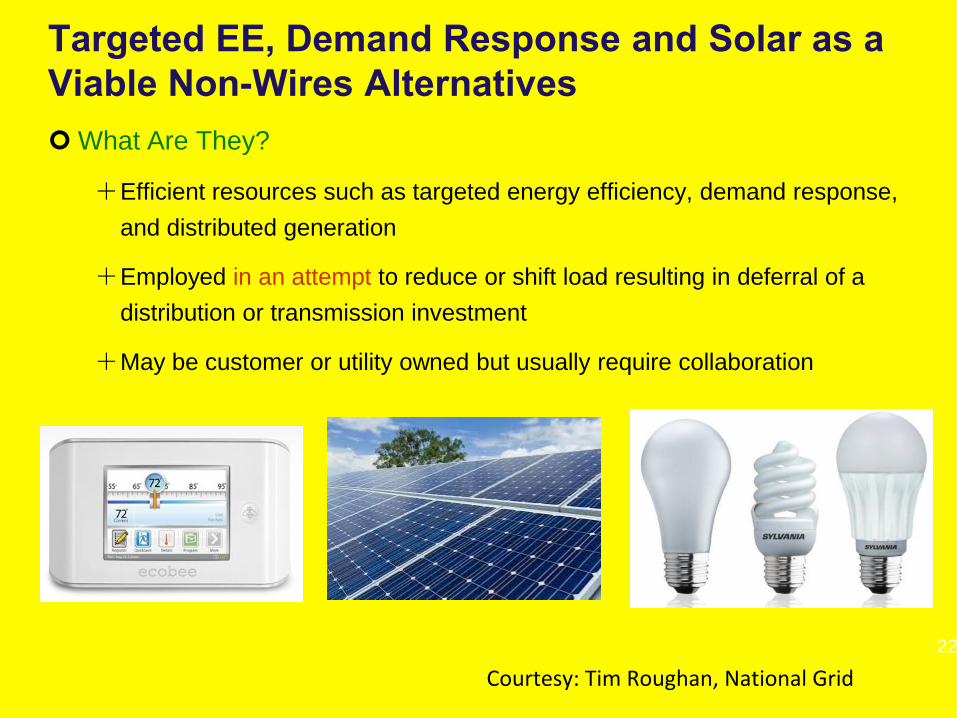
Targeted EE, Demand Response and Solar as a
Viable Non-Wires Alternatives
What Are They?
Efficient resources such as targeted energy efficiency, demand response,
and distributed generation
Employed in an attempt to reduce or shift load resulting in deferral of a
distribution or transmission investment
May be customer or utility owned but usually require collaboration
22
Courtesy: Tim Roughan, National Grid

Maintaining System Reliability While Meeting
Growing Electric Demands
Least Cost Procurement Law - 2006
Intended to reduce the cost of energy by:
Increase stability through resource diversification
Provide for all cost effective energy efficiency
Integrate renewables
Increase accountability in planning and administration
Requires the development of Standards for Energy Efficiency and System Reliability Procurement documents
Basis for 3-year EE plans
Approved in 2009
Updated in 2011
23 Courtesy: Tim Roughan, National Grid

First SRP Pilot Project: Demand Link
Two Feeders out of Tiverton
substation serving Tiverton &
Little Compton
Forecasted to be overloaded
starting in 2014
Potential for ~5,600 affected
Customers: 80% Residential,
20% C&I
Wires solution – substation
upgrade – would have cost
$2.9 million in 2014
Non-wires Goal: provide load
relief starting in 2014, up to
1MW by 2017
24
Courtesy: Tim Roughan, National Grid

Pilot Design – A Collaborative Approach Project plan includes SRP and EE components
New technology, enhanced incentives, marketing and evaluation through SRP funding
Measures delivered through EnergyWise and Small Business Direct Install, the RI single
family, residential and small commercial business audit programs
Demand response events conducted through SRP funding
Benefit/cost analysis uses the Total Resource Cost model
Uses same avoided costs as the statewide programs
Added benefits associated with the DR events
Regional T&D deferral benefit is replaced with specific T&D deferral benefit as
calculated as a revenue requirement for deferral years 2014 through 2017
Until enough actual load relief seen during peak load conditions, can not claim
victory
Associated benefits/costs of the leveraged EE components included in BC but not
claimed by SRP
Pilot must be cost effective over full six-year life, not in each year
25
Courtesy: Tim Roughan, National Grid

Demand Reduction Technologies and Methods
2012 Components
Wi-fi Thermostats for Central AC Units
Enhanced Promotion for EE Audits
DR Lighting Ballast (Commercial Only)
2013 Enhancements
Wi-fi Thermostats and Smart Plugs for Window AC Units
Energy Star Window AC Purchase Rebates
AC Unit Recycle Rebates
Increased Direct Marketing
Community Event
26

2014 Demand Reduction Implementation
Continue existing portfolio of products and incentives with two enhancements:
Install standard LED light bulbs instead of CFLs (increases savings)
Enhanced load control device for larger window AC units (increases eligible customer
pool)
Introduce additional recruitment messaging
Add focus on community sustainability
Increase customer understanding of Pilot goals
Also continue using “save money save energy” message
Focus on reaching business owners/decision-makers
Increase focus on participant communications
Prepare participants for DR events in 2014
Maximize participation per customer
Increase participant understanding of Pilot components, expectations and goals
Conduct Demand Response events as necessary throughout the year
27
28
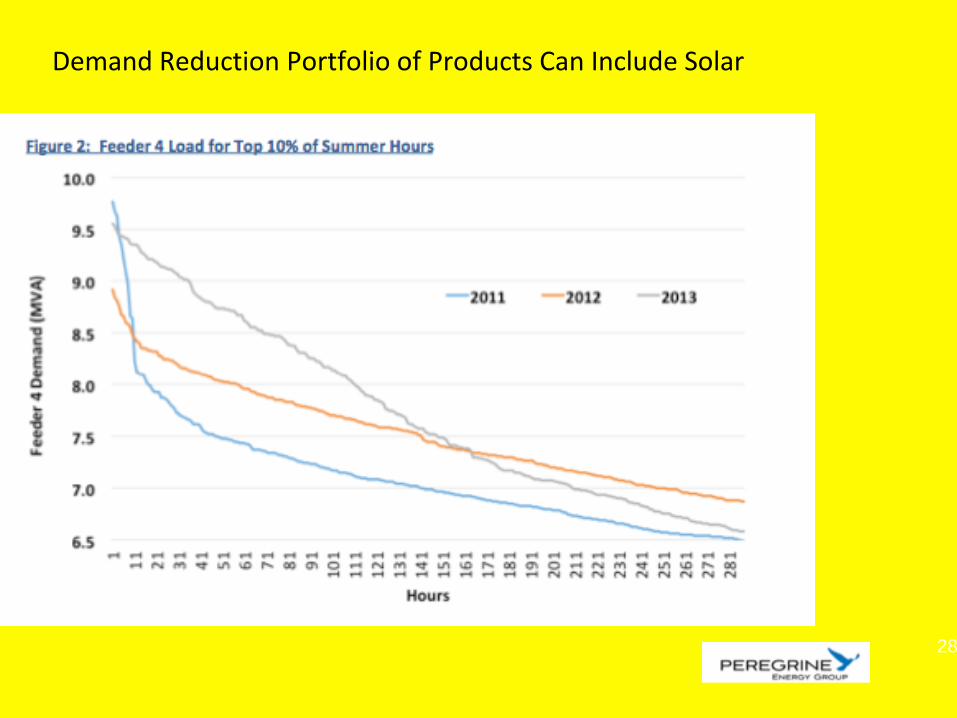
Demand Reduction Portfolio of Products Can Include Solar

29

• Energy and Capacity Value of Distributed Generation Depends
on Load Profiles, Meteorological Data, Deployment location, and
Technology Configuration
• Reality Check: Is it Cost-Effective and are there countervailing
reliability risks??
30
Granular Analysis of System Components
Relative to Peak Demand

Maximize Planned Investments of Solar to
Achieve More Efficient Outcomes
31

QUESTIONS?
32