Mapping of Human FOXP2 Enhancers Reveals Complex Regulation
15
ORIGINAL RESEARCH published: 21 February 2018 doi: 10.3389/fnmol.2018.00047 Edited by: Ildikó Rácz, Universitätsklinikum Bonn, Germany Reviewed by: Ozgun Gokce, Ludwig-Maximilians-Universität München, Germany Nenad Sestan, Yale University, United States *Correspondence: Sonja C. Vernes [email protected] † Present address: Martin Becker, Department of Women’s and Children’s Health, Center of Neurodevelopmental Disorders (KIND), Karolinska Institutet, Stockholm, Sweden Received: 23 October 2017 Accepted: 02 February 2018 Published: 21 February 2018 Citation: Becker M, Devanna P, Fisher SE and Vernes SC (2018) Mapping of Human FOXP2 Enhancers Reveals Complex Regulation. Front. Mol. Neurosci. 11:47. doi: 10.3389/fnmol.2018.00047 Mapping of Human FOXP2 Enhancers Reveals Complex Regulation Martin Becker 1,2† , Paolo Devanna 1 , Simon E. Fisher 2,3 and Sonja C. Vernes 1,3 * 1 Neurogenetics of Vocal Communication Group, Max Planck Institute for Psycholinguistics, Nijmegen, Netherlands, 2 Language and Genetics Department, Max Planck Institute for Psycholinguistics, Nijmegen, Netherlands, 3 Donders Institute for Brain, Cognition and Behaviour, Radboud University, Nijmegen, Netherlands Mutations of the FOXP2 gene cause a severe speech and language disorder, providing a molecular window into the neurobiology of language. Individuals with FOXP2 mutations have structural and functional alterations affecting brain circuits that overlap with sites of FOXP2 expression, including regions of the cortex, striatum, and cerebellum. FOXP2 displays complex patterns of expression in the brain, as well as in non- neuronal tissues, suggesting that sophisticated regulatory mechanisms control its spatio-temporal expression. However, to date, little is known about the regulation of FOXP2 or the genomic elements that control its expression. Using chromatin conformation capture (3C), we mapped the human FOXP2 locus to identify putative enhancer regions that engage in long-range interactions with the promoter of this gene. We demonstrate the ability of the identified enhancer regions to drive gene expression. We also show regulation of the FOXP2 promoter and enhancer regions by candidate regulators – FOXP family and TBR1 transcription factors. These data point to regulatory elements that may contribute to the temporal- or tissue-specific expression patterns of human FOXP2. Understanding the upstream regulatory pathways controlling FOXP2 expression will bring new insight into the molecular networks contributing to human language and related disorders. Keywords: FOXP2, enhancer elements, Genetic, regulation of gene expression, language, language disorders, TBR1 INTRODUCTION FOXP2 is the first and most well-studied gene to be implicated in human speech and language skills. Heterozygous mutations of the FOXP2 gene cause a severe speech and language disorder characterized by childhood apraxia of speech (CAS) and accompanied by expressive and receptive language problems (Vargha-Khadem et al., 1995; Watkins et al., 2002). The first FOXP2 point mutation to be identified was a disruptive missense variant inherited by all affected members of a large three-generation pedigree, known as the KE family (Lai et al., 2001). Further mutations have been found in similarly affected individuals including missense and nonsense mutations disrupting the protein sequence (MacDermot et al., 2005; Reuter et al., 2017) and larger structural changes that affect the FOXP2 locus such as; whole gene deletions (Feuk et al., 2006; Zeesman et al., 2006; Lennon et al., 2007; Palka et al., 2012; Rice et al., 2012; Zilina et al., 2012), chromosomal rearrangements disrupting the gene coding sequence (Lai et al., 2001; Feuk et al., 2006; Shriberg et al., 2006), and a Frontiers in Molecular Neuroscience | www.frontiersin.org 1 February 2018 | Volume 11 | Article 47
Transcript of Mapping of Human FOXP2 Enhancers Reveals Complex Regulation

fnmol-11-00047 February 19, 2018 Time: 14:51 # 1
ORIGINAL RESEARCHpublished: 21 February 2018
doi: 10.3389/fnmol.2018.00047
Edited by:Ildikó Rácz,
Universitätsklinikum Bonn, Germany
Reviewed by:Ozgun Gokce,
Ludwig-Maximilians-UniversitätMünchen, Germany
Nenad Sestan,Yale University, United States
*Correspondence:Sonja C. Vernes
†Present address:Martin Becker,
Department of Women’sand Children’s Health, Center
of Neurodevelopmental Disorders(KIND), Karolinska Institutet,
Stockholm, Sweden
Received: 23 October 2017Accepted: 02 February 2018Published: 21 February 2018
Citation:Becker M, Devanna P, Fisher SE andVernes SC (2018) Mapping of Human
FOXP2 Enhancers Reveals ComplexRegulation.
Front. Mol. Neurosci. 11:47.doi: 10.3389/fnmol.2018.00047
Mapping of Human FOXP2Enhancers Reveals ComplexRegulationMartin Becker1,2†, Paolo Devanna1, Simon E. Fisher2,3 and Sonja C. Vernes1,3*
1 Neurogenetics of Vocal Communication Group, Max Planck Institute for Psycholinguistics, Nijmegen, Netherlands,2 Language and Genetics Department, Max Planck Institute for Psycholinguistics, Nijmegen, Netherlands, 3 Donders Institutefor Brain, Cognition and Behaviour, Radboud University, Nijmegen, Netherlands
Mutations of the FOXP2 gene cause a severe speech and language disorder, providing amolecular window into the neurobiology of language. Individuals with FOXP2 mutationshave structural and functional alterations affecting brain circuits that overlap withsites of FOXP2 expression, including regions of the cortex, striatum, and cerebellum.FOXP2 displays complex patterns of expression in the brain, as well as in non-neuronal tissues, suggesting that sophisticated regulatory mechanisms control itsspatio-temporal expression. However, to date, little is known about the regulationof FOXP2 or the genomic elements that control its expression. Using chromatinconformation capture (3C), we mapped the human FOXP2 locus to identify putativeenhancer regions that engage in long-range interactions with the promoter of this gene.We demonstrate the ability of the identified enhancer regions to drive gene expression.We also show regulation of the FOXP2 promoter and enhancer regions by candidateregulators – FOXP family and TBR1 transcription factors. These data point to regulatoryelements that may contribute to the temporal- or tissue-specific expression patternsof human FOXP2. Understanding the upstream regulatory pathways controlling FOXP2expression will bring new insight into the molecular networks contributing to humanlanguage and related disorders.
Keywords: FOXP2, enhancer elements, Genetic, regulation of gene expression, language, language disorders,TBR1
INTRODUCTION
FOXP2 is the first and most well-studied gene to be implicated in human speech and languageskills. Heterozygous mutations of the FOXP2 gene cause a severe speech and language disordercharacterized by childhood apraxia of speech (CAS) and accompanied by expressive and receptivelanguage problems (Vargha-Khadem et al., 1995; Watkins et al., 2002). The first FOXP2 pointmutation to be identified was a disruptive missense variant inherited by all affected members of alarge three-generation pedigree, known as the KE family (Lai et al., 2001). Further mutations havebeen found in similarly affected individuals including missense and nonsense mutations disruptingthe protein sequence (MacDermot et al., 2005; Reuter et al., 2017) and larger structural changes thataffect the FOXP2 locus such as; whole gene deletions (Feuk et al., 2006; Zeesman et al., 2006; Lennonet al., 2007; Palka et al., 2012; Rice et al., 2012; Zilina et al., 2012), chromosomal rearrangementsdisrupting the gene coding sequence (Lai et al., 2001; Feuk et al., 2006; Shriberg et al., 2006), and a
Frontiers in Molecular Neuroscience | www.frontiersin.org 1 February 2018 | Volume 11 | Article 47

fnmol-11-00047 February 19, 2018 Time: 14:51 # 2
Becker et al. Mapping FOXP2 Enhancers Reveals Regulation
small intragenic deletion leading to a premature stop codon(Turner et al., 2013; Reuter et al., 2017). Structural mutationsnear the FOXP2 locus that do not disrupt the coding sequencehave also been identified in individuals with speech and languageproblems (Feuk et al., 2006; Adegbola et al., 2015; Moralliet al., 2015). Some of these mutations have been hypothesizedto affect non-coding regulatory elements of FOXP2 and couldtherefore exert their effects by influencing expression of the gene.For example, in a child with delayed speech development, acomplex structural mutation was found including a balancedinversion with a breakpoint downstream of FOXP2 (Moralli et al.,2015). Downstream of this breakpoint, a functional enhancerwas identified that was suggested to alter FOXP2 expressionand thus contribute to the disorder (Becker et al., 2015).Therefore, while it is clear that disruptions of the FOXP2 codingregion result in speech/language deficits, it may also be thecase that dysregulation of this gene can contribute to similarphenotypes.
Patients with FOXP2 mutations display alterations affectingboth structural and functional brain features (Vargha-Khademet al., 1998; Watkins et al., 2002; Belton et al., 2003; Liegeoiset al., 2003, 2011). Voxel-based morphometry has identifiedaltered gray matter density in cortical areas (including posteriorsuperior temporal gyrus, angular gyrus, and inferior frontalgyrus), the caudate nucleus, putamen and cerebellar lobuleVIIIB (Vargha-Khadem et al., 1998; Watkins et al., 2002; Beltonet al., 2003). Functional activation differences during variouslanguage-related tasks have been observed in select corticalregions (including the inferior frontal gyrus), the caudate nucleusand the putamen (Belton et al., 2003; Liegeois et al., 2003;Pinel et al., 2012). The neural sites of alteration in thesestudies overlap with the regions of the brain where FOXP2 isexpressed, suggesting that loss of functional FOXP2 in thesestructures may be contributing to the neural and behavioralphenotypes.
FOXP2 expression patterns have been characterized in theembryonic human brain, as well as in the embryonic andadult mouse brain (Ferland et al., 2003; Lai et al., 2003).These studies showed overlapping and complex patterns ofexpression in developing cortical, subcortical, midbrain andhindbrain regions. FOXP2/Foxp2 expression was observed inthe cortex (deep layers), basal ganglia (medium spiny neurons),thalamus, hypothalamus, inferior colliculus, medulla (inferiorolive), and cerebellum (Purkinje cells). Many of the FOXP2positive brain regions are involved in motor control andmotor learning, for example cortico-striatal-thalamic and olivo-cerebellar circuitry (Vargha-Khadem et al., 2005). However,FOXP2/Foxp2 expression is not restricted to the brain and itis also found in the spinal cord, lungs, heart, and intestines(Shu et al., 2001; Morikawa et al., 2009). This suggests that acomplex set of regulatory mechanisms control the expression ofFOXP2. Different promoters and/or enhancers may be drivingexpression in neuronal versus non-neuronal tissue, directingexpression in specific subsets of cells within a tissue, and ensuringit is switched on only at the appropriate developmental timepoints. Although these complex expression patterns of FOXP2were first described more than a decade ago, there is still
very little known about the mechanisms by which the gene isregulated.
Transcription of FOXP2 may be initiated at one of at leastfour transcriptional start sites (TSSs) (Bruce and Margolis,2002; Schroeder and Myers, 2008). These alternative TSSsare utilized differently across different cells types and tissues;however, all but one are predicted to yield the same proteinproduct (Bruce and Margolis, 2002; Schroeder and Myers,2008). Thus, the role of these alternative TSSs may beto control when, where and how much FOXP2 protein isexpressed, leading to cell type, tissue or developmental stagespecific expression (Bruce and Margolis, 2002; Schroeder andMyers, 2008). A small number of putative enhancer elementscontributing to FOXP2 regulation have previously been identifiedin human and animal systems. For example, a putative enhancerelement was identified in intron 8 of human FOXP2 that wasbound and regulated by the POU3F2 transcription factor (TF)(Maricic et al., 2013). A POU3F2 binding site in this enhancerwas altered via a nucleotide change during the evolution ofmodern humans, with the ancestral allele acting as a strongerdriver of reporter gene expression in experimental assays, ascompared to the derived allele (Maricic et al., 2013). Threeputative enhancers located upstream, downstream and withinintron 2 of the zebrafish FoxP2 coding region were shownto drive reporter gene expression in vivo (Bonkowsky et al.,2008). The upstream and intron 2 enhancers were directlybound by the lef1 TF and lef1 knockdown resulted in loss ofFoxP2 expression in the midbrain and hindbrain of zebrafishembryos (Bonkowsky et al., 2008). To date, no comprehensiveassessment of human FOXP2 regulatory regions has beenperformed.
To better understand the regulatory mechanisms controllingFOXP2 expression in humans, we mapped putative enhancerregions at and around the FOXP2 locus. Using chromatinconformation capture (3C) we identified genomic regions thatengaged in long-range interactions with the FOXP2 promoter,indicating possible enhancer activity. Reporter gene assaysdemonstrated that some of these putative enhancer regions wereable to drive expression. Moreover we investigated regulationof the FOXP2 promoter and active enhancer regions by FOXPfamily and TBR1 TFs. These data give insight into the upstreammolecular networks and cis genomic regions that may influencethe spatio-temporal regulation of FOXP2.
MATERIALS AND METHODS
Cell CultureHEK293, SH-SY5Y, IMR32, SK-N-AS, and KELLY cell lineswere purchased from HPA Culture Collections (England, UK),SK-N-MC and PFSK1 were purchased from ATCC (Virginia,USA). The EBV transformed lymphoblast cell lines GM22671and GM22737 were obtained from Coriell Cell Repositories (NJ,USA). All cell lines were cultured at 5% CO2 and 37◦C in theappropriate culture media. Adherent (non-EBV) cell lines weresupplemented with 10% fetal bovine serum (Invitrogen, CA,USA) and 1% penicillin/streptavidin (Invitrogen). EBV cell lines
Frontiers in Molecular Neuroscience | www.frontiersin.org 2 February 2018 | Volume 11 | Article 47

fnmol-11-00047 February 19, 2018 Time: 14:51 # 3
Becker et al. Mapping FOXP2 Enhancers Reveals Regulation
were supplemented with 15% fetal bovine serum (Invitrogen)and 1% penicillin/streptavidin (Invitrogen). The culture mediumused to grow HEK293 cells was DMEM (Invitrogen), SK-N-MC and IMR32 were grown in MEM (Invitrogen) supplementedwith 2 mM L-glutamine (Invitrogen), and SH-SY5Y and SK-N-AS were grown in DMEM:F12 (Invitrogen) supplementedwith 2 mM L-glutamine and 1% non-essential amino acids(Invitrogen). KELLY, PFSK1, GM22671, and GM22737 weregrown in RPMI 1640 media (Sigma-Aldrich, MO, USA)supplemented with 2 mM glutamine.
FOXP2 Expression Analysis (qPCR)Cells were lysed in TRIzol (Invitrogen) and RNA was extractedusing RNeasy Spin Columns (Qiagen, NRW, Germany). Reversetranscription was performed on 2000 ng of RNA using the HighCapacity cDNA Reverse Transcription Kit (Applied Biosystems,CA, USA) using random primers, according to the manufacturerprotocol. Relative expression levels were determined by real-timequantitative PCR (qPCR) using iQ SYBR Green Supermix(Bio-Rad, CA, USA). FOXP2 mRNA was amplified using exonspanning primers with the forward primer in exon 5 (5′-ACAGCATCCTGGAAAGCAAG-3′) and reverse primer in exon 6(5′-ATGGAGATGAGTCCCTGACG-3′). The expression of theGAPDH housekeeping gene was quantified using the followingprimers: forward 5′-AAGGTGAAGGTCGGAGTCAAC-3′,reverse: 5′-GGGGTCATTGATGGCAACAATA-3′. Differentialexpression (dCt) was determined by normalizing the Ct valueof FOXP2 mRNA to the Ct value of GAPDH mRNA. We thencompared the FOXP2 expression across all the cell lines, usingthe expression level in HEK293 cells as reference (using the ddCtmethod) (Livak and Schmittgen, 2001).
Chromatin Immunoprecipitation (ChIP)A total of 2.5 × 10⁷ cells were crosslinked with 0.5%formaldehyde for 10 min at room temperature (RT). Afterquenching the reaction with 125 mM glycine, the lysate wassonicated using 12 cycles of sonication (30 s on/30 s off) in aBioruptor (Diagenode, Belgium), set to “high” frequency. 2 µlof POLR2A antibody (Diagenode, Cat# AC-055-100) was usedto immunoprecipitate chromatin fragments, rotating overnightat 4◦C. Purified DNA fragments were eluted in 50 µl TE.Enrichment of target DNA fragments was detected via qPCRusing the iQ SYBR Green Supermix (Bio-Rad) on 2 µl sampleDNA according to the manufacturer’s protocol. Primer sequencesfor each target fragment are listed in Supplementary Table S1.Statistical significance was assessed using pairwise ANOVA andpost hoc Tukey test.
Chromatin Conformation Capture (3C)We used a modified 3C protocol based on Hagege et al. (2007).1 × 106 cells were crosslinked using 0.5% formaldehyde for10 min at RT. Cells were lysed via homogenisation using a douncetissue grinder. Chromatin was digested overnight at 37◦C with400 units of BglII (New England Biolabs, MA, USA). Followingthis, another 200 units of BglII restriction enzyme were added tothe reaction for 1 h at 37◦C. Restriction enzymes were inactivatedby adding SDS (2% final) and incubation for 30 min at 37◦C
followed by addition of Triton X-100 (2% final) to quench SDS.Fragments were ligated using 50 units of T4 Ligase (Roche,Switzerland) in 5 ml reaction volume at 16◦C overnight (ligationwas performed in a high volume to favor ligation events betweencross-linked DNA strands). Cross links were reversed at 65◦Covernight in the presence of Proteinase K (0.5 mg/ml), andsamples were then purified via phenol extraction.
Sample quantification was performed via real-time qPCR,using iQ SYBR Green (Bio-Rad) and compared against astandard curve (range 5–1000 ng) generated using humangenomic DNA (Novagen). Quantification of specific ligationproducts was done by TaqMan real-time PCR using SsoFastProbes Supermix (Bio-Rad) according to the manufacturer’sprotocol. Primer sequences are listed in SupplementaryTable S2. The sequence of the custom made MGB-TaqManprobe was 5′-GATCTCTTAAACCACTGGGAATTCA-3′(Applied Biosystems) and matches the sequence on chromosome7 from nucleotide 113,732,166 to 113,732,190 (reference genomehg19). The delta Ct value for each ligation product was calculatedby subtracting the Ct value from the average Ct value of the sameligation product in EBV-lymphoblast cell lines. If the ligationproduct could not be detected in the EBV cell lines, a value of40 was subtracted, which is equal to the lowest detected ligationproduct in the EBV cell lines. From the Ct values, we calculatedthe relative amount of starting ligation products by raising thenegative Ct value to the power of two, which is a measure of theinteraction frequency. Finally, we derived the relative interactionfrequency by normalizing to the ligation product with the lowestvariation across all cell lines (primer at−11 kb).
The anchor point primer and TaqMan probe were designedto match the restriction fragment that contains the firsttranscriptional start site (TSS1) of the FOXP2 gene. Detectionprimers were designed to be complementary to the 5′ end ofBglII restriction fragments so that the amplicons of the ligationproducts were not bigger than 250 bp. Primers were designed tomatch genomic fragments up to 106 kb upstream and 1,391 kbdownstream of TSS1, spanning a total of 1,497 kb around theFOXP2 gene locus. Within this genomic region, there are 428restriction fragments produced by BglII digestion. Primers weredesigned for 50 of these fragments. The linear amplification rangeof the primers was assessed using standard curves of the PCRreaction on 3C samples with standardized concentrations (50,125, 250, 500, 750, and 1,000 ng). Forty-five primers passedthis quality control step, and they covered fragments of atotal size of 218 kb. All primers are listed in SupplementaryTable S2.
Statistical significance of the difference of 3C crosslinkingfrequencies to LBV-lymphoblast cell crosslinking frequencies wasassessed using two-tailed student t-tests. P-values were correctedfor the number of investigated interactions (45) using Benjamini-Hochberg correction.
Luciferase Reporter AssaysRegulatory sequences were cloned from healthy human genomicDNA (Novagen) using Advantage 2 Polymerase kit (Clontech,CA, USA) according to the manufacturer’s protocol. Cloningprimers are listed in Supplementary Table S3. PCR products
Frontiers in Molecular Neuroscience | www.frontiersin.org 3 February 2018 | Volume 11 | Article 47

fnmol-11-00047 February 19, 2018 Time: 14:51 # 4
Becker et al. Mapping FOXP2 Enhancers Reveals Regulation
were first cloned into the pCR2.1-TOPO vector using the TOPOTA Cloning Kit (Invitrogen), then subcloned into pGL4.23(Promega) and confirmed via Sanger sequencing. Promoterelements were subcloned using SacI (5′) and XhoI (3′) restrictionsites. Enhancer elements were subcloned using KpnI (5′) andXhoI (3′).
For luciferase assays, HEK293 or SK-N-MC were transfectedusing GeneJuice Transfection Reagent (Merck Millipore, MA,USA), with 48 ng of pGL4.23-Enhancer and 6 ng of pGL4-hRLuc-TK control plasmid (Promega, WI, USA). Luciferase enzymaticactivity was determined using the Dual-Luciferase Assay System(Promega) in a TECAN Infinite 2002 plate reader (TECAN,Switzerland). The promoter and enhancer activities were eachdetected in three biological replicates. To test the effects of TFson the enhancers and promoters, pGL4.23-enhancer/promoterand TF over-expression plasmids were co-transfected in HEK293cells. FOXP1, FOXP2, and FOXP4 were overexpressed from apcDNA3 vector (Vernes et al., 2006). TBR1 and CASK wereoverexpressed from a pYFP vector (Deriziotis et al., 2014).Cells were transfected with 2 ng of pGL4.23-promoter/enhancer,2 ng of pGL4.74-hRLuc-TK and 10 ng of the individual TFplasmid.
To determine the basal activities, the relative firefly luciferaseactivities of the promoter/enhancer elements were comparedto the firefly luciferase activity of the empty (minP) constructwithin the same cell lines. Statistical significance of thebasal enhancer and promoter activities were assessed usingpairwise ANOVA and post hoc Least Significant Difference(LSD) tests. The luciferase activity was compared betweenco-transfection of TFs or empty pcDNA4 vectors. Weroutinely used pcDNA4 as control because co-transfectionof empty pYFP vectors with the promoter and enhancerconstructs yielded comparable results (data not shown). Thedifference between empty plasmid and TF overexpression wasassessed per individual element and the statistical significancewas assessed using two-way ANOVA and post hoc LSDtests.
RESULTS
Identification of Active FOXP2 Promotersin Human Cell LinesTo map FOXP2 enhancer regions in human cells, it wasfirst necessary to determine which cell lines express FOXP2endogenously and which promoter(s) may drive this endogenousexpression. We tested endogenous expression of FOXP2 in sixhuman neuroblast cell lines (SK-N-MC, PFSK1, KELLY, SK-N-AS, IMR32, and SH-SY5Y), and one kidney derived cell line(HEK293). HEK293 cells are already known to endogenouslyexpress FOXP2 and have been previously used by us and othersto study its function (Vernes et al., 2006; Fu et al., 2014;Sin et al., 2015; Estruch et al., 2016). We compared FOXP2expression in the six neuroblast and two EBV-transformedlymphoblast cell lines (GM22671 and GM22737), relative toHEK293 cells (Figure 1). We included EBV cell lines hereas they would be used to control for chromatin interactions
FIGURE 1 | Endogenous expression of FOXP2 in human cell lines.Endogenous expression of FOXP2 mRNA in HEK293, SK-N-MC, PFSK1,KELLY, IMR32, SK-N-AS, SH-SY5Y, and EBV cell lines (GM22671 andGM22737) as determined by RT-qPCR. A no template control (NTC) was alsoincluded. All expression levels have been normalized to HEK293 levels as thiscell line is well established to show strong expression of FOXP2.
in our subsequent 3C experiments. SK-N-MC cells showedcomparable FOXP2 expression levels to HEK293 cells, whereasPFSK1 expression was approximately 80% lower. None of theother neuroblast lines expressed detectable levels of FOXP2.Expression in EBV cell lines was detectable, but extremely low(Figure 1).
Transcription of the human FOXP2 gene may be initiatedfrom one of four previously described TSSs (Figure 2A),which display cell line- and tissue-specific activity (Schroederand Myers, 2008). To identify which of these TSSs wereactive in HEK293 cells we first assessed RNA Polymerase II(PolII) occupancy followed by luciferase reporter assays of theputative promoter fragments. PolII occupancy is an indicatorof transcription initiation and active promoter regions (Bonnet al., 2012; Core et al., 2012; Le Martelot et al., 2012). To mapPolII occupancy across the four alternative TSSs we performedPolII chromatin immunoprecipitation (ChIP), followed by qPCRof the pulled down DNA fragments. Ten qPCR primers weredesigned, spanning the four alternative TSSs (Figure 2A;Supplementary Table S1). Primers complementary to a regionthat is not bound by PolII (within exon 2 of the myoglobingene, as shown in previous studies) were used as a negativecontrol. Significant enrichment was observed for DNA fragmentsspanning primer pairs 2 and 3 (adjacent to TSS1) and primerpair 9 (adjacent to TSS4), indicating that these regions may beactive promoters (Figure 2B). Primer pair 2 was a good candidatefor the location of an active promoter as it was just upstreamof TSS1, which was previously shown to be active in HEK293cells (Schroeder and Myers, 2008). As such we also testedPolII occupancy at the position of primer pair 2 in SK-N-MC
Frontiers in Molecular Neuroscience | www.frontiersin.org 4 February 2018 | Volume 11 | Article 47

fnmol-11-00047 February 19, 2018 Time: 14:51 # 5
Becker et al. Mapping FOXP2 Enhancers Reveals Regulation
FIGURE 2 | Promoter 1 of FOXP2 drives endogenous expression. (A) Linear representation of the genomic location on chromosome 7q31, encompassing the 5′
end of the FOXP2 gene. The first exons of FOXP2, from exon S1 to exon2 are shown as white boxes with promoters and transcriptional start sites (TSSs) at exonS1, 1, 1b and 2 indicated by arrows. The first upstream ATG start codon is located in exon 2. The relative location of the ten qPCR primer pairs used for RNAPolIIChIP are indicated by blue lines and numbered 1–10. (B) RNA polymerase II (RNAPolII) occupancy at the promoter regions of FOXP2, as measured by ChIP-qPCR.The relative PolII occupancy in HEK293 cells is shown for each primer pair and for myoglobin exon 2, which is used as a negative control. RNA-PolII occupancy isnormalized to a positive control region at the GAPDH promoter. (C) Normalized PolII occupancy at TSS1 primer pair 2 and myoglobin exon 2 (negative control) isshown for the cell lines HEK293, SK-N-MC, KELLY, and IMR32. The qPCR was performed in duplicate. Significance was determined in comparison to the negativecontrol by ANOVA followed by post hoc Tukey tests. ∗p < 0.05. (D) Schematic representation of the firefly luciferase constructs tested in (E). Promoter elements(TSS) were cloned to replace the minimal promoter (minP) in pGL4.23. (E) Relative luciferase activity of promoter elements driving firefly luciferase gene expression inHEK293 and SK-N-MC cells. The promoter constructs were co-transfected with the pGL4.74 control plasmids expressing the renilla luciferase under the control of aherpes simplex virus thymidine kinase (HSV-TK) promoter. The firefly luciferase signal was divided by the renilla signal to derive the relative luciferase activity. Theactivity for each luciferase construct was normalized for the activity observed for the minimal promoter (minP). The constructs were measured in two independentexperiments in a total of six biological replicates. The statistical significance of the difference between each construct and minP was determined with two-wayANOVA and post hoc LSD testing. ∗p < 0.05, ∗∗p < 0.001.
neuron-like cells that endogenously express FOXP2, and twoneuron-like cell lines that do not express endogenous FOXP2(KELLY and IMR32 cell lines). PolII was strongly enrichedin SK-N-MC cells (∼8-fold stronger enrichment compared to
HEK293 cells), but was not enriched in KELLY or IMR32 cells(Figure 2C).
Since there was PolII enrichment just upstream of TSS1 in thetwo FOXP2 positive cell lines tested (HEK293 and SK-N-MC),
Frontiers in Molecular Neuroscience | www.frontiersin.org 5 February 2018 | Volume 11 | Article 47

fnmol-11-00047 February 19, 2018 Time: 14:51 # 6
Becker et al. Mapping FOXP2 Enhancers Reveals Regulation
we went on to determine if TSS1 was an active promoter andcould drive reporter gene expression in both cell lines. We cloneda 1,791 bp fragment that spanned 1,547 bp upstream of TSS1(including the primer regions 1 and 2) and 244 bp downstream(including part of the 5′UTR of FOXP2 but excluding the startcodon). This fragment was placed upstream of a firefly luciferasereporter gene to act as its promoter (Figure 2D). We alsocompared expression from constructs containing comparablefragments spanning TSS2 (∼4.1 kb fragment) and TSS3 (∼1 kbfragment). These regions had not shown PolII occupancy inHEK293 cells, suggesting they are inactive promoters and thusthey are not expected to be able to drive luciferase expressionabove the level of the baseline control. The baseline control wasan equivalent construct containing a minimal promoter region(minP) (Figure 2D). Details of the cloned elements are given inTable 1. Measurement of relative luciferase activity recapitulatedthe pattern observed for PolII occupancy. The fragment spanningTSS1 resulted in significantly stronger reporter gene expressionin both HEK293 and SK-N-MC lines, but the effect was ∼8-fold stronger in SK-N-MC cells (Figure 2E). The ability of TSS1to drive expression in HEK293 cells is consistent with previousreports (Schroeder and Myers, 2008). The fragments spanningTSS2 and TSS3 did not increase luciferase activity above the levelsof the minP baseline control, confirming them as inactive regionsin these cell lines. These data suggest that TSS1 represents anactive FOXP2 promoter region in HEK293 and SK-N-MC celllines. As such we went on to use TSS1 to identify putative FOXP2enhancers that make contact with this promoter region.
Identification of Putative FOXP2Enhancers via Chromatin ConformationCapture (3C)Identifying enhancer regions is challenging as they can befound at distances of up to 1 Mb from the genes they regulate(Pennacchio et al., 2013). However, in order to contribute to generegulation, enhancers loop around to make physical contact withpromoter regions, facilitating the formation of protein complexesthat drive gene expression. Chromatin conformation capture(3C) is a method that allows these three-dimensional contactsto be identified (Figures 3A–E). In brief, the method involvescross linking cells to preserve endogenous three-dimensionalstructures (Figure 3B), digesting the DNA using a restrictionenzyme with evenly spaced digestion sites (in our case BglII) tocreate overhangs in the looped DNA (Figure 3C), and directlyligating these previously physically distant overhangs to eachother (Figure 3D). After reversal of cross links and DNA
TABLE 1 | FOXP2 cloned promoter (TSS) sequences used for reporter assays.
Element Size(bp)
Start(hg19)
End(hg19)
Meanconservation(phastCons)
TSS1 1,791 113,724,817 113,726,609 0.34
TSS2 4,104 114,051,220 114,055,324 0.78
TSS3 1,006 114,055,454 114,056,459 0.93
extraction, the ligated ends can be detected via PCR amplificationof primers that span the two regions (i.e., promoter and putativeenhancer region) (Figure 3E). The presence of a PCR productdemonstrates that the two regions were in close physical contactin the endogenous cell line.
Because TSS1 was strongly active in both HEK293 and SK-N-MC cell lines, we identified the putative enhancer elements thatmade contact with this promoter region. To this end, we designeda Taqman probe to the 3′-end of the BglII restriction fragmentthat contains TSS1 (Figures 3A,E). We then used reverse primerswithin 45 restriction fragments (hereafter called ‘3C fragments’),spanning four genomic regions that were considered likely tocontain enhancers regulating FOXP2 (Figure 3F). The majorityof enhancers can be found within 200 kb distance of a TSS (Liet al., 2013) and cluster 1 targets enhancers in a 200 kb windowaround TSS1, which spans the intergenic region between FOXP2and PPP1R3A and the first intron of FOXP2 (Figure 3F: Cluster1). Cluster 2 targets a 100 kb window around the alternativestart sites TSS2-4 of FOXP2 (Figure 3F: Cluster 2). Cluster 3targets the intergenic region between the FOXP2 and the MDFICgene including the 3′-end of FOXP2 and the 5′-end of MDFIC(including exons 1–3 and intron 4) (Figure 3F: Cluster 3).This cluster includes a previously reported functional enhancerthat was suggested to regulate FOXP2 (Becker et al., 2015).In addition, two target primers were designed to an intronicregion 460 kb downstream of the MDFIC gene (Figure 3F:Cluster 4). We performed 3C in the seven human cell linesdescribed above, along with two EBV-transformed lymphoblastcell lines which acted as a baseline reference since FOXP2expression is low in EBV cells (Figure 1) and we do notexpect neuronal enhancers to be active in these blood-derivedcells.
Because the TSS1/promoter 1 is active in HEK293 cellsand they strongly express endogenous FOXP2, we first assessedthe interactions of the 45 different 3C fragments with TSS1in these cells, compared to the ‘baseline’ EBV cell lines. Wemapped the relative enrichment of each fragment in HEK293cells by first normalizing each interaction to a promoter-adjacentfragment, which is in close linear sequence proximity to promoter1 (located at −11 kb) (Figure 4A). We chose this fragmentbecause it showed the lowest variation across all cell lines, likelycaused by interactions facilitated by linear sequence proximity.We further normalized to the interactions in the EBV control.We compared the interactions in HEK293 cells with the EBVbaseline using two-sided t-tests and adjusted for multiple testingby Benjamini-Hochberg correction. Eleven fragments (−37, 70,329, 330, 346, 353, 604, 621, 706, 772, and 843) displayedsignificant enrichment in HEK293 cells (Figure 4B, Table 2and Supplementary Table S4), suggesting that they physicallyinteract with TSS1/promoter 1.
Unlike HEK293 cells, SK-N-MC and PFSK1 cells are neuron-derived cell lines, but all three cell lines endogenously expressFOXP2 (Figure 1). As such, we mapped the relative enrichment ofthe 45 3C fragments in SK-N-MC and PFSK1 cells to determineif the pattern observed in HEK293 cells was conserved in theseother FOXP2 expressing neuronal cell lines. Thirteen regionsin SK-N-MC and six regions in PFSK1 cells were significantly
Frontiers in Molecular Neuroscience | www.frontiersin.org 6 February 2018 | Volume 11 | Article 47

fnmol-11-00047 February 19, 2018 Time: 14:51 # 7
Becker et al. Mapping FOXP2 Enhancers Reveals Regulation
FIGURE 3 | Chromatin conformation capture (3C) design for the FOXP2 gene locus. (A) Possible enhancer elements (blue blocks) are distant to their targetpromoters (red block and arrow) on a linear representation of the genome. Specific target primers (black arrows) are designed at BglII restriction sites (black dottedlines). (B) In living cells the genome is folded by proteins (green spheres) and active enhancers contact their target promoters. The chromatin packed genome iscross-linked in this state and digested with BglII restriction enzymes. (C) The genomic fragments and DNA overhangs remain in physical proximity. The DNA isdiluted to favor proximity ligations between these genomic fragments. (D) Genomic fragments that were distant in the linear genome are ligated to form one shortDNA ligation product. (E) The primers that were distant in the genome are now close enough to amplify from the ligation product. (F) The genomic location of theFOXP2 gene. The gene structure of FOXP2 and the neighboring genes PPP13RA and MDFIC are shown in dark blue. The anchor point primer is located at the distalpromoter 1 and shown in red. The 3C target primers (depicted in blue) were designed to cluster at four locations of the gene locus: Cluster 1 is around the anchorpoint at TSS1. Cluster 2 is clustered around the downstream promoters TSS2-4. Cluster 3 is located at the downstream intergenic region between the FOXP23′UTR and MDFIC. Cluster 4 is downstream of the MDFIC gene. FOXP2 TSS1 is located at nucleotide 113,726,365 of the human genome in chromosome 7 (hg19).The 3C primers (blue bars) were designed just upstream of the predicted BglII restriction sites.
enriched (Figure 4C and Table 2). A number of these regionswere shared between SK-N-MC and PFSK1 cells (region −39,−37, 53, 604, 843), between SK-N-MC and HEK293 cells (−37,70, 329, 330, 604, 706, 843), between PFSK1 and HEK293 cells(−37, 604, 843), or between all three cell lines (−37, 604, 843)and thus may represent common enhancer regions used incells endogenously expressing FOXP2. Two regions (−39 and53) were significantly enriched in both neuronal cell lines, butnot in HEK293 cells, which may point to neuronal specificactivity. In total we detected eighteen chromatin interactions
between genomic regions and TSS1/promoter 1 in FOXP2expressing cell lines, which were not observed in lymphoblastcells (EBVs).
To determine if these chromatin interactions were unique toFOXP2 expressing cell lines we also measured the 3C relativeenrichment in four neuroblast cell lines for which endogenousFOXP2 could not be detected; KELLY, IMR32, SH-SY5Y and SK-N-AS cells (Figure 4D and Supplementary Table S4). Many ofthe peaks of enrichment observed in the FOXP2 positive cellslines (Figures 4B,C), were also present in the FOXP2 negative
Frontiers in Molecular Neuroscience | www.frontiersin.org 7 February 2018 | Volume 11 | Article 47

fnmol-11-00047 February 19, 2018 Time: 14:51 # 8
Becker et al. Mapping FOXP2 Enhancers Reveals Regulation
FIGURE 4 | Chromatin conformation capture (3C) interaction landscape at the FOXP2 gene locus. Chromatin interactions at the FOXP2 gene measured bychromatin conformation capture (3C). (A) Schematic representation of the genomic locus of PPP1R3A, FOXP2, and MDFIC. The indicated promoters (TSSs; arrows)and 3′UTR (black bar) align with the data points of the following 3C graphs. (B–D) The relative interaction frequencies of genomic fragments to the promoter anchorpoint are shown according to their distance to the TSS. (B) Chromatin interactions in HEK293 and EBV cell lines. (C) Interactions in neuronal-like FOXP2 positive celllines SK-N-MC and PFSK1. (D) Interactions in neuronal-like FOXP2 negative cell lines KELLY, IMR32, SH-SY5Y, and SK-N-AS. For all sections, the cross-linkingfrequencies for each target primer were normalized to the cross-linking frequency of the target primer at –11 kb (internal normalization). The cross-linking frequencyfor each target primer was normalized to the average cross-linking frequency of three measurements in two EBV lymphoblast cell lines (between samplenormalization). All interactions were determined in three biological replicates. Significance was calculated using two-tailed student t-tests. P-values were correctedfor the amount of tested genomic fragments using Benjamini-Hochberg correction. ∗p-value < 0.01; ∗∗p-value < 0.001.
cells (Figure 4D). However, overall, the enrichment observed inFOXP2 negative cells was much weaker than in FOXP2 positivecell lines.
In Silico Prediction of EnhancerElements within 3C FragmentsThe 3C fragments at −37, 330, and 843 showed the strongestand most consistent enrichment in the FOXP2 positive celllines (Figures 4B,C). However, since these interactions weredetected in human cell lines, we used publicly available chromatin
interaction data (Hi-C) of human post-mortem samples (Wonet al., 2016; Zhang et al., unpublished) to evaluate the interactionsin fetal and adult brain tissue. We visualized chromatininteractions in the browser application supplied by YUE lab(Wang et al., unpublished). In fetal cortical tissue, chromatininteractions between TSS1 and 3C fragments −37, 330, and 843can be observed (Supplementary Figure S1). In adult corticaltissue, these interactions are weaker and comparable to thebackground dynamics of chromatin interactions at this genomiclocus. Thus, the public data confirms the presence of the 3C
Frontiers in Molecular Neuroscience | www.frontiersin.org 8 February 2018 | Volume 11 | Article 47

fnmol-11-00047 February 19, 2018 Time: 14:51 # 9
Becker et al. Mapping FOXP2 Enhancers Reveals Regulation
TABLE 2 | Significant 3C fragment interactions in FOXP2 expressing cell lines.
HEK293 SK-N-MC PFSK1
3C-fragment Mean interactionfrequency
adjustedp-value
Mean interactionfrequency
adjustedp-value
Mean interactionfrequency
adjustedp-value
−59 3.99 1.23E−01 2.84 4.33E−03 0.99 4.61E−01
−39 15.69 5.50E−02 15.95 3.35E−06 10.01 5.72E−03
−37 53.64 3.19E−03 21.55 6.97E−03 12.10 2.27E−03
13 3.13 1.08E−01 17.86 4.09E−03 3.44 1.15E−01
17 0.62 2.93E−01 3.06 2.47E−03 0.70 4.86E−01
53 10.53 6.25E−02 21.08 3.24E−04 7.69 1.06E−03
70 5.93 1.97E−03 12.33 1.13E−04 3.10 3.59E−01
329 9.22 2.68E−04 13.77 3.46E−04 1.99 5.50E−01
330 45.28 4.86E−03 65.26 5.37E−04 8.56 1.10E−01
335 2.97 4.79E−02 3.65 5.63E−04 0.98 9.06E−01
342 0.70 1.46E−01 1.14 3.02E−01 0.19 3.66E−03
346 32.82 1.57E−03 62.29 1.68E−02 12.77 5.22E−02
353 5.24 3.01E−03 6.79 3.37E−02 2.05 6.79E−02
604 60.15 3.55E−03 0.00 1.77E−23 9.88 8.01E−03
621 39.55 9.72E−03 0.67 2.56E−01 3.94 1.46E−02
706 7.94 1.26E−03 16.26 2.43E−03 0.88 3.65E−01
772 32.41 3.18E−06 1.00 1.00E+00 2.80 3.60E−01
843 67.39 4.68E−04 83.28 1.68E−08 19.30 7.16E−03
Bold represents significant p-values (p < 0.01).
interactions with TSS1 and suggests that they are present in thedeveloping human brain.
Because our 3C approach utilized the BglII restriction enzyme,it produced 3C fragments of between 1 and 10 kb. Enhancerregions are typically only a few hundred nucleotides in size(Adam et al., 2015), making it necessary to narrow down thelikely position of the putative enhancers within each enriched 3Cfragment. To identify putative enhancer elements within theselarge regions we used functional genomic annotations imputedfrom twelve epigenetic marks (eleven histone modificationsand DNase hypersensitivity) mapped in human neuronal tissueby the Roadmap Epigenomics Project (Bernstein et al., 2010;Ernst and Kellis, 2015; Roadmap Epigenomics et al., 2015).Active neuronal enhancers were predicted by strong histone-3-lysine-4-monomethylation (H3K4Me1) and histone-3-lysine27-acetylation (H3K27Ac) within the 3C fragments at 330 and 843 kb(Table 3). The 3C fragment at−37 kb encompassed a weak neuralenhancer, predicted by strong H3K4Me1 and weak H3K27Ac.In some neuronal Roadmap Epigenomics samples, parts of thesame fragment were annotated as an active TSS, predicted by anabsence of H3K4Me1 and strong histone-3-lysine-9-acetylation(H3K9Ac). In this way, we identified smaller putative enhancerregions within the 3C-interacting fragments.
Putative Enhancer Activity Demonstratedvia Reporter AssaysHaving identified putative enhancer regions via 3C and insilico analysis, we next aimed to verify the ability of theseregions to enhance gene expression using reporter assays. Wecloned the putative enhancer regions (Table 4) upstream of a
TABLE 3 | Epigenetic marks within 3C fragments.
3C fragment Positive enrichment(p-value)
Roadmaps neuronalfunctional element(hg19 coordinates)
HEK293 SK-N-MC
−37 <0.001 N.S. Active TSS(113688600–113688799),Weak enhancer(113688002–113689199)
330 <0.008 <0.001 Active enhancer(114057400–114057799)
843 <0.001 <0.001 Active enhancer(114569600–114570599)
minimal promoter (minP) and firefly luciferase reporter gene(Figure 5A). We compared reporter gene expression fromthese constructs with equivalent constructs lacking an enhancerelement (Figure 5A). The putative enhancer located within 3Cfragment −37 was able to strongly and significantly increasereporter gene expression in both HEK293 and SK-N-MC celllines (Figure 5B). The putative enhancer located within 3Cfragment 330 strongly and significantly drove expression inHEK293 cells, but not SK-N-MC cells. Finally, the putativeenhancer located within 3C fragment 843 was not able to enhancereporter gene expression in either cell line (Figure 5B).
Regulation of the FOXP2 Promoter andEnhancers by Transcription FactorsHerein we have shown that the FOXP2 TSS1/promoter 1 isactive in HEK293 and SK-N-MC cells, and identified putative
Frontiers in Molecular Neuroscience | www.frontiersin.org 9 February 2018 | Volume 11 | Article 47

fnmol-11-00047 February 19, 2018 Time: 14:51 # 10
Becker et al. Mapping FOXP2 Enhancers Reveals Regulation
TABLE 4 | Cloned putative enhancer regions.
Element Size(bp)
Start(hg19)
End(hg19)
Mean conservation in100 vertebrates
(phastCons)
Enhancer −37 774 113688009 113688782 0.023
Enhancer 330 1801 114056845 114058646 0.891
Enhancer 843 3958 114568454 114572411 0.111
FIGURE 5 | Enhancer activity in HEK293 and SK-N-MC. (A) The identifiedputative enhancer elements were cloned upstream of the minimal promoter ina firefly luciferase reporter gene construct. (B) Relative luciferase activity ofenhancer elements driving firefly luciferase gene expression in HEK293 andSK-N-MC cells. The luciferase constructs containing the enhancers and thecontrol vector with the minimal promoter (minP) only were each co-transfectedwith a control vector expressing the renilla luciferase under the control of theHSV-TK promoter. The firefly luciferase signal was divided by the renilla signalto derive the relative luciferase activity. The activity for each luciferaseconstruct was normalized for the activity observed for the minimal promoter(minP). The constructs were measured in two independent experiments in atotal of six biological replicates, with the exception of element 843 in SK-N-MCcells, which was measured in one experiment in three biological replicates.The significance of the difference between each construct and minP wasdetermined with two-way ANOVA and post hoc LSD testing. ∗∗p < 0.001.
enhancer regions that make physical contact with this promoterand can enhance gene expression in reporter assays (enhancer−37 and 330). In a previous study we also identified a putativeenhancer element downstream of FOXP2 at position 815 (named‘Element 1’ in that study), which was disrupted in a child withlanguage impairment and could drive gene expression in bothHEK293 and SK-N-MC cell lines (Becker et al., 2015). Giventhat little is known about the TFs that regulate the expressionof FOXP2, we set out to determine if these three enhancerregions or the FOXP2 promoters themselves could be regulatedby selected TFs. TFs often regulate their own expression in
positive or negative feedback loops (Crews and Pearson, 2009;Bhatia et al., 2013), and thus we first tested if FOXP2 protein wascapable of auto-regulation via interaction with TSS1/promoter1 or enhancers −37, 330, and 815. Given its close homology toFOXP1 and FOXP4 and their overlapping expression patterns, wealso tested these other FOXP family members for their ability toregulate gene expression via interaction with these regions. Lastly,the TBR1 TF displays an overlapping expression pattern withFOXP2 and these proteins are known to interact to regulate geneexpression (Deriziotis et al., 2014). As such we also asked if TBR1was able to regulate FOXP2 expression, either in the presence orabsence of CASK, a co-activating factor that interacts with TBR1to regulate genes underlying cortical development (Hsueh et al.,2000; Deriziotis et al., 2014).
A small but significant increase in reporter gene expressionwas observed when either FOXP2 or FOXP1 were introducedinto cells alongside the TSS1/promoter 1 fragment (Figure 6A,left panel). No increase was observed when TBR1 or CASK alonewere introduced, but when these co-factors were introducedtogether to the same cells, they resulted in a significant increasein the reporter gene expression driven by the TSS1/promoter 1(Figure 6A, right panel). From these reporter gene assays, we canconclude that FOXP2, FOXP1 and TBR1-CASK can drive geneexpression from the FOXP2 TSS1/promoter 1 region.
To determine if these TFs could also drive gene expressionby interacting with the three identified FOXP2 enhancer regions,we transfected the same set of TFs into cells alongside reporterconstructs containing enhancer region−37, 330 or 815 upstreamof a minimal promoter and the firefly luciferase reporter gene(Figure 6B). Co-transfection with FOXP2 or FOXP1 led to asignificant increase in expression driven by enhancers −37 and815 (Figure 6B, left panel). FOXP4 significantly increased geneexpression when enhancer −37 was present and led to a smallbut statistically significant decrease in expression in the presenceof enhancer 330 (Figure 6B, left panel). TBR1 or CASK aloneled to a small but statistically significant reduction in expressiondriven by enhancer −37 and TBR1 alone also reduced geneexpression via enhancer 330 (Figure 6B, right panel). However,co-transfection of TBR1 and CASK resulted in a significantincrease in reporter gene expression, driven by enhancer −37(Figure 6B, right panel). Thus, FOXP2, FOXP1, FOXP4, andTBR1-CASK can all influence gene expression by interacting withone or more of the identified FOXP2 enhancer elements.
DISCUSSION
Herein we describe the first systematic exploration of enhancerregions of human FOXP2. Our data show that TSS1 is an activepromoter in human cell lines and identify eighteen differentgenomic regions that are in physical contact with this promoteracross the cell lines tested, which differ in origin and endogenousFOXP2 expression. We show that two of these regions (located37 kb upstream and 330 kb downstream of TSS1, respectively)are able to enhance gene expression in reporter assays. Wealso show that these regions, along with a previously identifiedputative enhancer (located 815 kb downstream of TSS1) and the
Frontiers in Molecular Neuroscience | www.frontiersin.org 10 February 2018 | Volume 11 | Article 47

fnmol-11-00047 February 19, 2018 Time: 14:51 # 11
Becker et al. Mapping FOXP2 Enhancers Reveals Regulation
FIGURE 6 | Regulation of FOXP2 promoter and enhancers by transcription factors. Relative luciferase activity of promoter elements (A) or enhancer elements(B) after co-transfection with FOXP2, FOXP1, FOXP4, TBR1, CASK and the combination of TBR1 with CASK in HEK293 cells. The renilla luciferase control plasmidwas used for internal normalization. An empty pcDNA4 vector (EMPTY) that did not express any transcription factors was included as a control. Note that HEK293cells have been shown to endogenously express FOXP1, FOXP2, FOXP4, and CASK, but not TBR1 (Thul et al., 2017). The firefly luciferase signal was divided by therenilla signal to derive the relative luciferase activity. The activity for each luciferase construct was normalized to the co-transfection condition using an emptyplasmid. Each combination was tested in three biological replicates. The statistical significance of the TF overexpression effect was determined with two-way ANOVAand post hoc LSD testing for each construct. ∗p-value < 0.05.
TSS1 promoter, can all be regulated by FOXP family members.Promoter 1 and the 37 kb upstream enhancer are also regulatedby the TBR1/CASK complex.
Of the three TSSs tested via reporter assays, only TSS1 wasactive in HEK293 and SK-N-MC cell lines and as such we usedthis promoter to identify physical interactions and map enhancerregions. TSS2 and TSS3 were not significantly different fromthe baseline (minimal) promoter. This is consistent with whathas been previously observed in human cell lines (Schroederand Myers, 2008). Thus, TSS1 seems to be a key promoterof FOXP2 expression, both in neuronal (SK-N-MC) and non-neuronal (HEK293) human cells. However, these experimentswere carried out using in vitro cell lines and as such we couldnot capture the full range of conditions under which these TSSswould be functional. Indeed, TSS2-3 have been shown to be activein human tissues including the basal ganglia, trachea and colon(Schroeder and Myers, 2008).
We compared the physical interactions of enhancers inneuronal and non-neuronal cell lines, with and withoutendogenous FOXP2 expression. Cells that had endogenous
FOXP2 expression (HEK293, SK-N-MC, and PFSK1) showedcomparable patterns despite one of the cell lines being non-neuronal. Only two regions (located 39 kb upstream and 53 kbdownstream) showed significant interaction in the neuronalFOXP2 positive cell lines that were not seen in the non-neuronal FOXP2 positive line. This could point to a neuronspecific function for these putative enhancers, however, furtherexperimental work such as testing in more neuronal andnon-neuronal cells/tissues and functional validation of theseenhancers is required to demonstrate if this is indeed thecase. When comparing all the FOXP2 positive and FOXP2negative cell lines, many of the same regions were significantlyenriched, however, the magnitude of the relative enrichmentwas substantially lower in FOXP2 negative cells. Thus it may bethat in cells that do not express FOXP2, these enhancer regionsmake contact with TSS1 less frequently, or that the interactionsare less stable, possibly due to a lack of stabilizing TF complexformation (Ong and Corces, 2014; Allen and Taatjes, 2015).A limitation of this study is that the 3C interactions were obtainedin immortalized human cell lines. However, Hi-C undertaken in
Frontiers in Molecular Neuroscience | www.frontiersin.org 11 February 2018 | Volume 11 | Article 47
fnmol-11-00047 February 19, 2018 Time: 14:51 # 12
Becker et al. Mapping FOXP2 Enhancers Reveals Regulation
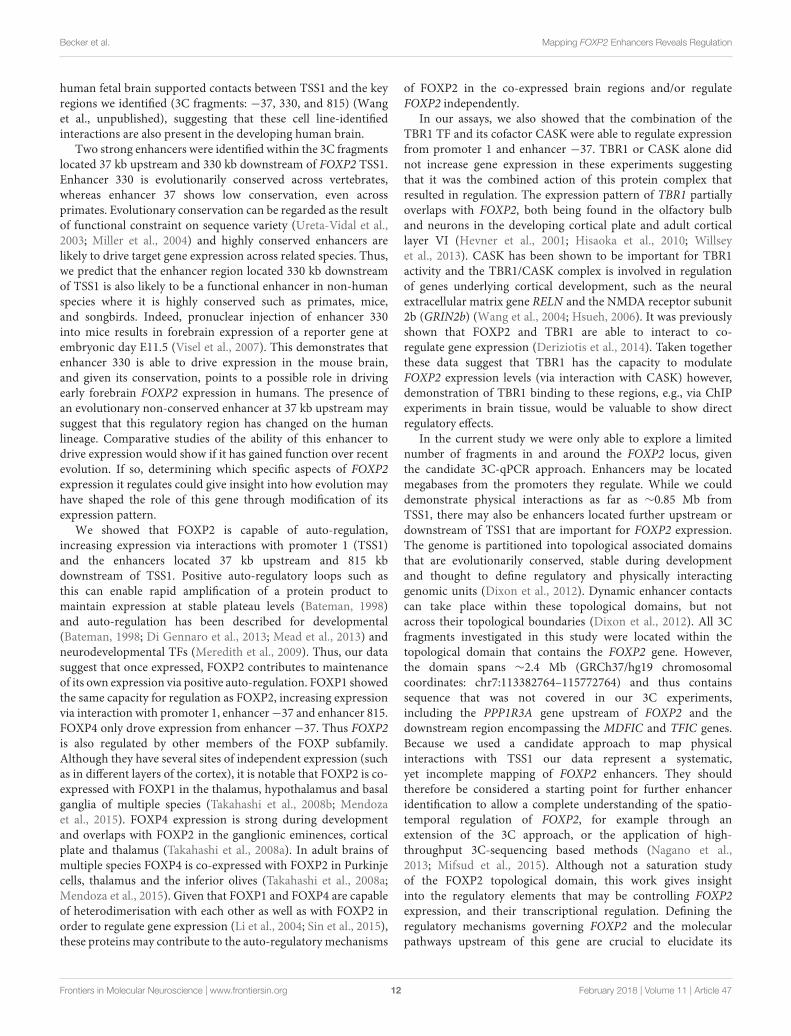
human fetal brain supported contacts between TSS1 and the keyregions we identified (3C fragments: −37, 330, and 815) (Wanget al., unpublished), suggesting that these cell line-identifiedinteractions are also present in the developing human brain.
Two strong enhancers were identified within the 3C fragmentslocated 37 kb upstream and 330 kb downstream of FOXP2 TSS1.Enhancer 330 is evolutionarily conserved across vertebrates,whereas enhancer 37 shows low conservation, even acrossprimates. Evolutionary conservation can be regarded as the resultof functional constraint on sequence variety (Ureta-Vidal et al.,2003; Miller et al., 2004) and highly conserved enhancers arelikely to drive target gene expression across related species. Thus,we predict that the enhancer region located 330 kb downstreamof TSS1 is also likely to be a functional enhancer in non-humanspecies where it is highly conserved such as primates, mice,and songbirds. Indeed, pronuclear injection of enhancer 330into mice results in forebrain expression of a reporter gene atembryonic day E11.5 (Visel et al., 2007). This demonstrates thatenhancer 330 is able to drive expression in the mouse brain,and given its conservation, points to a possible role in drivingearly forebrain FOXP2 expression in humans. The presence ofan evolutionary non-conserved enhancer at 37 kb upstream maysuggest that this regulatory region has changed on the humanlineage. Comparative studies of the ability of this enhancer todrive expression would show if it has gained function over recentevolution. If so, determining which specific aspects of FOXP2expression it regulates could give insight into how evolution mayhave shaped the role of this gene through modification of itsexpression pattern.
We showed that FOXP2 is capable of auto-regulation,increasing expression via interactions with promoter 1 (TSS1)and the enhancers located 37 kb upstream and 815 kbdownstream of TSS1. Positive auto-regulatory loops such asthis can enable rapid amplification of a protein product tomaintain expression at stable plateau levels (Bateman, 1998)and auto-regulation has been described for developmental(Bateman, 1998; Di Gennaro et al., 2013; Mead et al., 2013) andneurodevelopmental TFs (Meredith et al., 2009). Thus, our datasuggest that once expressed, FOXP2 contributes to maintenanceof its own expression via positive auto-regulation. FOXP1 showedthe same capacity for regulation as FOXP2, increasing expressionvia interaction with promoter 1, enhancer−37 and enhancer 815.FOXP4 only drove expression from enhancer −37. Thus FOXP2is also regulated by other members of the FOXP subfamily.Although they have several sites of independent expression (suchas in different layers of the cortex), it is notable that FOXP2 is co-expressed with FOXP1 in the thalamus, hypothalamus and basalganglia of multiple species (Takahashi et al., 2008b; Mendozaet al., 2015). FOXP4 expression is strong during developmentand overlaps with FOXP2 in the ganglionic eminences, corticalplate and thalamus (Takahashi et al., 2008a). In adult brains ofmultiple species FOXP4 is co-expressed with FOXP2 in Purkinjecells, thalamus and the inferior olives (Takahashi et al., 2008a;Mendoza et al., 2015). Given that FOXP1 and FOXP4 are capableof heterodimerisation with each other as well as with FOXP2 inorder to regulate gene expression (Li et al., 2004; Sin et al., 2015),these proteins may contribute to the auto-regulatory mechanisms
of FOXP2 in the co-expressed brain regions and/or regulateFOXP2 independently.
In our assays, we also showed that the combination of theTBR1 TF and its cofactor CASK were able to regulate expressionfrom promoter 1 and enhancer −37. TBR1 or CASK alone didnot increase gene expression in these experiments suggestingthat it was the combined action of this protein complex thatresulted in regulation. The expression pattern of TBR1 partiallyoverlaps with FOXP2, both being found in the olfactory bulband neurons in the developing cortical plate and adult corticallayer VI (Hevner et al., 2001; Hisaoka et al., 2010; Willseyet al., 2013). CASK has been shown to be important for TBR1activity and the TBR1/CASK complex is involved in regulationof genes underlying cortical development, such as the neuralextracellular matrix gene RELN and the NMDA receptor subunit2b (GRIN2b) (Wang et al., 2004; Hsueh, 2006). It was previouslyshown that FOXP2 and TBR1 are able to interact to co-regulate gene expression (Deriziotis et al., 2014). Taken togetherthese data suggest that TBR1 has the capacity to modulateFOXP2 expression levels (via interaction with CASK) however,demonstration of TBR1 binding to these regions, e.g., via ChIPexperiments in brain tissue, would be valuable to show directregulatory effects.
In the current study we were only able to explore a limitednumber of fragments in and around the FOXP2 locus, giventhe candidate 3C-qPCR approach. Enhancers may be locatedmegabases from the promoters they regulate. While we coulddemonstrate physical interactions as far as ∼0.85 Mb fromTSS1, there may also be enhancers located further upstream ordownstream of TSS1 that are important for FOXP2 expression.The genome is partitioned into topological associated domainsthat are evolutionarily conserved, stable during developmentand thought to define regulatory and physically interactinggenomic units (Dixon et al., 2012). Dynamic enhancer contactscan take place within these topological domains, but notacross their topological boundaries (Dixon et al., 2012). All 3Cfragments investigated in this study were located within thetopological domain that contains the FOXP2 gene. However,the domain spans ∼2.4 Mb (GRCh37/hg19 chromosomalcoordinates: chr7:113382764–115772764) and thus containssequence that was not covered in our 3C experiments,including the PPP1R3A gene upstream of FOXP2 and thedownstream region encompassing the MDFIC and TFIC genes.Because we used a candidate approach to map physicalinteractions with TSS1 our data represent a systematic,yet incomplete mapping of FOXP2 enhancers. They shouldtherefore be considered a starting point for further enhanceridentification to allow a complete understanding of the spatio-temporal regulation of FOXP2, for example through anextension of the 3C approach, or the application of high-throughput 3C-sequencing based methods (Nagano et al.,2013; Mifsud et al., 2015). Although not a saturation studyof the FOXP2 topological domain, this work gives insightinto the regulatory elements that may be controlling FOXP2expression, and their transcriptional regulation. Defining theregulatory mechanisms governing FOXP2 and the molecularpathways upstream of this gene are crucial to elucidate its
Frontiers in Molecular Neuroscience | www.frontiersin.org 12 February 2018 | Volume 11 | Article 47

fnmol-11-00047 February 19, 2018 Time: 14:51 # 13
Becker et al. Mapping FOXP2 Enhancers Reveals Regulation
contributions to the development and functions of neuronalcircuitry underlying speech and language.
AUTHOR CONTRIBUTIONS
SCV, SEF, and MB conceived the study. MB, PD, and SCVacquired and analyzed the data. SCV wrote the article. SCV, MB,PD, and SEF revised and edited the manuscript.
FUNDING
This work was funded by the Max Planck Society. SCV was alsosupported by a Marie Curie Career Integration Grant (PCIG12-GA-2012-333978) and a Max Planck Independent ResearchGroup Grant.
SUPPLEMENTARY MATERIAL
The Supplementary Material for this article can be foundonline at: https://www.frontiersin.org/articles/10.3389/fnmol.2018.00047/full#supplementary-material
FIGURE S1 | Chromatin interactions obtained from publicly available Hi-C data inneuronal tissue samples. Chromatin interactions at chromosome 7 betweennucleotide 113350000 and 114640000 (hg19) determined via Hi-C werevisualized in the “Compare Hi-C” browser application(http://promoter.bx.psu.edu/hi-c/compare.php; last accessed on 05.01.2018)supplied by the YUE lab (Wang et al., unpublished). The middle panel displays thelocation of FOXP2 and the neighboring genes PPP1R3A and MDFIC. The positionof the FOXP2 promoters at TSS1, TSS2, and TSS3 and the putative enhancers−37, 330, 815, and 843, are annotated. The top panel shows the heat map ofchromatin interactions in a sample of human fetal cortical plate tissue (Won et al.,2016) and the bottom panel shows the heat map of chromatin interactions in asample of human adult cortex tissue (Zhang et al., unpublished). Color intensityindicates the strength of the measured chromatin interaction between two distantregions at a resolution of 10 kb. In the fetal cortical plate, TSS1 of FOXP2 showsstronger interactions to genomic regions at enhancers −37, 330, and 843 than toother regions in this genomic locus (black arrows). In the adult cortex, thechromatin interactions between TSS1 and these regions were generally weaker(black arrows). The dashed lines indicate the interaction between 10 kb blockscontaining the elements of interest.
TABLE S1 | ChIP-qPCR Primers.
TABLE S2 | Primers used for 3C-qPCR.
TABLE S3 | Primers used to clone promoter and enhancerregions.
TABLE S4 | Chromatin conformation capture (3C) fragmentinteractions.
REFERENCESAdam, R. C., Yang, H., Rockowitz, S., Larsen, S. B., Nikolova, M., Oristian,
D. S., et al. (2015). Pioneer factors govern super-enhancer dynamics in stemcell plasticity and lineage choice. Nature 521, 366–370. doi: 10.1038/nature14289
Adegbola, A. A., Cox, G. F., Bradshaw, E. M., Hafler, D. A., Gimelbrant, A.,and Chess, A. (2015). Monoallelic expression of the human FOXP2 speechgene. Proc. Natl. Acad. Sci. U.S.A. 112, 6848–6854. doi: 10.1073/pnas.1411270111
Allen, B. L., and Taatjes, D. J. (2015). The Mediator complex: a central integrator oftranscription. Nat. Rev. Mol. Cell Biol. 16, 155–166. doi: 10.1038/nrm3951
Bateman, E. (1998). Autoregulation of eukaryotic transcription factors. Prog.Nucleic Acid Res. Mol. Biol. 60, 133–168. doi: 10.1016/S0079-6603(08)60892-2
Becker, M., Devanna, P., Fisher, S. E., and Vernes, S. C. (2015). A chromosomalrearrangement in a child with severe speech and language disorder separatesFOXP2 from a functional enhancer. Mol. Cytogenet. 8:69. doi: 10.1186/s13039-015-0173-0
Belton, E., Salmond, C. H., Watkins, K. E., Vargha-Khadem, F., and Gadian,D. G. (2003). Bilateral brain abnormalities associated with dominantly inheritedverbal and orofacial dyspraxia. Hum. Brain Mapp. 18, 194–200. doi: 10.1002/hbm.10093
Bernstein, B. E., Stamatoyannopoulos, J. A., Costello, J. F., Ren, B.,Milosavljevic, A., Meissner, A., et al. (2010). The NIH roadmapepigenomics mapping consortium. Nat. Biotechnol. 28, 1045–1048.doi: 10.1038/nbt1010-1045
Bhatia, S., Bengani, H., Fish, M., Brown, A., Divizia, M. T., de Marco, R.,et al. (2013). Disruption of autoregulatory feedback by a mutation in aremote, ultraconserved PAX6 enhancer causes aniridia. Am. J. Hum. Genet. 93,1126–1134. doi: 10.1016/j.ajhg.2013.10.028
Bonkowsky, J. L., Wang, X., Fujimoto, E., Lee, J. E., Chien, C. B., and Dorsky, R. I.(2008). Domain-specific regulation of foxP2 CNS expression by lef1. BMC Dev.Biol. 8:103. doi: 10.1186/1471-213X-8-103
Bonn, S., Zinzen, R. P., Girardot, C., Gustafson, E. H., Perez-Gonzalez, A.,Delhomme, N., et al. (2012). Tissue-specific analysis of chromatinstate identifies temporal signatures of enhancer activity duringembryonic development. Nat. Genet. 44, 148–156. doi: 10.1038/ng.1064
Bruce, H. A., and Margolis, R. L. (2002). FOXP2: novel exons, splice variants, andCAG repeat length stability. Hum. Genet. 111, 136–144. doi: 10.1007/s00439-002-0768-5
Core, L. J., Waterfall, J. J., Gilchrist, D. A., Fargo, D. C., Kwak, H., Adelman, K.,et al. (2012). Defining the status of RNA polymerase at promoters. Cell Rep. 2,1025–1035. doi: 10.1016/j.celrep.2012.08.034
Crews, S. T., and Pearson, J. C. (2009). Transcriptional autoregulationin development. Curr. Biol. 19, R241–R246. doi: 10.1016/j.cub.2009.01.015
Deriziotis, P., O’Roak, B. J., Graham, S. A., Estruch, S. B., Dimitropoulou, D.,Bernier, R. A., et al. (2014). De novo TBR1 mutations in sporadic autism disruptprotein functions. Nat. Commun. 5:4954. doi: 10.1038/ncomms5954
Di Gennaro, A., Spadaro, O., Baratta, M. G., De Felice, M., and Di Lauro, R. (2013).Functional analysis of the murine Pax8 promoter reveals autoregulation and thepresence of a novel thyroid-specific DNA-binding activity.Thyroid 23, 488–496.doi: 10.1089/thy.2012.0357
Dixon, J. R., Selvaraj, S., Yue, F., Kim, A., Li, Y., and Shen, Y. (2012).Topological domains in mammalian genomes identified by analysis ofchromatin interactions. Nature 485, 376–380. doi: 10.1038/nature11082
Ernst, J., and Kellis, M. (2015). Large-scale imputation of epigenomic datasets forsystematic annotation of diverse human tissues. Nat. Biotechnol. 33, 364–376.doi: 10.1038/nbt.3157
Estruch, S. B., Graham, S. A., Chinnappa, S. M., Deriziotis, P., and Fisher,S. E. (2016). Functional characterization of rare FOXP2 variants inneurodevelopmental disorder. J. Neurodev. Disord. 8:44. doi: 10.1186/s11689-016-9177-2
Ferland, R. J., Cherry, T. J., Preware, P. O., Morrisey, E. E., and Walsh, C. A.(2003). Characterization of Foxp2 and Foxp1 mRNA and protein in thedeveloping and mature brain. J. Comp. Neurol. 460, 266–279. doi: 10.1002/cne.10654
Feuk, L., Kalervo, A., Lipsanen-Nyman, M., Skaug, J., Nakabayashi, K., andFinucane, B. (2006). Absence of a paternally inherited FOXP2 gene indevelopmental verbal dyspraxia. Am. J. Hum. Genet. 79, 965–972. doi: 10.1086/508902
Fu, L. J., Shi, Z. M., Luo, G. Z., Tu, W. H., Wang, X. J., Fang, Z. D., et al. (2014).Multiple microRNAs regulate human FOXP2 gene expression by targetingsequences in its 3′ untranslated region. Mol. Brain 7:71. doi: 10.1186/s13041-014-0071-0
Frontiers in Molecular Neuroscience | www.frontiersin.org 13 February 2018 | Volume 11 | Article 47

fnmol-11-00047 February 19, 2018 Time: 14:51 # 14
Becker et al. Mapping FOXP2 Enhancers Reveals Regulation
Hagege, H., Klous, P., Braem, C., Splinter, E., Dekker, J., Cathala, G., et al. (2007).Quantitative analysis of chromosome conformation capture assays (3C-qPCR).Nat. Protoc. 2, 1722–1733. doi: 10.1038/nprot.2007.243
Hevner, R. F., Shi, L., Justice, N., Hsueh, Y., Sheng, M., Smiga, S., et al. (2001).Tbr1 regulates differentiation of the preplate and layer 6. Neuron 29, 353–366.doi: 10.1016/S0896-6273(01)00211-2
Hisaoka, T., Nakamura, Y., Senba, E., and Morikawa, Y. (2010). The forkheadtranscription factors, Foxp1 and Foxp2, identify different subpopulations ofprojection neurons in the mouse cerebral cortex. Neuroscience 166, 551–563.doi: 10.1016/j.neuroscience.2009.12.055
Hsueh, Y. P. (2006). The role of the MAGUK protein CASK in neural developmentand synaptic function. Curr. Med. Chem. 13, 1915–1927. doi: 10.2174/092986706777585040
Hsueh, Y. P., Wang, T. F., Yang, F. C., and Sheng, M. (2000). Nuclear translocationand transcription regulation by the membrane-associated guanylate kinaseCASK/LIN-2. Nature 404, 298–302. doi: 10.1038/35005118
Lai, C. S., Fisher, S. E., Hurst, J. A., Vargha-Khadem, F., and Monaco, A. P. (2001).A forkhead-domain gene is mutated in a severe speech and language disorder.Nature 413, 519–523. doi: 10.1038/35097076
Lai, C. S., Gerrelli, D., Monaco, A. P., Fisher, S. E., and Copp, A. J. (2003). FOXP2expression during brain development coincides with adult sites of pathologyin a severe speech and language disorder. Brain 126(Pt 11), 2455–2462. doi:10.1093/brain/awg247
Le Martelot, G., Canella, D., Symul, L., Migliavacca, E., Gilardi, F., Liechti, R.,et al. (2012). Genome-wide RNA polymerase II profiles and RNA accumulationreveal kinetics of transcription and associated epigenetic changes during diurnalcycles. PLoS Biol. 10:e1001442. doi: 10.1371/journal.pbio.1001442
Lennon, P. A., Cooper, M. L., Peiffer, D. A., Gunderson, K. L., Patel, A., Peters, S.,et al. (2007). Deletion of 7q31.1 supports involvement of FOXP2 in languageimpairment: clinical report and review. Am. J. Med. Genet. A 143A, 791–798.doi: 10.1002/ajmg.a.31632
Li, S., Weidenfeld, J., and Morrisey, E. E. (2004). Transcriptional and DNA bindingactivity of the Foxp1/2/4 family is modulated by heterotypic and homotypicprotein interactions. Mol. Cell. Biol. 24, 809–822. doi: 10.1128/MCB.24.2.809-822.2004
Li, W., Notani, D., Ma, Q., Tanasa, B., Nunez, E., Chen, A. Y., et al. (2013).Functional roles of enhancer RNAs for oestrogen-dependent transcriptionalactivation. Nature 498, 516–520. doi: 10.1038/nature12210
Liegeois, F., Baldeweg, T., Connelly, A., Gadian, D. G., Mishkin, M., and Vargha-Khadem, F. (2003). Language fMRI abnormalities associated with FOXP2 genemutation. Nat. Neurosci. 6, 1230–1237. doi: 10.1038/nn1138
Liegeois, F., Morgan, A. T., Connelly, A., and Vargha-Khadem, F. (2011).Endophenotypes of FOXP2: dysfunction within the human articulatorynetwork. Eur. J. Paediatr. Neurol. 15, 283–288. doi: 10.1016/j.ejpn.2011.04.006
Livak, K. J., and Schmittgen, T. D. (2001). Analysis of relative gene expression datausing real-time quantitative PCR and the 2(T)(-Delta Delta C) method.Methods25, 402–408. doi: 10.1006/meth.2001.1262
MacDermot, K. D., Bonora, E., Sykes, N., Coupe, A. M., Lai, C. S., Vernes,S. C., et al. (2005). Identification of FOXP2 truncation as a novel cause ofdevelopmental speech and language deficits. Am. J. Hum. Genet. 76, 1074–1080.doi: 10.1086/430841
Maricic, T., Gunther, V., Georgiev, O., Gehre, S., Curlin, M., Schreiweis, C.,et al. (2013). A recent evolutionary change affects a regulatory element inthe human FOXP2 gene. Mol. Biol. Evol. 30, 844–852. doi: 10.1093/molbev/mss271
Mead, T. J., Wang, Q., Bhattaram, P., Dy, P., Afelik, S., and Jensen, J. (2013). A far-upstream (-70 kb) enhancer mediates Sox9 auto-regulation in somatic tissuesduring development and adult regeneration. Nucleic Acids Res. 41, 4459–4469.doi: 10.1093/nar/gkt140
Mendoza, E., Tokarev, K., During, D. N., Retamosa, E. C., Weiss, M., Arpenik, N.,et al. (2015). Differential coexpression of FoxP1, FoxP2, and FoxP4 in the ZebraFinch (Taeniopygia guttata) song system. J. Comp. Neurol. 523, 1318–1340.doi: 10.1002/cne.23731
Meredith, D. M., Masui, T., Swift, G. H., MacDonald, R. J., and Johnson, J. E.(2009). Multiple transcriptional mechanisms control Ptf1a levels during neuraldevelopment including autoregulation by the PTF1-J complex. J. Neurosci. 29,11139–11148. doi: 10.1523/JNEUROSCI.2303-09.2009
Mifsud, B., Tavares-Cadete, F., Young, A. N., Sugar, R., Schoenfelder, S., andFerreira, L. (2015). Mapping long-range promoter contacts in human cells withhigh-resolution capture Hi-C. Nat. Genet. 47, 598–606. doi: 10.1038/ng.3286
Miller, W., Makova, K. D., Nekrutenko, A., and Hardison, R. C. (2004).Comparative genomics. Annu. Rev. Genomics Hum. Genet. 5, 15–56.doi: 10.1146/annurev.genom.5.061903.180057
Moralli, D., Nudel, R., Chan, M. T., Green, C. M., Volpi, E. V., Benitez-Burraco, A.,et al. (2015). Language impairment in a case of a complex chromosomalrearrangement with a breakpoint downstream of FOXP2. Mol. Cytogenet. 8:36.doi: 10.1186/s13039-015-0148-1
Morikawa, Y., Hisaoka, T., and Senba, E. (2009). Characterization of Foxp2-expressing cells in the developing spinal cord. Neuroscience 162, 1150–1162.doi: 10.1016/j.neuroscience.2009.05.022
Nagano, T., Lubling, Y., Stevens, T. J., Schoenfelder, S., Yaffe, E., Dean, W., et al.(2013). Single-cell Hi-C reveals cell-to-cell variability in chromosome structure.Nature 502, 59–64. doi: 10.1038/nature12593
Ong, C. T., and Corces, V. G. (2014). CTCF: an architectural protein bridginggenome topology and function. Nat. Rev. Genet. 15, 234–246. doi: 10.1038/nrg3663
Palka, C., Alfonsi, M., Mohn, A., Cerbo, R., Guanciali Franchi, P., Fantasia, D., et al.(2012). Mosaic 7q31 deletion involving FOXP2 gene associated with languageimpairment. Pediatrics 129, e183–e188. doi: 10.1542/peds.2010-2094
Pennacchio, L. A., Bickmore, W., Dean, A., Nobrega, M. A., and Bejerano, G.(2013). Enhancers: five essential questions. Nat. Rev. Genet. 14, 288–295.doi: 10.1038/nrg3458
Pinel, P., Fauchereau, F., Moreno, A., Barbot, A., Lathrop, M., Zelenika, D., et al.(2012). Genetic variants of FOXP2 and KIAA0319/TTRAP/THEM2 locus areassociated with altered brain activation in distinct language-related regions.J. Neurosci. 32, 817–825. doi: 10.1523/JNEUROSCI.5996-10.2012
Reuter, M. S., Riess, A., Moog, U., Briggs, T. A., Chandler, K. E., Rauch, A.,et al. (2017). FOXP2 variants in 14 individuals with developmental speech andlanguage disorders broaden the mutational and clinical spectrum. J. Med. Genet.54, 64–72. doi: 10.1136/jmedgenet-2016-104094
Rice, G. M., Raca, G., Jakielski, K. J., Laffin, J. J., Iyama-Kurtycz, C. M., Hartley,S. L., et al. (2012). Phenotype of FOXP2 haploinsufficiency in a mother and son.Am. J. Med. Genet. A 158A, 174–181. doi: 10.1002/ajmg.a.34354
Roadmap Epigenomics, C., Kundaje, A., Meuleman, W., Ernst, J., Bilenky, M.,Yen, A., et al. (2015). Integrative analysis of 111 reference human epigenomes.Nature 518, 317–330. doi: 10.1038/nature14248
Schroeder, D. I., and Myers, R. M. (2008). Multiple transcription start sites forFOXP2 with varying cellular specificities. Gene 413, 42–48. doi: 10.1016/j.gene.2008.01.015
Shriberg, L. D., Ballard, K. J., Tomblin, J. B., Duffy, J. R., Odell, K. H., andWilliams, C. A. (2006). Speech, prosody, and voice characteristics of a motherand daughter with a 7:13 translocation affecting FOXP2. J. Speech Lang. Hear.Res. 49, 500–525. doi: 10.1044/1092-4388(2006/038)
Shu, W., Yang, H., Zhang, L., Lu, M. M., and Morrisey, E. E. (2001).Characterization of a new subfamily of winged-helix/forkhead (Fox) genes thatare expressed in the lung and act as transcriptional repressors. J. Biol. Chem.276, 27488–27497. doi: 10.1074/jbc.M100636200
Sin, C., Li, H., and Crawford, D. A. (2015). Transcriptional regulation by FOXP1,FOXP2, and FOXP4 dimerization. J. Mol. Neurosci. 55, 437–448. doi: 10.1007/s12031-014-0359-7
Takahashi, K., Liu, F. C., Hirokawa, K., and Takahashi, H. (2008a). Expression ofFoxp4 in the developing and adult rat forebrain. J. Neurosci. Res. 86, 3106–3116.doi: 10.1002/jnr.21770
Takahashi, K., Liu, F. C., Oishi, T., Mori, T., Higo, N., Hayashi, M., et al. (2008b).Expression of FOXP2 in the developing monkey forebrain: comparison withthe expression of the genes FOXP1, PBX3, and MEIS2. J. Comp. Neurol. 509,180–189. doi: 10.1002/cne.21740
Thul, P. J., Akesson, L., Wiking, M., Mahdessian, D., Geladaki, A., and AitBlal, H. (2017). A subcellular map of the human proteome. Science 356:eaal3321.doi: 10.1126/science.aal3321
Turner, S. J., Hildebrand, M. S., Block, S., Damiano, J., Fahey, M., Reilly, S.,et al. (2013). Small intragenic deletion in FOXP2 associated with childhoodapraxia of speech and dysarthria. Am. J. Med. Genet. A 161A, 2321–2326.doi: 10.1002/ajmg.a.36055
Frontiers in Molecular Neuroscience | www.frontiersin.org 14 February 2018 | Volume 11 | Article 47

fnmol-11-00047 February 19, 2018 Time: 14:51 # 15
Becker et al. Mapping FOXP2 Enhancers Reveals Regulation
Ureta-Vidal, A., Ettwiller, L., and Birney, E. (2003). Comparative genomics:genome-wide analysis in metazoan eukaryotes. Nat. Rev. Genet. 4, 251–262.doi: 10.1038/nrg1043
Vargha-Khadem, F., Gadian, D. G., Copp, A., and Mishkin, M. (2005). FOXP2and the neuroanatomy of speech and language. Nat. Rev. Neurosci. 6, 131–138.doi: 10.1038/nrn1605
Vargha-Khadem, F., Watkins, K., Alcock, K., Fletcher, P., and Passingham, R.(1995). Praxic and nonverbal cognitive deficits in a large family with agenetically transmitted speech and language disorder. Proc. Natl. Acad. Sci.U.S.A. 92, 930–933. doi: 10.1073/pnas.92.3.930
Vargha-Khadem, F., Watkins, K. E., Price, C. J., Ashburner, J., Alcock, K. J.,and Connelly, A. (1998). Neural basis of an inherited speech and languagedisorder. Proc. Natl. Acad. Sci. U.S.A. 95, 12695–12700. doi: 10.1073/pnas.95.21.12695
Vernes, S. C., Nicod, J., Elahi, F. M., Coventry, J. A., Kenny, N., Coupe, A. M.,et al. (2006). Functional genetic analysis of mutations implicated in a humanspeech and language disorder. Hum. Mol. Genet. 15, 3154–3167. doi: 10.1093/hmg/ddl392
Visel, A., Minovitsky, S., Dubchak, I., and Pennacchio, L. A. (2007). VISTAenhancer browser–a database of tissue-specific human enhancers. Nucleic AcidsRes. 35, D88–D92. doi: 10.1093/nar/gkl822
Wang, G. S., Hong, C. J., Yen, T. Y., Huang, H. Y., Ou, Y., Huang, T. N.,et al. (2004). Transcriptional modification by a CASK-interacting nucleosomeassembly protein. Neuron 42, 113–128. doi: 10.1016/S0896-6273(04)00139-4
Watkins, K. E., Vargha-Khadem, F., Ashburner, J., Passingham, R. E., Connelly, A.,and Friston, K. J. (2002). MRI analysis of an inherited speech and languagedisorder: structural brain abnormalities. Brain 125(Pt 3), 465–478. doi: 10.1093/brain/awf057
Willsey, A. J., Sanders, S. J., Li, M., Dong, S., Tebbenkamp, A. T., Muhle,R. A., et al. (2013). Coexpression networks implicate human midfetal deepcortical projection neurons in the pathogenesis of autism. Cell 155, 997–1007.doi: 10.1016/j.cell.2013.10.020
Won, H., de la Torre-Ubieta, L., Stein, J. L., Parikshak, N. N., Huang, J.,Opland, C. K., et al. (2016). Chromosome conformation elucidates regulatoryrelationships in developing human brain. Nature 538, 523–527. doi: 10.1038/nature19847
Zeesman, S., Nowaczyk, M. J., Teshima, I., Roberts, W., Cardy, J. O., Brian, J.,et al. (2006). Speech and language impairment and oromotor dyspraxia dueto deletion of 7q31 that involves FOXP2. Am. J. Med. Genet. A 140, 509–514.doi: 10.1002/ajmg.a.31110
Zilina, O., Reimand, T., Zjablovskaja, P., Mannik, K., Mannamaa, M., and Traat, A.(2012). Maternally and paternally inherited deletion of 7q31 involving theFOXP2 gene in two families. Am. J. Med. Genet. A 158A, 254–256. doi: 10.1002/ajmg.a.34378
Conflict of Interest Statement: The authors declare that the research wasconducted in the absence of any commercial or financial relationships that couldbe construed as a potential conflict of interest.
Copyright © 2018 Becker, Devanna, Fisher and Vernes. This is an open-accessarticle distributed under the terms of the Creative Commons Attribution License(CC BY). The use, distribution or reproduction in other forums is permitted, providedthe original author(s) and the copyright owner are credited and that the originalpublication in this journal is cited, in accordance with accepted academic practice.No use, distribution or reproduction is permitted which does not comply with theseterms.
Frontiers in Molecular Neuroscience | www.frontiersin.org 15 February 2018 | Volume 11 | Article 47