Mapping Lab Lesson Guide - Educating Ohio's … · Mapping Lab Lesson Guide . ... Find it on the...
39
Student: ________________________________________ Teacher: ____________________________ Room: ___________ Lessons for the Interactive Social Studies Classroom Mapping Lab Lesson Guide
Transcript of Mapping Lab Lesson Guide - Educating Ohio's … · Mapping Lab Lesson Guide . ... Find it on the...
Student: ________________________________________
Teacher: ____________________________ Room: ___________
Lessons for the Interactive Social Studies Classroom
Mapping Lab
Lesson Guide
Making a Mental Map of Ohio
OHIO MAPPING LAB Preview
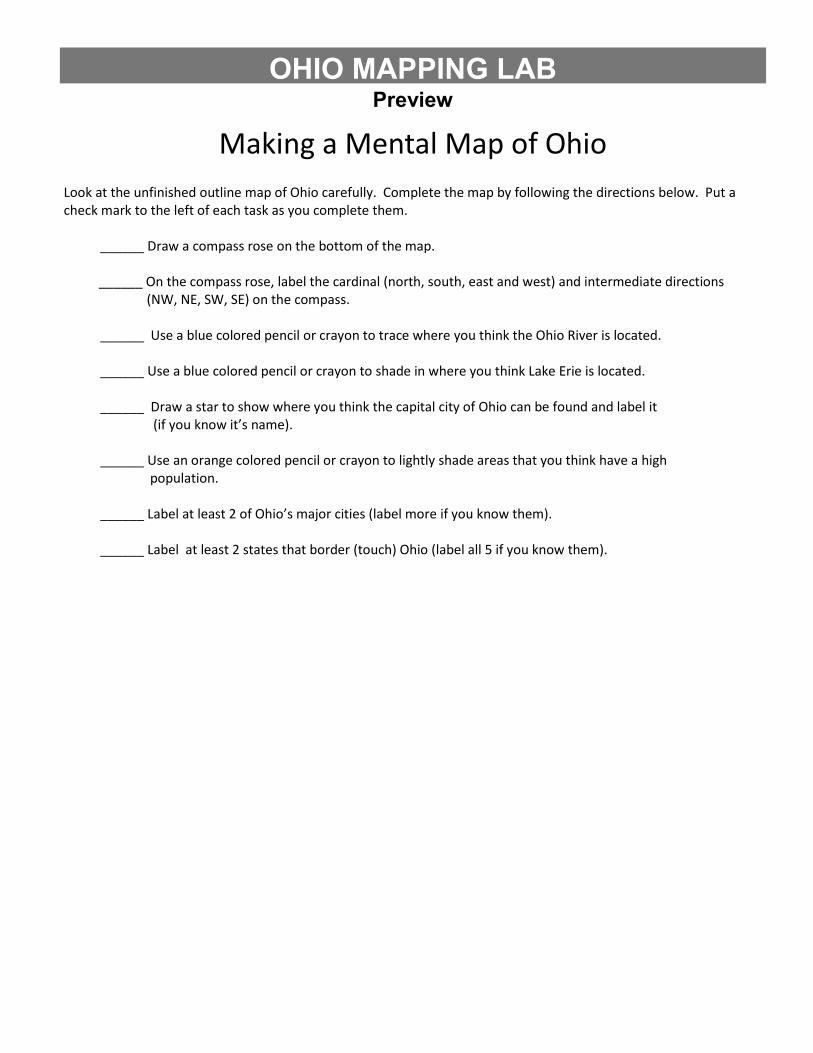
Look at the unfinished outline map of Ohio carefully. Complete the map by following the directions below. Put a check mark to the left of each task as you complete them.
______ Draw a compass rose on the bottom of the map. ______ On the compass rose, label the cardinal (north, south, east and west) and intermediate directions
(NW, NE, SW, SE) on the compass. ______ Use a blue colored pencil or crayon to trace where you think the Ohio River is located. ______ Use a blue colored pencil or crayon to shade in where you think Lake Erie is located. ______ Draw a star to show where you think the capital city of Ohio can be found and label it (if you know it’s name). ______ Use an orange colored pencil or crayon to lightly shade areas that you think have a high population. ______ Label at least 2 of Ohio’s major cities (label more if you know them). ______ Label at least 2 states that border (touch) Ohio (label all 5 if you know them).
OHIO MAPPING LAB
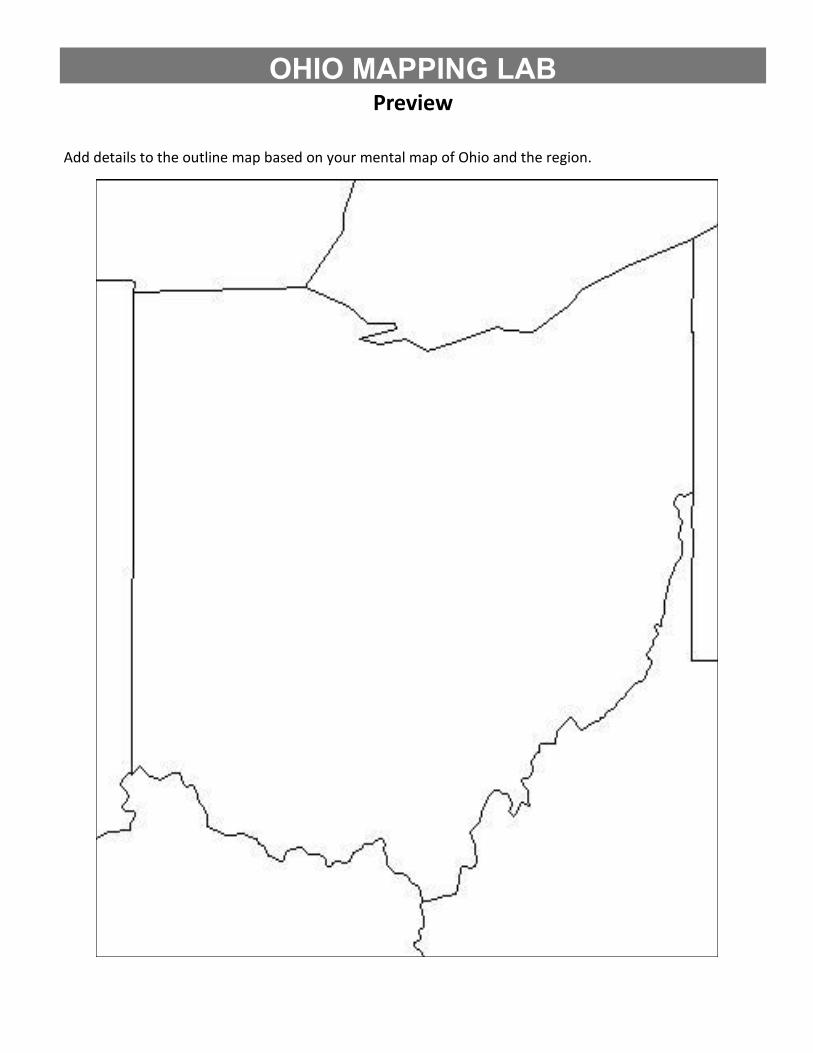
Add details to the outline map based on your mental map of Ohio and the region.
Preview
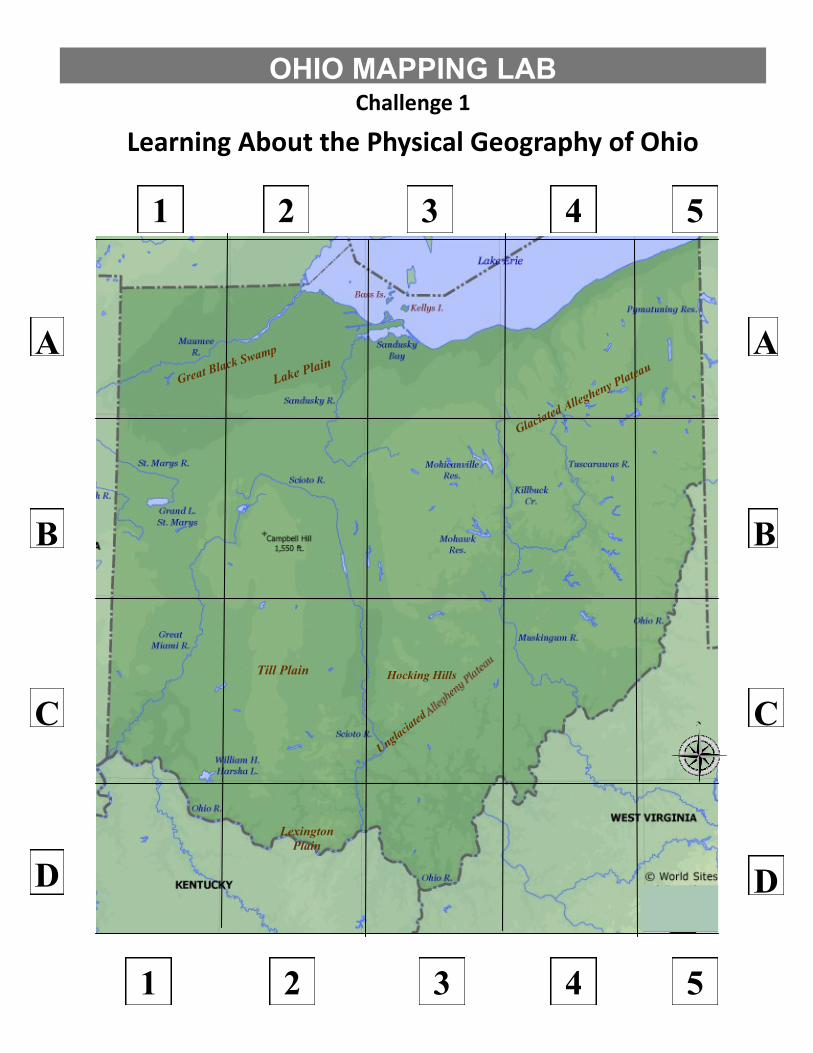
Learning About the Physical Geography of Ohio
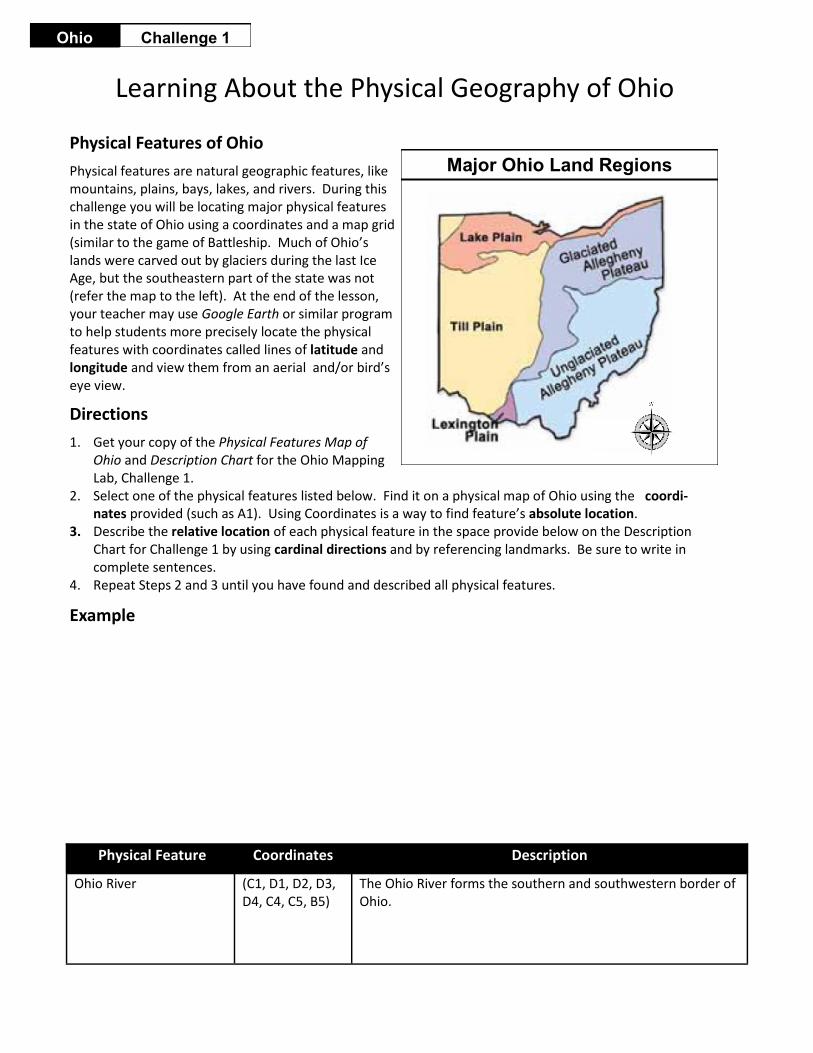
Physical Features of Ohio
Physical features are natural geographic features, like mountains, plains, bays, lakes, and rivers. During this challenge you will be locating major physical features in the state of Ohio using a coordinates and a map grid (similar to the game of Battleship. Much of Ohio’s lands were carved out by glaciers during the last Ice Age, but the southeastern part of the state was not (refer the map to the left). At the end of the lesson, your teacher may use Google Earth or similar program to help students more precisely locate the physical features with coordinates called lines of latitude and longitude and view them from an aerial and/or bird’s eye view.
Directions
1. Get your copy of the Physical Features Map of Ohio and Description Chart for the Ohio Mapping Lab, Challenge 1.
2. Select one of the physical features listed below. Find it on a physical map of Ohio using the coordi-nates provided (such as A1). Using Coordinates is a way to find feature’s absolute location.
3. Describe the relative location of each physical feature in the space provide below on the Description Chart for Challenge 1 by using cardinal directions and by referencing landmarks. Be sure to write in complete sentences.
4. Repeat Steps 2 and 3 until you have found and described all physical features.
Example
Challenge 1 Ohio
Major Ohio Land Regions
Physical Feature Coordinates Description
Ohio River (C1, D1, D2, D3, D4, C4, C5, B5)
The Ohio River forms the southern and southwestern border of Ohio.
Learning About the Physical Geography of Ohio
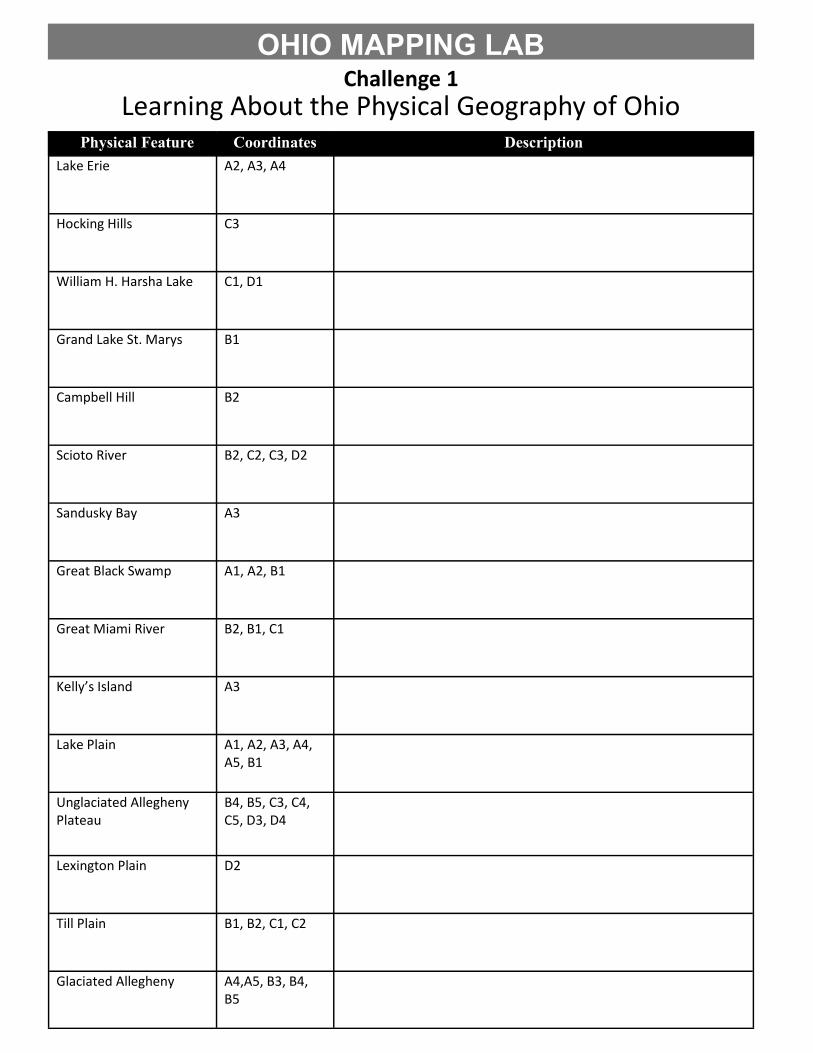
Physical Feature Coordinates Description
Lake Erie A2, A3, A4
Hocking Hills C3
William H. Harsha Lake C1, D1
Grand Lake St. Marys B1
Campbell Hill B2
Scioto River B2, C2, C3, D2
Sandusky Bay A3
Great Black Swamp A1, A2, B1
Great Miami River B2, B1, C1
Kelly’s Island A3
Lake Plain A1, A2, A3, A4, A5, B1
Unglaciated Allegheny Plateau
B4, B5, C3, C4, C5, D3, D4
Lexington Plain D2
Till Plain B1, B2, C1, C2
Glaciated Allegheny A4,A5, B3, B4, B5
OHIO MAPPING LAB Challenge 1
Learning About the Physical Geography of Ohio
OHIO MAPPING LAB Challenge 1
A
B
C
D
A
B
C
D
1 2 3 4 5
1 2 3 4 5
Ungla
ciate
d
Glaciated Allegheny Plateau
Lake Plain
Till Plain
Lexington
Plain
Great Black Swamp
Hocking Hills
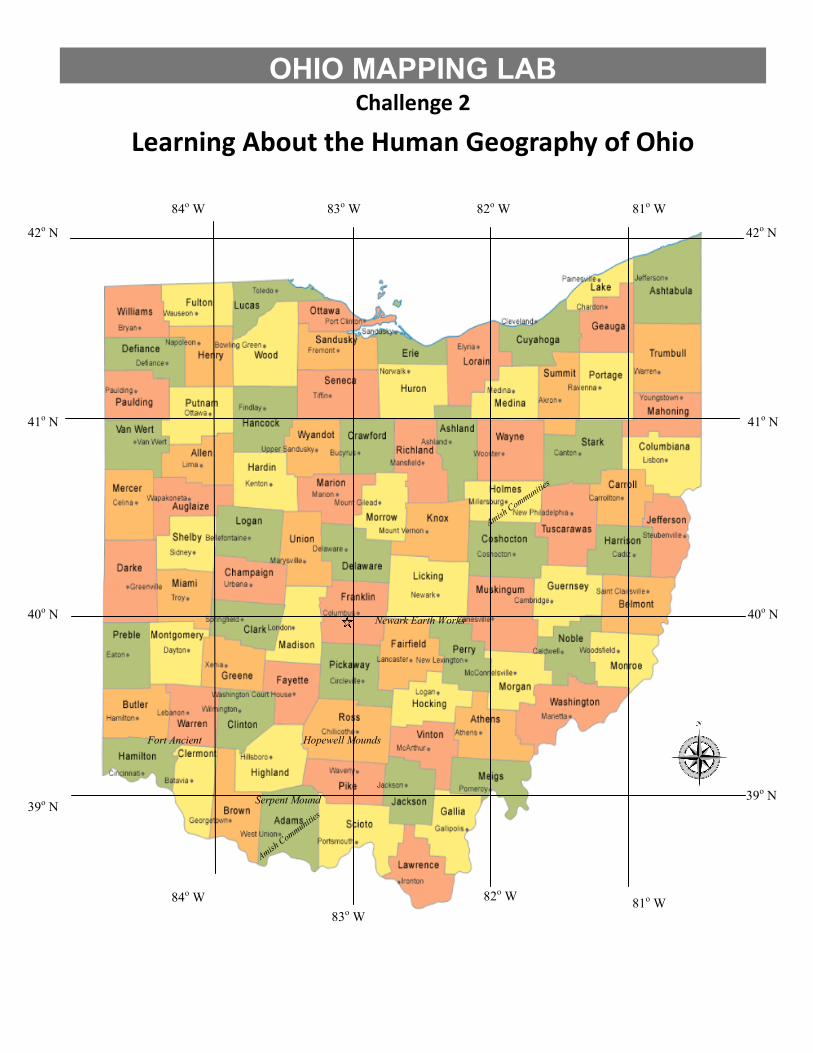
Learning About the Human Geography of Ohio
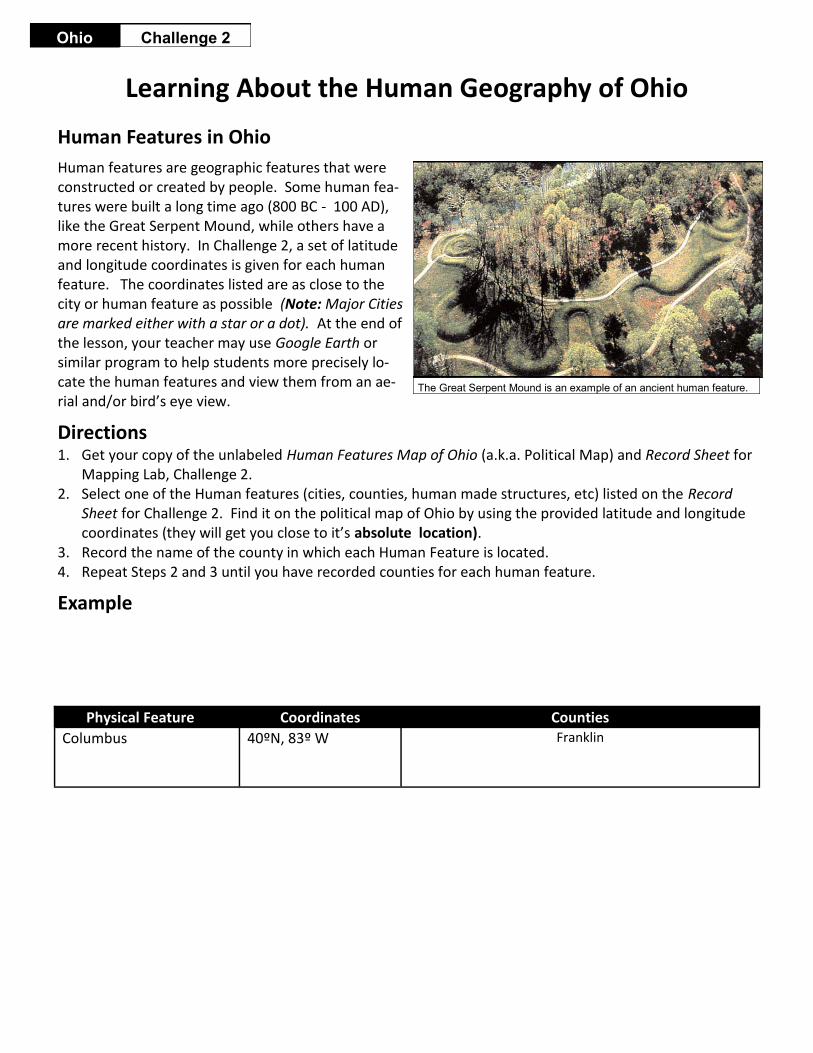
Human Features in Ohio
Human features are geographic features that were constructed or created by people. Some human fea-tures were built a long time ago (800 BC - 100 AD), like the Great Serpent Mound, while others have a more recent history. In Challenge 2, a set of latitude and longitude coordinates is given for each human feature. The coordinates listed are as close to the city or human feature as possible (Note: Major Cities are marked either with a star or a dot). At the end of the lesson, your teacher may use Google Earth or similar program to help students more precisely lo-cate the human features and view them from an ae-rial and/or bird’s eye view.
Directions
1. Get your copy of the unlabeled Human Features Map of Ohio (a.k.a. Political Map) and Record Sheet for Mapping Lab, Challenge 2.
2. Select one of the Human features (cities, counties, human made structures, etc) listed on the Record Sheet for Challenge 2. Find it on the political map of Ohio by using the provided latitude and longitude coordinates (they will get you close to it’s absolute location).
3. Record the name of the county in which each Human Feature is located. 4. Repeat Steps 2 and 3 until you have recorded counties for each human feature.
Example
Challenge 2 Ohio
Physical Feature Coordinates Counties
Columbus 40ºN, 83º W
Franklin
The Great Serpent Mound is an example of an ancient human feature.
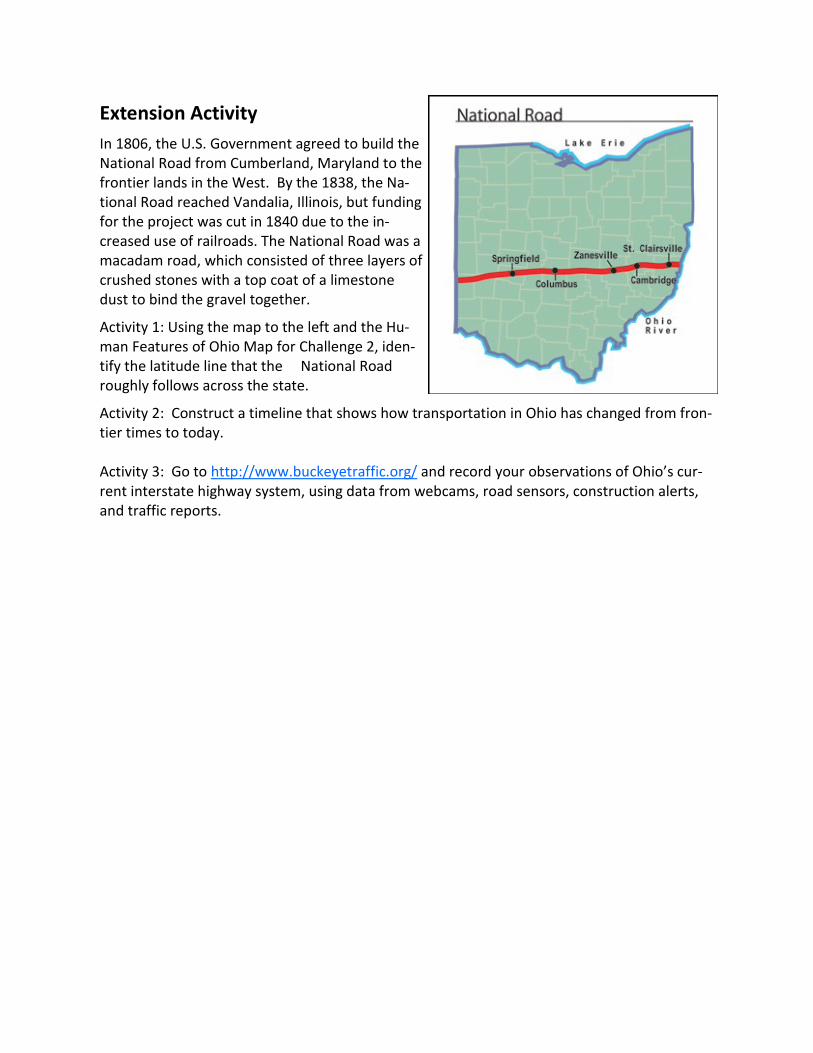
Extension Activity
In 1806, the U.S. Government agreed to build the National Road from Cumberland, Maryland to the frontier lands in the West. By the 1838, the Na-tional Road reached Vandalia, Illinois, but funding for the project was cut in 1840 due to the in-creased use of railroads. The National Road was a macadam road, which consisted of three layers of crushed stones with a top coat of a limestone dust to bind the gravel together.
Activity 1: Using the map to the left and the Hu-man Features of Ohio Map for Challenge 2, iden-tify the latitude line that the National Road roughly follows across the state.
Activity 2: Construct a timeline that shows how transportation in Ohio has changed from fron-tier times to today. Activity 3: Go to http://www.buckeyetraffic.org/ and record your observations of Ohio’s cur-rent interstate highway system, using data from webcams, road sensors, construction alerts, and traffic reports.
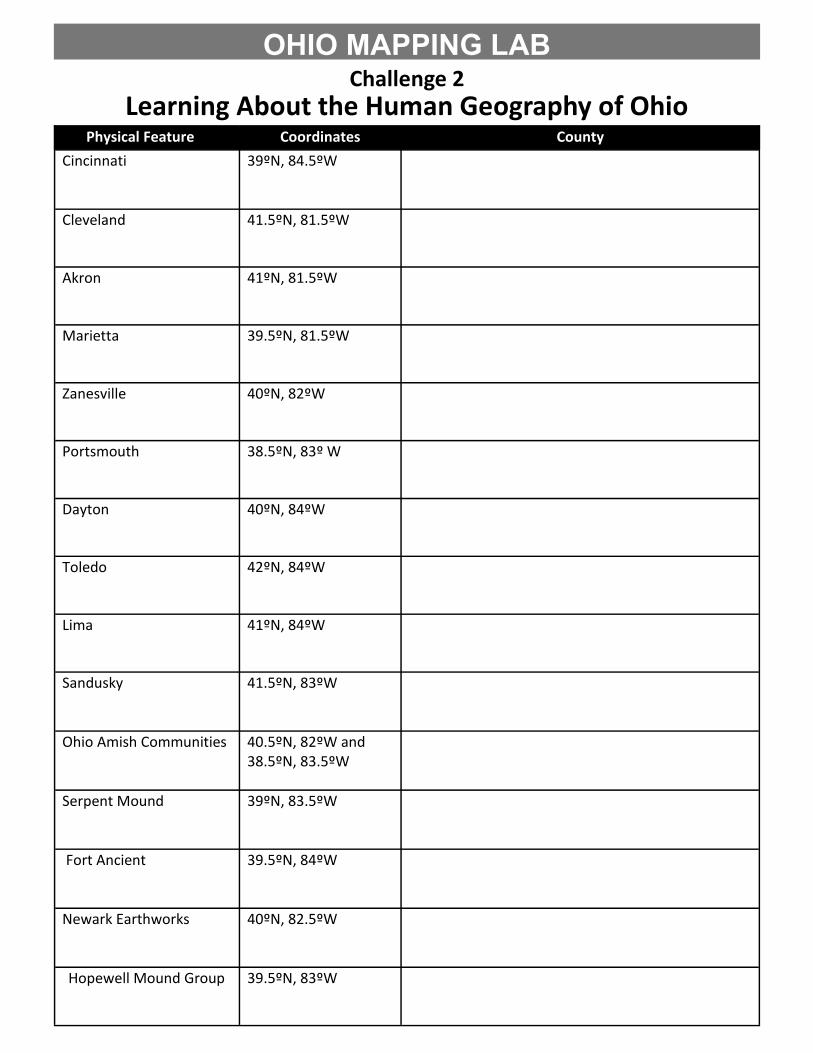
Learning About the Human Geography of Ohio Physical Feature Coordinates County
Cincinnati 39ºN, 84.5ºW
Cleveland 41.5ºN, 81.5ºW
Akron 41ºN, 81.5ºW
Marietta 39.5ºN, 81.5ºW
Zanesville 40ºN, 82ºW
Portsmouth 38.5ºN, 83º W
Dayton 40ºN, 84ºW
Toledo 42ºN, 84ºW
Lima 41ºN, 84ºW
Sandusky 41.5ºN, 83ºW
Ohio Amish Communities
40.5ºN, 82ºW and 38.5ºN, 83.5ºW
Serpent Mound 39ºN, 83.5ºW
Fort Ancient 39.5ºN, 84ºW
Newark Earthworks 40ºN, 82.5ºW
Hopewell Mound Group 39.5ºN, 83ºW
OHIO MAPPING LAB Challenge 2
Learning About the Human Geography of Ohio
OHIO MAPPING LAB Challenge 2
40o N
39o N
41o N 41o N
40o N
39o N
84o W 81o W
84o W
83o W
82o W
81o W
82o W 83o W
42o N 42o N
Fort Ancient
Serpent Mound
Newark Earth Works
Hopewell Mounds
Amish C
ommunities
Amish C
ommunities
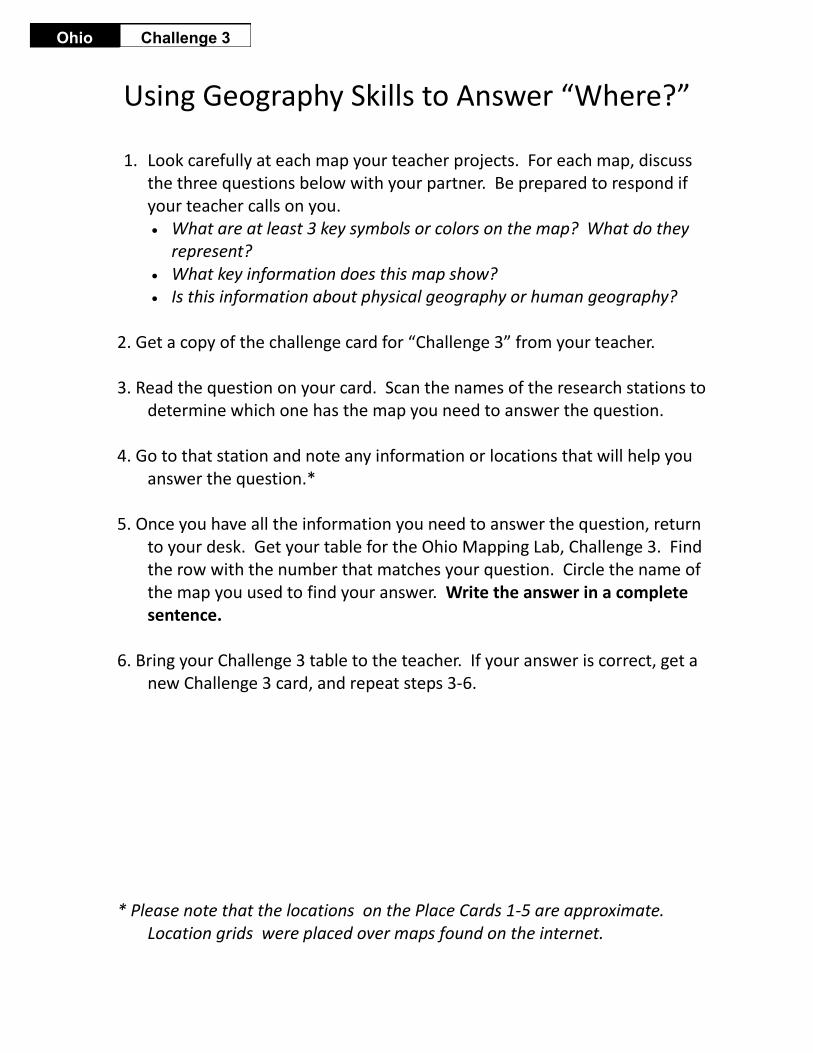
Using Geography Skills to Answer “Where?”
1. Look carefully at each map your teacher projects. For each map, discuss the three questions below with your partner. Be prepared to respond if your teacher calls on you. What are at least 3 key symbols or colors on the map? What do they
represent? What key information does this map show? Is this information about physical geography or human geography?
2. Get a copy of the challenge card for “Challenge 3” from your teacher. 3. Read the question on your card. Scan the names of the research stations to
determine which one has the map you need to answer the question. 4. Go to that station and note any information or locations that will help you
answer the question.* 5. Once you have all the information you need to answer the question, return
to your desk. Get your table for the Ohio Mapping Lab, Challenge 3. Find the row with the number that matches your question. Circle the name of the map you used to find your answer. Write the answer in a complete sentence.
6. Bring your Challenge 3 table to the teacher. If your answer is correct, get a
new Challenge 3 card, and repeat steps 3-6. * Please note that the locations on the Place Cards 1-5 are approximate.
Location grids were placed over maps found on the internet.
Challenge 3 Ohio
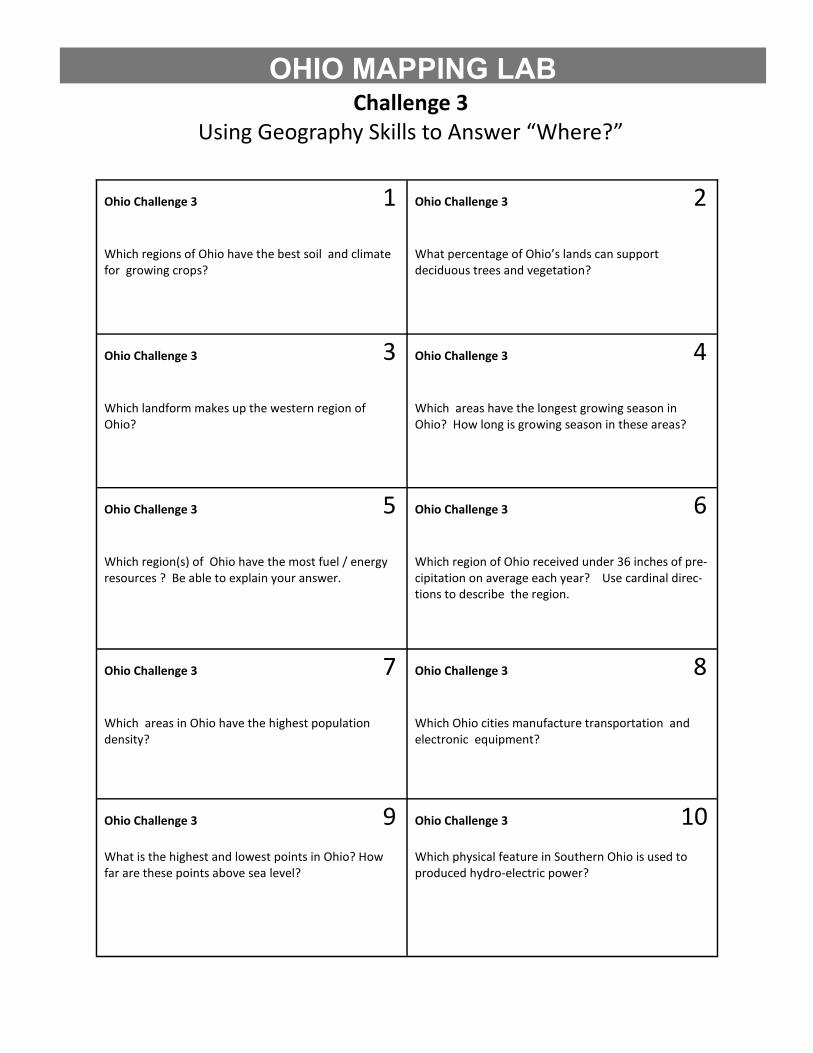
OHIO MAPPING LAB Challenge 3
Using Geography Skills to Answer “Where?”
Ohio Challenge 3 1
Which regions of Ohio have the best soil and climate for growing crops?
Ohio Challenge 3 2
What percentage of Ohio’s lands can support deciduous trees and vegetation?
Ohio Challenge 3 3
Which landform makes up the western region of Ohio?
Ohio Challenge 3 4 Which areas have the longest growing season in Ohio? How long is growing season in these areas?
Ohio Challenge 3 5
Which region(s) of Ohio have the most fuel / energy resources ? Be able to explain your answer.
Ohio Challenge 3 6
Which region of Ohio received under 36 inches of pre-cipitation on average each year? Use cardinal direc-tions to describe the region.
Ohio Challenge 3 7 Which areas in Ohio have the highest population density?
Ohio Challenge 3 8
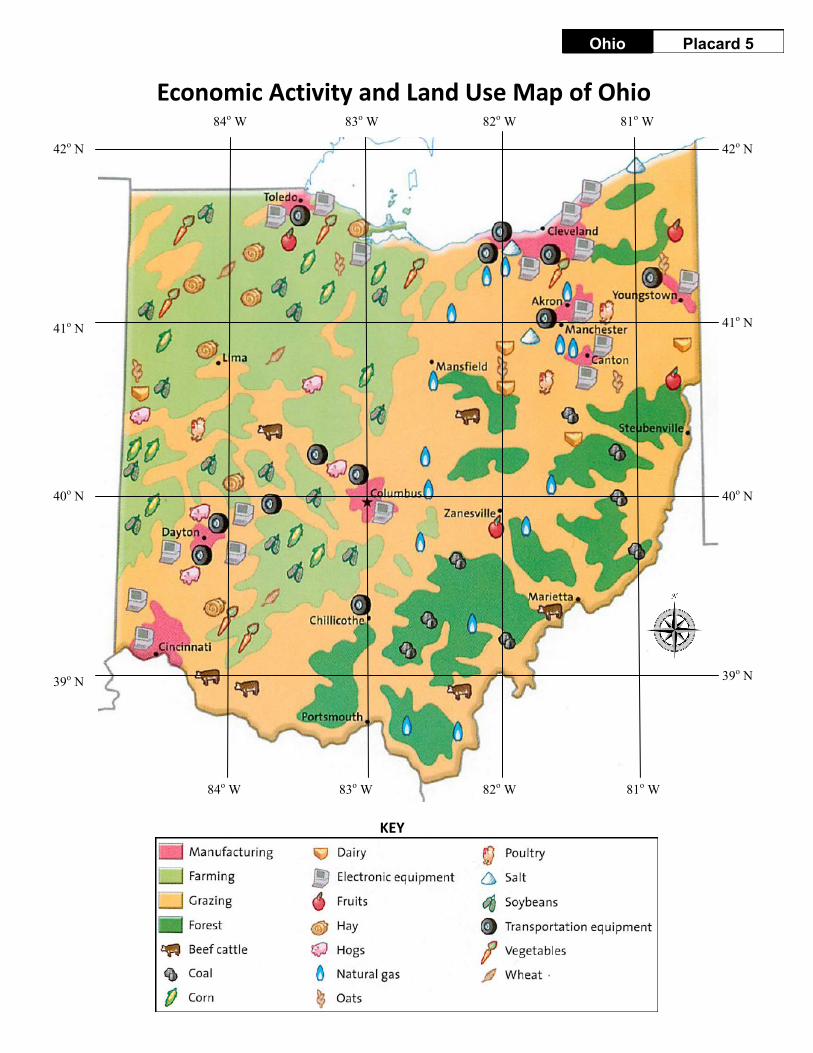
Which Ohio cities manufacture transportation and electronic equipment?
Ohio Challenge 3 9 What is the highest and lowest points in Ohio? How far are these points above sea level?
Ohio Challenge 3 10 Which physical feature in Southern Ohio is used to produced hydro-electric power?
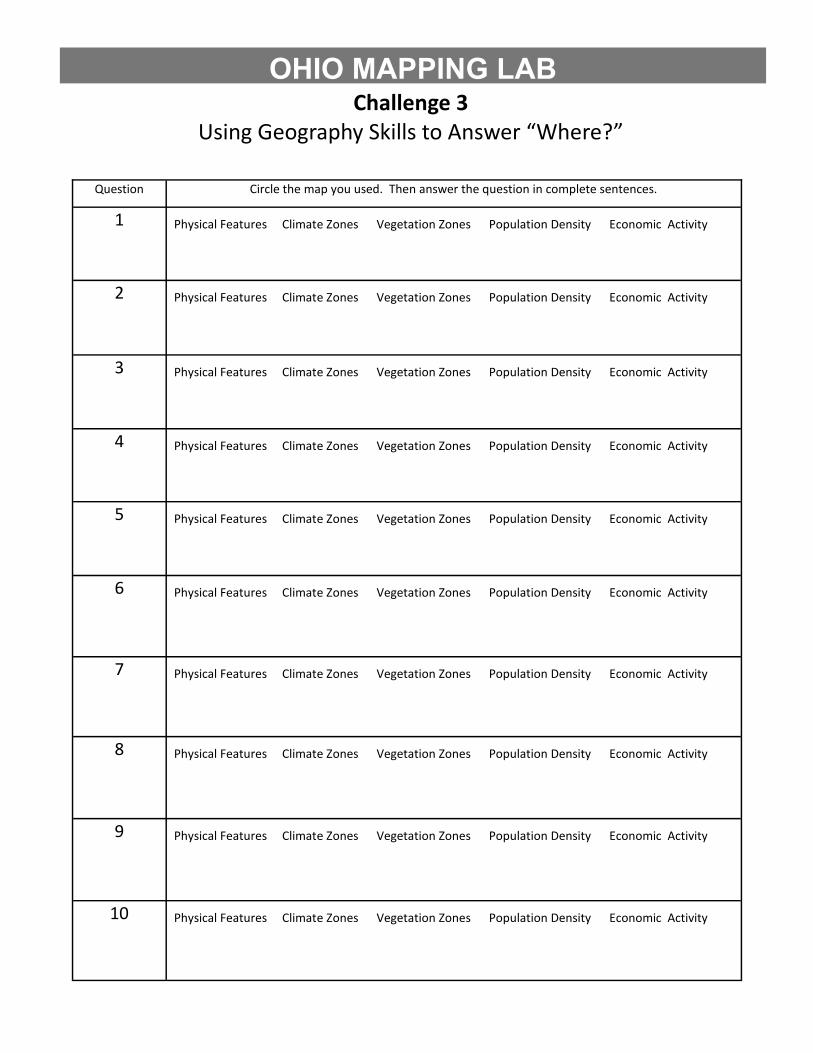
OHIO MAPPING LAB Challenge 3
Using Geography Skills to Answer “Where?”
Question Circle the map you used. Then answer the question in complete sentences.
1 Physical Features Climate Zones Vegetation Zones Population Density Economic Activity
2 Physical Features Climate Zones Vegetation Zones Population Density Economic Activity
3 Physical Features Climate Zones Vegetation Zones Population Density Economic Activity
4 Physical Features Climate Zones Vegetation Zones Population Density Economic Activity
5 Physical Features Climate Zones Vegetation Zones Population Density Economic Activity
6 Physical Features Climate Zones Vegetation Zones Population Density Economic Activity
7 Physical Features Climate Zones Vegetation Zones Population Density Economic Activity
8 Physical Features Climate Zones Vegetation Zones Population Density Economic Activity
9 Physical Features Climate Zones Vegetation Zones Population Density Economic Activity
10 Physical Features Climate Zones Vegetation Zones Population Density Economic Activity
Using Geography Skills to Answer “Why There?”
1. Get a Challenge 4 card from your teacher. 2. Read the question on your card. Scan the names of the research stations to find which stations have information that you need to answer the question. You will need to visit at least two and as many as all five stations to get all the information you need. 3. Go to each station that you have identified and note any information or lo-cations that will help you answer the question.* 4. Once you have all the information you need, return to your desk. Get a copy of the table for the Ohio Mapping Lab, Challenge 4. Find the row with the number that matches your question. Circle the names of the maps you used to find your answer. Write the answer in a complete sentence. 5. Bring your Challenge 4 table to the teacher. If your answer is correct, clean off your transparency, get a new card, and repeat steps 2-5.
* Please note that the locations on the Place Cards 1-5 are approximate.
Location grids were placed over maps found on the internet.
Challenge 4 Ohio
OHIO MAPPING LAB Challenge 4
Using Geography Skills to Answer “Why There?”
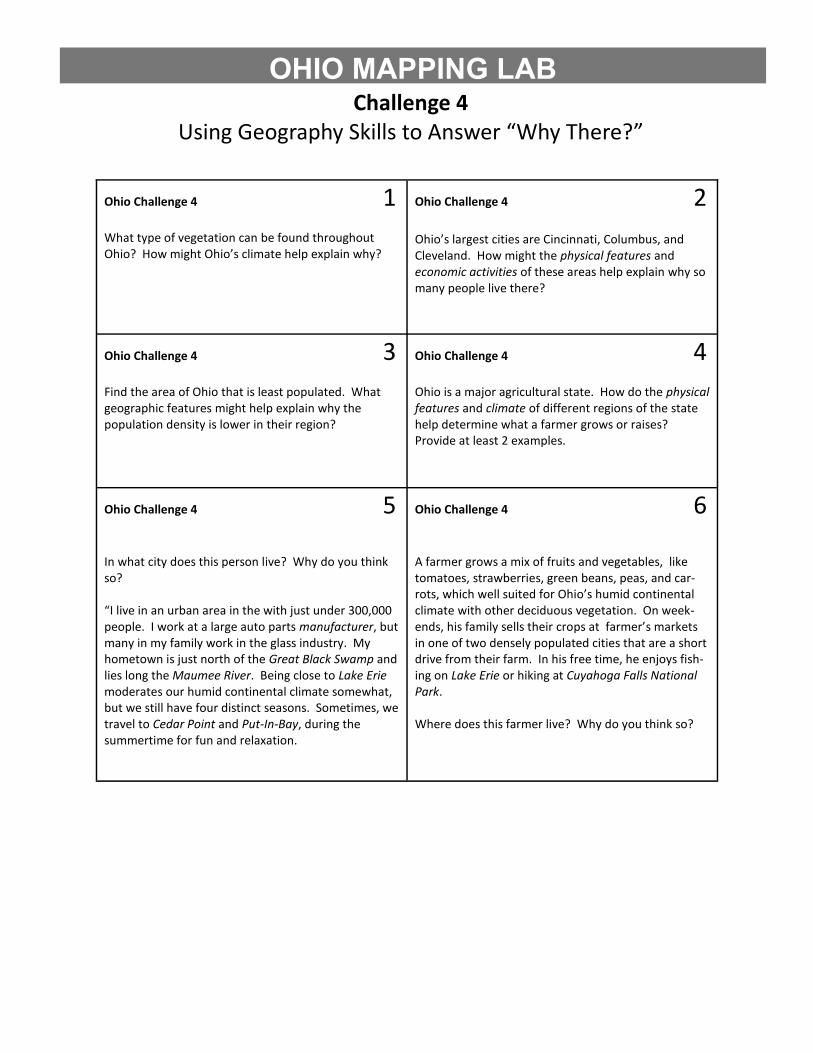
Ohio Challenge 4 1 What type of vegetation can be found throughout Ohio? How might Ohio’s climate help explain why?
Ohio Challenge 4 2
Ohio’s largest cities are Cincinnati, Columbus, and Cleveland. How might the physical features and economic activities of these areas help explain why so many people live there?
Ohio Challenge 4 3 Find the area of Ohio that is least populated. What geographic features might help explain why the population density is lower in their region?
Ohio Challenge 4 4 Ohio is a major agricultural state. How do the physical features and climate of different regions of the state help determine what a farmer grows or raises? Provide at least 2 examples.
Ohio Challenge 4 5
In what city does this person live? Why do you think so? “I live in an urban area in the with just under 300,000 people. I work at a large auto parts manufacturer, but many in my family work in the glass industry. My hometown is just north of the Great Black Swamp and lies long the Maumee River. Being close to Lake Erie moderates our humid continental climate somewhat, but we still have four distinct seasons. Sometimes, we travel to Cedar Point and Put-In-Bay, during the summertime for fun and relaxation.
Ohio Challenge 4 6
A farmer grows a mix of fruits and vegetables, like tomatoes, strawberries, green beans, peas, and car-rots, which well suited for Ohio’s humid continental climate with other deciduous vegetation. On week-ends, his family sells their crops at farmer’s markets in one of two densely populated cities that are a short drive from their farm. In his free time, he enjoys fish-ing on Lake Erie or hiking at Cuyahoga Falls National Park. Where does this farmer live? Why do you think so?
OHIO MAPPING LAB Challenge 4
Using Geography Skills to Answer “Why There?”
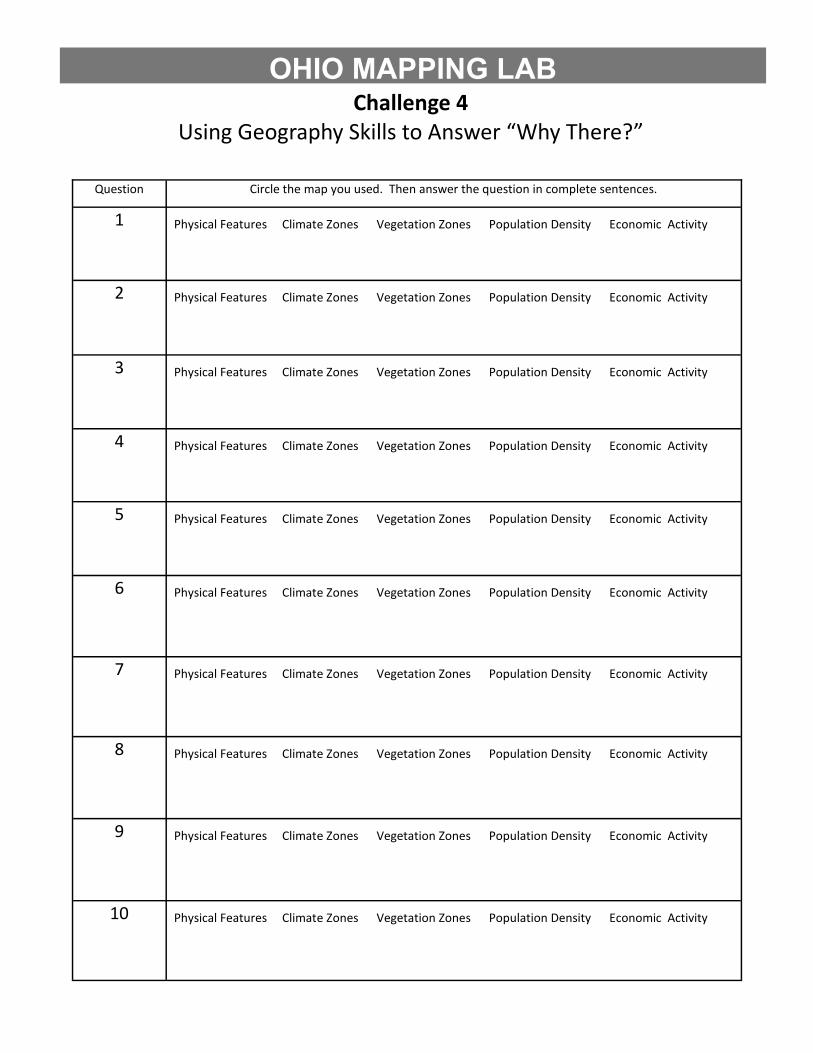
Question Circle the map you used. Then answer the question in complete sentences.
1 Physical Features Climate Zones Vegetation Zones Population Density Economic Activity
2 Physical Features Climate Zones Vegetation Zones Population Density Economic Activity
3 Physical Features Climate Zones Vegetation Zones Population Density Economic Activity
4 Physical Features Climate Zones Vegetation Zones Population Density Economic Activity
5 Physical Features Climate Zones Vegetation Zones Population Density Economic Activity
6 Physical Features Climate Zones Vegetation Zones Population Density Economic Activity
7 Physical Features Climate Zones Vegetation Zones Population Density Economic Activity
8 Physical Features Climate Zones Vegetation Zones Population Density Economic Activity
9 Physical Features Climate Zones Vegetation Zones Population Density Economic Activity
10 Physical Features Climate Zones Vegetation Zones Population Density Economic Activity
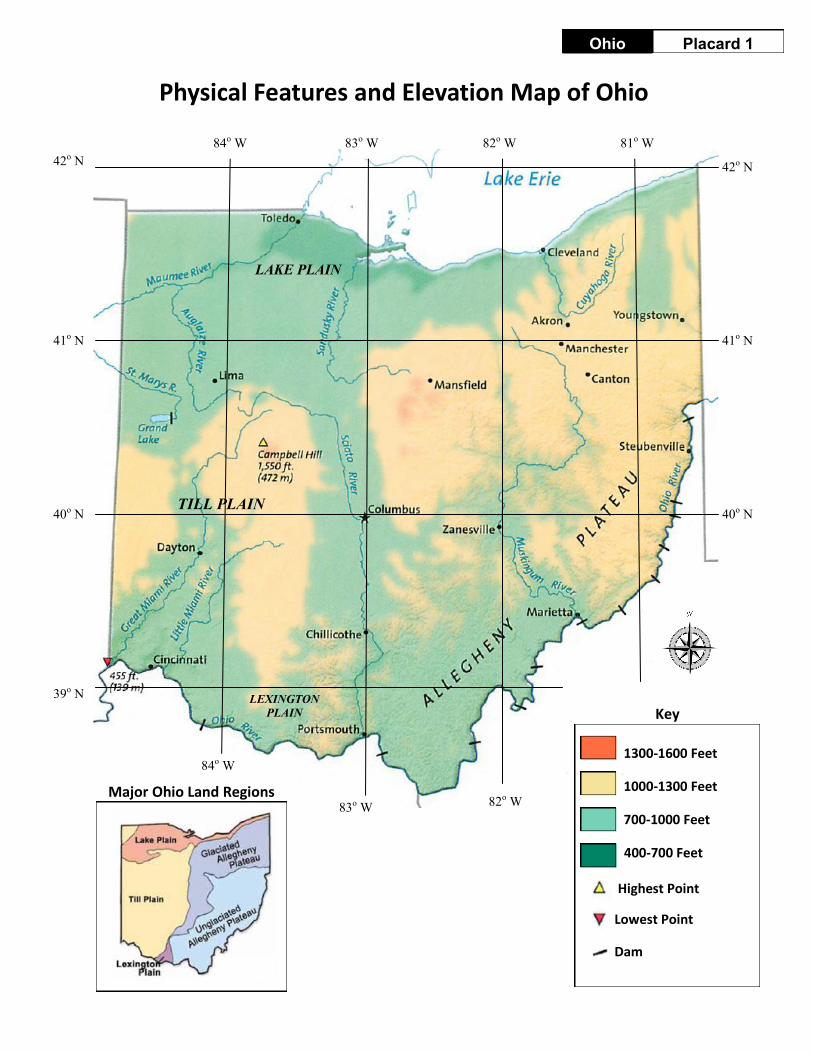
Physical Features and Elevation Map of Ohio
Placard 1 Ohio
40o N
39o N
41o N
42o N
40o N
41o N
42o N
84o W 81o W 82o W 83o W
84o W
82o W 83o W
Key
1300-1600 Feet
1000-1300 Feet
700-1000 Feet
400-700 Feet
Highest Point
Lowest Point Dam
Major Ohio Land Regions
TILL PLAIN
LAKE PLAIN
LEXINGTON
PLAIN
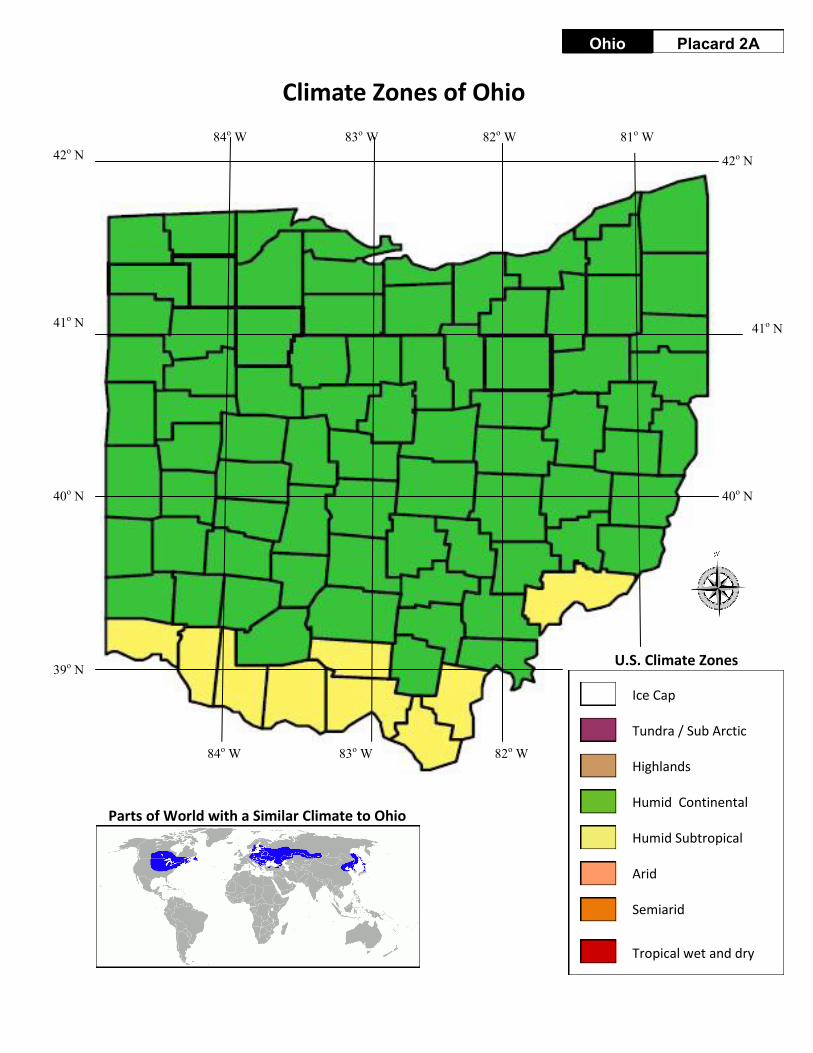
Ice Cap Tundra / Sub Arctic Highlands Humid Continental Humid Subtropical Arid Semiarid
Tropical wet and dry
U.S. Climate Zones
Climate Zones of Ohio
Placard 2A Ohio
Parts of World with a Similar Climate to Ohio
40o N
41o N
42o N
40o N
41o N
42o N
84o W 81o W 82o W 83o W
84o W 82o W 83o W
39o N
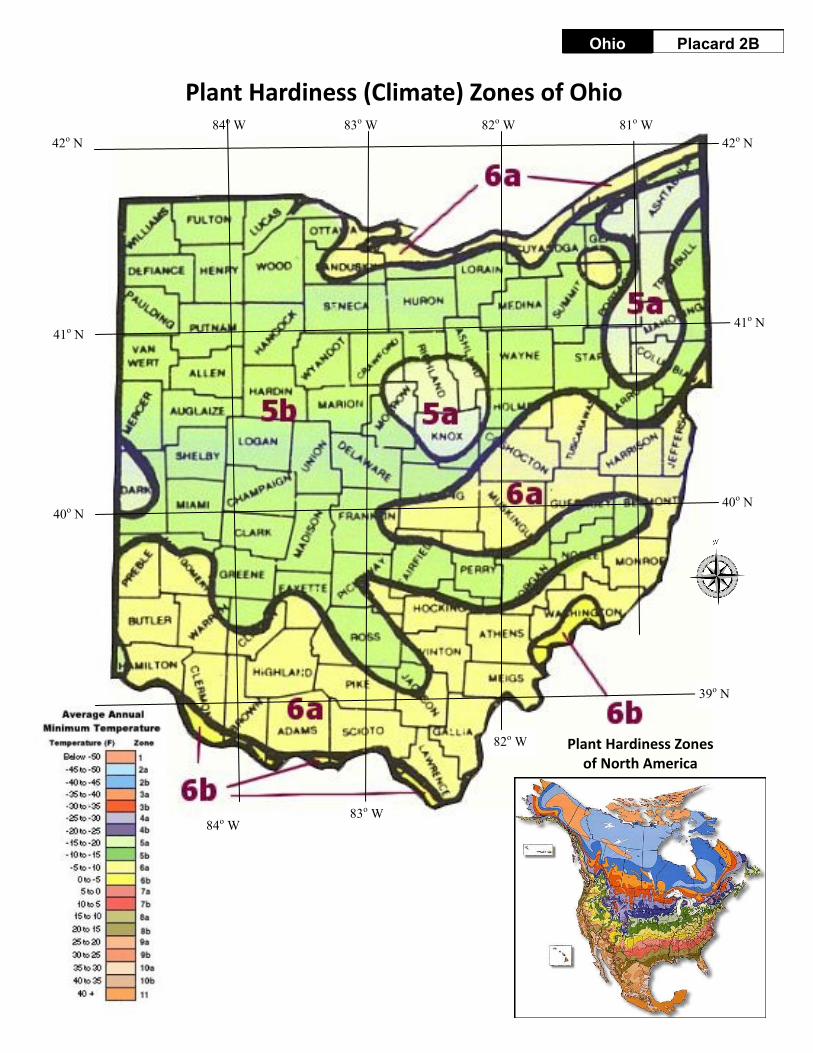
Plant Hardiness (Climate) Zones of Ohio
Placard 2B Ohio
Plant Hardiness Zones of North America
40o N
41o N
42o N
40o N
41o N
42o N
84o W 81o W 82o W 83o W
84o W
82o W
83o W
39o N
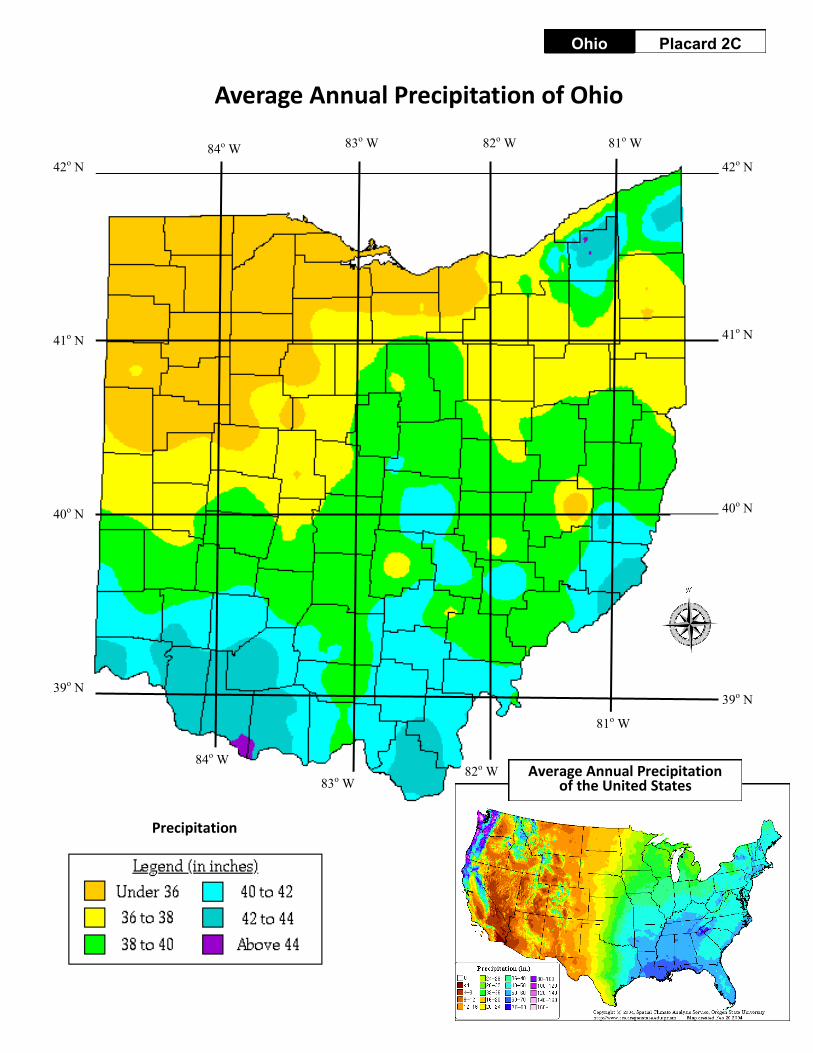
Average Annual Precipitation of Ohio
Placard 2C Ohio
40o N
39o N
41o N 41o N
40o N
84o W 81o W
84o W 82o W
82o W 83o W
42o N 42o N
83o W
Precipitation
Average Annual Precipitation of the United States
39o N
81o W
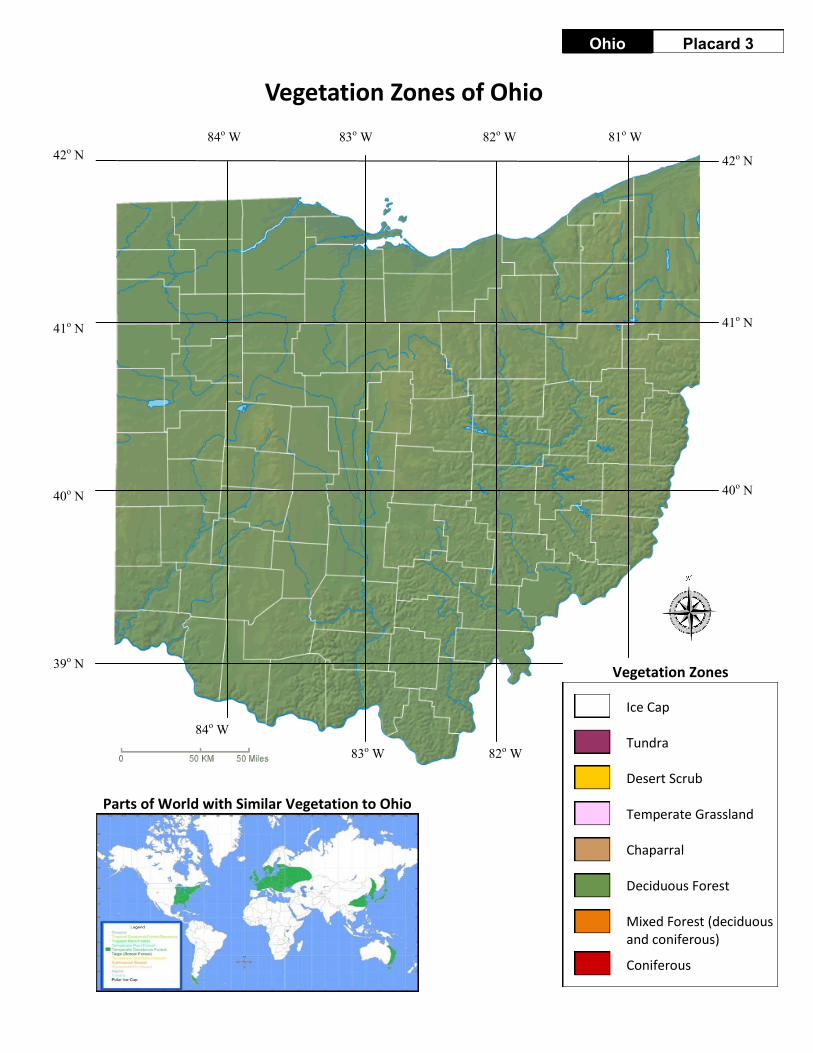
Ice Cap Tundra Desert Scrub Temperate Grassland Chaparral Deciduous Forest Mixed Forest (deciduous and coniferous)
Coniferous
Vegetation Zones
Vegetation Zones of Ohio
Placard 3 Ohio
40o N
39o N
41o N 41o N
40o N
84o W 81o W
84o W
82o W
82o W 83o W
42o N 42o N
83o W
Parts of World with Similar Vegetation to Ohio
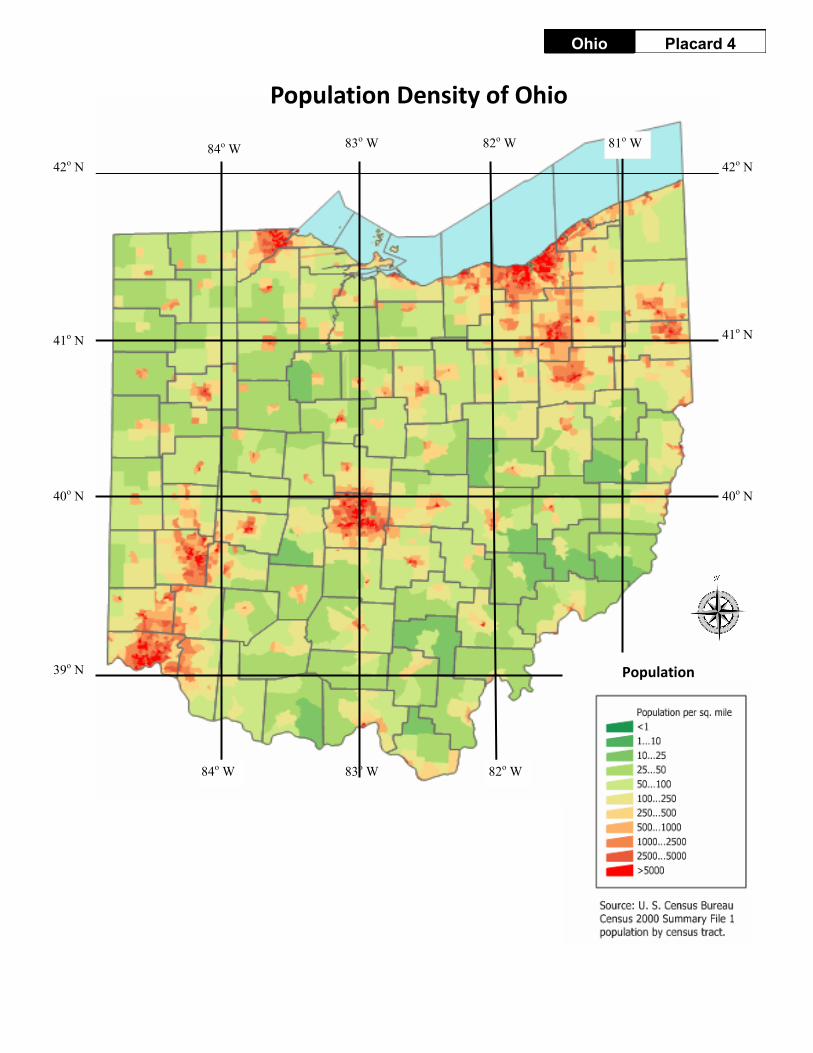
Population Density of Ohio
Placard 4 Ohio
Population
40o N
39o N
41o N 41o N
40o N
84o W 81o W
84o W 82o W
82o W 83o W
42o N 42o N
83o W
40o N
39o N
41o N
42o N
40o N
39o N
41o N
42o N
84o W 81o W 82o W 83o W
84o W 81o W 82o W 83o W
Economic Activity and Land Use Map of Ohio
Placard 5 Ohio
KEY
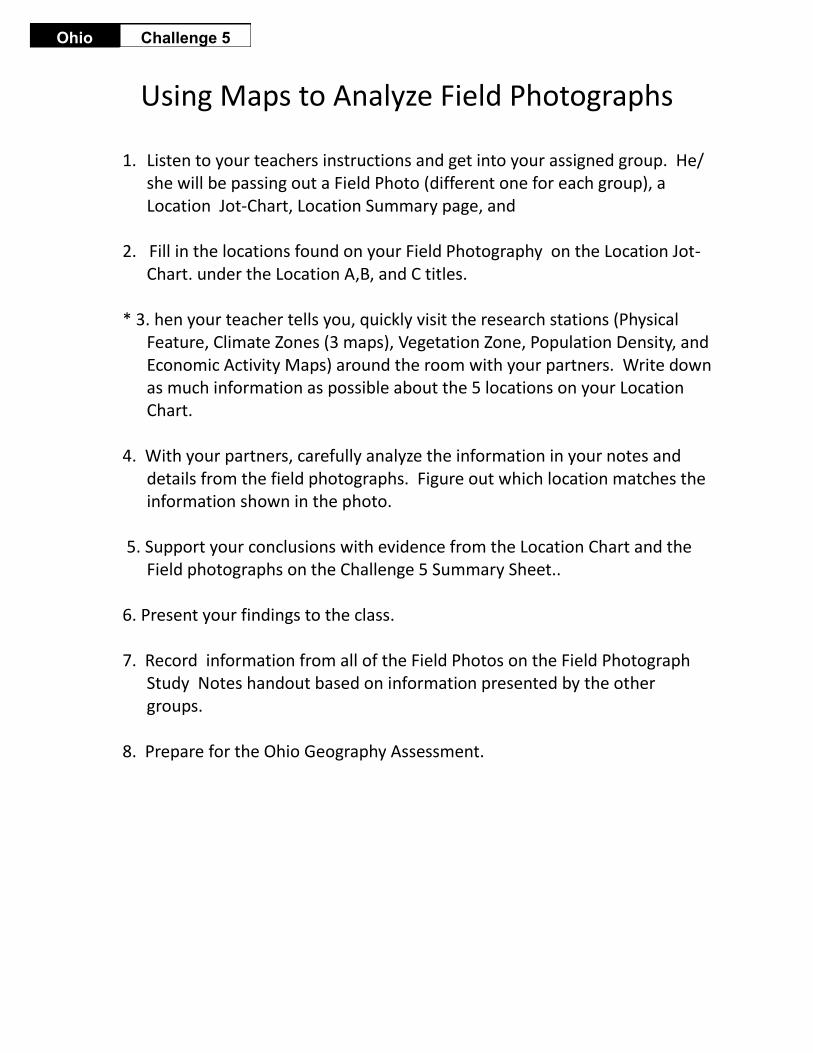
Using Maps to Analyze Field Photographs
1. Listen to your teachers instructions and get into your assigned group. He/ she will be passing out a Field Photo (different one for each group), a Location Jot-Chart, Location Summary page, and
2. Fill in the locations found on your Field Photography on the Location Jot-
Chart. under the Location A,B, and C titles. * 3. hen your teacher tells you, quickly visit the research stations (Physical
Feature, Climate Zones (3 maps), Vegetation Zone, Population Density, and Economic Activity Maps) around the room with your partners. Write down as much information as possible about the 5 locations on your Location Chart.
4. With your partners, carefully analyze the information in your notes and
details from the field photographs. Figure out which location matches the information shown in the photo.
5. Support your conclusions with evidence from the Location Chart and the
Field photographs on the Challenge 5 Summary Sheet.. 6. Present your findings to the class. 7. Record information from all of the Field Photos on the Field Photograph
Study Notes handout based on information presented by the other groups.
8. Prepare for the Ohio Geography Assessment.
Challenge 5 Ohio
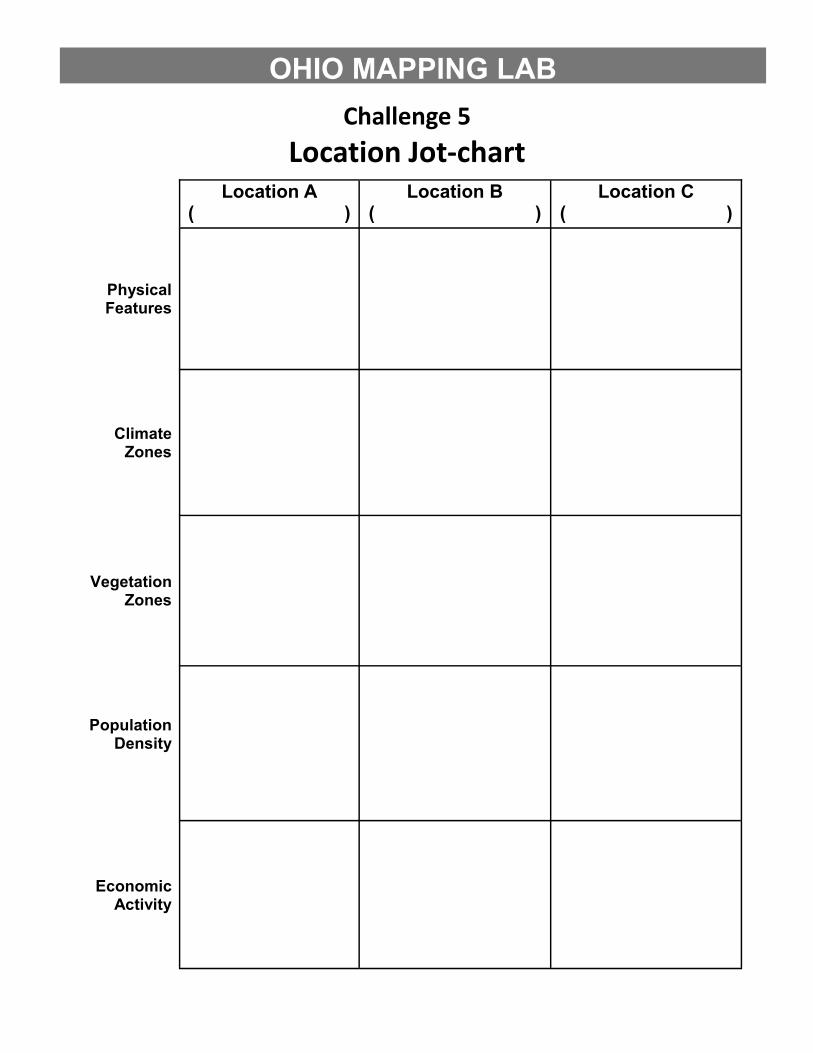
Challenge 5
Location Jot-chart
OHIO MAPPING LAB
Location B ( )
Location C
( ) Location A
( )
Physical Features
Climate Zones
Vegetation Zones
Population Density
Economic Activity
Challenge 5
Location Summary Sheet
We think the field photograph best matches Location ____________.
Supporting-Evidence Statements
1. From the ____________________________________ map, we learned that this location
__________________________________________________________________________
__________________________________________________________________________
_________________________________________________________________________.
In the field photograph, we see _______________________________________________________________
__________________________________________________________________________
__________________________________________________________________________
_________________________________________________________________________.
2. From the ____________________________________ map, we learned that this location
__________________________________________________________________________
__________________________________________________________________________
_________________________________________________________________________.
In the field photograph, we see _______________________________________________________________
__________________________________________________________________________
__________________________________________________________________________
_________________________________________________________________________.
3. From the ____________________________________ map, we learned that this location
__________________________________________________________________________
__________________________________________________________________________
_________________________________________________________________________.
In the field photograph, we see _______________________________________________________________
__________________________________________________________________________
__________________________________________________________________________
_________________________________________________________________________.
OHIO MAPPING LAB
Challenge 5
Location Summary Sheet (Continued)
We think the field photograph best matches Location ____________.
Supporting-Evidence Statements
4. From the ____________________________________ map, we learned that this location
__________________________________________________________________________
__________________________________________________________________________
_________________________________________________________________________.
In the field photograph, we see _______________________________________________________________
__________________________________________________________________________
__________________________________________________________________________
_________________________________________________________________________.
5. From the ____________________________________ map, we learned that this location
__________________________________________________________________________
__________________________________________________________________________
_________________________________________________________________________.
In the field photograph, we see _______________________________________________________________
__________________________________________________________________________
__________________________________________________________________________
_________________________________________________________________________.
OHIO MAPPING LAB
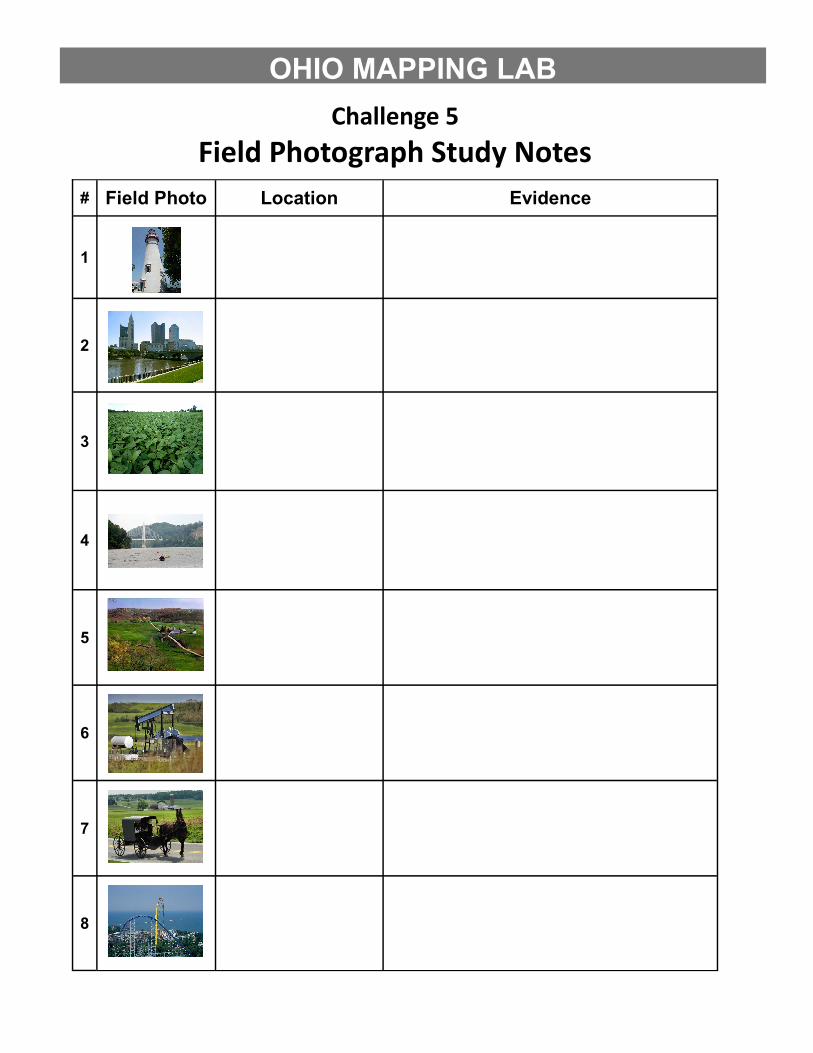
Challenge 5
Field Photograph Study Notes
OHIO MAPPING LAB
# Location Evidence Field Photo
1
2
3
4
5
6
7
8
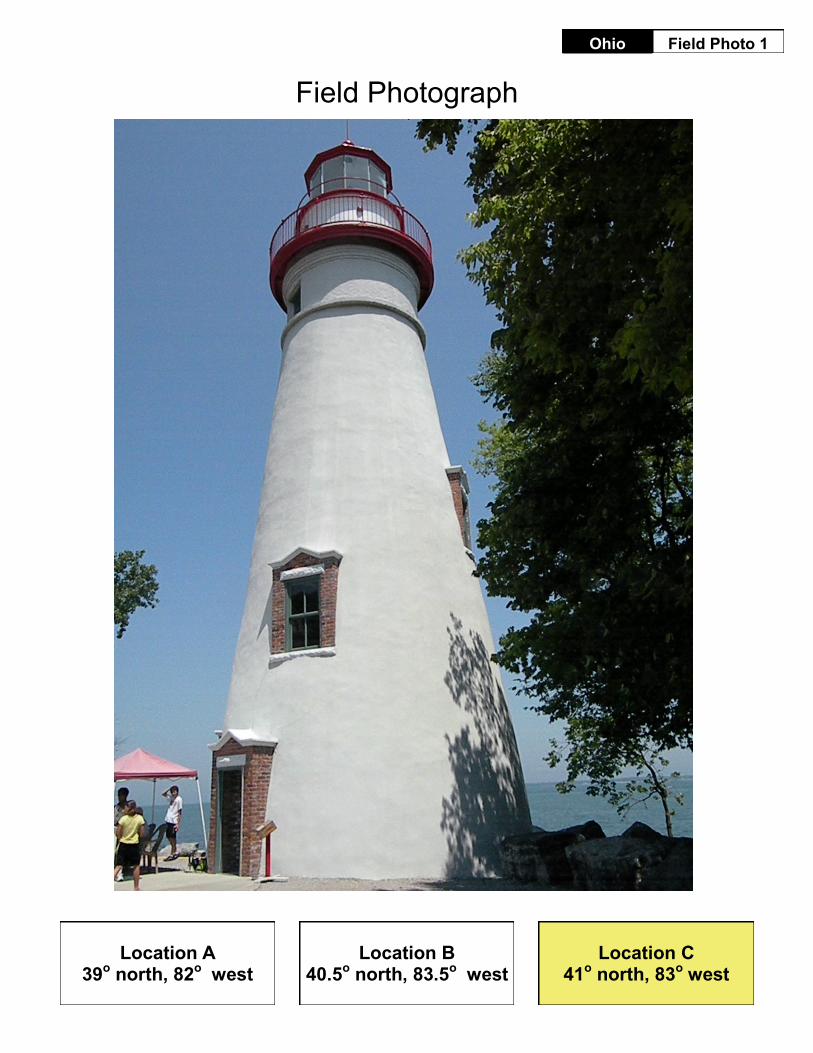
Field Photo 1 Ohio
Field Photograph
Location A 39
o north, 82
o west
Location B 40.5
o north, 83.5
o west
Location C 41
o north, 83
o west
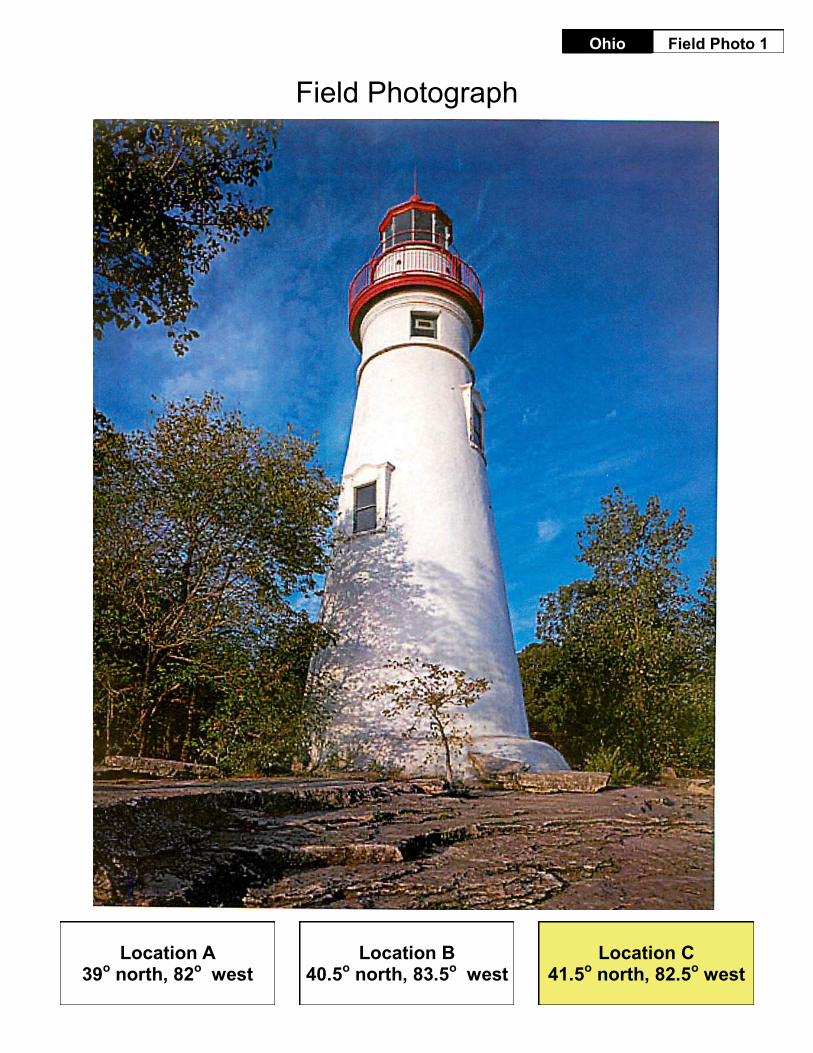
Field Photo 1 Ohio
Field Photograph
Location A 39
o north, 82
o west
Location B 40.5
o north, 83.5
o west
Location C 41.5
o north, 82.5
o west
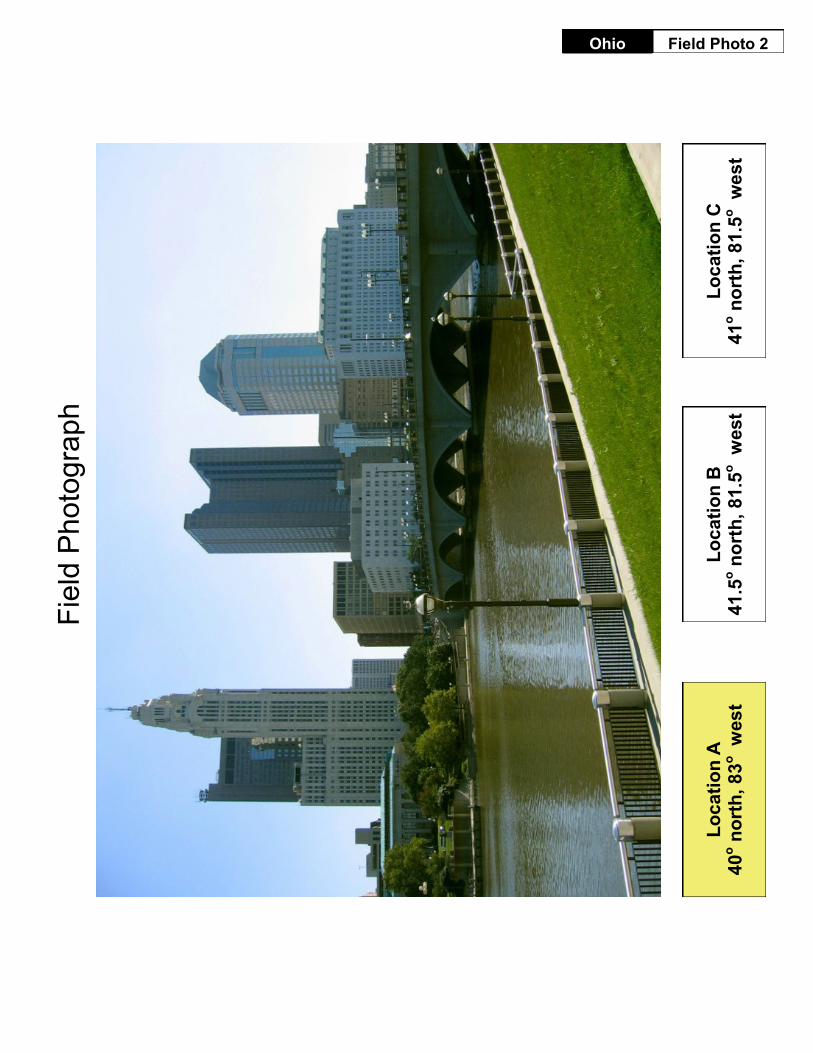
Field Photo 2 Ohio
Fie
ld P
hoto
gra
ph
Lo
ca
tio
n A
40
o n
ort
h, 8
3o w
es
t L
oc
ati
on
B
41
.5o n
ort
h,
81.5
o w
est
Lo
ca
tio
n C
41
o n
ort
h, 8
1.5
o w
est
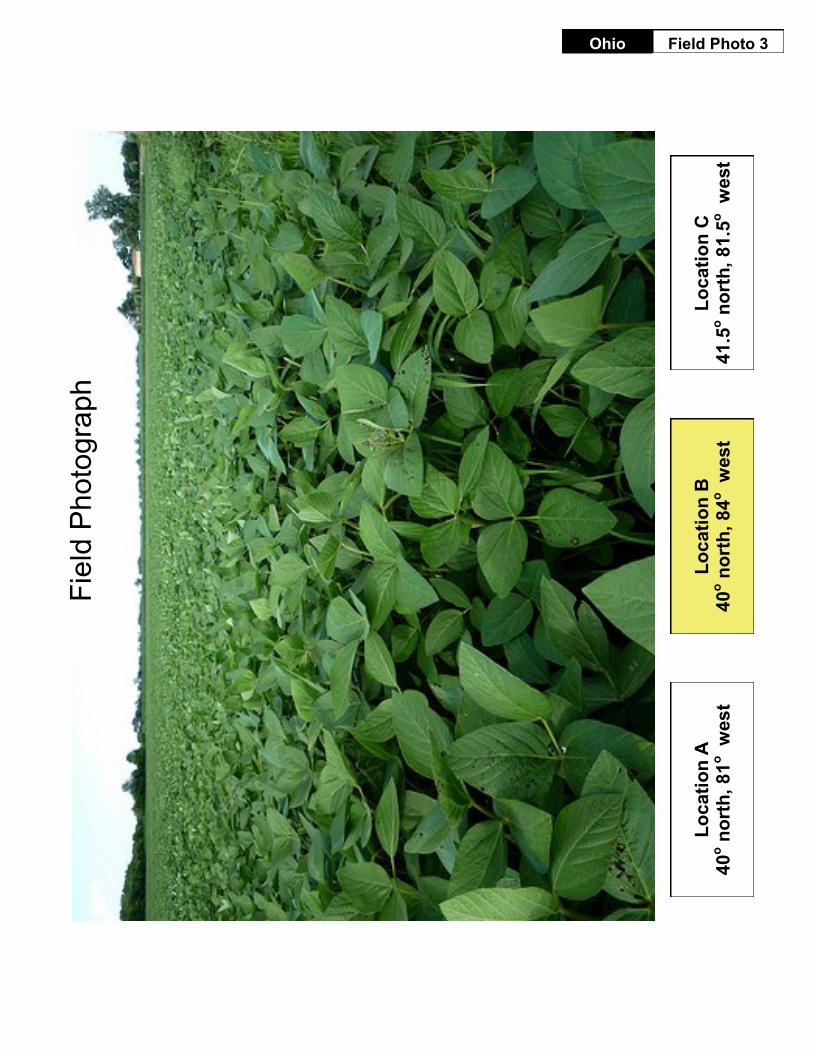
Field Photo 3 Ohio
Fie
ld P
hoto
gra
ph
Lo
ca
tio
n A
40
o n
ort
h, 8
1o w
es
t L
oc
ati
on
B
40
o n
ort
h, 8
4o w
es
t L
oc
ati
on
C
41
.5o n
ort
h,
81.5
o w
est
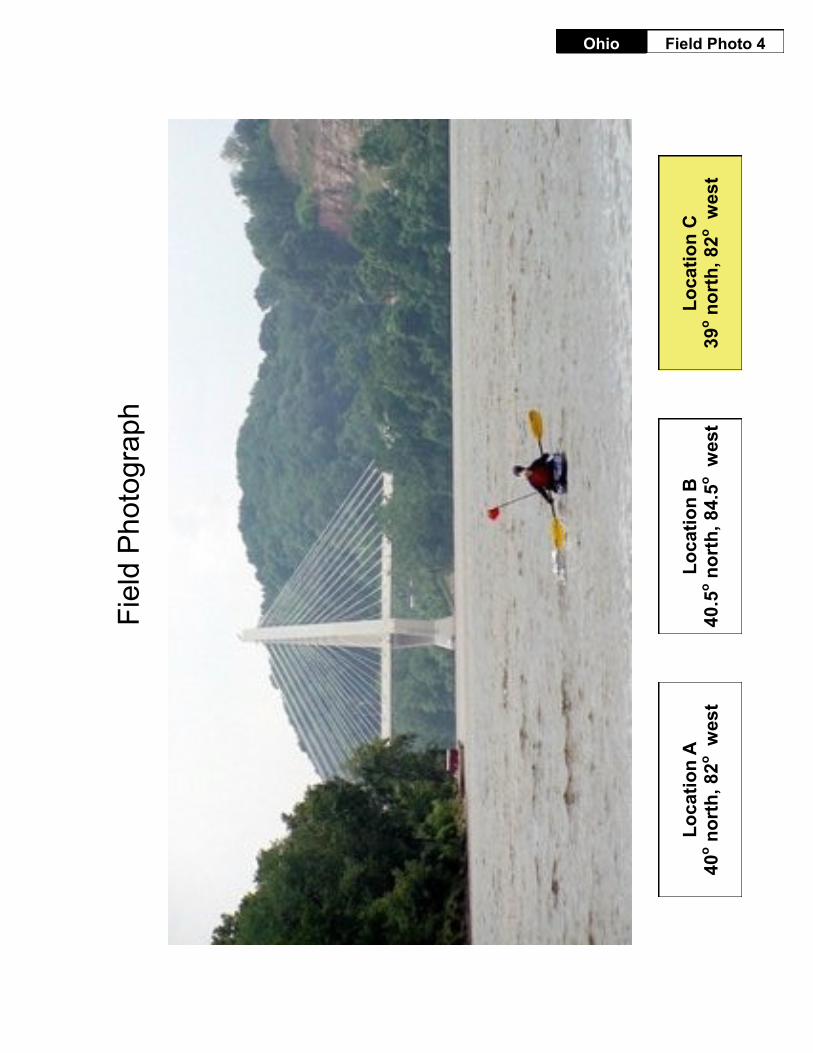
Field Photo 4 Ohio
Fie
ld P
hoto
gra
ph
Lo
ca
tio
n A
40
o n
ort
h, 8
2o w
es
t L
oc
ati
on
B
40
.5o n
ort
h,
84.5
o w
est
Lo
ca
tio
n C
39
o n
ort
h, 8
2o w
es
t
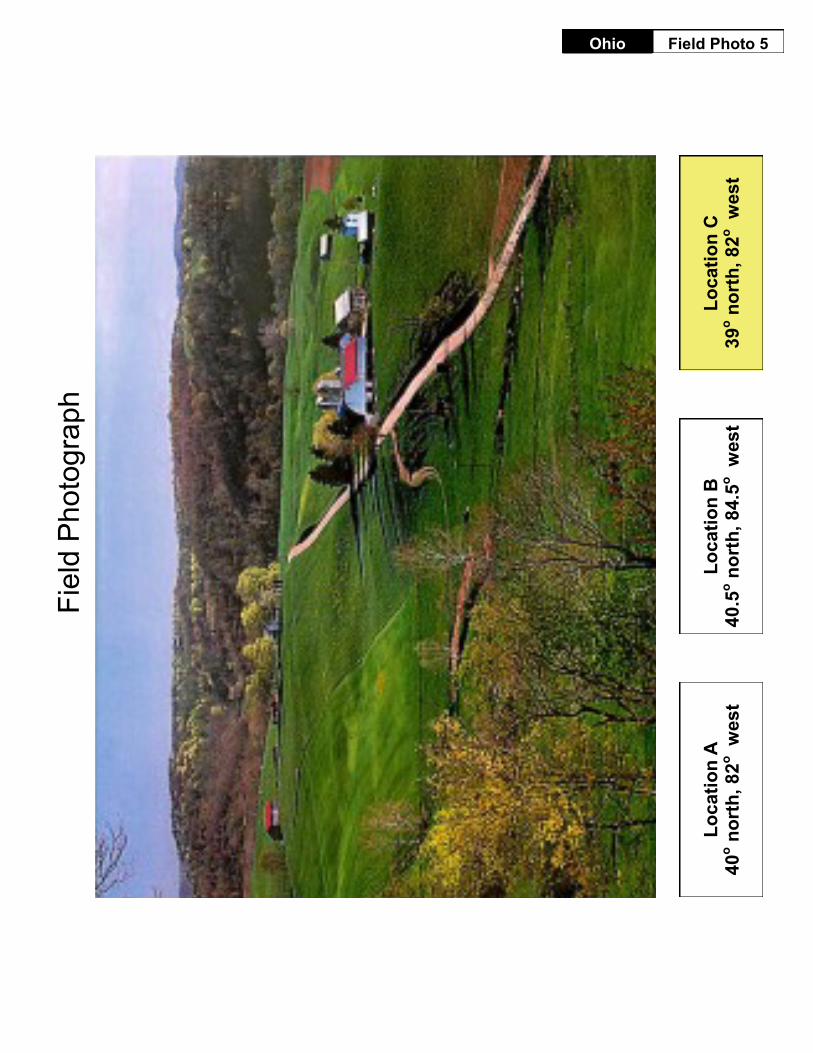
Field Photo 5 Ohio
Fie
ld P
hoto
gra
ph
Lo
ca
tio
n A
40
o n
ort
h, 8
2o w
es
t L
oc
ati
on
B
40
.5o n
ort
h,
84.5
o w
est
Lo
ca
tio
n C
39
o n
ort
h, 8
2o w
es
t
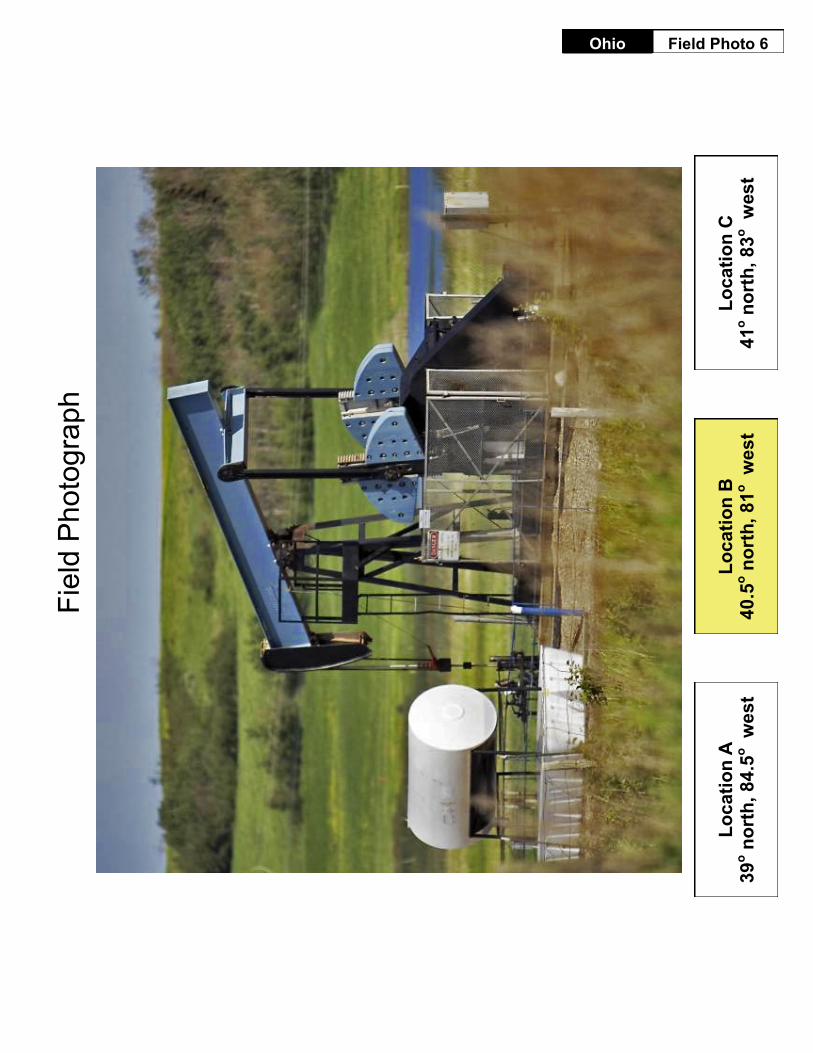
Field Photo 6 Ohio
Fie
ld P
hoto
gra
ph
Lo
ca
tio
n A
39
o n
ort
h, 8
4.5
o w
est
Lo
ca
tio
n B
4
0.5
o n
ort
h,
81
o w
est
Lo
ca
tio
n C
41
o n
ort
h, 8
3o w
es
t
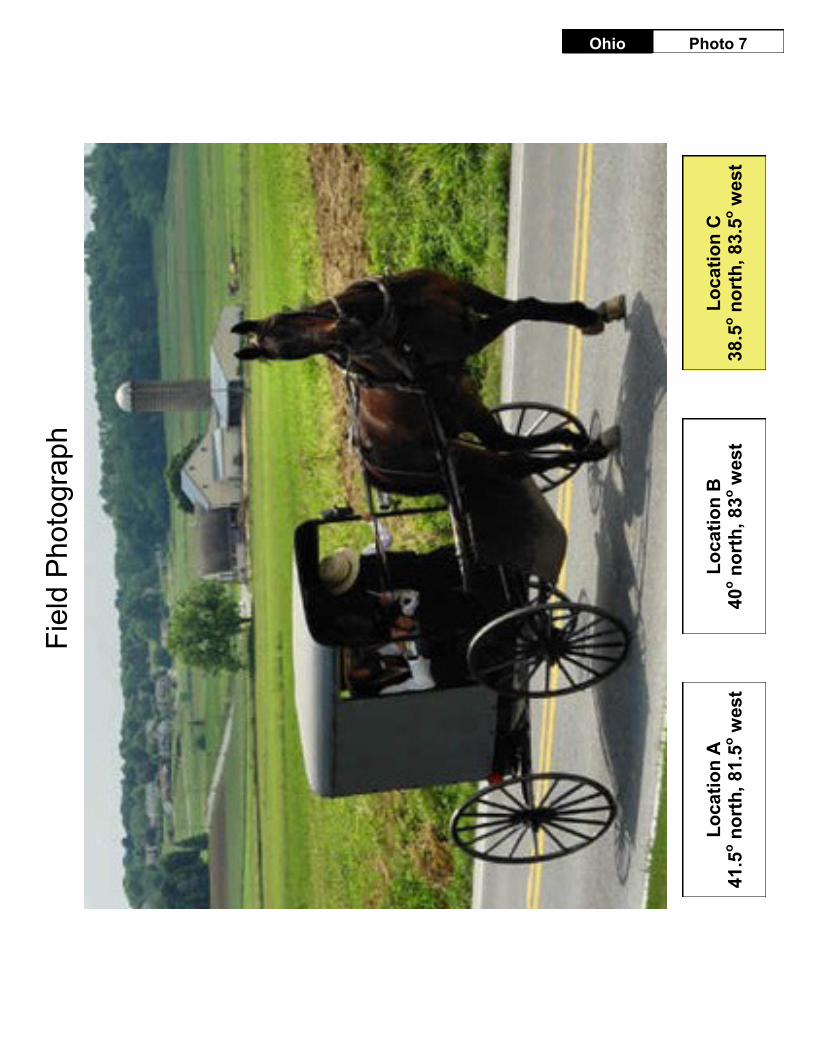
Photo 7 Ohio F
ield
Ph
oto
gra
ph
Lo
ca
tio
n A
4
1.5
o n
ort
h,
81.5
o w
est
Lo
ca
tio
n B
40
o n
ort
h, 8
3o w
est
Lo
ca
tio
n C
3
8.5
o n
ort
h,
83.5
o w
est
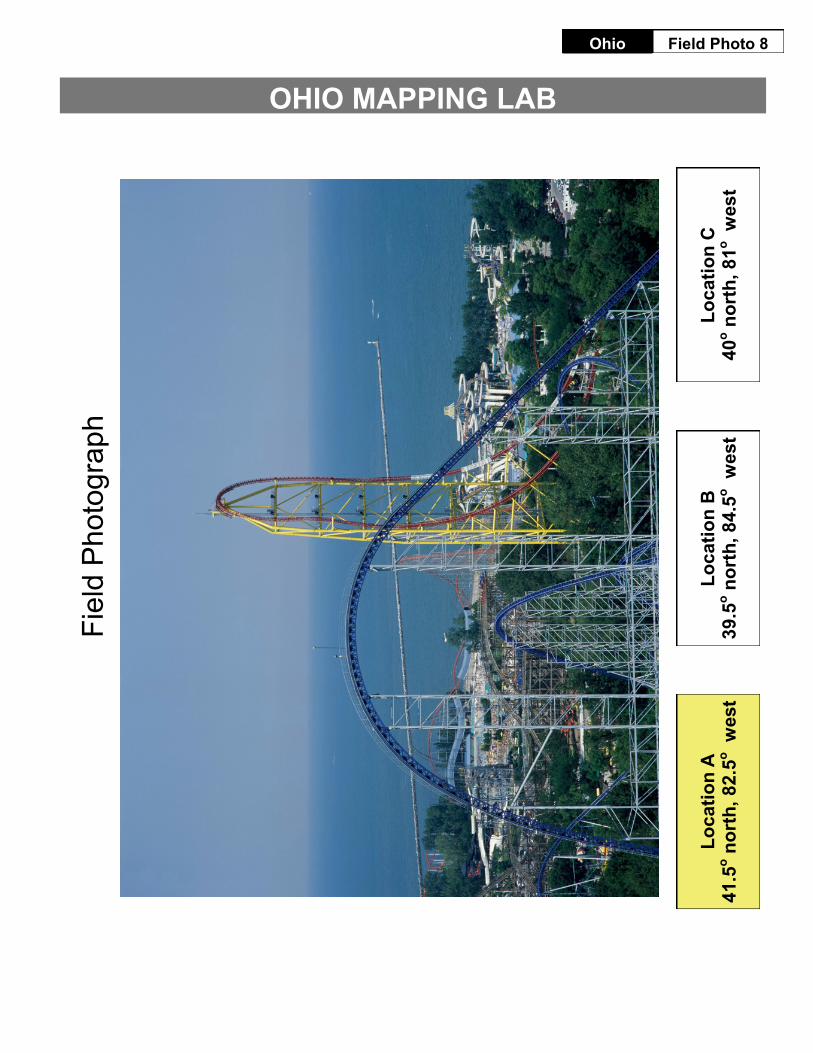
Field Photo 8 Ohio
OHIO MAPPING LAB
Lo
ca
tio
n A
4
1.5
o n
ort
h,
82.5
o w
est
Lo
ca
tio
n B
3
9.5
o n
ort
h,
84.5
o w
est
Lo
ca
tio
n C
40
o n
ort
h, 8
1o w
es
t
Fie
ld P
hoto
gra
ph

Ohio Mapping Lab
Lesson Guide
Created by Kathy Chitwood (Dublin City Schools) and Corbin Moore (Hamilton City Schools) for the Ohio Council for the Social Studies and
Fourth Grade Teachers Across our great state.