MAPPING AND MODELLING OF Mimosa pigra … Output/Thomas Indira.pdf · Ecology of the...
118
MAPPING AND MODELLING OF Mimosa pigra EXPANSION IN LOCHINVAR NATIONAL PARK, ZAMBIA Indira Thomas J March, 2007
Transcript of MAPPING AND MODELLING OF Mimosa pigra … Output/Thomas Indira.pdf · Ecology of the...
MAPPING AND MODELLING OF Mimosa pigra EXPANSION IN
LOCHINVAR NATIONAL PARK, ZAMBIA
Indira Thomas J
March, 2007
Course Title: Geo-Information Science and Earth Observation
for Environmental Modelling and Management
Level: Master of Science (Msc)
Course Duration: September 2005 - March 2007
Consortium partners: University of Southampton (UK)
Lund University (Sweden)
University of Warsaw (Poland)
International Institute for Geo-Information Science
and Earth Observation (ITC) (The Netherlands)
GEM thesis number: 2005-20
MAPPING AND MODELLING OF Mimosa pigra EXPANSION IN LOCHINVAR NATIONAL PARK, ZAMBIA
MAPPING AND MODELLING OF Mimosa pigra EXPANSION IN
LOCHINVAR NATIONAL PARK, ZAMBIA
by
Indira Thomas J
Thesis submitted to the International Institute for Geo-information Science and Earth
Observation in partial fulfilment of the requirements for the degree of Master of
Science in Geo-information Science and Earth Observation, Specialisation:
(Environmental Modelling and Management)
Thesis Assessment Board
Chairperson : Prof.Dr. Alfred de Gier, ITC, Netherlands
External Examiner : Prof Dr.Petter Pilesjö, Lund University, Sweden
First Supervisor : Dr.H.A.M.J. van Gils
Second Supervisor : Dr.Y.A. Yousif Hussin
International Institute for Geo-Information Science and
Earth Observation, Enschede, The Netherlands

Disclaimer
This document describes work undertaken as part of a programme of study at
the International Institute for Geo-information Science and Earth Observation.
All views and opinions expressed therein remain the sole responsibility of the
author, and do not necessarily represent those of the institute.

MAPPING AND MODELLING OF Mimosa pigra EXPANSION IN LOCHINVAR NATIONAL PARK, ZAMBIA
Dedicated to
My beloved parents

MAPPING AND MODELLING OF Mimosa pigra EXPANSION IN LOCHINVAR NATIONAL PARK, ZAMBIA
i
Abstract
Invasions of native plant communities by woody aliens are occurring worldwide
which represent a threat to the composition and diversity of the resident
communities. Wetlands are especially vulnerable to invasions. In Australia 800Km2
of floodplain and swamp forests have been completely invaded by a prickly tropical
shrub, Mimosa pigra. Lochinvar National Park in Kafue river floodplain, a Ramsar
site, rich and unique in terms of biodiversity is facing a threat of invasion by the
woody alien Mimosa pigra. It is unknown how the shrub reached the area as early as
1950’s and is now rapidly spreading in the Park converting the productive floodplain
grasslands to monotypic impenetrable tall shrub lands which have a detrimental
effect on the native flora and fauna.
Multitemporal datasets from LANDSAT and ASTER allowed us to map the extent of
Mimosa pigra infestation in 1984, 1994 and 2005. The sequential mapping showed
the direction and spatial pattern of invasion by Mimosa pigra. The first infestation of
Mimosa pigra was sighted in 1980 along Nampongwe delta on the eastern side of the
Park from where it started to expand to the floodplains over the years. It is now
found widespread within the Park covering an area of about 2900 ha, the two big
concentrations found on the western and eastern sides of the Park. The stochastic
modelling technique known as Markov chain was used to examine whether it was
possible to predict the expectable invasion zones of Mimosa pigra in the next 10
years. The study demonstrated that there has been an explosion of Mimosa pigra
within the Park over the last 10 years preceded by a slow expansion in the previous
decade. The floodplain grasslands have dramatically decreased by 3257.6 ha over a
period of 20 years. The most evident reason for Mimosa pigra invasion within the
Park after a lag period of 50years is the change in natural flooding regime after the
construction of the Ithezi-tezhi dam which has affected the extent of flooded area and
altered the growth of natural vegetation. Tests of independence between the different
land cover images and test of Markovian dependence were performed in order to
determine whether the process of Mimosa pigra expansion over the years was
Markovian or not and to estimate if the predicted transition probabilities to the future
was reliable. Markovian process assumes stationarity and statistical analyses proved
that the pattern of change of land cover change in the Park was sudden and abrupt
that the phenomenon under consideration was not Markovian.

ii
Acknowledgements
Firstly I would like to thank all the consortium directors Professor Andrew
Skidmore, Professor Petter Pilesjo and Professor Peter Atkinson for their guidance
and invaluable help for both academic and non academic matters. I am deeply
indebted to my supervisor Dr Hein van Gils whose scientific guidance, stimulating
suggestions and friendly attitude helped me in all the time of research for writing of
this thesis. Special thanks to Dr Yousif Hussin for giving me timely suggestions
during field work and during writing of the thesis
I wish to express my profound gratitude to Mr Sekhar Lukose Kuriakose for his
constant help, advice and encouragement throughout the thesis work. My heartfelt
thanks to my friend Berhanu who has been of constant help since the commencement
of my research. Special thanks to Griffin for his assistance and support during the
field work.
I further extend my appreciation to Mr Marco (Geovision Consultancy), WWF,
Zambia, and Environmental Council of Zambia for their help and support during the
field work. .My heartfelt thanks to all my classmates and friends especially,
Mwangala, Juan, Rohana, Abel, Zacheus, Michael, Meila and Neelam for all their
patience, support and valuable suggestions.
Special thanks to Mrs Karin Larrson (Lund University) and Professor Dr. Kasia
Dabrowska ( University of Warsaw, Poland) who has been of great encouragement
during difficult times.
Finally I would like to thank the European Commission for funding my studies and
giving me the opportunity to study in three reputed universities in Europe.

MAPPING AND MODELLING OF Mimosa pigra EXPANSION IN LOCHINVAR NATIONAL PARK, ZAMBIA
iii
Table of contents
1. Introduction..................................................................................................... 1
1.1. Background.............................................................................................. 1
1.2. General description of Mimosa pigra ...................................................... 2
1.3. Problem statement ................................................................................... 6
1.4. General description of Markov chain models ........................................ 10
1.5. Literature review.................................................................................... 12
1.6. Research Objectives .............................................................................. 17
1.7. Research Questions................................................................................ 18
2. Study area ...................................................................................................... 20
2.1. Climate .................................................................................................. 20
2.2. Geology and Soils.................................................................................. 21
2.3. Topography and Hydrology................................................................... 22
2.4. Socio economic values .......................................................................... 23
2.5. Wetland Vegetation ............................................................................... 23
3. Materials and Methods................................................................................. 25
3.1. Materials ................................................................................................ 25
3.2. Pre field work phase .............................................................................. 25
3.2.1. Image pre processing ........................................................................ 26
3.3. Sampling design..................................................................................... 27
3.4. Data collection....................................................................................... 27
3.5. Post field work phase............................................................................. 28
3.5.1. Image analysis................................................................................... 28
3.5.2. Supervised classification................................................................... 31
3.6. Change detection ................................................................................... 32
3.6.1. Land Change Modeler....................................................................... 32
3.7. Markov Chain Model............................................................................. 33
3.7.1. Test of independence ........................................................................ 36
3.7.2. Test of Markovian dependence......................................................... 36
4. Results ............................................................................................................ 37
4.1. Superivsed classification of images ....................................................... 37
4.1.1. Accuracy assessment......................................................................... 41
4.2. Change detection using LCM ................................................................ 42
4.3. Cross classification ................................................................................ 51
4.4. Prediction using Markov Chain Analysis .............................................. 53
4.4.1. Test of independence ........................................................................ 57

iv
4.4.2. Test of Markovian dependence .........................................................58
4.4.3. Test of significance ...........................................................................58
5. Discussions .....................................................................................................60
5.1. Delineation of Mimosa pigra invaded areas using multitemporal dataset
………………………………………………………………………….60
5.2. Change detection studies .......................................................................63
5.3. Reasons for the spread of Mimosa pigra ...............................................64
5.4. Ecology of the invasive..........................................................................71
5.5. Analysis of Markov model.....................................................................72
5.6. Limitations of the model ........................................................................73
6. Conclusions and Recommendations.............................................................78
6.1. Conclusions ...........................................................................................78
6.2. Recommendations..................................................................................81
7. References ......................................................................................................83
8. Appendices .....................................................................................................96
MAPPING AND MODELLING OF Mimosa pigra EXPANSION IN LOCHINVAR NATIONAL PARK, ZAMBIA
v
List of figures
Figure1. 1a) Map showing the global distribution of Mimosa pigra .......................... 3
Figure1. 2 - Photographs of Mimosa pigra a) Adult plants b) Flower heads and c)
Young d) Mature seed pods (Source- CSIRO, Australia)........................................... 4
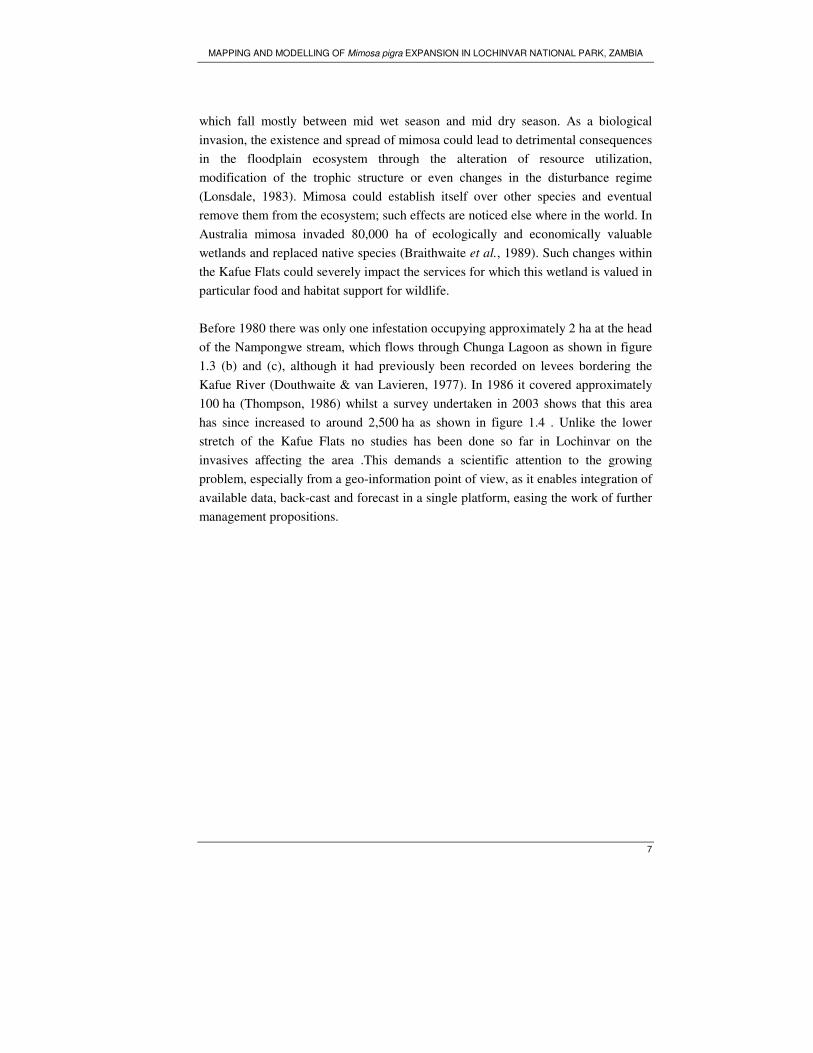
Figure 1. 3- a) Floodplains of Lochinvar National Park in 1973 when there was no
mimosa b) Nampongwe delta from where the mimosa infestation first began c)
Nampongwe delta in 1983 where the first mimosa plants were sighted d) Mimosa
pigra expanding along the Nampongwe delta in 1985 ............................................... 8
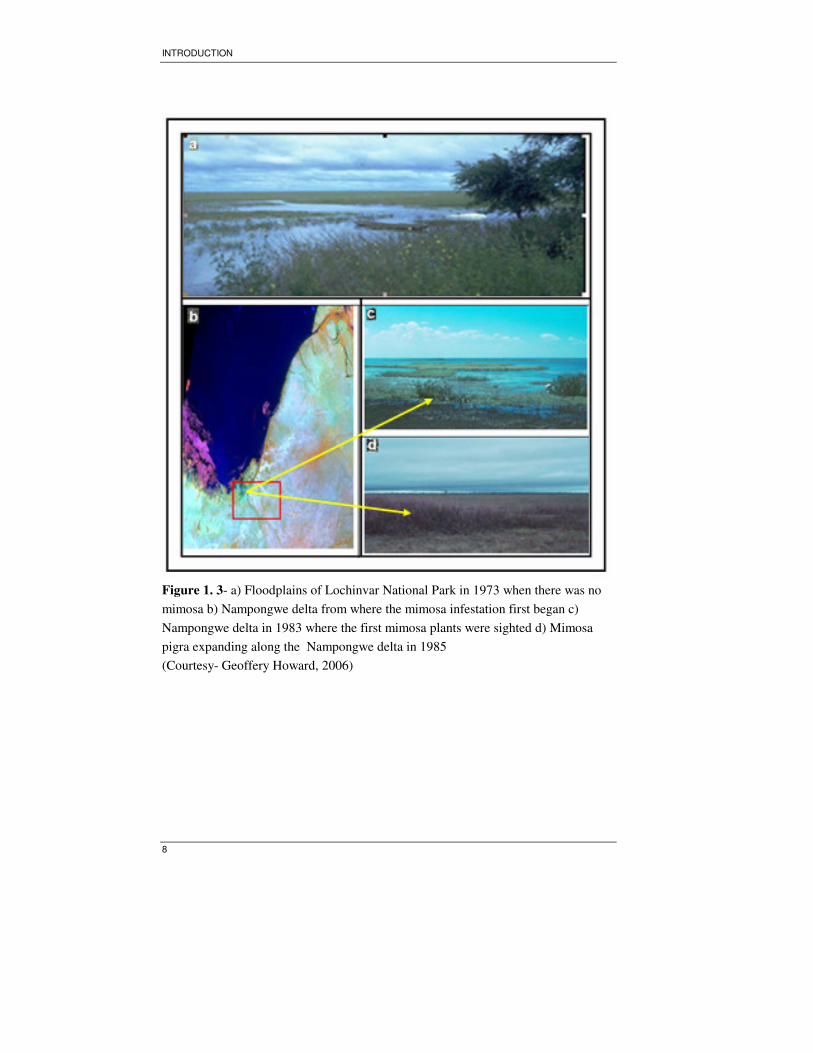
Figure 1. 4-(a) (b) and (c)- Aerial view of the infestation of Mimosa pigra in
Lochinvar National Park d) Mimosa pigra infestation on the grazing grounds of
Kafue Lechwe............................................................................................................. 9
Figure1. 5-Conceptual Framework of Research ....................................................... 19
Figure2. 1 -Map showing the location of Lochinvar National Park, Zambia............ 20
Figure 3. 1- Map showing the area subsetted for the study purpose and the field
observation points recorded...................................................................................... 29
Figure 4. 1- Supervised classification of ASTER 2005 ............................................ 37
Figure 4. 2- Supervised classification of LANDSAT 1994 ...................................... 38
Figure 4. 3- Supervised classification of LANDSAT 1984 ...................................... 39
Figure 4. 4- Graph which shows the overall gain and loss of different cover classes in
ha from 1984-1994 ................................................................................................... 42
Figure 4. 5- Graph showing the net change experienced by different cover classes in
ha from 1984 -1994 .................................................................................................. 42
Figure 4. 6– Graph showing the land cover classes contributing to net loss of
grassland from 1984 -1994 ....................................................................................... 43
Figure 4. 7- Graph showing the land cover class that has contributed to expansion of
mimosa from 1984-1994........................................................................................... 43
Figure 4. 8–Boolean map showing those parts of the study area where grasslands
have experienced an overall gain and loss from 1984-1994. .................................... 44
Figure 4. 9- Boolean map showing the exchanges between the cover classes
grasslands and open mimosa during a period from 1984-1994................................. 44
Figure 4. 10– Graph showing the overall gains in different cover classes in ha during
a period from 1994- 2005 ......................................................................................... 45
Figure 4. 11- Graph showing those cover classes that has contributed to net loss of
grassland during a period from 1994 – 2005 ............................................................ 46
vi
Figure 4. 12Graph showing the classes contributing to net gain of the open mimosa
during a period from 1994-2005...............................................................................46
Figure 4. 13Graph showing the classes contributing to net gain of the class Dense
mimosa during a period from 1994- 2005 ...............................................................46
Figure4. 14- Boolean maps showing the exchanges between the classes grasslands
and open mimosa during 1994-2005.........................................................................47
Figure 4. 15- Map showing the overall transitions between the various classes during
the period 1994-2005................................................................................................47
Figure 4. 16- Graph showing the overall gains and losses experienced by the various
classes. From 1984-2005 ..........................................................................................48
Figure 4. 17- Graph showing net gains and losses (ha) experienced by the various
cover classes from 1984- 2005 ................................................................................48
Figure 4. 18- Graph showing the cover classes that has contributed to net loss of
grasslands(ha) during a period from 1984-2005 .......................................................49
Figure 4. 19- Graph showing the classes that has contributed to net gain the class
open mimosa( ha) during a period from 1984- 2005 ..............................................49
Figure 4. 20- Graph showing those classes that have contributed to increase in dense
mimosa (ha) during a period from 1984-2005 ..........................................................49
Figure 4. 21- Graph showing those classes that have contributed to increase in shrubs
(ha) during a period from 1984-2005. ......................................................................50
Figure 4. 22- Map showing the overall transitions between the various classes during
the period 1984-2005................................................................................................50
Figure 4. 23- Map showing the probability of spatial spread of open mimosa
projected to 2005 according to markov conditional probability matrix....................55
Figure 4. 24-Map showing the probability of spatial extent of grasslands projected to
2005 according to markov transition probability matrix...........................................55
Figure 4. 25- Map showing the probability of spatial spread of open mimosa
projected to 2015 according to markov conditional probability matrix....................56
Figure 4. 26- Map showing the probability of spatial spread of dense mimosa
projected to 2015 according to markov conditional probability matrix. ...................57
Figure 5. 1-Mean monthly discharges at Nymba (pre Ithezi- thezi 1973 -77 and post
Itehzi-thezi 1979-83) (Courtesy- Mumba, 2003) ......................................................66
Figure 5. 2- Graph showing the water levels at Nymba from 1980- 2005. ...............66
MAPPING AND MODELLING OF Mimosa pigra EXPANSION IN LOCHINVAR NATIONAL PARK, ZAMBIA
vii
List of tables
Table 1. 1-Table showing the reproductive cycle of Mimosa pigra ........................... 5
Table 3. 1- Table showing the materials available for study..................................... 25
Table 3. 2- Specifications of the Zambian coordinate system used for reprojection of
the images ................................................................................................................. 26
Table 4. 1- Accuracy assessment of ASTER 2005 ................................................... 41
Table 4. 2- Cross tabulation of land cover 84 (columns) against land cover
1994(rows)................................................................................................................ 51
Table 4. 3- Cross tabulation of land cover 94 columns against land cover 2005 rows.
.................................................................................................................................. 52
Table 4. 4- Cross tabulation of land cover 84 (columns) against land cover 2005
(rows)........................................................................................................................ 52
Table 4. 5- Table showing the overall changes that has taken place between the
various years ............................................................................................................. 53
Table 4. 6- Markov prediction to 2005 based on land cover images of 1984-1994.. 53
Table 4. 7–Markov prediction to 2015 based on land cover images of 1994 and 2005
.................................................................................................................................. 56
Table 4. 8- Summary of the Karl Pearsons χχχχ2 between 1984 - 1994 and 1994 - 2005
and 1984 -2005......................................................................................................... 58
Table 4. 9- Table showing those classes that has changed in proportions when
comparing the land cover images of 1984-94 and 1994- 2005. ................................ 59
Table 5. 1- Control options for Mimosa pigra.......................................................... 76

MAPPING AND MODELLING OF Mimosa pigra EXPANSION IN LOCHINVAR NATIONAL PARK, ZAMBIA
1
1. Introduction
1.1. Background
Biological invasions and the presence of exotic species are a pervasive and costly
environmental problem (Vitousek et al., 1996) that has been the focus of intense
management activities over the last decades (Mooney & Drake, 1987). Alien species
(also called non-indigenous species) invasion is a profuse problem in some of the
most biologically sensitive zones of the world. The reason for such plants being
invading and establishing themselves in regions that were once abodes of indigenous
and endemic species can be attributed to various reasons such as continuing
anthropogenic related disturbances, such as land conversion, grazing, and habitat
fragmentation, combined with international trade and climate change indicate that
these trends are likely to continue (Zedler & Kerceher, 2004). In this context, the
major challenge for land managers and ecologists is how to effectively manage non-
native plants to preserve native biodiversity. Various studies conducted on invasive
aliens prove that once they start expanding the area little can be done to eradicate
them. However being able to delineate the spatial extent and to ascertain the severity
or intensity of the invasion is essential for resource management (Byers et al., 2002).
Various definitions can be found for invasive species. The Plant Conservation
Alliance (2004) defines it as follows: ‘an organism is considered exotic (alien,
foreign, non indigenous, non-native) when it has been introduced by humans to a
location(s) outside its native or natural range. A naturally aggressive plant may be
especially invasive when it is introduced to a new habitat. An invasive species that
colonizes a new area may gain ecological edge since the insects; diseases and
foraging animals that naturally kept its growth in check and its native range are not
present in its new habitat. In the past, such spread was controlled by the presence of
the vast oceans and high mountains of the world that effectively separated
ecosystems; any such spread to occur was only through natural carriers such as wind,
water, birds and wild animals. As humans increased their geographic knowledge and
ventured to the high seas, cut roads across lands and flew over mountains, then was
born an era of uncontrolled spread of alien species, both knowingly and
unknowingly. These species can have adverse economic impacts by reducing crop
INTRODUCTION
2
yields or the quality of grazing lands and can have negative ecological impacts
including reducing biodiversity, endangering rare communities and altering
processes such as nutrient cycling (Higgins et al., 1999; Vitousek, 1990; Young &
Longland, 1996). An invasive plant is one which establishes over large areas and
persists. Invasiveness is characterised by robust vegetative growth, high reproductive
rate, abundant seed production, high seed germination rate, and longevity.
There are several known spreads of invasive species that posed serious management
problems to concerned ecologists. Lowe et al (2003) provides a list of world’s 100
worst invasive species. The booklet also states that “History is rich with tales of the
disastrous outcomes of some intentional introductions such as that of the Nile Perch,
which resulted in the extinction of more than 200 other fish species”. Invasive alien
plants such as Water Hyacinth (Eichornia crassipes), Salvinia (Salvinia molesta),
Giant mimosa (Mimosa pigra) and Lantana (Lantana camara) have established
themselves in freshwater and terrestrial ecosystems throughout Asia
(Bambaradeniya, 2002; Napompeth, 2003). Invasive species are generally more
resistant to climatic fluctuations and management efforts rarely find absolute success
in tackling them. Studies conducted on control of Chromolaena odorata in South
Africa shows that the efficacy and modification of treatment protocols seldom results
in local pest eradication (van Gils et al., 2004). Prevention, early detection, and
efficient management are the most cost-effective means of reducing the problems
caused by invasive plant species worldwide (Byers et al., 2002).
1.2. General description of Mimosa pigra
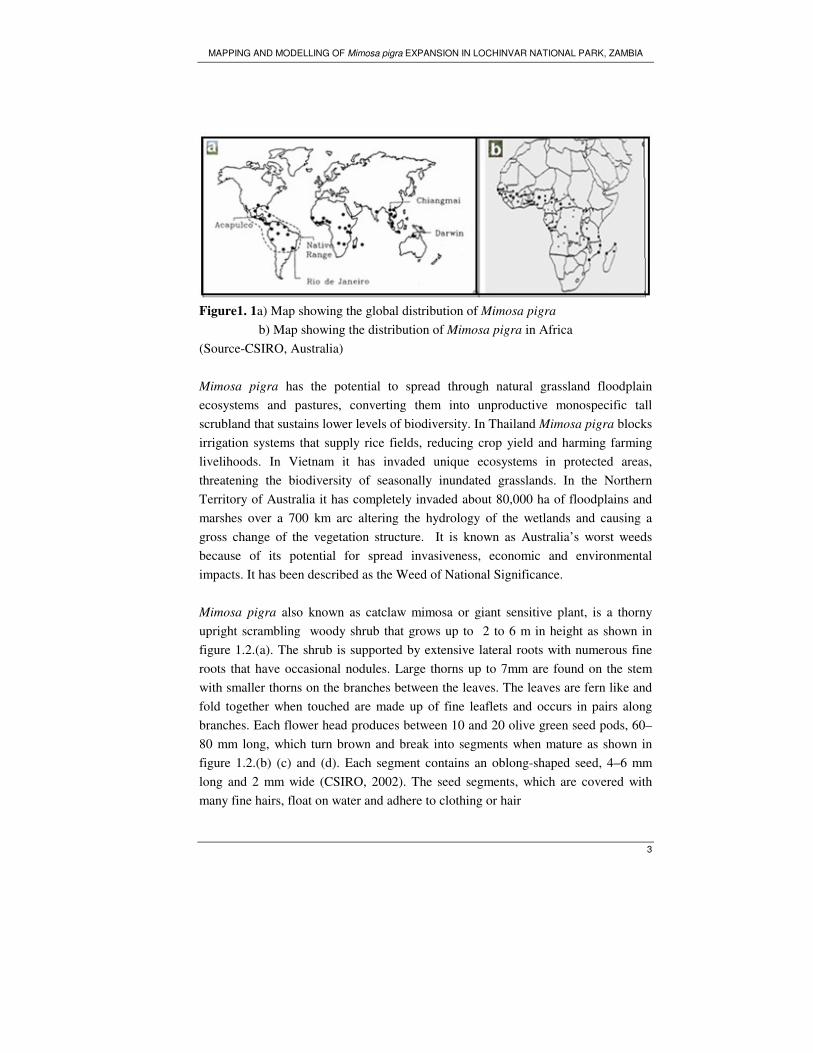
Mimosa pigra is an invasive weed, geographically distributed worldwide especially
in South East Asia, Australia and east Africa as shown in figure 1.1 (a) and (b).
MAPPING AND MODELLING OF Mimosa pigra EXPANSION IN LOCHINVAR NATIONAL PARK, ZAMBIA
3
Figure1. 1a) Map showing the global distribution of Mimosa pigra
b) Map showing the distribution of Mimosa pigra in Africa
(Source-CSIRO, Australia)
Mimosa pigra has the potential to spread through natural grassland floodplain
ecosystems and pastures, converting them into unproductive monospecific tall
scrubland that sustains lower levels of biodiversity. In Thailand Mimosa pigra blocks
irrigation systems that supply rice fields, reducing crop yield and harming farming
livelihoods. In Vietnam it has invaded unique ecosystems in protected areas,
threatening the biodiversity of seasonally inundated grasslands. In the Northern
Territory of Australia it has completely invaded about 80,000 ha of floodplains and
marshes over a 700 km arc altering the hydrology of the wetlands and causing a
gross change of the vegetation structure. It is known as Australia’s worst weeds
because of its potential for spread invasiveness, economic and environmental
impacts. It has been described as the Weed of National Significance.
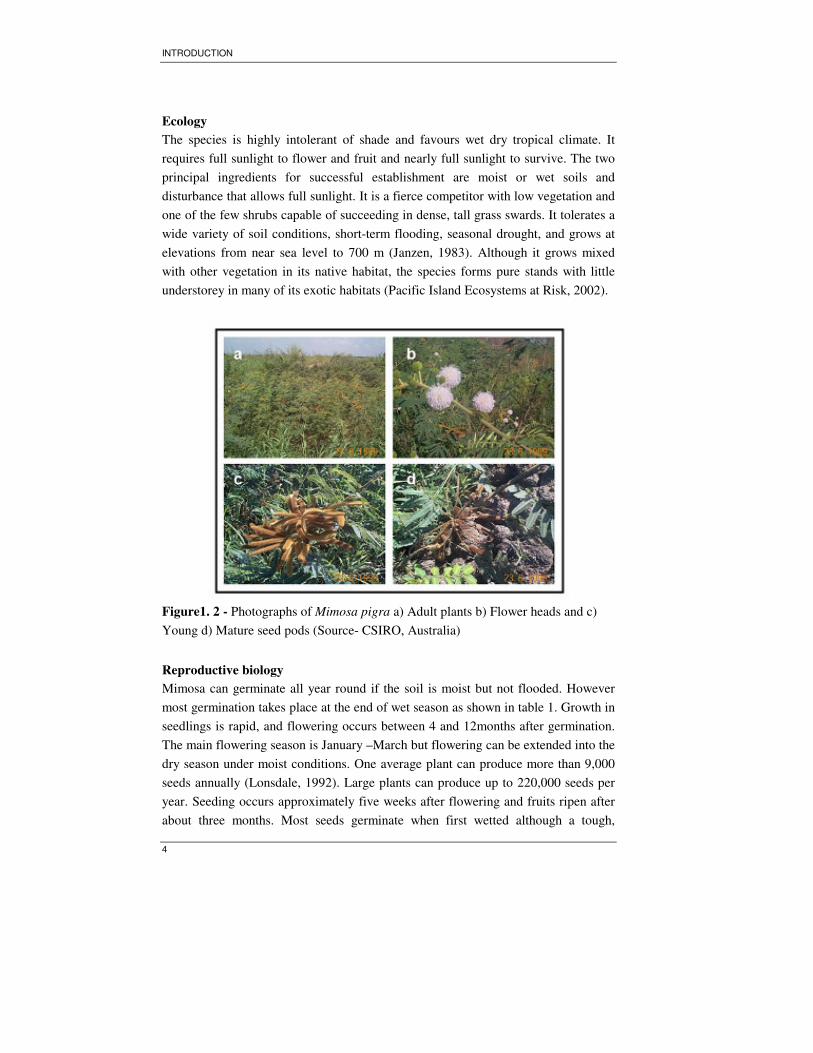
Mimosa pigra also known as catclaw mimosa or giant sensitive plant, is a thorny
upright scrambling woody shrub that grows up to 2 to 6 m in height as shown in
figure 1.2.(a). The shrub is supported by extensive lateral roots with numerous fine
roots that have occasional nodules. Large thorns up to 7mm are found on the stem
with smaller thorns on the branches between the leaves. The leaves are fern like and
fold together when touched are made up of fine leaflets and occurs in pairs along
branches. Each flower head produces between 10 and 20 olive green seed pods, 60–
80 mm long, which turn brown and break into segments when mature as shown in
figure 1.2.(b) (c) and (d). Each segment contains an oblong-shaped seed, 4–6 mm
long and 2 mm wide (CSIRO, 2002). The seed segments, which are covered with
many fine hairs, float on water and adhere to clothing or hair
INTRODUCTION
4
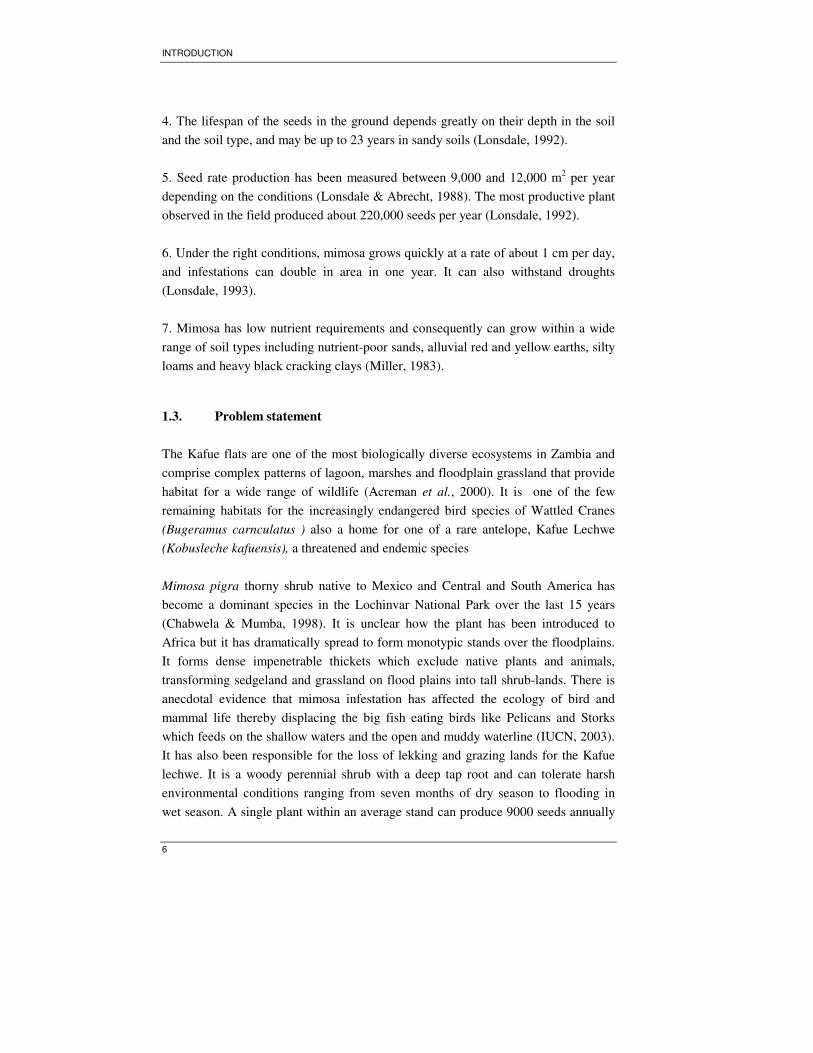
Ecology
The species is highly intolerant of shade and favours wet dry tropical climate. It
requires full sunlight to flower and fruit and nearly full sunlight to survive. The two
principal ingredients for successful establishment are moist or wet soils and
disturbance that allows full sunlight. It is a fierce competitor with low vegetation and
one of the few shrubs capable of succeeding in dense, tall grass swards. It tolerates a
wide variety of soil conditions, short-term flooding, seasonal drought, and grows at
elevations from near sea level to 700 m (Janzen, 1983). Although it grows mixed
with other vegetation in its native habitat, the species forms pure stands with little
understorey in many of its exotic habitats (Pacific Island Ecosystems at Risk, 2002).
Figure1. 2 - Photographs of Mimosa pigra a) Adult plants b) Flower heads and c)
Young d) Mature seed pods (Source- CSIRO, Australia)
Reproductive biology
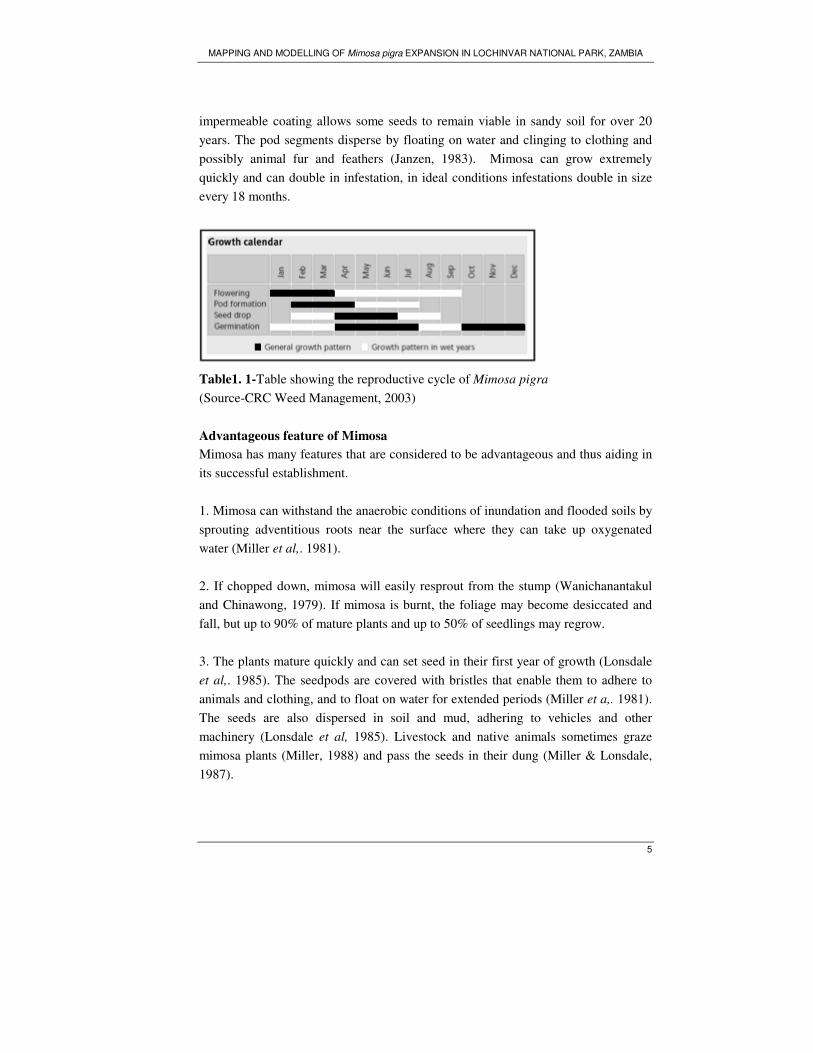
Mimosa can germinate all year round if the soil is moist but not flooded. However
most germination takes place at the end of wet season as shown in table 1. Growth in
seedlings is rapid, and flowering occurs between 4 and 12months after germination.
The main flowering season is January –March but flowering can be extended into the
dry season under moist conditions. One average plant can produce more than 9,000
seeds annually (Lonsdale, 1992). Large plants can produce up to 220,000 seeds per
year. Seeding occurs approximately five weeks after flowering and fruits ripen after
about three months. Most seeds germinate when first wetted although a tough,
MAPPING AND MODELLING OF Mimosa pigra EXPANSION IN LOCHINVAR NATIONAL PARK, ZAMBIA
5
impermeable coating allows some seeds to remain viable in sandy soil for over 20
years. The pod segments disperse by floating on water and clinging to clothing and
possibly animal fur and feathers (Janzen, 1983). Mimosa can grow extremely
quickly and can double in infestation, in ideal conditions infestations double in size
every 18 months.
Table1. 1-Table showing the reproductive cycle of Mimosa pigra
(Source-CRC Weed Management, 2003)
Advantageous feature of Mimosa
Mimosa has many features that are considered to be advantageous and thus aiding in
its successful establishment.
1. Mimosa can withstand the anaerobic conditions of inundation and flooded soils by
sprouting adventitious roots near the surface where they can take up oxygenated
water (Miller et al,. 1981).
2. If chopped down, mimosa will easily resprout from the stump (Wanichanantakul
and Chinawong, 1979). If mimosa is burnt, the foliage may become desiccated and
fall, but up to 90% of mature plants and up to 50% of seedlings may regrow.
3. The plants mature quickly and can set seed in their first year of growth (Lonsdale
et al,. 1985). The seedpods are covered with bristles that enable them to adhere to
animals and clothing, and to float on water for extended periods (Miller et a,. 1981).
The seeds are also dispersed in soil and mud, adhering to vehicles and other
machinery (Lonsdale et al, 1985). Livestock and native animals sometimes graze
mimosa plants (Miller, 1988) and pass the seeds in their dung (Miller & Lonsdale,
1987).
INTRODUCTION
6
4. The lifespan of the seeds in the ground depends greatly on their depth in the soil
and the soil type, and may be up to 23 years in sandy soils (Lonsdale, 1992).
5. Seed rate production has been measured between 9,000 and 12,000 m2 per year
depending on the conditions (Lonsdale & Abrecht, 1988). The most productive plant
observed in the field produced about 220,000 seeds per year (Lonsdale, 1992).
6. Under the right conditions, mimosa grows quickly at a rate of about 1 cm per day,
and infestations can double in area in one year. It can also withstand droughts
(Lonsdale, 1993).
7. Mimosa has low nutrient requirements and consequently can grow within a wide
range of soil types including nutrient-poor sands, alluvial red and yellow earths, silty
loams and heavy black cracking clays (Miller, 1983).
1.3. Problem statement
The Kafue flats are one of the most biologically diverse ecosystems in Zambia and
comprise complex patterns of lagoon, marshes and floodplain grassland that provide
habitat for a wide range of wildlife (Acreman et al., 2000). It is one of the few
remaining habitats for the increasingly endangered bird species of Wattled Cranes
(Bugeramus carnculatus ) also a home for one of a rare antelope, Kafue Lechwe
(Kobusleche kafuensis), a threatened and endemic species
Mimosa pigra thorny shrub native to Mexico and Central and South America has
become a dominant species in the Lochinvar National Park over the last 15 years
(Chabwela & Mumba, 1998). It is unclear how the plant has been introduced to
Africa but it has dramatically spread to form monotypic stands over the floodplains.
It forms dense impenetrable thickets which exclude native plants and animals,
transforming sedgeland and grassland on flood plains into tall shrub-lands. There is
anecdotal evidence that mimosa infestation has affected the ecology of bird and
mammal life thereby displacing the big fish eating birds like Pelicans and Storks
which feeds on the shallow waters and the open and muddy waterline (IUCN, 2003).
It has also been responsible for the loss of lekking and grazing lands for the Kafue
lechwe. It is a woody perennial shrub with a deep tap root and can tolerate harsh
environmental conditions ranging from seven months of dry season to flooding in
wet season. A single plant within an average stand can produce 9000 seeds annually
MAPPING AND MODELLING OF Mimosa pigra EXPANSION IN LOCHINVAR NATIONAL PARK, ZAMBIA
7
which fall mostly between mid wet season and mid dry season. As a biological
invasion, the existence and spread of mimosa could lead to detrimental consequences
in the floodplain ecosystem through the alteration of resource utilization,
modification of the trophic structure or even changes in the disturbance regime
(Lonsdale, 1983). Mimosa could establish itself over other species and eventual
remove them from the ecosystem; such effects are noticed else where in the world. In
Australia mimosa invaded 80,000 ha of ecologically and economically valuable
wetlands and replaced native species (Braithwaite et al., 1989). Such changes within
the Kafue Flats could severely impact the services for which this wetland is valued in
particular food and habitat support for wildlife.
Before 1980 there was only one infestation occupying approximately 2 ha at the head
of the Nampongwe stream, which flows through Chunga Lagoon as shown in figure
1.3 (b) and (c), although it had previously been recorded on levees bordering the
Kafue River (Douthwaite & van Lavieren, 1977). In 1986 it covered approximately
100 ha (Thompson, 1986) whilst a survey undertaken in 2003 shows that this area
has since increased to around 2,500 ha as shown in figure 1.4 . Unlike the lower
stretch of the Kafue Flats no studies has been done so far in Lochinvar on the
invasives affecting the area .This demands a scientific attention to the growing
problem, especially from a geo-information point of view, as it enables integration of
available data, back-cast and forecast in a single platform, easing the work of further
management propositions.
INTRODUCTION
8
Figure 1. 3- a) Floodplains of Lochinvar National Park in 1973 when there was no
mimosa b) Nampongwe delta from where the mimosa infestation first began c)
Nampongwe delta in 1983 where the first mimosa plants were sighted d) Mimosa
pigra expanding along the Nampongwe delta in 1985
(Courtesy- Geoffery Howard, 2006)
MAPPING AND MODELLING OF Mimosa pigra EXPANSION IN LOCHINVAR NATIONAL PARK, ZAMBIA
9
Figure 1. 4-(a) (b) and (c)- Aerial view of the infestation of Mimosa pigra in
Lochinvar National Park d) Mimosa pigra infestation on the grazing grounds of
Kafue Lechwe
The most viable method of surveying such profuse growth of invasive species in a
Savannah desert climate as of Zambia is particularly successful when using multi-
spectral satellite remote sensing data. Owing to the large number of cloud free
datasets (as against the tropical parts of the world), the use of multi-spectral data,
though from multiple sensors, allows to map the various land cover classes and
predict the probability of changes from one class to another over years. Absolute
changes in land use and land cover are not measurable as a continuous phenomenon
owing to the complex processes involved. However, it is possible to identify the
evolution of such changes from available continuous satellite datasets. Such satellite
data sets provide time frozen instances of the changes occurring, enabling to estimate
the probabilities of changes from one instance to the other and from one class to the
other. The calculated a priori probability can be postulated for predictions. Such
predicted probabilities can be used to back cast and forecast the occurred/possible
changes. The derived results can be used for futuristic applications in management
planning. Remote sensing and GIS based change detection studies have
predominantly focused on providing the knowledge of how much, where, what type
of land use and land cover change has occurred, however few of them also address
the questions how and why. Owing to the complexity of modelling land use/ land
cover changes as continuous process, most of the researchers have resorted to the
INTRODUCTION
10
assumption that land use/land cover changes of a given region are a stochastic
process (Brown et al., 2000; Fischer & Sun, 2001; Morisette et al., 1999).
Markovian Model is an ideal method for such an attempt, given the fact that the
method considers change as a stochastic phenomena, with future probabilities of
changes depended on the predicted transitional probabilities from known changes.
1.4. General description of Markov chain models
A Markov chain is a mathematical model for describing a certain type of process that
moves in a sequence of steps through a set of states (Lambin, 1994). For land-cover
change, the states of the system are defined as the amount of land occupied by
various land covers. The number of possible states is either finite or denumerable
(Idrisi, 2005). While it is clear that the actual process takes place in continuous time,
it is almost impossible to apply a continuous time model to any but the simplest
phenomenon. It is therefore, more convenient to regard the process as one which is
discrete in time (Bell, 1974). When Markov analysis is used the matrix of changes is
a transition matrix of conditional probabilities reflecting the probability of change
from one class at a time t to another class at a time t+1. It involves the graphical
locational display of pixels’ likelihood of experiencing a change into a specified sate
in accordance with a matrix of transition probabilities which involves probability
mapping (Logsdon et al., 1996).
This approach can be applied to any set of spatially coterminous data sharing a
common classification system. Conterminous simply means that the state or class of
a specific pixel can be compared with the same pixel’s class at another time
(Logsdon et al., 1996). Markov chains represent a dynamic system of special classes
involving transition probabilities, described as symmetric matrices (Logofet &
Lesnaya, 2000). Here the focus is to demonstrate an application that estimates
probabilistic behaviour of land cover changes. Therefore we assume the data to be
comparable on a pixel by pixel basis and that the classification system correctly
labels the objects in space to the future (Logsdon et al., 1996).
The central mechanism of a Markov chain is a probability Pij which refers to the
transition or movement from a state i to a state j in a given time interval, where i and
j are either locations to model spatial diffusion processes or locationally relevant
classes to model landscape changes (Brown, 1970). For land use change studies, the
states of a system are defined as the amount of land covered by various land cover

MAPPING AND MODELLING OF Mimosa pigra EXPANSION IN LOCHINVAR NATIONAL PARK, ZAMBIA
11
classes, measured as percentages of the area of each landscape unit. For discreet
landscape models, the Markov model can be expressed, in matrix notation, as
n t+1= M n t…………………………………………………………………………………..eqn 1
where nt is a column vector , n=(n1,n2….nm), whose elements are the fraction of land
area in each of m states at a time t, and M is an m x m matrix whose elements, Pij are
the transition probabilities during time interval from t to t+1. The model thus
calculates an output distribution of land area among states from initial configuration,
by means of transition matrix. The markov chain describes an area in aggregate
terms i.e. it is a distributional landscape model. Thus we shall be able to say that
given current trends , it looks as if the different land uses in a landscape area will be
in the proportions predicted by the Markov model (Bell, 1974). In a markovian
process, model output, which is the distribution among state, is based on transition
probabilities. These reflect transition characteristics such that
Pij= f (ai, bj, cij)……………………………………………………eqn 2
Where Pij is the probability of change between the states i and j as a function of
characteristics of the state of origin ai, characteristics of the output state bj and some
relationships between the states of origin and output cij.
The attractiveness of Markov chain analysis is that the models parameters are easily
estimated. The transition probabilities can be statistically estimated from a sample of
transitions occurring during some time interval. Given aij indicating transitions
between pairs of states over some time interval, the transition probabilities Pij are
readily estimated as
Pij= aij/Σj aij………………………………………………… ……………………………………eqn 3
The initial probability vector and the transition matrix completely determine the
Markov chain. However the Markov model has several assumptions as stated below
1) To regard land use and land cover as a stochastic process, and different categories
are states of a chain (Stewart, 1994).
2) Markov chain is a first-order process, which means that the probability of a
particular set of outcomes depends only on the current distribution among states and
the transition probabilities, so that history has no effect. Though there are higher

INTRODUCTION
12
orders markov chains that can be applied to predict the land cover changes it has not
been considered in this study.
3) Markov regards the changes as a stationary process.
.Suppose that an area is characterised by a single species or species group i at some
time t. Between an observation at time t and a subsequent observation at time t+1,
the area can either remain in species i or can change to some other species j. The
probability of transition is stationary if the values of Pij do not change over time. The
process is Markov if the probability of transition from state i to state j does not
depend on a particular path taken to arrive at a state i (Feller, 1968).
Consider a row vector n t whose elements are the number of plots in each of the m
species at time t. If the Markov and stationarity and markov assumptions are made,
then the transition models can be expressed as
n t+1 =ntP……………………………………………………. eqn 4
Where P is a matrix whose elements are Pij (probability of transition from state i to
state j) discussed above. The matrix P is a row- standardized, such that the sum of
transition probabilities from a given state is always equal to one. The value of the
approach is that the transition matrix , once specified , can be used analytically to
project future landscape compositions (Jahan, 1986). Thus we have a method for
projecting vegetation composition over time given an initial distribution of plots
among species no.
Since
n1 =noP………………………………………………………eqn 5
1.5. Literature review
Mapping invasive species is critical to the successful management of bio hotspots.
Mapping them with absolute accuracy is yet a hypothetical proposition owing to
various reasons however an attempt to identify and delineate the actual spread of
invasive species needs to be explored. Techniques, such as remote sensing, offer
significant opportunities for providing timely information on invasions of non-native
species into native habitats. In contrast to field based surveys, imagery can be
acquired for all habitats, over a much larger spatial area, and in a short period of
MAPPING AND MODELLING OF Mimosa pigra EXPANSION IN LOCHINVAR NATIONAL PARK, ZAMBIA
13
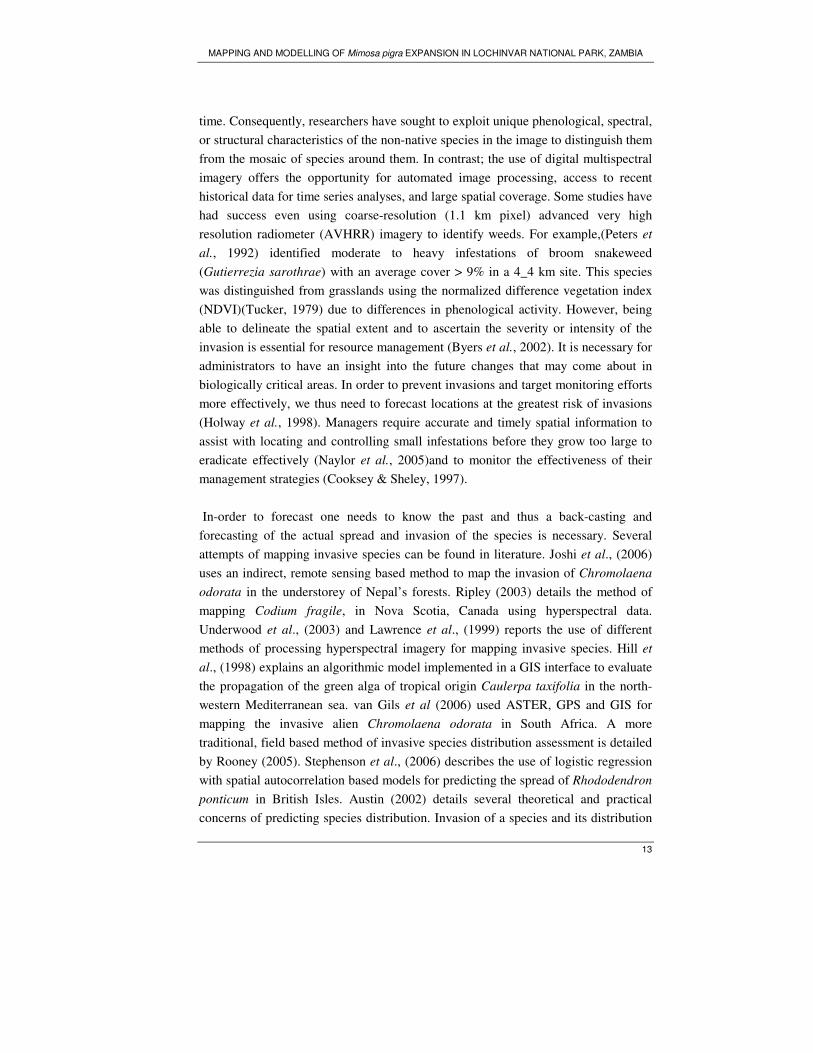
time. Consequently, researchers have sought to exploit unique phenological, spectral,
or structural characteristics of the non-native species in the image to distinguish them
from the mosaic of species around them. In contrast; the use of digital multispectral
imagery offers the opportunity for automated image processing, access to recent
historical data for time series analyses, and large spatial coverage. Some studies have
had success even using coarse-resolution (1.1 km pixel) advanced very high
resolution radiometer (AVHRR) imagery to identify weeds. For example,(Peters et
al., 1992) identified moderate to heavy infestations of broom snakeweed
(Gutierrezia sarothrae) with an average cover > 9% in a 4_4 km site. This species
was distinguished from grasslands using the normalized difference vegetation index
(NDVI)(Tucker, 1979) due to differences in phenological activity. However, being
able to delineate the spatial extent and to ascertain the severity or intensity of the
invasion is essential for resource management (Byers et al., 2002). It is necessary for
administrators to have an insight into the future changes that may come about in
biologically critical areas. In order to prevent invasions and target monitoring efforts
more effectively, we thus need to forecast locations at the greatest risk of invasions
(Holway et al., 1998). Managers require accurate and timely spatial information to
assist with locating and controlling small infestations before they grow too large to
eradicate effectively (Naylor et al., 2005)and to monitor the effectiveness of their
management strategies (Cooksey & Sheley, 1997).
In-order to forecast one needs to know the past and thus a back-casting and
forecasting of the actual spread and invasion of the species is necessary. Several
attempts of mapping invasive species can be found in literature. Joshi et al., (2006)
uses an indirect, remote sensing based method to map the invasion of Chromolaena
odorata in the understorey of Nepal’s forests. Ripley (2003) details the method of
mapping Codium fragile, in Nova Scotia, Canada using hyperspectral data.
Underwood et al., (2003) and Lawrence et al., (1999) reports the use of different
methods of processing hyperspectral imagery for mapping invasive species. Hill et
al., (1998) explains an algorithmic model implemented in a GIS interface to evaluate
the propagation of the green alga of tropical origin Caulerpa taxifolia in the north-
western Mediterranean sea. van Gils et al (2006) used ASTER, GPS and GIS for
mapping the invasive alien Chromolaena odorata in South Africa. A more
traditional, field based method of invasive species distribution assessment is detailed
by Rooney (2005). Stephenson et al., (2006) describes the use of logistic regression
with spatial autocorrelation based models for predicting the spread of Rhododendron
ponticum in British Isles. Austin (2002) details several theoretical and practical
concerns of predicting species distribution. Invasion of a species and its distribution
INTRODUCTION
14
as dominant over indigenous species are clearly noticeable in the spectral behaviour
of a region, thus enabling a remote sensing satellite data set based approach towards
mapping land cover changes which eventually will enable the quantification of
changes that have occurred. Such an approach can provide the possibilities of change
from natural vegetation cover to an invasive species dominant cover, if approached
in a probabilistic manner. Over the last few decades, a range of models of land cover
change have been developed to meet land use management needs and to better assess
and project the future role of land use and land cover change in the functioning of the
earth system (Veldkamp & Lambin, 2001). Aspinall (2004) used generalized linear
models for land use/land cover change analysis in Gallatin Valley, Montana. Li and
Yeh, (2002) used neural network based cellular automata implementation in GIS for
predicting multiple land use changes. Weng (2002), Petit et al., (2001), Brown et al.,
(2000) are few of those who used Markovian Modelling to examine the stochastic
nature of the land use and land cover change data and to project the stability of future
land development.
In this study Markov modelling has been chosen for various reasons. The patterns of
landscape development in time and space are the result of complex interactions of
physical, biological, and social forces. Most landscapes have been influenced by
human land use, and the resulting landscape mosaic is a mixture of natural and
human-managed patches that vary in size, shape, and arrangement (Burgess &
Sharpe, 1981; Forman & Godron, 1986; Krummel et al., 1987). The majority of
research utilizes regression-based approach, which relates the locations of land use
and land cover change to a set of spatially explicit variables, and uses models such as
logistic (Landis, 1994; Turner, 1987; Wear et al., 1998) and hedonic price models
(Geohegan et al., 1997).
Spatial transition-based models often refer to cellular automaton simulation models,
which allow for predicting future land development based on probabilistic estimates
with Monte Carlo or other methods (Clarke et al., 1997). One crucial limit to the
development of the process models is, however, the deficiency of explicit modelling
tools for change processes in the current generation of remote sensing and GIS
systems(Clarke & Gaydos, 1998). Equally important is the issue of data availability
(Baker, 1989). Another characteristic of many land use change models is that they
are not independent executables but an integrated component of a larger model that
may include demographic, ecological, economical, and hydrological modules as
well. Whilst it is quite common to simulate land use changes along with dynamics of
other ecosystem components, it may be quite cumbersome to use a complex
MAPPING AND MODELLING OF Mimosa pigra EXPANSION IN LOCHINVAR NATIONAL PARK, ZAMBIA
15
integrated model if one only needs a systematic method for generating a set of
different land use patterns rather than the entire array of model capabilities and
model outputs (Weng, 2002). Markov processes offer a potential advantage here.
Markov analysis of land use change is an aggregate, macroscopic approach because
it does not directly account for any of the drivers of land use change (Brassoulis,
2000). This being a probabilistic model, an important advantage in terms of land use
change is that land use dynamics can be analyzed at a watershed or regional scale
instead of dealing with every plot at the scales where land use changes actually
occur, the farm and field levels. This makes these models particularly useful when
dealing with uncertainty about the complex processes and relationships between
biophysical, economic, and social-cultural factors that affect land use changes.
There are numerous applications of Markov processes for modeling dynamics in land
use and vegetation (Balzter, 2000; Logsdon et al., 1996). The stochastic approach
offered the advantage that land use dynamics could be simulated at a watershed level
without having to describe the complex relationships between biophysical, economic
and human factors that affect land use decisions at the farm and individual field
level.
A stochastic process as opposed to deterministic ones is governed by random
variables and describable only in probabilistic terms. A deterministic model does not
take into account of random variation and therefore gives a fixed and precisely
reproducible result. Probabilistic models in general are appropriate for those
processes where there is complexity of relationships between the interacting
variables, poor understanding of driving forces and unpredictable character of
ecological consequences for human decision making (Lambin, 1994). Given the
difficulties in designing deterministic models, it is convenient to treat these processes
as random in aggregate, and to include them in this form in some stochastic process
describing landscape structure. This approach has become common in ecology and
geography, to model landscape successions or spatial diffusion using markov chains.
The attractiveness of Markov chain analysis is that the models parameters are easily
estimated. The transition probabilities can be statistically estimated from a sample of
transitions occurring during some time interval. The serial dependence which is the
defining property of a Markov model is also potentially attractive for a more
specifically geographical reason. It has been said that the first law of geography is
that nearby things are more alike (Tobler, 1970). The basic structure of a Markov
INTRODUCTION
16
model avoids the necessity of replicating the analysis over as many spatial units as
make up the study area, so that in generalizing the processes involved the technique
provides overall insight which may not be so readily attainable with other approaches
The detection of functional relationships between species and environment and the
testing of ecological theory tend to be secondary considerations (Guisan &
Zimmermann, 2000).
During the previous decades the conceptual and practical advantages have
encouraged geographers to use Markov models to describe and predict changes in
land use, population distribution, residential structure, transport networks and
industrial structure and pattern. In the domain of land use planning, modeling of land
use change as a Markov process has been attempted by a number of authors. Bourne
(1976) utilized the Markov model to predict land use in the central city, and to aid in
probing the questions of process stability and similarity.
Bell (1974) addressed the issues of dependence and process evaluation through the
use of Markov model analysis. Robinson (1978) explored the utility of this model by
addressing the issue of relationships between types of uses in terms of persistence
and rigidity of land use environments. All of these studies showed that the model is
capable of providing some answers, albeit tentative as they are too many questions
concerning the land use change. The model has found a wide range of application in
forest succession studies.
Leak (1970) simulated forest succession by explicitly modeling the birth and death of
individual stems and then aggregating the stem-level outcomes to make stand-level
predictions. Horn (1975 a, b) took this same individual stem approach, but modeled
the inter temporal transitions of saplings into the canopy. His empirical work applied
a model of synchronous replacement of individual canopy trees by individual
understorey stems, but he examined analytically the stability of more complex
Markov models of forest succession. Usher (1966) defines the states as diameter
classes rather than species and projects volume changes over time. Usher and Parr
(1977) applied this type of model to successional changes in Ghanan termite
colonies. Binkley (1980) has tested the stationarity of the markov process in
predicting the succession of hard wood forests in Connecticut.
Thorton &Jones (1978) has used these models for dynamic agricultural land use
modelling with respect to cropping patterns. (Turner, 1987) used it for predicting the
temporal changes in land use patterns in Piedmont County in Georgia. Petit et
MAPPING AND MODELLING OF Mimosa pigra EXPANSION IN LOCHINVAR NATIONAL PARK, ZAMBIA
17
al.,(2000) use these models for quantifying processes of land cover change in south
eastern Zambia. Muller and Middleton (1994)used markov model to make
quantiative comparisons of land use changed dynamics in Niagara region. These
models are relatively easy to apply to dynamics in highly complex vegetation, and
have been used to study succession and obtain short-term quantitative predictions of
land use and land cover changes(LULCC)(Balzter, 2000; Logofet & Lesnaya, 2000).
They can also differentiate local from regional drivers of LULCC (Logofet &
Lesnaya, 2000), which is crucial for informing public policies on resources
conservation and adaptation to climate change. Markov chains have been used to
model changes in vegetation types on a variety of spatial scales. Changes on small
areas of less than a few hectares; (Austin & Belbin, 1981); or on a single small plot
(Lough et al., 1987).
Few studies have attempted to link satellite remote sensing and GIS to stochastic
modelling methods in land cover change studies, despite the fact that the techniques
for such linkages have become mature in recent years due to advances in the
technology of GIS and its integration with remote sensing. In this research an attempt
is made to combine satellite remote sensing, GIS, and markov modelling to analyze
and predict land cover changes due to Mimosa pigra expansion in Lochinvar
National Park of Zambia. The techniques of satellite remote sensing and GIS are
integrated to quantify and analyze land cover changes using LANDSAT TM and
ASTER data and field surveyed in situ data. Markovian modelling is then used to
examine the stochastic nature land cover change data and to project the stability of
future land development in the region. The integration of satellite remote sensing,
GIS, and markov modelling provides a means of moving the emphasis of land cover
change studies from patterns to processes.
1.6. Research Objectives
General Objectives
The objective of the study is to map the land cover changes in Lochinvar National
Park of Zambia using multi-spectral, multi-sensor, multi-temporal datasets so as to
understand the spatio-temporal proliferation of Mimosa pigra and to test if markov
chain models can be used to predict the expectable invasion of the alien plant in
future.

INTRODUCTION
18
Specific Objectives
1) To detect and map Mimosa pigra invaded areas from time series satellite
datasets (LANDSAT TM and ASTER) and relatively prioritize the areas for
management activities.
2) To evaluate the changes in natural land cover as a result of Mimosa pigra
invasion through area statistics derived from the generated land cover maps
3) To predict the expectable invasion zones of Mimosa pigra using first order
markov chain
1.7. Research Questions
Related to objectives 1 and 2
− Which of the datasets available enables a better identification of mimosa
growing areas?
− Which of the image classification methods is optimal for mimosa
delineation?
− What is the optimal number of land cover classes to distinguish mimosa
growing areas?
− What are the area statistics of each land cover classes identified earlier?
− What are the reasons of mimosa proliferation in the study area?
− What are the management priorities in Lochinvar National Park and what
are the available options for controlling mimosa proliferation in the study
area?
Related to objective 3
− What are the transition probabilities of one land cover class to change to the
other over years?
− What is the overall transition probability of the various land cover classes of
the region to a mimosa affected area?
MAPPING AND MODELLING OF Mimosa pigra EXPANSION IN LOCHINVAR NATIONAL PARK, ZAMBIA
19
ASTER
2005
LANDSAT
1994
LANDSAT
1984
Land cover
map 2005
Land cover
map 1994
Land cover
map 1984
Supervised classification
Ground
truth
Idrisi Andes LCM Modeler
Change map
1994-2005
Change map
1984-94
Change map
1984-2005
Idrisi Andes MARKOV module
Transition
probability
matrix 1994-2005
projected to 2015
Conditional
probability images
projected to 2015
Idrisi Andes CROSSTAB module
CROSSTAB
matrix 1994-
2005
CROSSTAB
matrix 1984-
94
CROSSTAB
matrix 1984-
2005
Image Pre
processing
Test of independence
Test of Markovian
dependence
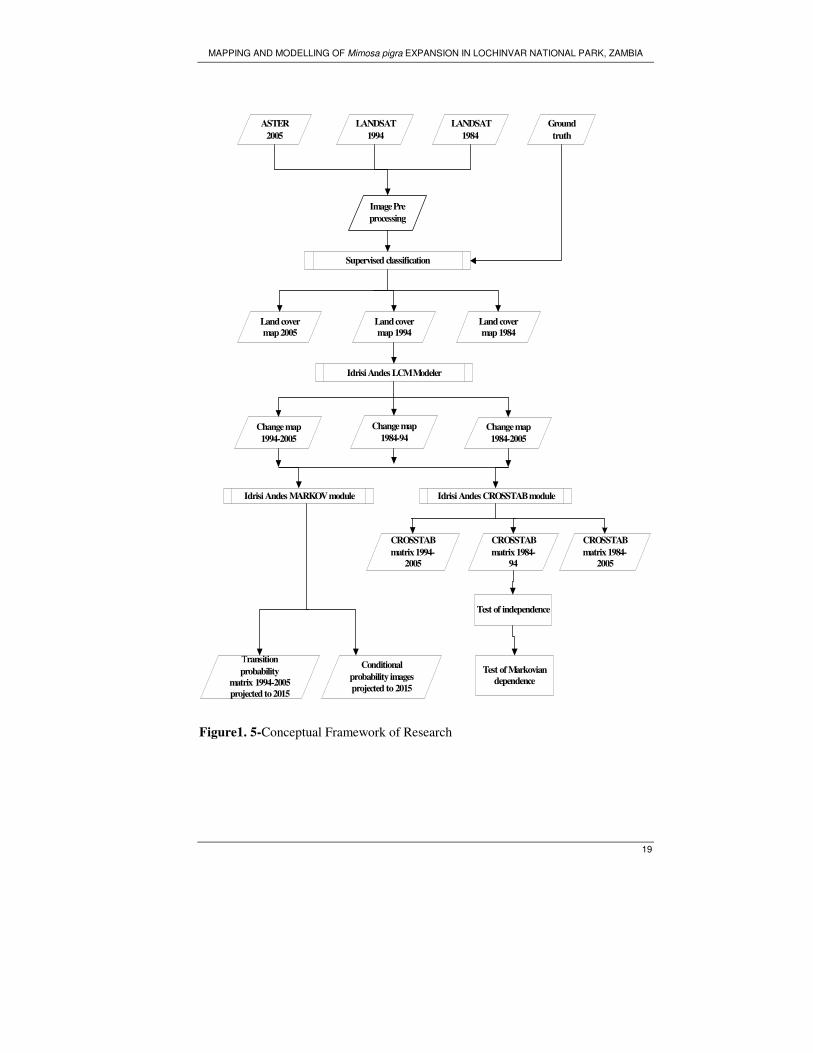
Figure1. 5-Conceptual Framework of Research

STUDY AREA
20
2. Study area
Lochinvar is a small National Park lying on the southern edge of the Kafue Flats in
Zambia as shown in figure 2.1 , between 15043’ and 16
001’S and 27
010’and 27
019’E.
Formerly a cattle ranch, it was gazetted as a National Park in 1972. The Park covers
an area of 410 sqkm, which stretches about 32 km from north to south and 13 km
from east to west. Bounded on the north by the Kafue river the floodplain occupies
about two-fifths of the total area and has an elevation between 975-981m above the
sea level.
Figure2. 1 -Map showing the location of Lochinvar National Park, Zambia
(Source- www.ngoko.com/safaris/maps/lvnp_big.gif)
2.1. Climate
The climate of Lochinvar National Park is marked by three distinct seasons 1)Cool
dry season from (April) May to August 2) Hot dry season from September to
October and 3) Wet warm season extending for 5 months from November to March
The area receives an average annual rainfall of 800mm, much of it in December –
February
MAPPING AND MODELLING OF Mimosa pigra EXPANSION IN LOCHINVAR NATIONAL PARK, ZAMBIA
21
The temperature of the area is generally warm ranging from 220C in June /July to
27.50C in October, the mean maximum and minimum ranging from 22
0C to 30
0C in
October and 140C to 24
0C) in July respectively. The rate of evaporation, except in
the peak rainfall months of January –March is higher than rainfall Potential
evaporation is 1700-2200mm. This indicates that there are only three months of
water surplus in the year, and, there is generally water deficit in 9 months of the year
for plant growth.
2.2. Geology and Soils
The geology of the Kafue Flats represents one of the ancient landmasses of the
African continent. It was formed over time through gentle tectonic forces, which led
to a gradual uplift and subsidence, giving way to a gentle undulating landscape of
“swells and depressions”. A major fault divides the woodlands from the termitaria
zone. Thick sediment overlies the grits, shales and sandstones of Karoo formation
which occur in the termitaria and floodplain zones.
The soils of the Park area are originated as heavy, black, crack montmorillonitic
clays , with lime concentrations in their lower layer, seasonally flooded, drying out to
varying degrees and for various lengths of time (Ponnamperuma,1964). Rainfall has
a profound effect on the soils of the Kafue Flats. Any differences between the layers
appear to be as a result of differences in hydrological conditions between stands,
modified by the extent to which sedimentation occurs and thus by the rate at which
ferrolysis is progressing. The soils of the floodplain are mostly impermeable
montmorillonitic cracking clays.
The termitaria zone is flat above the level of prolonged flooding where tree growth is
restricted. The grey clay of the depression exhibit ‘gilgai’microrelief which is
lacking in the sandier clays of the higher ground, adjacent to seasonal streams and
ancient drainage channels The top soil is strongly acidic at most places and is the
lightest textured fraction of the profile. It contains high proportion of organic matter
in bands of 2-8cm thick, the result of Lechwe trampling vegetation and faeces as the
feed in shallow water .The topsoil is underlain by a compact white silty or sandy
mottled layer between 2- 8 cm thick. This layer overlies the alkaline subsoil
containing lime nodules at varying depths. Despite the strong acidity of the top soil
in most of the study area the soil apparently contains adequate amounts of calcium,
magnesium and potassium to support plant growth. .Mechanical and chemical
STUDY AREA
22
analyses of soil samples gave no indication of soil physical or chemical differences
that might be associated with differences in vegetation between the stands
(Douthwaite & van Lavieren, 1977).
2.3. Topography and Hydrology
The Kafue flats relief is generally plain with gently sloping gradient towards where
the floodplain is situated which is about 975m to 981m above sea level, the water
from the runoff and the Kafue River channels inundate the floodplain and swampy
areas each year. The water table remains high during the dry season.
Lochinvar National Park is flooded by water from three sources –local rainfall,
tributary streams and the Kafue River. The three types of flooding come at different
times of the year and have different characteristics. Flooding from rainfall can occur
during the peak of the rainy season and such floods are quite shallow. Tributary and
streams flood during rainy season and since these streams do not have channels the
water spreads out over the surface of the ground. The greatest source of floodwaters
is Kafue river itself. These waters come from the upper Kafue basin and because of
the distance this water must travel, the flood crest is not reached until the after the
rains have ended. Flooding occurs because of low gradient and water flows from the
river to the Chunga lagoon and this is spilled to the floodplains of Lochinvar. No
data is available on the exact extent and area of flooding however it is known to go
beyond the termitaria zone. The great variation in the height of flood from year to
year is caused primarily by variation in the run off from the upper basin The floods
normally begin to rise with the onset of the rains in mid October .peak flood levels
usually occur at the end of April, about a month after the end of rains. The floods
begin to recede during the dry season from late June and reach their lowest by
November.
After the construction of the Ithezi-tezhi dam and the Kafue Gorge dam there has
been a change in the natural flooding regime affecting the extent, time and duration
of floods and changing the vegetation of the area. This have had serious
consequences on grazing and migratory patterns of lechwe, fish and avi fauna
ecology and growth of invasive aliens
MAPPING AND MODELLING OF Mimosa pigra EXPANSION IN LOCHINVAR NATIONAL PARK, ZAMBIA
23
2.4. Socio economic values
Lochinvar National Park was designated as a Ramsar site in 1991 owing to its
exceptional avian diversity and ideal habitat to the semi aquatic endemic antelope
Kafue lechwe,- Kobus leche kafuensis Almost 40,000 lechwe in the South Bank of
the Kafue flats is found on Lochinvar.alone The Park is also known for large
mammals and insect diversity . The Chunga lagoon also supports large fish
population which sustains the livelihood of fishermen living adjacent to the park.
2.5. Wetland Vegetation
The vegetation of the park is of three main types 1) Floodplain 2) Termitaria and 3)
the Woodlands.
The floodplain, with very little local relief, lying at the lowest elevations is subject to
seasonal inundations. Because of the low gradients and the generally impervious
nature of the soil, local rainfall, cause flooding beginning in November and
December. Run-off due to local rainfall in the Park area supplies more moisture to
raise the water level and flooding of an ever greater area continues through January
to March .With normal rainy conditions the waters will slowly cover the flats and by
the end of the rainy season and in March and April the area is submerged. Many of
the aquatic and semi-aquatic plants grow well under these circumstances. In this area
the most dominant plant species found are Nymphaea ( waterlilies), Vossia
cuspidata ( hippo grass) , Echinochloa stagnina ( water grass), Oryza longistaminata
(wild rice ) , Phragmites spp, Acroceras macrum, Leersia denudata, Sacciolepis
africana , Paspalidium platyrrhachis and Vetiveria nigrtana .In other areas
Polygonum senegalnese, Typha domingensis and Nymphoides spp may form the
most conspicuous elements of the vegetation (Douthwaite & van Lavieren, 1977) .
There are also a variety of herbs found in the area the most common ones being
Ambrosia maritima, Hibiscus trionum, Heliotropium baclei and Nidorella
auriculata.
Above the high water level of the river flood is land which, because of the flatness of
the terrain and poor drainage conditions becomes water logged during rainy season
due to local rains and run off .But this area is not subject to prolonged flooding from
the Kafue River. These conditions are inimical to tree growth ,nonetheless termites
are active here and are responsible for raising the great mounds which form the
STUDY AREA
24
conspicuous part of the landscape .As a result, this treeless zone has been called the
“Termitaria zone (Douthwaite & van Lavieren, 1977). During the rainy season its an
area of dense grass growth .On termitaria in sandy soil, the most common species
found are Euphorbia candelabrum, Azanza garckeana, Adansonia digitata and
Hyphaene ventricosa. Mounds in the clayey soil are commonly covered by
Diospyros mespiliformis, Albizia harveyi, Lonhocarpus capassa and Commiphora
edulis. Woody plants may grow on some of the large, older termitaria, giving rise to
the other name of this area; the bush group grasslands (van Rensburg, 1968a).
The remainder of the park is at such an elevation and under such conditions, that
drainage is better and tree growth is not suppressed to any great extent. The termites
are active too and large mounds are found amongst trees. In general the trees are well
spaced and grass growth beneath producing the savannah. Locally this type of
vegetation is referred to as “Munga woodland “because of the presence of the thorny
trees, primarily species of Acacia (Fanshawe, 1969). Some of the common species
found here are Acacia nigrescens, Acacia abysinica, Acacia tortolis, Acacia nilotica,
Acacia xanthophloea, Combretum collinum, Pericopsis angolensis, Terminalia
sericea, Dalbergia melanoxylon, Acacia polycantha, Acacia sieberana , Albizia
harveyi etc.
In some areas Mopane woodland is also found where the predominant tree is
Colophospermum mopane. The commonly found trees in this area are, Adansonia
digitata ( Baobab tree), Commiphora mollis and Euphorbia candelabrum..
Studies conducted by Rees (1978 a)reveals the fact that differences from vegetation
between different units are attributable mainly due to hydrological differences (depth
and duration of flooding and length of dry period) rather than to intrinsic physical or
chemical properties of the soil
MAPPING AND MODELLING OF Mimosa pigra EXPANSION IN LOCHINVAR NATIONAL PARK, ZAMBIA
25
3. Materials and Methods
3.1. Materials
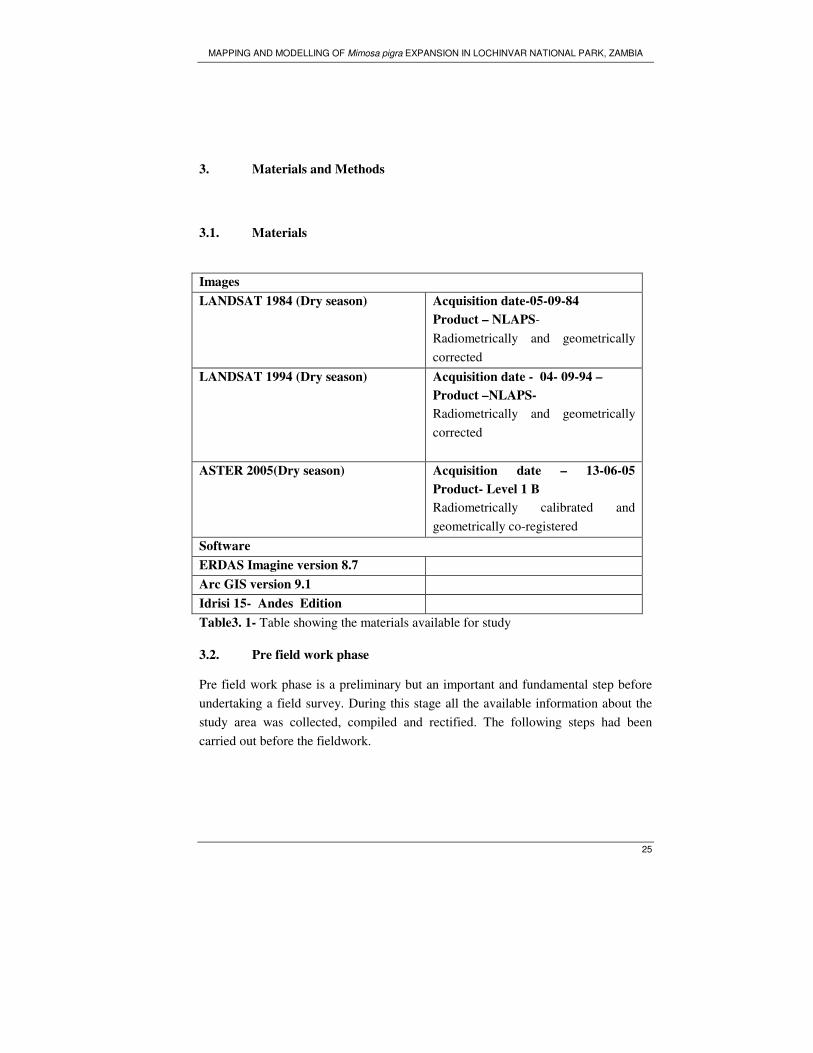
Images
LANDSAT 1984 (Dry season) Acquisition date-05-09-84
Product – NLAPS-
Radiometrically and geometrically
corrected
LANDSAT 1994 (Dry season) Acquisition date - 04- 09-94 –
Product –NLAPS-
Radiometrically and geometrically
corrected
ASTER 2005(Dry season) Acquisition date – 13-06-05
Product- Level 1 B
Radiometrically calibrated and
geometrically co-registered
Software
ERDAS Imagine version 8.7
Arc GIS version 9.1
Idrisi 15- Andes Edition
Table3. 1- Table showing the materials available for study
3.2. Pre field work phase
Pre field work phase is a preliminary but an important and fundamental step before
undertaking a field survey. During this stage all the available information about the
study area was collected, compiled and rectified. The following steps had been
carried out before the fieldwork.

MATERIALS AND METHODS
26
3.2.1. Image pre processing
In this study multi temporal images were used from different sensors. In order to
compare separate images pixel by pixel, the pixel grids of each image should
conform to the other images in the database. Hence pre-processing techniques like
georeferencing, image to image registration and reprojection of the images were
performed on the datasets.
The topographic sheet of Lochinvar National Park was reprojected to the local
Zambian coordinate system the specifications as shown in table 3.2
Projection Transverse Mercator
Spheroid Clarke 1880
Datum Arc 1950( Zambia)
Scale factor 0.9996
Longitude of central meridian 270E
Latitude of origin of projection 00N
False easting 500000 m
False northing 10000000 m
Table 3. 2- Specifications of the Zambian coordinate system used for reprojection of
the images
The next step was to georeference the images .Georeferencing is the process of
assigning map coordinates to an image data. The images of both LANDSAT and
ASTER obtained from the data processing centre were already projected to a desired
plane and referenced to UTM coordinate system. Georeferencing of the ASTER
images were done by stacking only the VNIR and the SWIR bands where the ground
control points were imported and the image was reprojected to the required local
coordinate system. The LANDSAT TM imagery of 1984 was georeferenced to
ASTER imagery using image to image co-registration method in ERDAS Imagine.
Similarly image to image co registration was also done for LANDSAT 1994 to
ASTER imagery in order to make it conform to the other images. All the images
were resampled using, first order transformation, and nearest resampling method of
the uncorrected imagery was performed. The total Root Mean Square (RMS) error
for LANDSAT images was found to be 5m for 1994 and 10 m for 1984 images. For
ASTER imagery the RMS error was found to be 3 m. The RMS error represents the
degree of correspondence between the calibrated fiducial mark coordinates and their
MAPPING AND MODELLING OF Mimosa pigra EXPANSION IN LOCHINVAR NATIONAL PARK, ZAMBIA
27
respective measured image coordinate values. Large RMS errors indicate poor
correspondence (Erdas, 2003).
Both the LANDSAT and ASTER image scenes were subsetted in order to limit the
size of the study area to Lochinvar National Park. For the purpose of field work and
visual classification hard copy colour composite images were made for the data of
ASTER 2005, wet season using band combination 3,4,2 in RGB combination for
improved vegetation discrimination.
Unsupervised classification was performed on the most recent ASTER wet season
imagery. Accordingly classification was done with 7 classes which were identified as
water, submerged vegetation, woodlands, grassland type 1, grassland type 2,
grassland type 3 and open mimosa.
3.3. Sampling design
Stratified random cluster sampling was used to generate the primary cover data. Each
land cover class derived from the unsupervised classification was considered as a
stratum. Random numbers were generated and imported as points in ERDAS
Imagine. Allocation of these points to each of these strata was based according to the
area proportions. Subsequently a cluster of two points were generated around each
random point at a distance of 200m in the north and south direction. A total of 102
sample plots were generated. However during field work it was impossible to visit all
the samples plots due to inaccessibility of the area.
3.4. Data collection
Field work was carried out from September 23 to October 21, 2006; the main
objective was to collect data required for training and validation for classification of
the ASTER 2005 imagery. The sampling sheet (as shown in appendix 1) used for
primary data collection recorded observations such as vegetation cover; presence or
absence of mimosa, average height, and crown cover %. The coordinates of the
sample plots were located with help of the GPS, topographic map and the ASTER
colour composite imagery. Quadrants of 20 X 20m were taken and line intercept
transect method was used to record the above observations The measuring tape was
held in such a manner that it passes through the centre point of the plot and
observations could be taken along 20 m in north- south and 20 m in the east-west
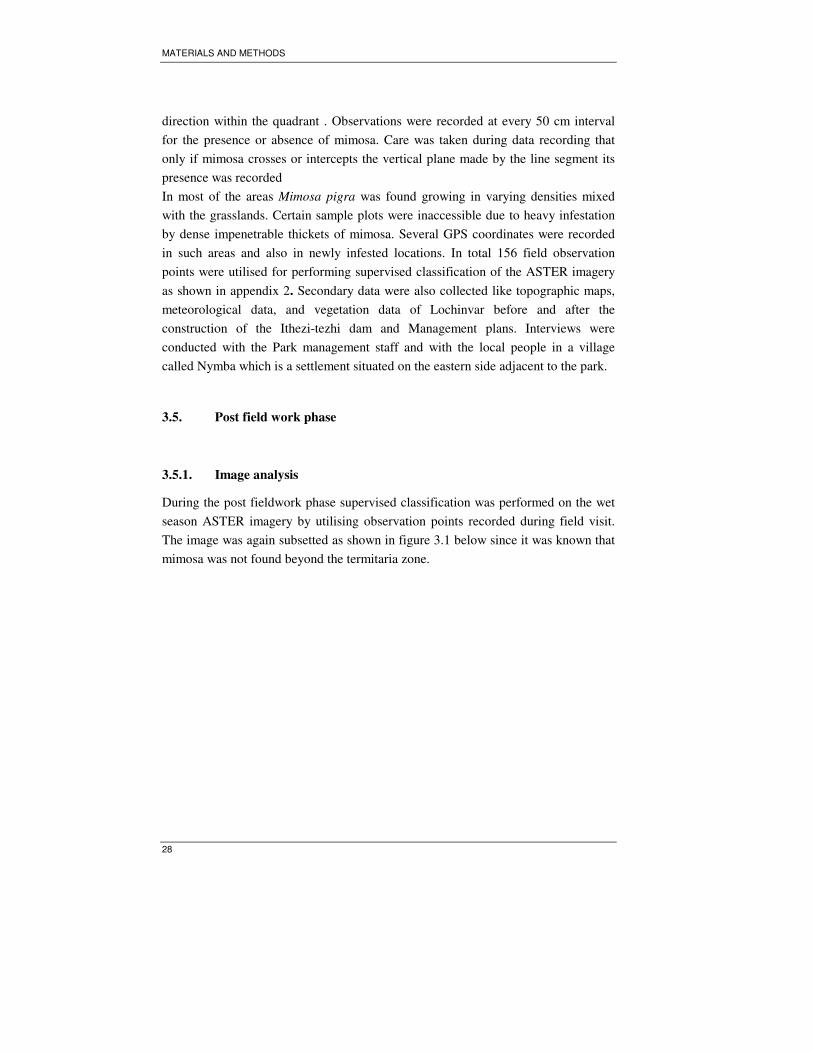
MATERIALS AND METHODS
28
direction within the quadrant . Observations were recorded at every 50 cm interval
for the presence or absence of mimosa. Care was taken during data recording that
only if mimosa crosses or intercepts the vertical plane made by the line segment its
presence was recorded
In most of the areas Mimosa pigra was found growing in varying densities mixed
with the grasslands. Certain sample plots were inaccessible due to heavy infestation
by dense impenetrable thickets of mimosa. Several GPS coordinates were recorded
in such areas and also in newly infested locations. In total 156 field observation
points were utilised for performing supervised classification of the ASTER imagery
as shown in appendix 2. Secondary data were also collected like topographic maps,
meteorological data, and vegetation data of Lochinvar before and after the
construction of the Ithezi-tezhi dam and Management plans. Interviews were
conducted with the Park management staff and with the local people in a village
called Nymba which is a settlement situated on the eastern side adjacent to the park.
3.5. Post field work phase
3.5.1. Image analysis
During the post fieldwork phase supervised classification was performed on the wet
season ASTER imagery by utilising observation points recorded during field visit.
The image was again subsetted as shown in figure 3.1 below since it was known that
mimosa was not found beyond the termitaria zone.
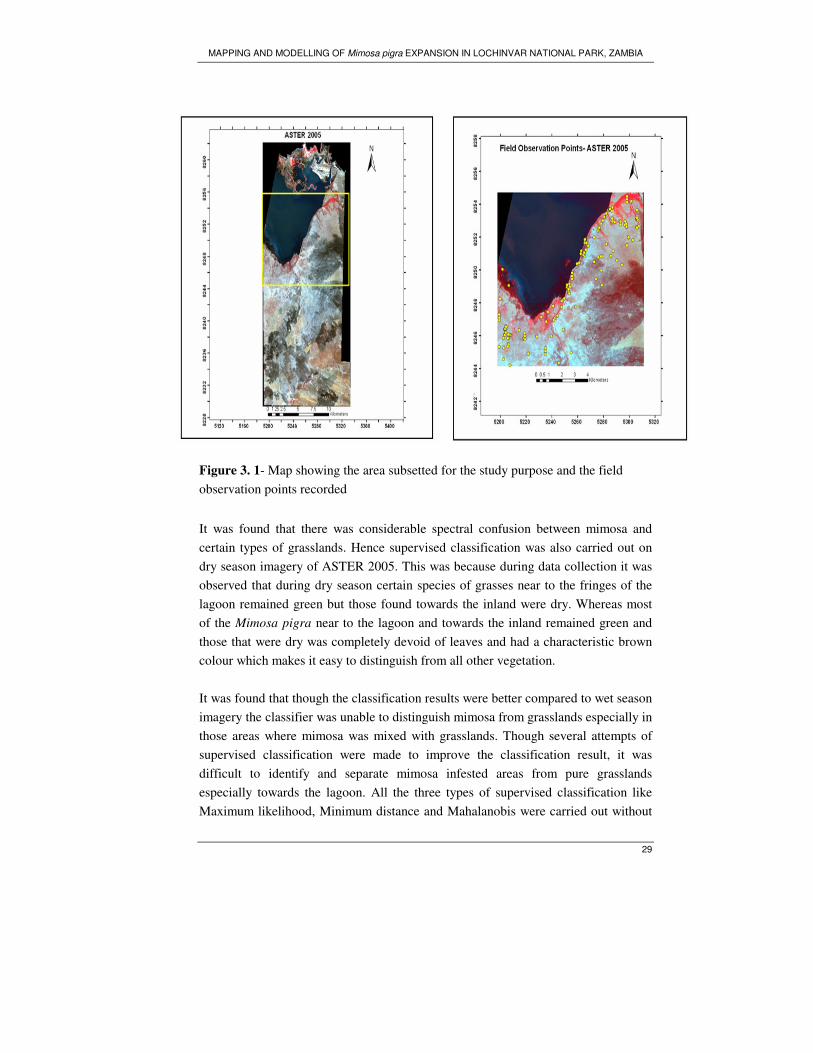
MAPPING AND MODELLING OF Mimosa pigra EXPANSION IN LOCHINVAR NATIONAL PARK, ZAMBIA
29
Figure 3. 1- Map showing the area subsetted for the study purpose and the field
observation points recorded
It was found that there was considerable spectral confusion between mimosa and
certain types of grasslands. Hence supervised classification was also carried out on
dry season imagery of ASTER 2005. This was because during data collection it was
observed that during dry season certain species of grasses near to the fringes of the
lagoon remained green but those found towards the inland were dry. Whereas most
of the Mimosa pigra near to the lagoon and towards the inland remained green and
those that were dry was completely devoid of leaves and had a characteristic brown
colour which makes it easy to distinguish from all other vegetation.
It was found that though the classification results were better compared to wet season
imagery the classifier was unable to distinguish mimosa from grasslands especially in
those areas where mimosa was mixed with grasslands. Though several attempts of
supervised classification were made to improve the classification result, it was
difficult to identify and separate mimosa infested areas from pure grasslands
especially towards the lagoon. All the three types of supervised classification like
Maximum likelihood, Minimum distance and Mahalanobis were carried out without
MATERIALS AND METHODS
30
significant improvement in the results. The overall accuracy was found to be 64%,
60% and 52%. The accuracy for class mimosa was 55%, 58% and 50%.
Attempts were made to improve the classification results by generating the textural
properties of the various vegetation cover. Texture is the frequency of tonal change
in an image. It determines the overall visual smoothness or coarseness of the image
features. An interpreter can often distinguish the between features with similar
reflectances based on their texture differences (Lillesand & Keifer, 1979). Much
information is contained in the relationship between adjacent pixels, including
texture and shape information, which allows for identification of individual objects
as opposed to single pixels (Thomas et al., 2003). Such an object-oriented approach
allows the user to apply locally different strategies for analysis. The use of texture in
addition to spectral features for image classification might be expected to result in
some level of accuracy improvement, depending on the spatial resolution of the
sensor and the size of the homogenous area being classified (Mather, 1998). The
objective for texture classification is to extract the intrinsic features for textures in a
few parameters and then design a classifier to use these parameters as features to
classify the textures (Campbell, 2002).
The textural properties extracted were mean, variance, homogeneity, contrast,
dissimilarity; entropy, second moment, and correlation were generated using ENVI.
Several attempts were made to classify the images based on these properties and
their combinations; there was no considerable improvement in the results. Though it
was possible to identify some new patches of mimosa infested areas most of the areas
still remained unidentified. This is because if the spatial resolution of the image is
fine relative to the scale of tonal variation, texture can be a valuable source of
discriminating information. Conversely where the homogenous regions in the image
are small it may prove difficult to estimate texture, for texture is a property of an area
rather than a point. Moreover the area over which texture is measured contains two
or more different regions or categories then the texture measures may not prove to be
useful (Mather, 1998). The area occupied by dense mimosa (areas more
homogeneous) is small, the only two patches found along the Nampongwe stream on
the western side and Mainda channel on the eastern side (figure3.1). Thus attempts to
classify based on pure textural measures were not successful.
NDVI is one of the most widely used vegetation indexes and its utility in satellite
assessment and monitoring of global vegetation cover has been well demonstrated
over the past two decades (Leprieur et al., 2000). NDVI has more advantages in
MAPPING AND MODELLING OF Mimosa pigra EXPANSION IN LOCHINVAR NATIONAL PARK, ZAMBIA
31
representing surface vegetation coverage and revealing vegetation green. It also can
quantitatively or qualitatively represent vegetation activity, and it is more sensitive to
detect green vegetation by single band (Zhang et al., 2003). NDVI was calculated for
the whole image.First the at sensor radiances were converted to radiances and then
the radiances were converted to reflectances. The standard equations of ASTER and
LANDSAT were used for conversion purposes.
It was noticed that during dry season there was considerable burning in the eastern
side of the park. The extent of burned area was different in all the three images. It
was found that among them ASTER had the most extensive burned area. Moreover
since ASTER 2005 imagery was used for field work the extent of burned area was
known. Hence it was decided to digitize the burned area, mask it and assign it a
separate class called burned areas. This mask was also applied to the to the other
images because if an area is burned in one year there cannot be any land cover
change detected for that area in the next image. During field work sampling points
were assigned to this area it was seen that there was no mimosa found here and these
areas comprised of only burned grasslands and shrubs.
3.5.2. Supervised classification
Maximum Likelihood classification was performed in ASTER 2005 dry season
imagery. This technique was chosen because it uses the mean values and covariance
matrix of the classes to assign each pixel to the class with the highest probability
thus, gives a reliable result (Lillesand & Keifer, 1979). It assumes that the statistics
for each band are normally distributed. As mentioned earlier this imagery comprised
of stacked layers of NDVI, VNIR and SWIR and textural properties. Similarly for
1984 and 1994 images classification was carried out based on signatures extracted
through visual interpretation and vegetation maps.
Since in 1984 and 1994 images, certain classes like dense mimosa and shrubs could
not be detected, a single pixel was assigned representing each of these classes to the
burned area. By doing this Idrisi Andes calculates the change in the area statistics
experienced by each of the cover classes in the multitemporal series. So if a
particular class is completely absent and remains unrepresented in any one of the
land cover images it would not be possible to determine how many pixels have
changed for that particular class from the previous to the next land cover image.
Thus single pixels representing dense mimosa and shrubs classes were assigned for
both the LANDSAT images on exactly the same geographic coordinates using the
MATERIALS AND METHODS
32
modeler function in ERDAS. All the three images were recoded and given exactly
the same class names and numbers. The various classes that could be distinguished
were.
Class 1 - Water or WAT –This class represents the water body mainly the Chunga
lagoon and the streams
Class 2 - Grasslands or GRA- This class represents the areas with pure grasslands
that are not mixed with mimosa
Class 3 - Open mimosa or MIMGRA- This class represents the areas where
mimosa is found in varying densities and extents mixed with grasslands. Mimosa in
this area can be either found as thick patches of few plants, or sparsely populated or
thinly populated with few plants. These areas have been previously occupied by
pure grasslands but now have mimosa invading into it.
Class 4 - Burned areas or BURN – These areas represents the grasslands which are
burned every year during dry season by the local people.
Class 5 - Shrubs or SHR – This class represents the other encroachers like Acacia
sps, Dichrostachys cinerairia etc.
Class 6 - Dense mimosa or MIM- This class represents the areas with very dense
impenetrable thickets of mimosa.
Accuracy assessment was carried out for ASTER imagery using 43 validation points
that were collected during the fieldwork. The overall accuracy, producer and users
accuracy was calculated using confusion matrix. Kappa statistics was also calculated
to have an idea of magnitude of chance agreements in classification.
3.6. Change detection
3.6.1. Land Change Modeler
Land Change Modeler for ecological sustainability is an integrated software
environment developed by Idrisi 15 Andes version for analysing land cover change
given there are two land cover maps have identical legends (same code for each
class). The change analysis panel provides a rapid quantitative assessment of change
by graphing gains and losses by land cover categories. A second option, net change,
shows the result of taking the earlier land cover areas, adding the gains and then
subtracting the losses. The third option is to examine the contributions to changes
experienced by single land cover (Idrisi, 2006). The Change analysis was performed
MAPPING AND MODELLING OF Mimosa pigra EXPANSION IN LOCHINVAR NATIONAL PARK, ZAMBIA
33
between pairs of images 1984 -94, 94-2005 and 84-2005. Accordingly the transitions
and exchanges that took place between the various classes during the years were
obtained both in a map and graphical form. All the units were changed to hectares.
Transitions below 0.1 ha were ignored.
Cross classification find its most common application in land cover change analysis
where a cross tabulation or a cross correlation is done between two qualitative maps
of two different dates that targets on the same features (Idrisi, 2005). It is used to
compare two classified images where the classification assigns the same unique and
distinct identifier to each class on both the dates. The aim is to evaluate the whether
areas fall into the same class on the two dates or whether a change to a new class has
occurred. In Andes edition by running a CROSSTAB module we get a new image
based on all the unique combination of values from the two images in which each
unique combination of input values has a unique output value and a cross tabulation
table. The cross tabulation matrix that shows the distribution of image cells between
the classes. The categories of date 1 are displayed on the X axis while in Y-axis
displays the same categories at date 2. The cross tabulation shows the frequencies
with which classes have remained the same (those along the diagonal) or have
changed (off –diagonal frequencies). Cross correlation images show all possible
combinations that can be used to produce two types of change images. These relative
frequencies are known as transition probabilities and are an underlying basis for
Markov Chain prediction of future transitions.
3.7. Markov Chain Model
In this study using the classified multitemporal images, a Markov module was
performed in Idrisi Andes to predict the changes of the land cover in the study area
in the future. The following output was obtained:
1) A transition probability matrix – This is automatically displayed and it expresses
the likelihood that a pixel of a given class will change to any other class (or stay the
same) in the next time period.
2) A transition area matrix – This expresses the total area (in ha) expected to change
in the next time period
3) A set of conditional probability images – one for each land cover class. These
maps express the probability that each pixel will belong to the designated class in the
MATERIALS AND METHODS
34
next time period. They are called conditional probability maps since this probability
is conditional on their current state.
The results from the cross classification proved that there has been aggregate
changes in proportions of land cover over the period from 1984-2005 but whether or
not this can be attributed to a Markov process is what the analysis will attempt to
determine. The reasonable way to proceed is to test first for independence against the
alternatives and to then test for first order markovian dependence (Bell, 1974). The
only other inference that can be done with data from three points involves a test of
stationarity of the transition probabilities, once the first order Markov model has
been accepted (Bell, 1974).
The demonstration of stationarity while crucial to the use of this technique goes
beyond the scope of this research since it involves lot of mathematical computations.
At first the output results from the cross classification of 1984 -94 images were used
to test for the hypothesis of independence. The testing of statistical independence
involves a procedure for comparing the expected numbers under the hypothesis to
the actual numbers (Weng, 2002). If the number of land cover categories is M, then
the statistic to be computed is Karl Pearsons χ2 with (M-1)
2 degrees of freedom. This
statistic was called K2 to differentiate it from its distribution (χ
2). If Nijk stands for the
number of cells having first use category i and subsequent uses j and k in later time
periods we define N..k as the number of cells in use k at the last time ( 2005). N.j. as
the number in use j at the previous time (1994), and Ni. as the number in use i at the
earliest time (1984). Under the hypothesis of independence the proportion of the
total number of cells N in use succession (i, j, k) is the product of proportions ;( Ni.. /
N) x (N.j./N) x (N...k/N) and the expected number is this product times the total
number of cells N. If we call the expected numbers Nijk and the observed numbers
Nijk .Then the statistic to be computed is
K2=ΣiΣjΣk(Nijk-Nijk)
2/Nijk………………………………………………………………………………….eqn 6
The 0.05 critical region for M=6 is thus any value of K2
greater than 179.6. Any
computed value of less than this critical number will lead to conclusion that the data
are compatible with hypothesis of independence. This test of independence was also
done for the land cover maps between 1994 -2005 using the same formula but
replacing i and j with j and k respectively. Accordingly it was proved that the
computed value was greater than this critical number hence the hypothesis of
MAPPING AND MODELLING OF Mimosa pigra EXPANSION IN LOCHINVAR NATIONAL PARK, ZAMBIA
35
independence was rejected which means that the two land cover maps are highly
dependent.
The alternative to independence is dependence of any sort, including markov chain
as but one of many alternatives. A reasonable way to proceed is to, is to test for the
first order Markovian dependence (Bell, 1974). In order to establish the validity of
Markovian property, it is necessary to use a chi square goodness-of-fit test. The
observed data for use in computation of the test statistic are the number of hectare
cells that changed during 1984 -2005 which can be obtained from the cross
tabulation of 1984-2005 image. According to the Markovian hypothesis the expected
number can be obtained by the following procedure. If the process is markovian the
transition probability matrix governing the period 1984-2005 can be obtained by
multiplying the 1984-94 and 1994-2005 matrices which is a direct application of
Chapman – Kolmogorov equation (Stewart, 1994). These transition probabilities are
used in the following formula to compute the expected numbers
Nijk=Σj (Nij. )(N.jk)/N.j………………………………………………………………………………………. eqn 7
Where:
Nij. is the number of transitions from category i to j during the period 1984
to 1994
N.jk is the number of transitions from category j to k during the period
1994 to 2005; and
N.j. is the number of hectares cells in category j in 1994
If Nijk stand for the number of cells having a category i in 1984 j in1994and k in
2005, and Nijk for the expected number then K2 can be computed for goodness of fit
of the Markov hypothesis.
As mentioned earlier the test for stationarity was not performed since it’s beyond the
scope of the study. However it was proved after computation from the above results
that the process is not stationary. The stationarity assumption means that the changes
recorded from the 1984-94 and 1994-2005 result from the same transition
mechanism.
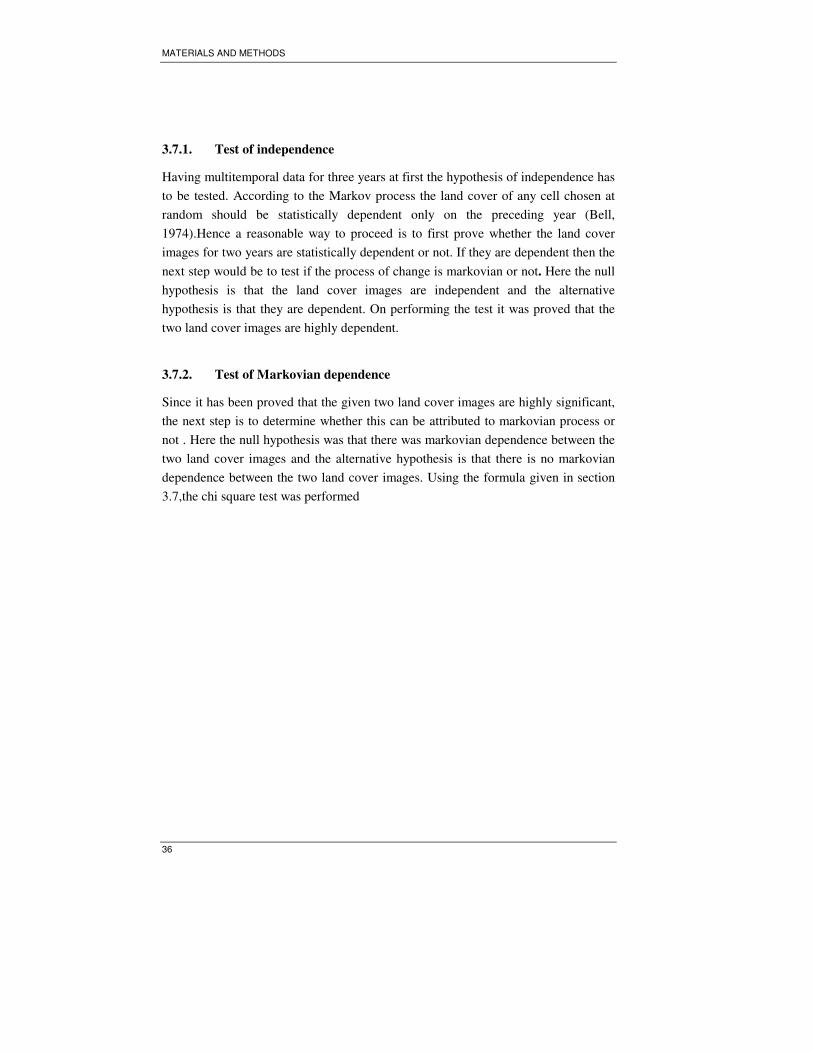
MATERIALS AND METHODS
36
3.7.1. Test of independence
Having multitemporal data for three years at first the hypothesis of independence has
to be tested. According to the Markov process the land cover of any cell chosen at
random should be statistically dependent only on the preceding year (Bell,
1974).Hence a reasonable way to proceed is to first prove whether the land cover
images for two years are statistically dependent or not. If they are dependent then the
next step would be to test if the process of change is markovian or not. Here the null
hypothesis is that the land cover images are independent and the alternative
hypothesis is that they are dependent. On performing the test it was proved that the
two land cover images are highly dependent.
3.7.2. Test of Markovian dependence
Since it has been proved that the given two land cover images are highly significant,
the next step is to determine whether this can be attributed to markovian process or
not . Here the null hypothesis was that there was markovian dependence between the
two land cover images and the alternative hypothesis is that there is no markovian
dependence between the two land cover images. Using the formula given in section
3.7,the chi square test was performed
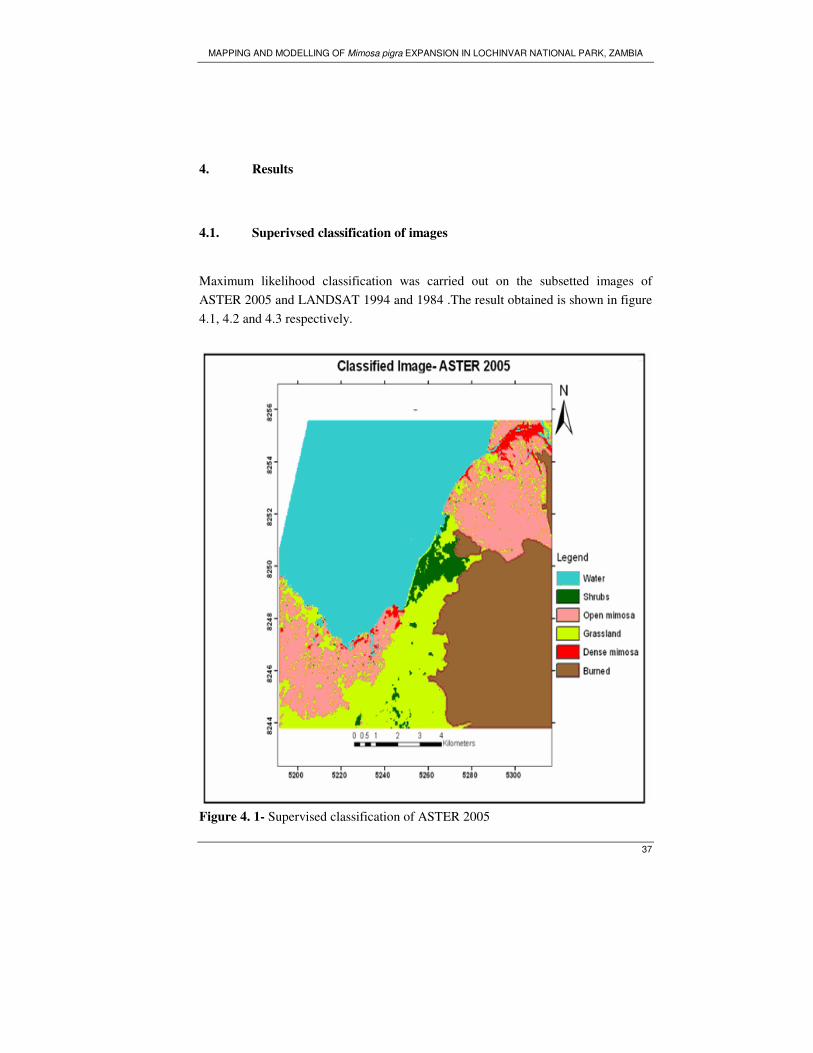
MAPPING AND MODELLING OF Mimosa pigra EXPANSION IN LOCHINVAR NATIONAL PARK, ZAMBIA
37
4. Results
4.1. Superivsed classification of images
Maximum likelihood classification was carried out on the subsetted images of
ASTER 2005 and LANDSAT 1994 and 1984 .The result obtained is shown in figure
4.1, 4.2 and 4.3 respectively.
Figure 4. 1- Supervised classification of ASTER 2005
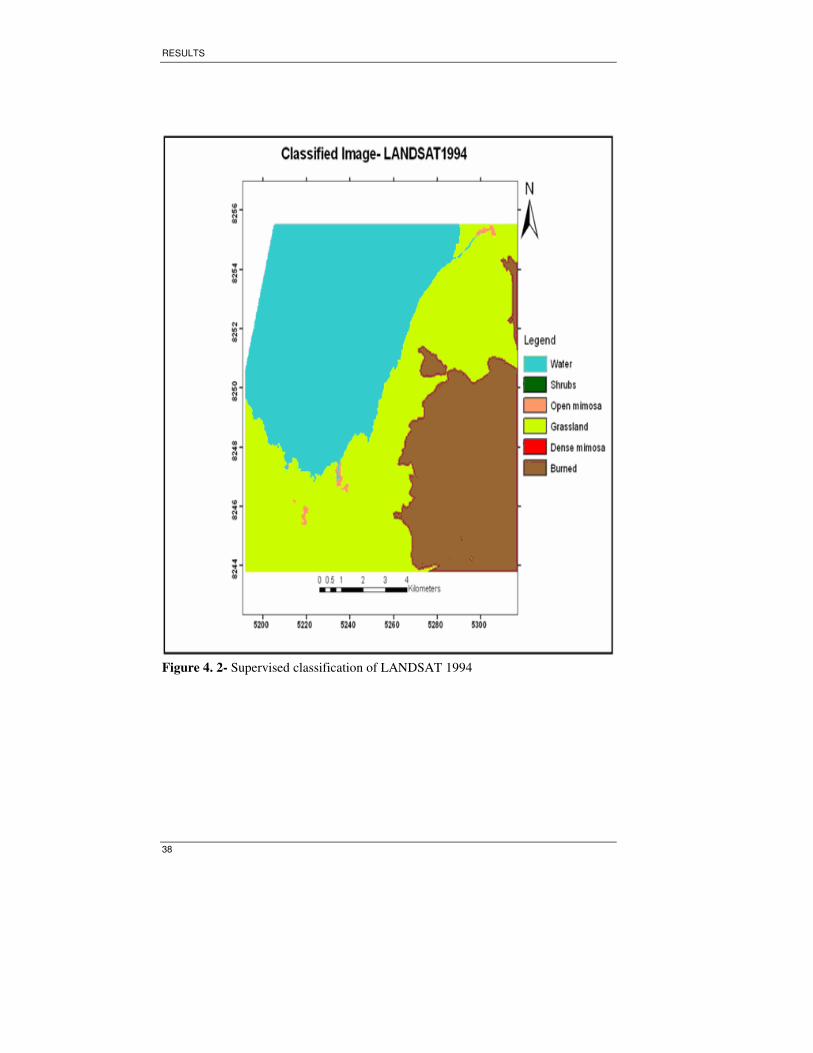
RESULTS
38
Figure 4. 2- Supervised classification of LANDSAT 1994
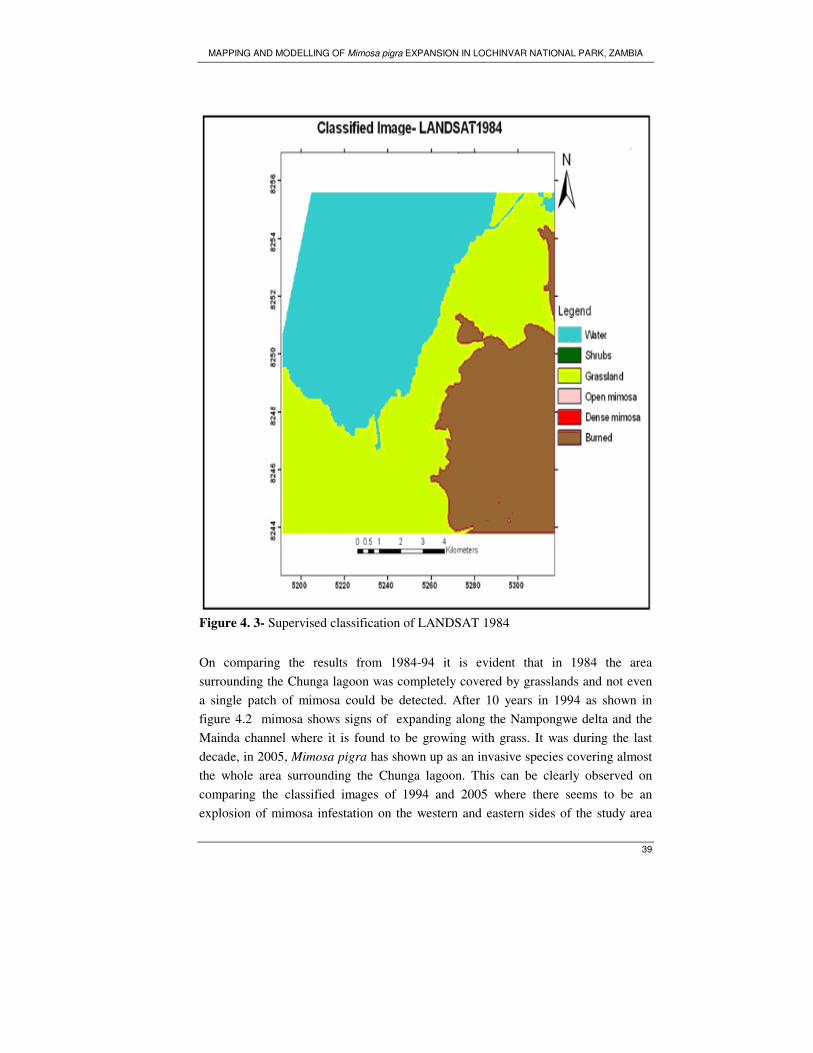
MAPPING AND MODELLING OF Mimosa pigra EXPANSION IN LOCHINVAR NATIONAL PARK, ZAMBIA
39
Figure 4. 3- Supervised classification of LANDSAT 1984
On comparing the results from 1984-94 it is evident that in 1984 the area
surrounding the Chunga lagoon was completely covered by grasslands and not even
a single patch of mimosa could be detected. After 10 years in 1994 as shown in
figure 4.2 mimosa shows signs of expanding along the Nampongwe delta and the
Mainda channel where it is found to be growing with grass. It was during the last
decade, in 2005, Mimosa pigra has shown up as an invasive species covering almost
the whole area surrounding the Chunga lagoon. This can be clearly observed on
comparing the classified images of 1994 and 2005 where there seems to be an
explosion of mimosa infestation on the western and eastern sides of the study area
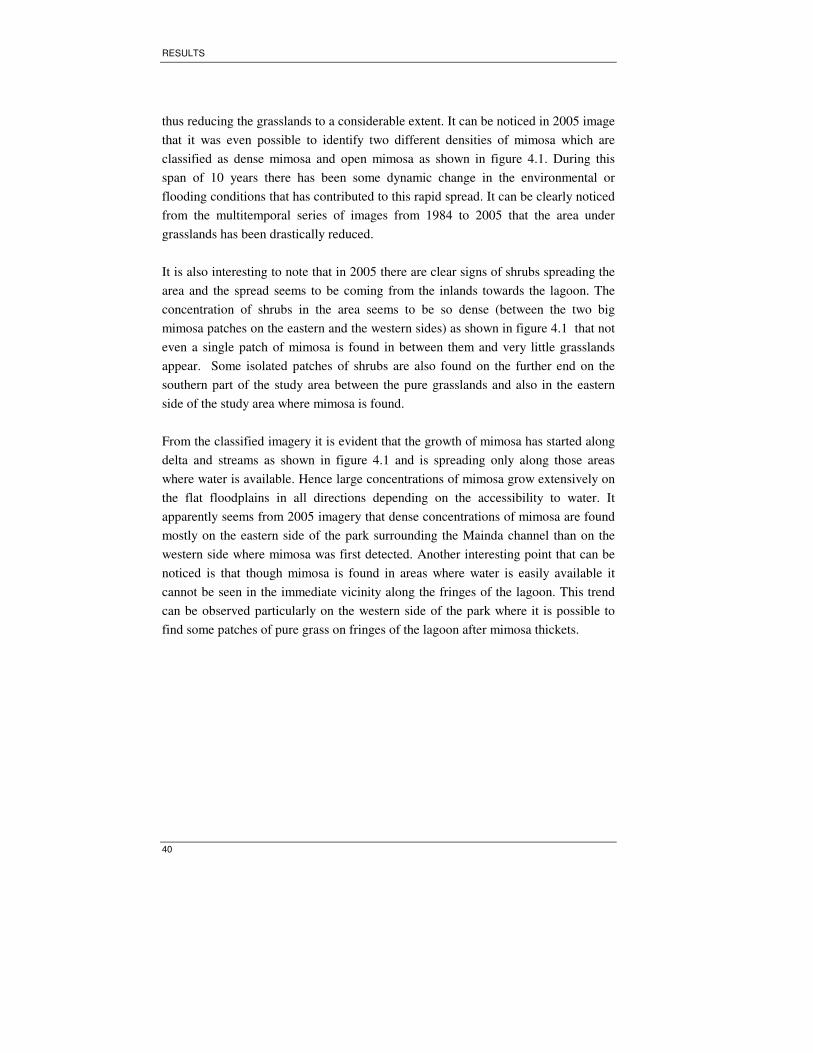
RESULTS
40
thus reducing the grasslands to a considerable extent. It can be noticed in 2005 image
that it was even possible to identify two different densities of mimosa which are
classified as dense mimosa and open mimosa as shown in figure 4.1. During this
span of 10 years there has been some dynamic change in the environmental or
flooding conditions that has contributed to this rapid spread. It can be clearly noticed
from the multitemporal series of images from 1984 to 2005 that the area under
grasslands has been drastically reduced.
It is also interesting to note that in 2005 there are clear signs of shrubs spreading the
area and the spread seems to be coming from the inlands towards the lagoon. The
concentration of shrubs in the area seems to be so dense (between the two big
mimosa patches on the eastern and the western sides) as shown in figure 4.1 that not
even a single patch of mimosa is found in between them and very little grasslands
appear. Some isolated patches of shrubs are also found on the further end on the
southern part of the study area between the pure grasslands and also in the eastern
side of the study area where mimosa is found.
From the classified imagery it is evident that the growth of mimosa has started along
delta and streams as shown in figure 4.1 and is spreading only along those areas
where water is available. Hence large concentrations of mimosa grow extensively on
the flat floodplains in all directions depending on the accessibility to water. It
apparently seems from 2005 imagery that dense concentrations of mimosa are found
mostly on the eastern side of the park surrounding the Mainda channel than on the
western side where mimosa was first detected. Another interesting point that can be
noticed is that though mimosa is found in areas where water is easily available it
cannot be seen in the immediate vicinity along the fringes of the lagoon. This trend
can be observed particularly on the western side of the park where it is possible to
find some patches of pure grass on fringes of the lagoon after mimosa thickets.
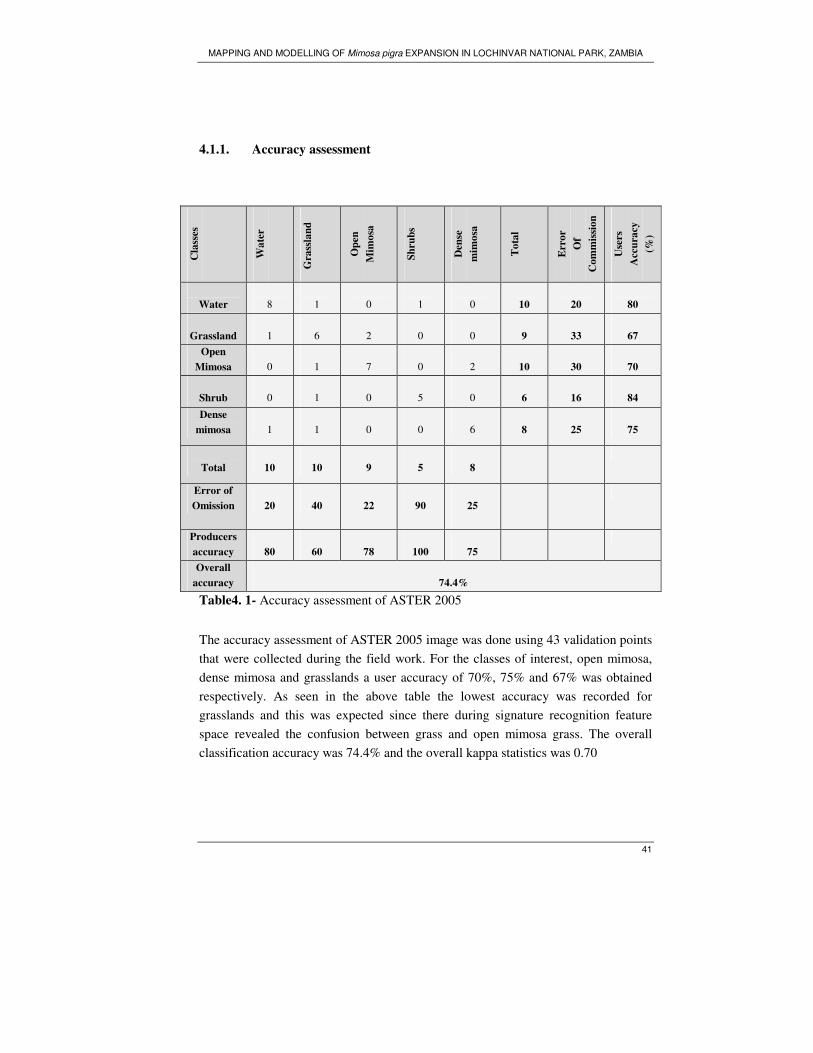
MAPPING AND MODELLING OF Mimosa pigra EXPANSION IN LOCHINVAR NATIONAL PARK, ZAMBIA
41
4.1.1. Accuracy assessment
C
lass
es
Wa
ter
Gra
ssla
nd
Op
en
Mim
osa
Sh
rub
s
Den
se
mim
osa
To
tal
Err
or
Of
Co
mm
issi
on
Use
rs
Acc
ura
cy
(%)
Water
8
1
0
1
0
10
20
80
Grassland
1
6
2
0
0
9
33
67
Open
Mimosa
0
1
7
0
2
10
30
70
Shrub
0
1
0
5
0
6
16
84
Dense
mimosa
1
1
0
0
6
8
25
75
Total
10
10
9
5
8
Error of
Omission
20
40
22
90
25
Producers
accuracy
80
60
78
100
75
Overall
accuracy
74.4%
Table4. 1- Accuracy assessment of ASTER 2005
The accuracy assessment of ASTER 2005 image was done using 43 validation points
that were collected during the field work. For the classes of interest, open mimosa,
dense mimosa and grasslands a user accuracy of 70%, 75% and 67% was obtained
respectively. As seen in the above table the lowest accuracy was recorded for
grasslands and this was expected since there during signature recognition feature
space revealed the confusion between grass and open mimosa grass. The overall
classification accuracy was 74.4% and the overall kappa statistics was 0.70
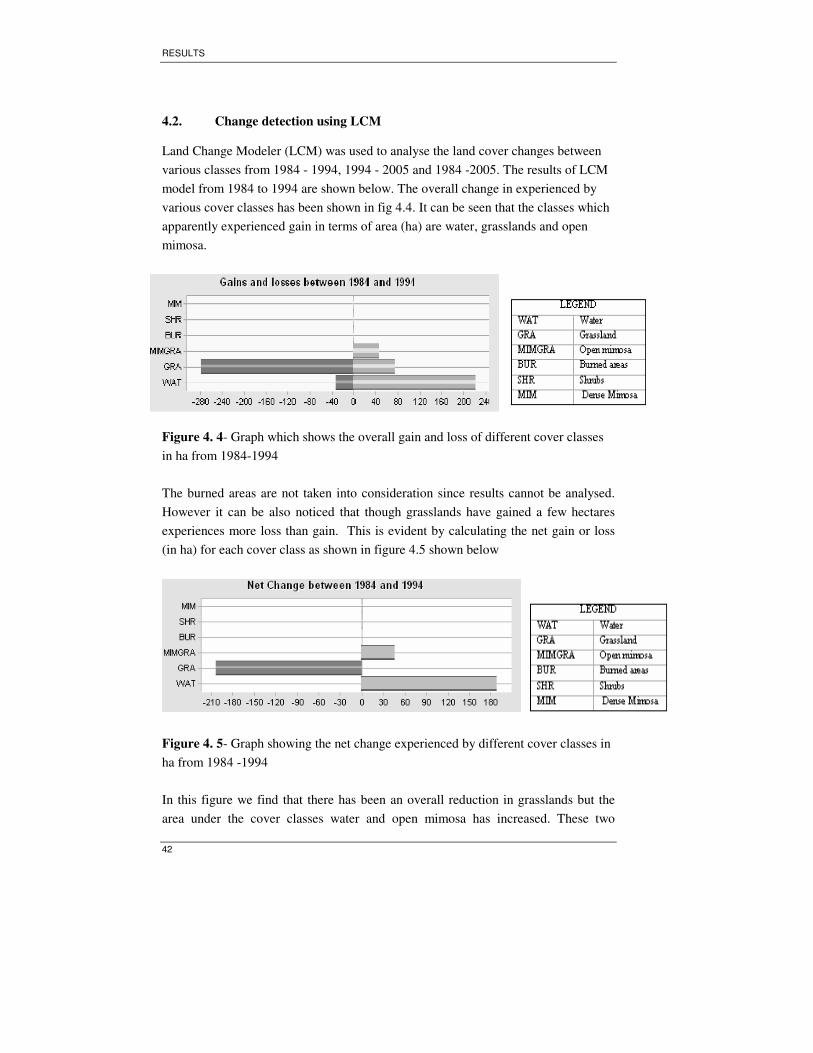
RESULTS
42
4.2. Change detection using LCM
Land Change Modeler (LCM) was used to analyse the land cover changes between
various classes from 1984 - 1994, 1994 - 2005 and 1984 -2005. The results of LCM
model from 1984 to 1994 are shown below. The overall change in experienced by
various cover classes has been shown in fig 4.4. It can be seen that the classes which
apparently experienced gain in terms of area (ha) are water, grasslands and open
mimosa.
Figure 4. 4- Graph which shows the overall gain and loss of different cover classes
in ha from 1984-1994
The burned areas are not taken into consideration since results cannot be analysed.
However it can be also noticed that though grasslands have gained a few hectares
experiences more loss than gain. This is evident by calculating the net gain or loss
(in ha) for each cover class as shown in figure 4.5 shown below
Figure 4. 5- Graph showing the net change experienced by different cover classes in
ha from 1984 -1994
In this figure we find that there has been an overall reduction in grasslands but the
area under the cover classes water and open mimosa has increased. These two
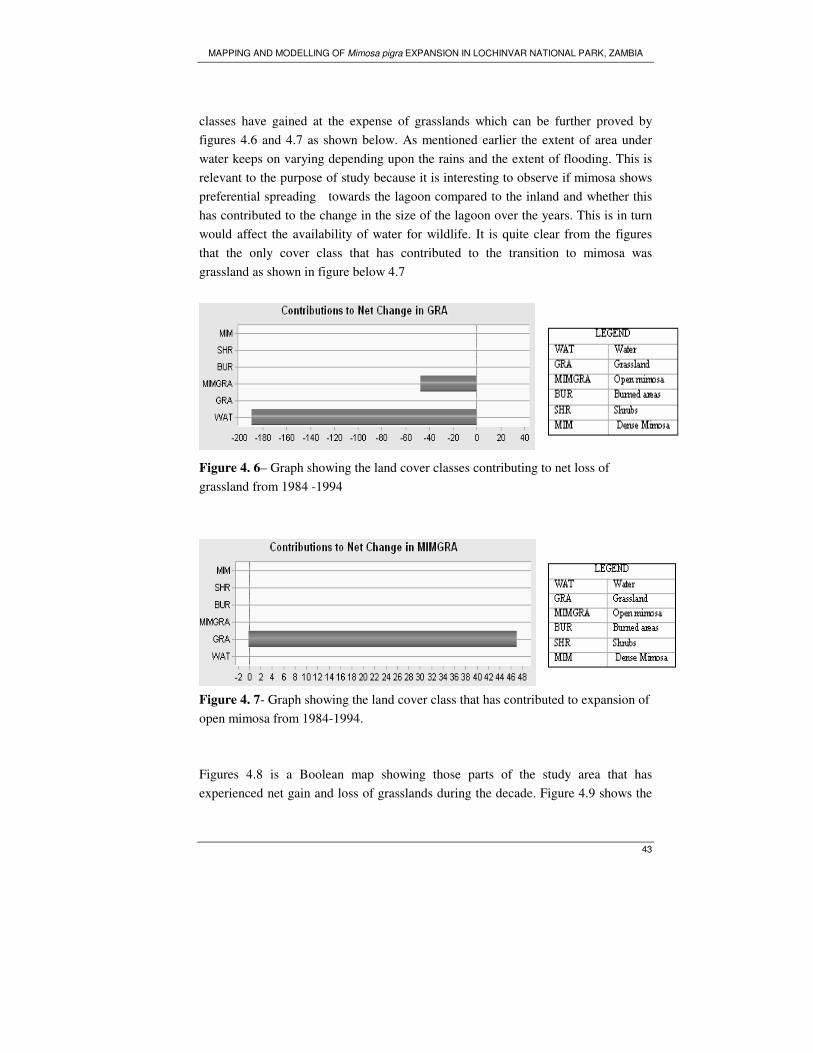
MAPPING AND MODELLING OF Mimosa pigra EXPANSION IN LOCHINVAR NATIONAL PARK, ZAMBIA
43
classes have gained at the expense of grasslands which can be further proved by
figures 4.6 and 4.7 as shown below. As mentioned earlier the extent of area under
water keeps on varying depending upon the rains and the extent of flooding. This is
relevant to the purpose of study because it is interesting to observe if mimosa shows
preferential spreading towards the lagoon compared to the inland and whether this
has contributed to the change in the size of the lagoon over the years. This is in turn
would affect the availability of water for wildlife. It is quite clear from the figures
that the only cover class that has contributed to the transition to mimosa was
grassland as shown in figure below 4.7
Figure 4. 6– Graph showing the land cover classes contributing to net loss of
grassland from 1984 -1994
Figure 4. 7- Graph showing the land cover class that has contributed to expansion of
open mimosa from 1984-1994.
Figures 4.8 is a Boolean map showing those parts of the study area that has
experienced net gain and loss of grasslands during the decade. Figure 4.9 shows the
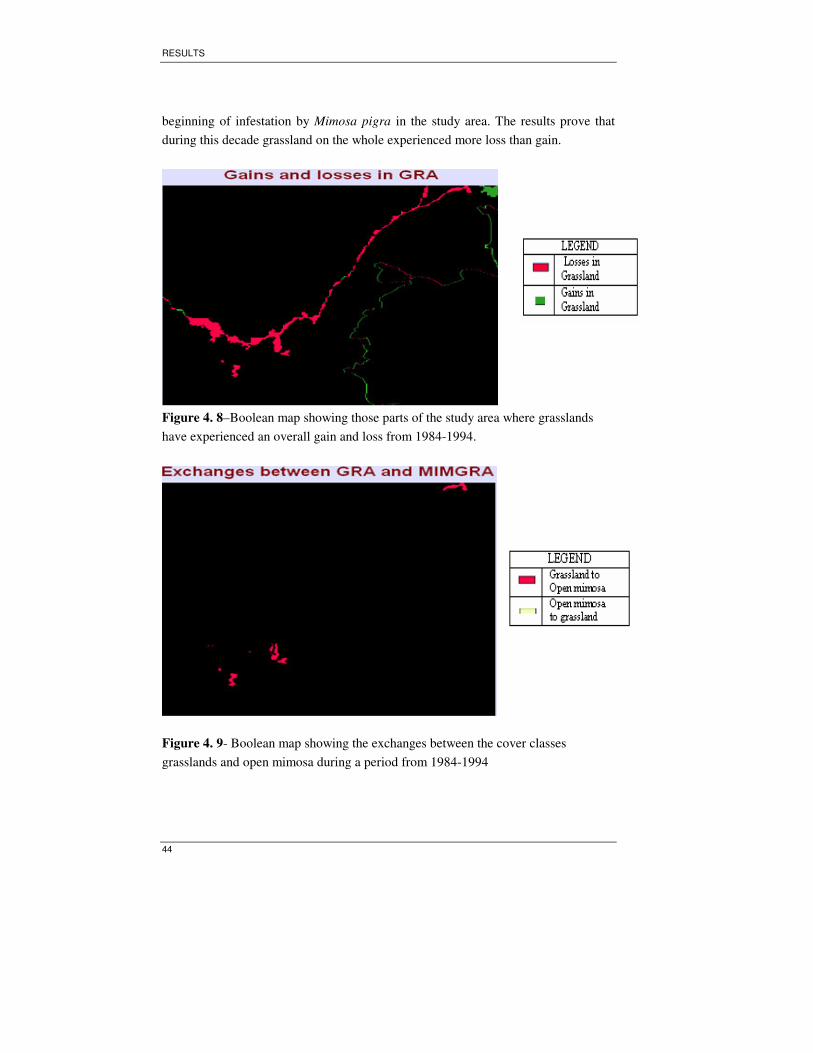
RESULTS
44
beginning of infestation by Mimosa pigra in the study area. The results prove that
during this decade grassland on the whole experienced more loss than gain.
Figure 4. 8–Boolean map showing those parts of the study area where grasslands
have experienced an overall gain and loss from 1984-1994.
Figure 4. 9- Boolean map showing the exchanges between the cover classes
grasslands and open mimosa during a period from 1984-1994
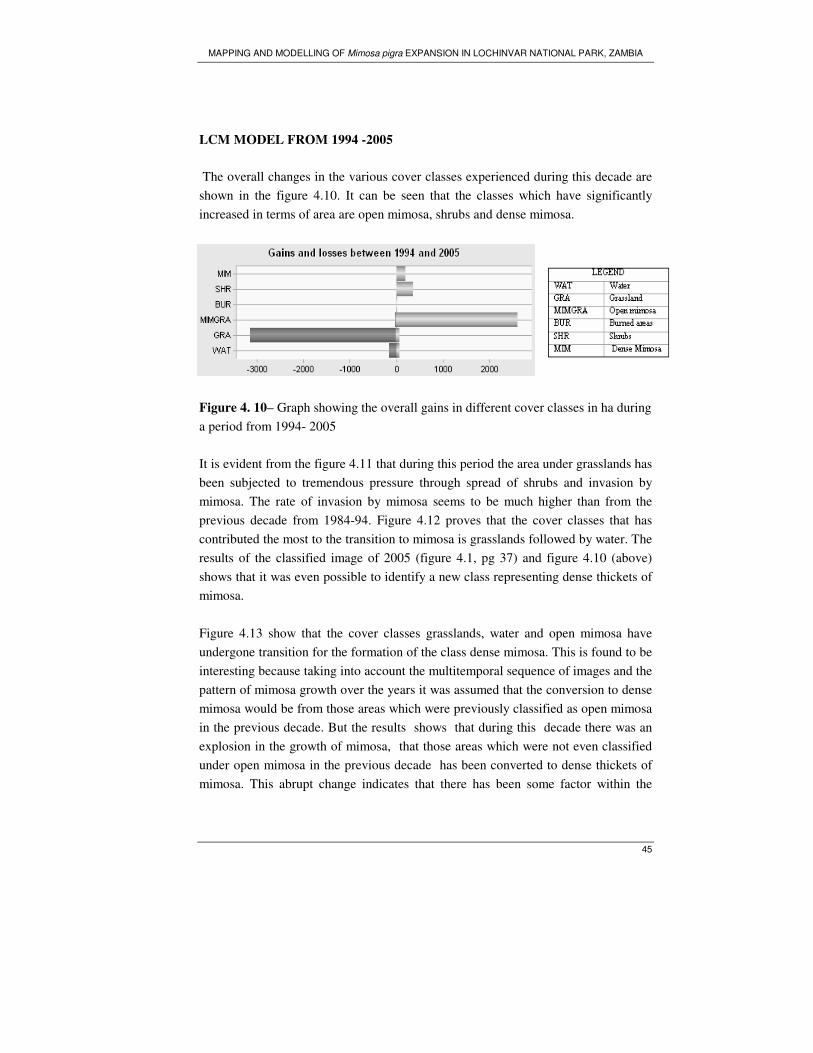
MAPPING AND MODELLING OF Mimosa pigra EXPANSION IN LOCHINVAR NATIONAL PARK, ZAMBIA
45
LCM MODEL FROM 1994 -2005
The overall changes in the various cover classes experienced during this decade are
shown in the figure 4.10. It can be seen that the classes which have significantly
increased in terms of area are open mimosa, shrubs and dense mimosa.
Figure 4. 10– Graph showing the overall gains in different cover classes in ha during
a period from 1994- 2005
It is evident from the figure 4.11 that during this period the area under grasslands has
been subjected to tremendous pressure through spread of shrubs and invasion by
mimosa. The rate of invasion by mimosa seems to be much higher than from the
previous decade from 1984-94. Figure 4.12 proves that the cover classes that has
contributed the most to the transition to mimosa is grasslands followed by water. The
results of the classified image of 2005 (figure 4.1, pg 37) and figure 4.10 (above)
shows that it was even possible to identify a new class representing dense thickets of
mimosa.
Figure 4.13 show that the cover classes grasslands, water and open mimosa have
undergone transition for the formation of the class dense mimosa. This is found to be
interesting because taking into account the multitemporal sequence of images and the
pattern of mimosa growth over the years it was assumed that the conversion to dense
mimosa would be from those areas which were previously classified as open mimosa
in the previous decade. But the results shows that during this decade there was an
explosion in the growth of mimosa, that those areas which were not even classified
under open mimosa in the previous decade has been converted to dense thickets of
mimosa. This abrupt change indicates that there has been some factor within the
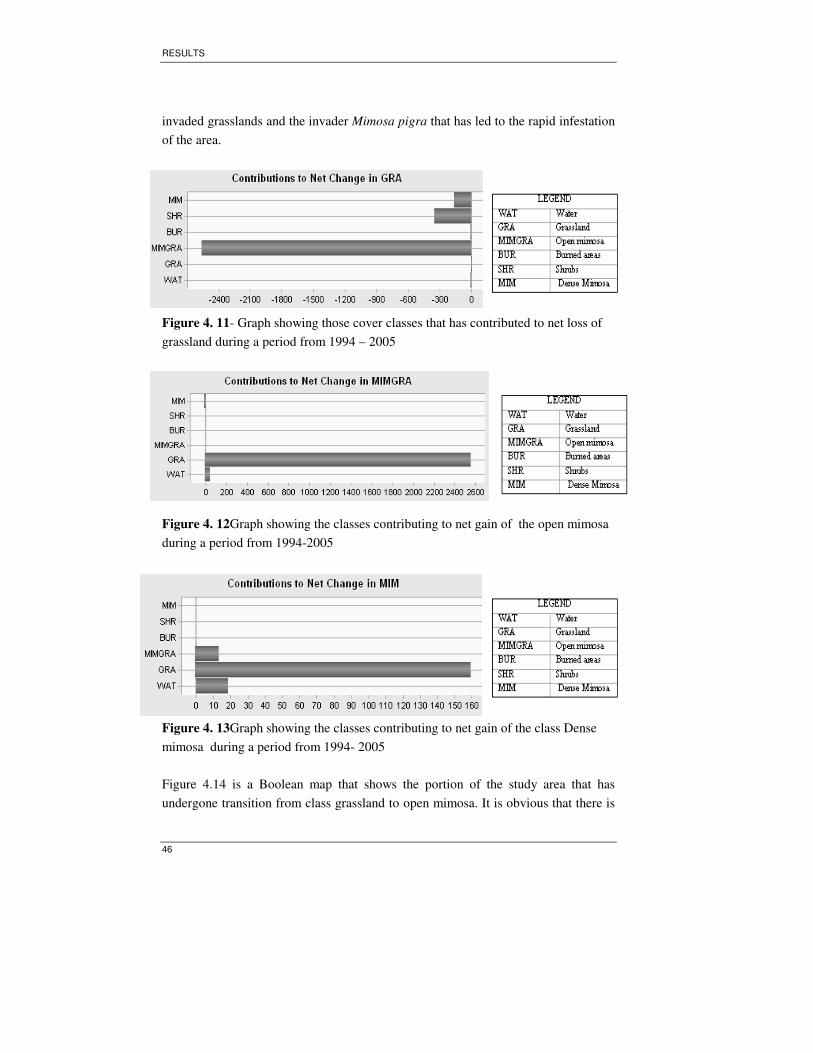
RESULTS
46
invaded grasslands and the invader Mimosa pigra that has led to the rapid infestation
of the area.
Figure 4. 11- Graph showing those cover classes that has contributed to net loss of
grassland during a period from 1994 – 2005
Figure 4. 12Graph showing the classes contributing to net gain of the open mimosa
during a period from 1994-2005
Figure 4. 13Graph showing the classes contributing to net gain of the class Dense
mimosa during a period from 1994- 2005
Figure 4.14 is a Boolean map that shows the portion of the study area that has
undergone transition from class grassland to open mimosa. It is obvious that there is
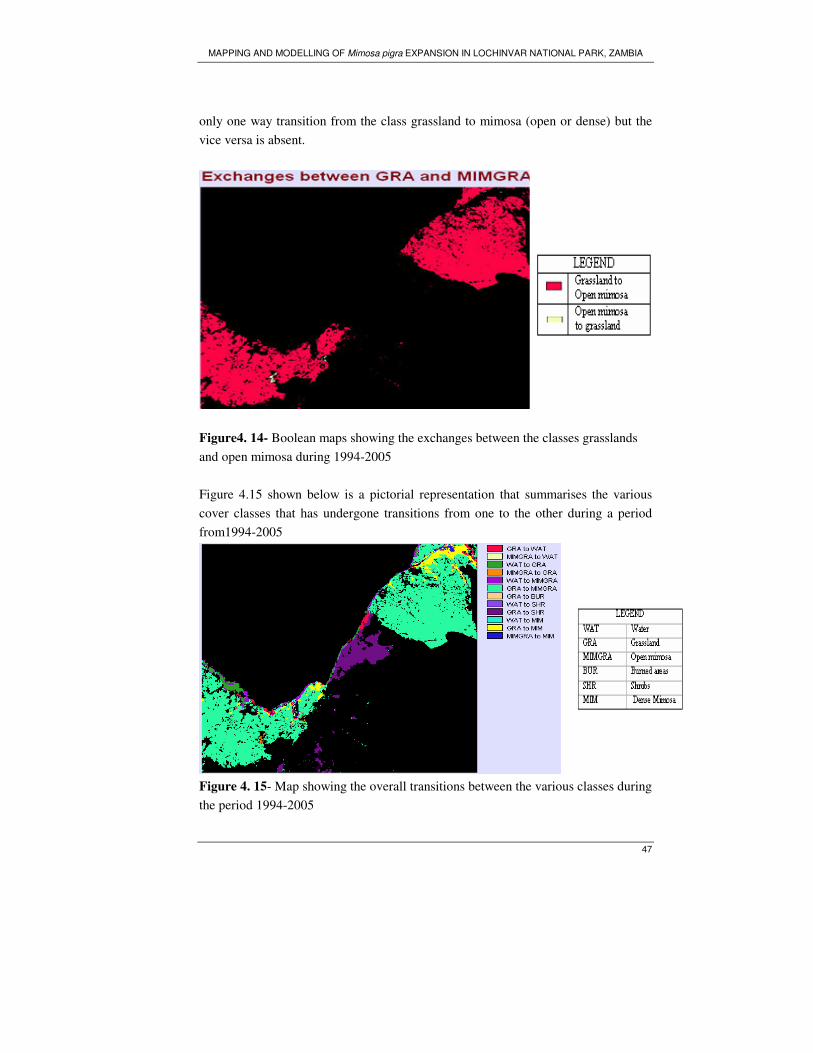
MAPPING AND MODELLING OF Mimosa pigra EXPANSION IN LOCHINVAR NATIONAL PARK, ZAMBIA
47
only one way transition from the class grassland to mimosa (open or dense) but the
vice versa is absent.
Figure4. 14- Boolean maps showing the exchanges between the classes grasslands
and open mimosa during 1994-2005
Figure 4.15 shown below is a pictorial representation that summarises the various
cover classes that has undergone transitions from one to the other during a period
from1994-2005
Figure 4. 15- Map showing the overall transitions between the various classes during
the period 1994-2005
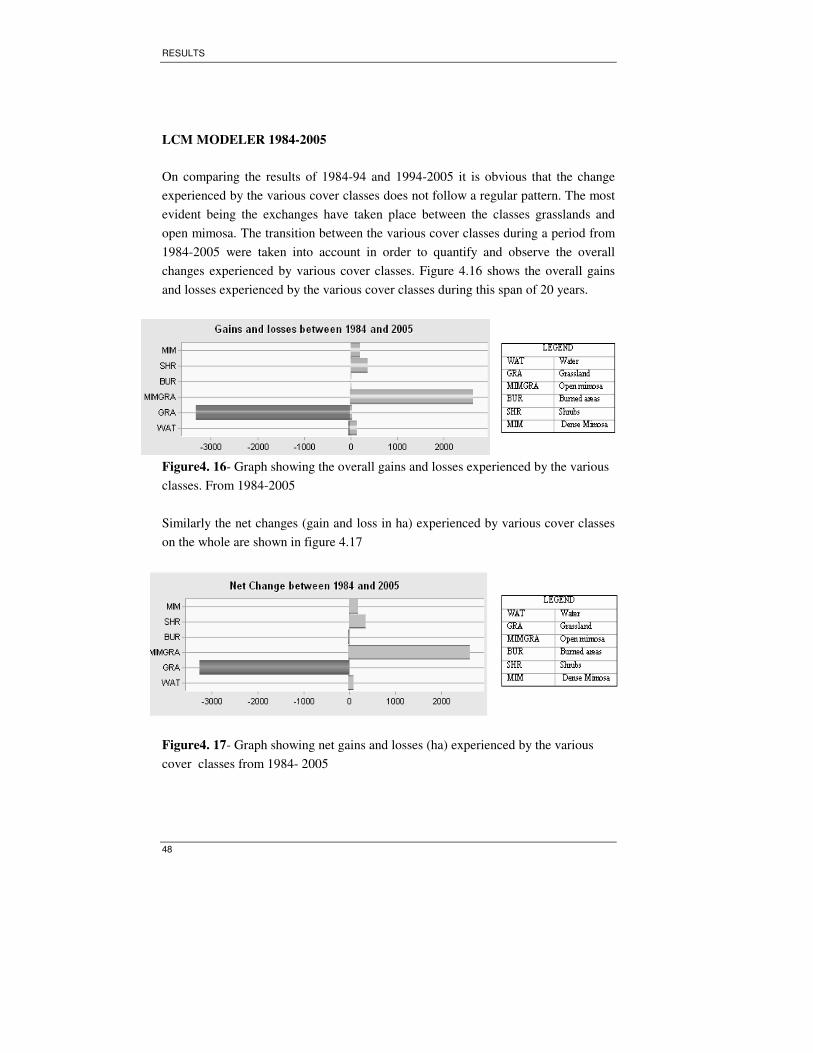
RESULTS
48
LCM MODELER 1984-2005
On comparing the results of 1984-94 and 1994-2005 it is obvious that the change
experienced by the various cover classes does not follow a regular pattern. The most
evident being the exchanges have taken place between the classes grasslands and
open mimosa. The transition between the various cover classes during a period from
1984-2005 were taken into account in order to quantify and observe the overall
changes experienced by various cover classes. Figure 4.16 shows the overall gains
and losses experienced by the various cover classes during this span of 20 years.
Figure4. 16- Graph showing the overall gains and losses experienced by the various
classes. From 1984-2005
Similarly the net changes (gain and loss in ha) experienced by various cover classes
on the whole are shown in figure 4.17
Figure4. 17- Graph showing net gains and losses (ha) experienced by the various
cover classes from 1984- 2005
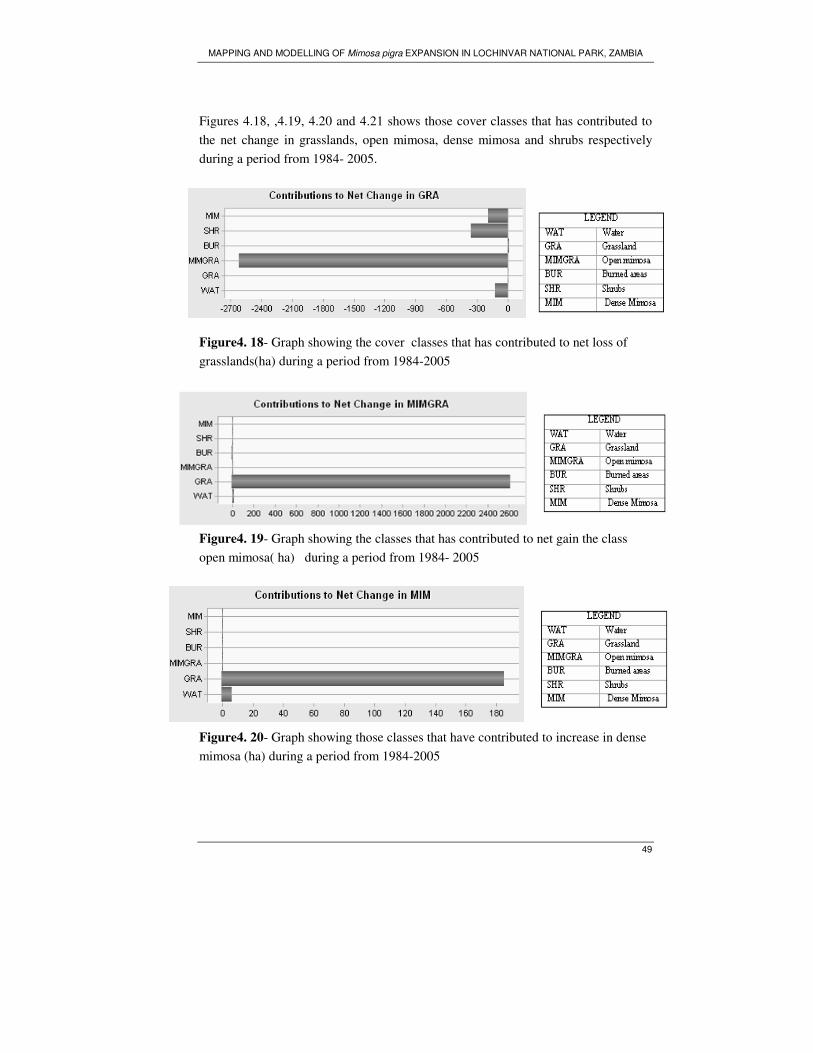
MAPPING AND MODELLING OF Mimosa pigra EXPANSION IN LOCHINVAR NATIONAL PARK, ZAMBIA
49
Figures 4.18, ,4.19, 4.20 and 4.21 shows those cover classes that has contributed to
the net change in grasslands, open mimosa, dense mimosa and shrubs respectively
during a period from 1984- 2005.
Figure4. 18- Graph showing the cover classes that has contributed to net loss of
grasslands(ha) during a period from 1984-2005
Figure4. 19- Graph showing the classes that has contributed to net gain the class
open mimosa( ha) during a period from 1984- 2005
Figure4. 20- Graph showing those classes that have contributed to increase in dense
mimosa (ha) during a period from 1984-2005
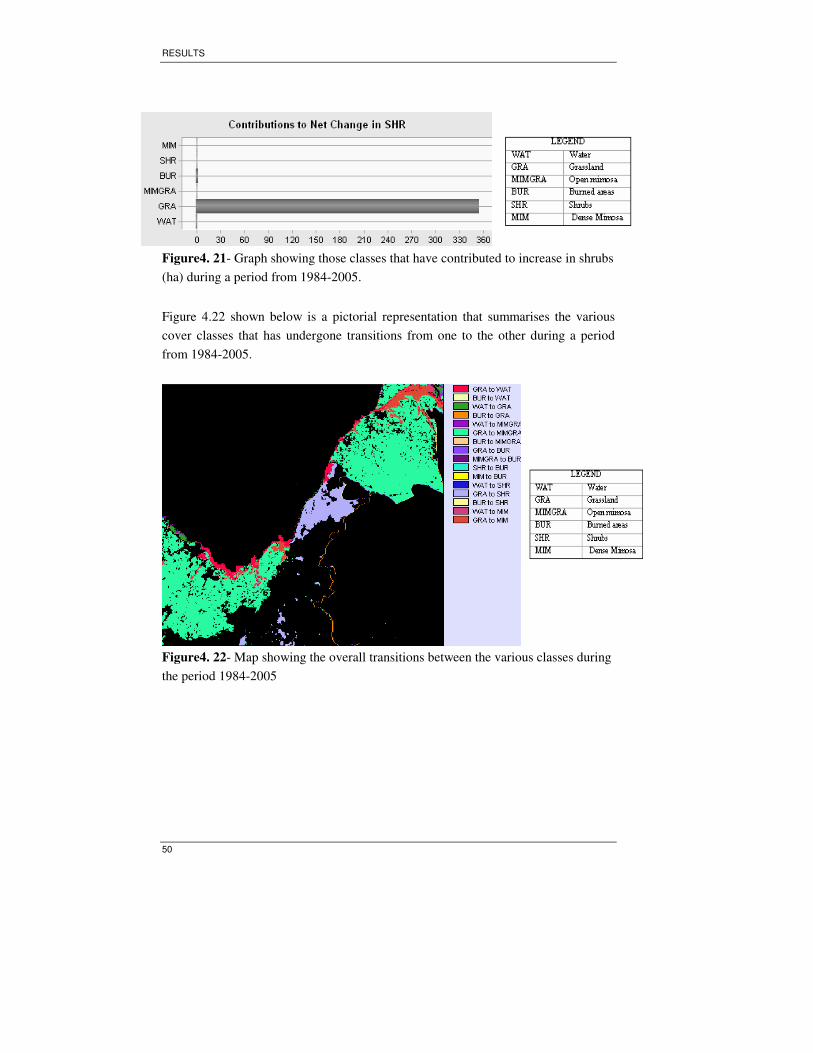
RESULTS
50
Figure4. 21- Graph showing those classes that have contributed to increase in shrubs
(ha) during a period from 1984-2005.
Figure 4.22 shown below is a pictorial representation that summarises the various
cover classes that has undergone transitions from one to the other during a period
from 1984-2005.
Figure4. 22- Map showing the overall transitions between the various classes during
the period 1984-2005
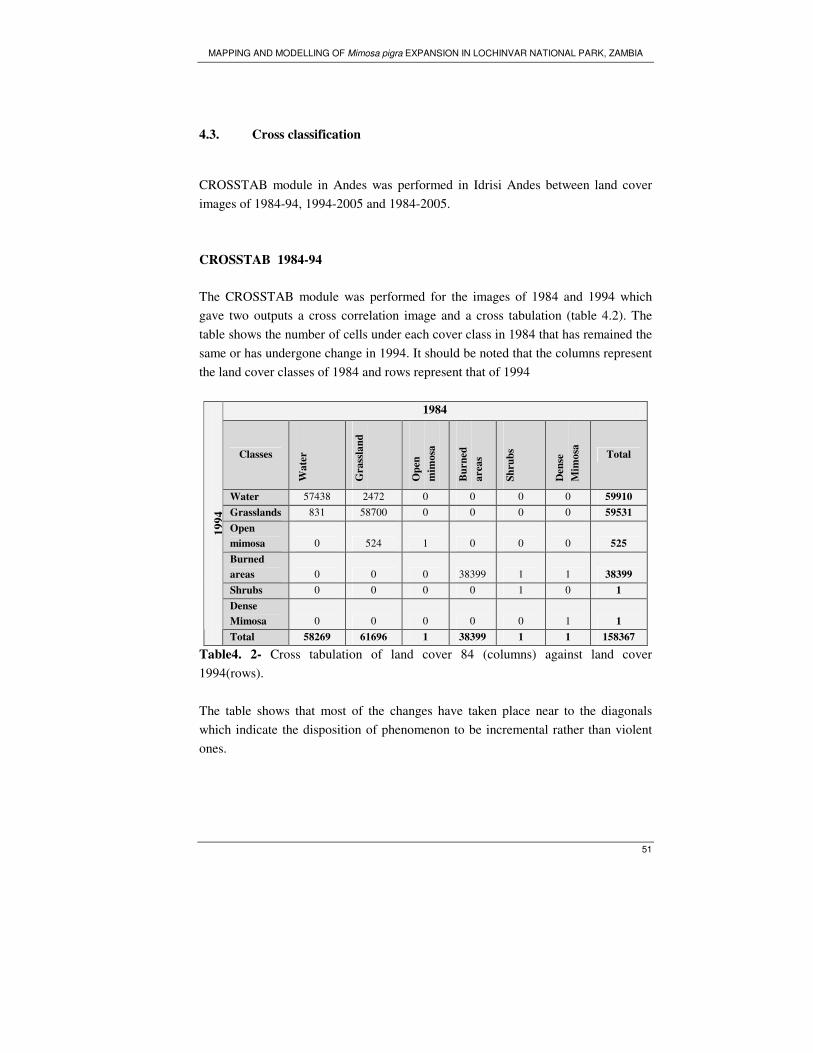
MAPPING AND MODELLING OF Mimosa pigra EXPANSION IN LOCHINVAR NATIONAL PARK, ZAMBIA
51
4.3. Cross classification
CROSSTAB module in Andes was performed in Idrisi Andes between land cover
images of 1984-94, 1994-2005 and 1984-2005.
CROSSTAB 1984-94
The CROSSTAB module was performed for the images of 1984 and 1994 which
gave two outputs a cross correlation image and a cross tabulation (table 4.2). The
table shows the number of cells under each cover class in 1984 that has remained the
same or has undergone change in 1994. It should be noted that the columns represent
the land cover classes of 1984 and rows represent that of 1994
1984
Classes
Wa
ter
Gra
ssla
nd
Op
en
mim
osa
Bu
rned
are
as
Sh
rub
s
Den
se
Mim
osa
Total
Water 57438 2472 0 0 0 0 59910
Grasslands 831 58700 0 0 0 0 59531
Open
mimosa 0 524 1 0 0 0 525
Burned
areas 0 0 0 38399 1 1 38399
Shrubs 0 0 0 0 1 0 1
Dense
Mimosa 0 0 0 0 0 1 1
19
94
Total 58269 61696 1 38399 1 1 158367
Table4. 2- Cross tabulation of land cover 84 (columns) against land cover
1994(rows).
The table shows that most of the changes have taken place near to the diagonals
which indicate the disposition of phenomenon to be incremental rather than violent
ones.
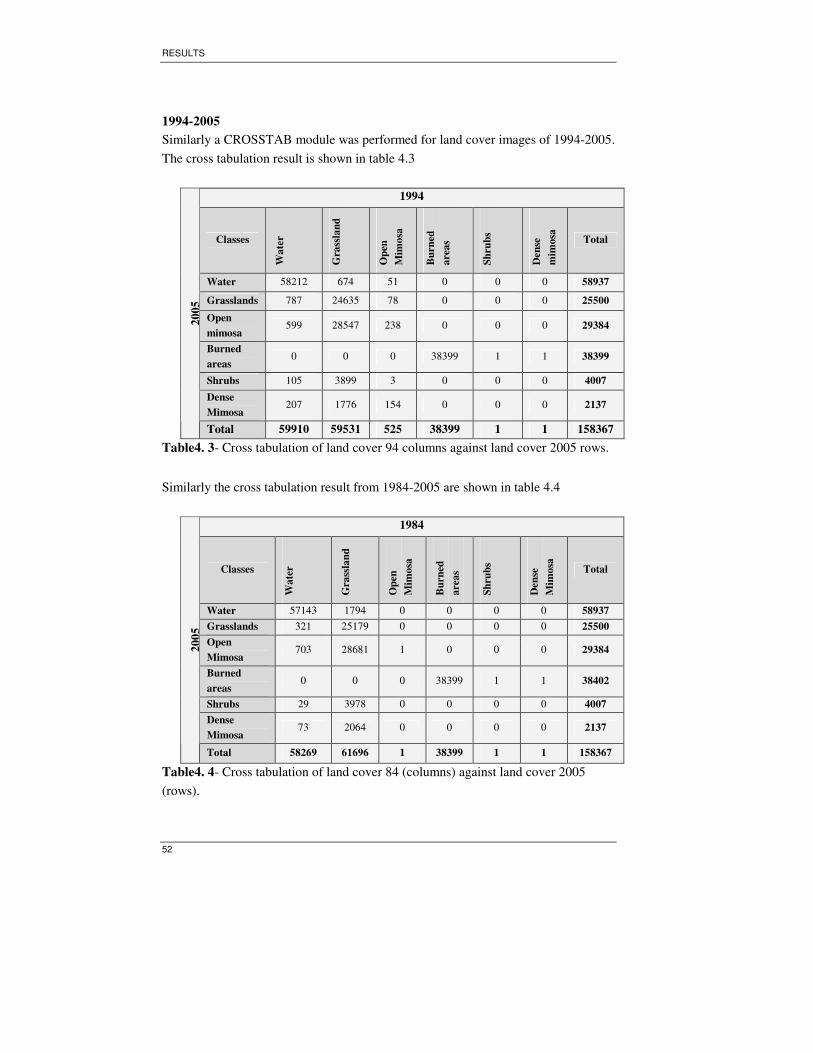
RESULTS
52
1994-2005
Similarly a CROSSTAB module was performed for land cover images of 1994-2005.
The cross tabulation result is shown in table 4.3
1994
Classes
Wa
ter
Gra
ssla
nd
Op
en
Mim
osa
Bu
rned
are
as
Sh
rub
s
Den
se
mim
osa
Total
Water 58212 674 51 0 0 0 58937
Grasslands 787 24635 78 0 0 0 25500
Open
mimosa 599 28547 238 0 0 0 29384
Burned
areas 0 0 0 38399 1 1 38399
Shrubs 105 3899 3 0 0 0 4007
Dense
Mimosa 207 1776 154 0 0 0 2137
20
05
Total 59910 59531 525 38399 1 1 158367
Table4. 3- Cross tabulation of land cover 94 columns against land cover 2005 rows.
Similarly the cross tabulation result from 1984-2005 are shown in table 4.4
1984
Classes
Wa
ter
Gra
ssla
nd
Op
en
Mim
osa
Bu
rned
are
as
Sh
rub
s
Den
se
Mim
osa
Total
Water 57143 1794 0 0 0 0 58937
Grasslands 321 25179 0 0 0 0 25500
Open
Mimosa 703 28681 1 0 0 0 29384
Burned
areas 0 0 0 38399 1 1 38402
Shrubs 29 3978 0 0 0 0 4007
Dense
Mimosa 73 2064 0 0 0 0 2137
20
05
Total 58269 61696 1 38399 1 1 158367
Table4. 4- Cross tabulation of land cover 84 (columns) against land cover 2005
(rows).
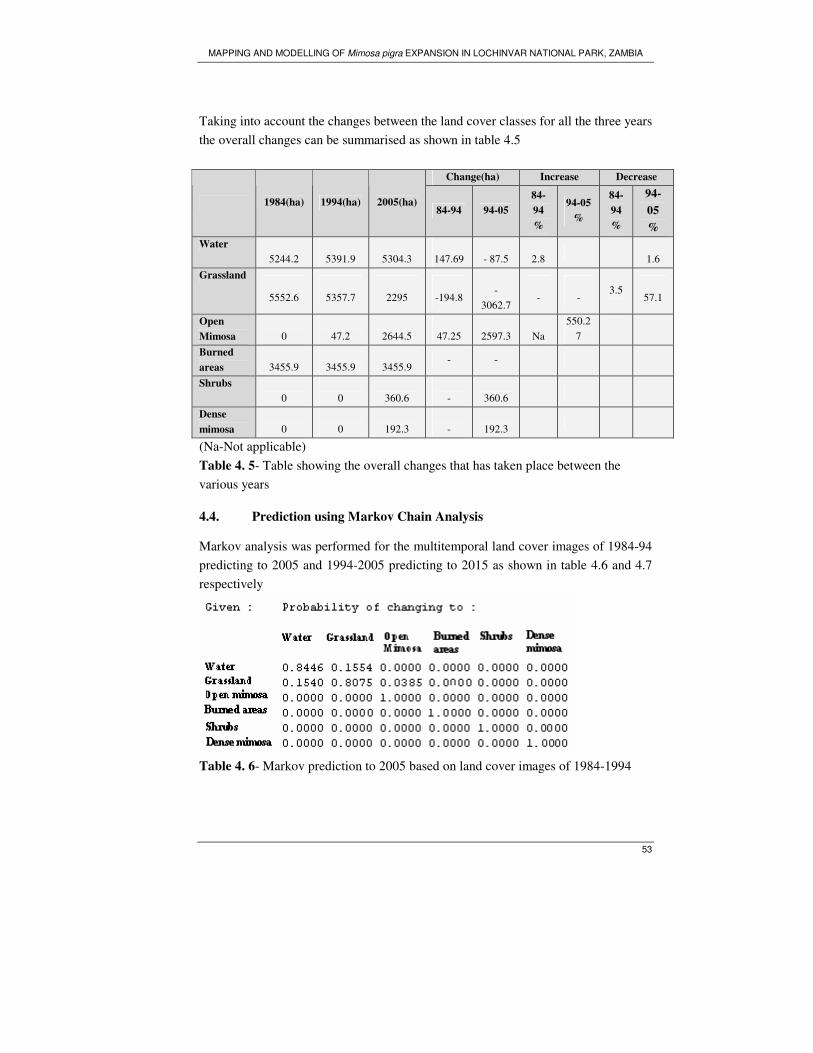
MAPPING AND MODELLING OF Mimosa pigra EXPANSION IN LOCHINVAR NATIONAL PARK, ZAMBIA
53
Taking into account the changes between the land cover classes for all the three years
the overall changes can be summarised as shown in table 4.5
Change(ha) Increase Decrease
1984(ha) 1994(ha) 2005(ha) 84-94 94-05
84-
94
%
94-05
%
84-
94
%
94-
05
%
Water
5244.2
5391.9
5304.3
147.69
- 87.5
2.8
1.6
Grassland
5552.6
5357.7
2295
-194.8
-
3062.7
-
-
3.5
57.1
Open
Mimosa
0
47.2
2644.5
47.25
2597.3
Na
550.2
7
Burned
areas
3455.9
3455.9
3455.9 - -
Shrubs
0
0
360.6
-
360.6
Dense
mimosa
0
0
192.3
-
192.3
(Na-Not applicable)
Table 4. 5- Table showing the overall changes that has taken place between the
various years
4.4. Prediction using Markov Chain Analysis
Markov analysis was performed for the multitemporal land cover images of 1984-94
predicting to 2005 and 1994-2005 predicting to 2015 as shown in table 4.6 and 4.7
respectively
Table 4. 6- Markov prediction to 2005 based on land cover images of 1984-1994
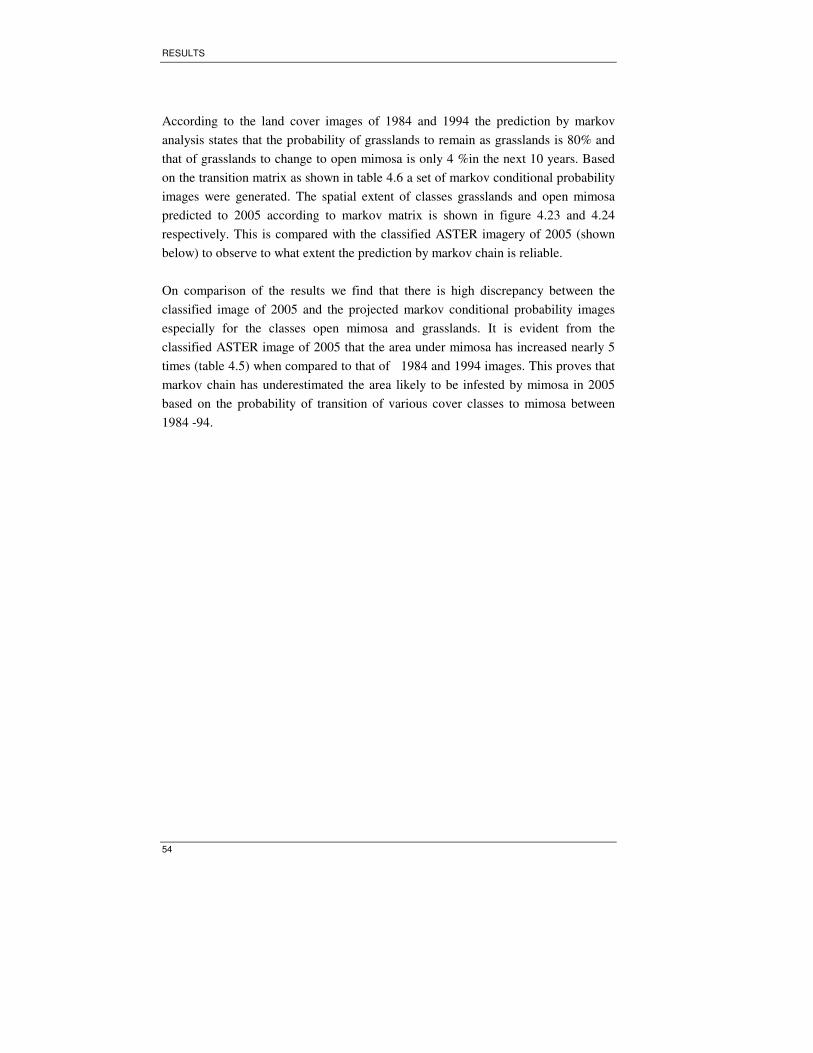
RESULTS
54
According to the land cover images of 1984 and 1994 the prediction by markov
analysis states that the probability of grasslands to remain as grasslands is 80% and
that of grasslands to change to open mimosa is only 4 %in the next 10 years. Based
on the transition matrix as shown in table 4.6 a set of markov conditional probability
images were generated. The spatial extent of classes grasslands and open mimosa
predicted to 2005 according to markov matrix is shown in figure 4.23 and 4.24
respectively. This is compared with the classified ASTER imagery of 2005 (shown
below) to observe to what extent the prediction by markov chain is reliable.
On comparison of the results we find that there is high discrepancy between the
classified image of 2005 and the projected markov conditional probability images
especially for the classes open mimosa and grasslands. It is evident from the
classified ASTER image of 2005 that the area under mimosa has increased nearly 5
times (table 4.5) when compared to that of 1984 and 1994 images. This proves that
markov chain has underestimated the area likely to be infested by mimosa in 2005
based on the probability of transition of various cover classes to mimosa between
1984 -94.
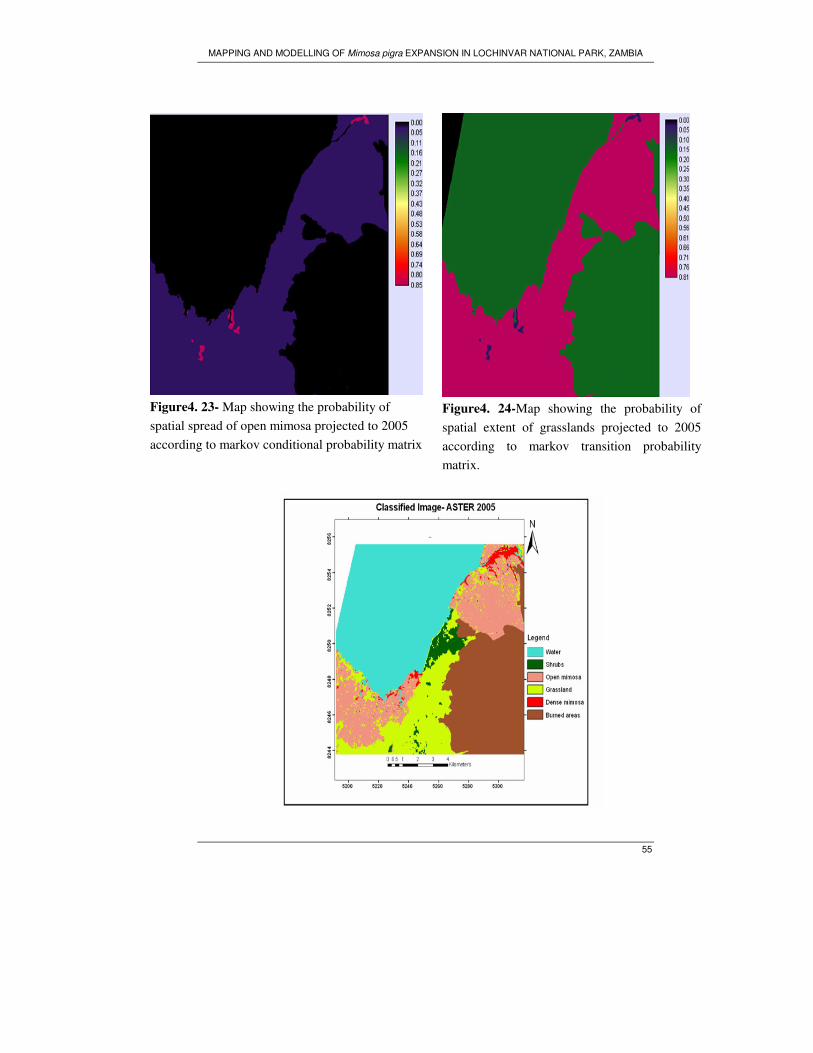
MAPPING AND MODELLING OF Mimosa pigra EXPANSION IN LOCHINVAR NATIONAL PARK, ZAMBIA
55
Figure4. 23- Map showing the probability of
spatial spread of open mimosa projected to 2005
according to markov conditional probability matrix
Figure4. 24-Map showing the probability of
spatial extent of grasslands projected to 2005
according to markov transition probability
matrix.
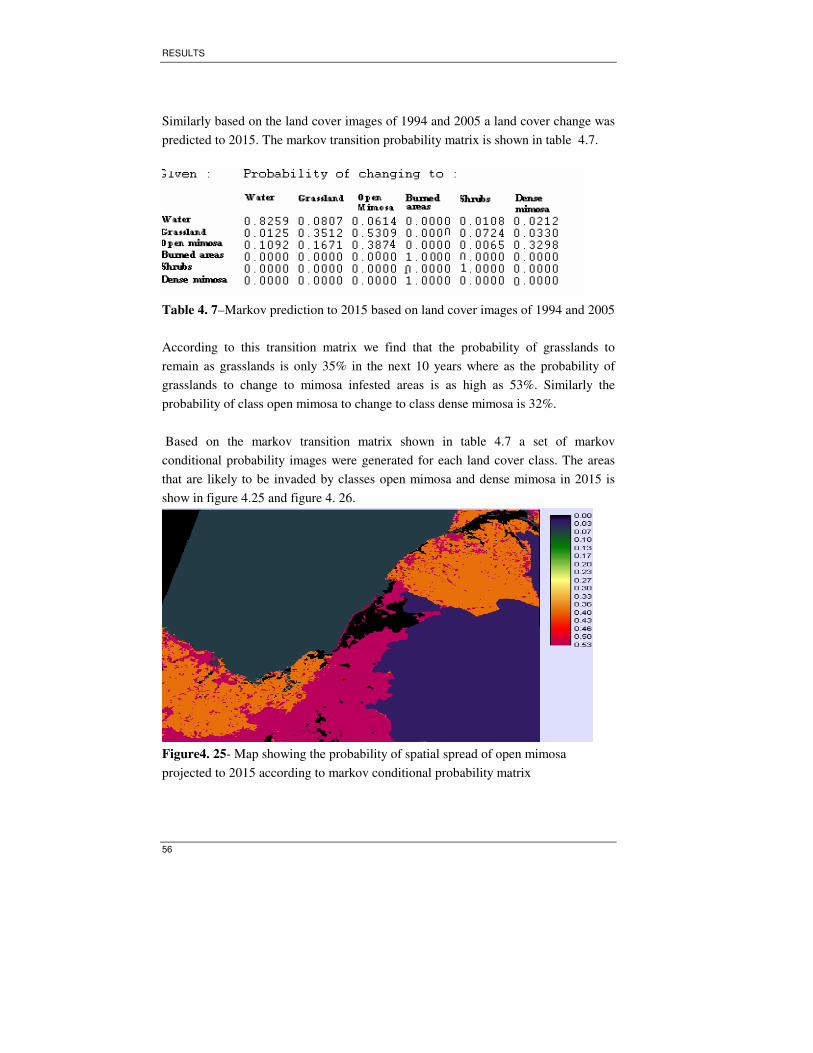
RESULTS
56
Similarly based on the land cover images of 1994 and 2005 a land cover change was
predicted to 2015. The markov transition probability matrix is shown in table 4.7.
Table 4. 7–Markov prediction to 2015 based on land cover images of 1994 and 2005
According to this transition matrix we find that the probability of grasslands to
remain as grasslands is only 35% in the next 10 years where as the probability of
grasslands to change to mimosa infested areas is as high as 53%. Similarly the
probability of class open mimosa to change to class dense mimosa is 32%.
Based on the markov transition matrix shown in table 4.7 a set of markov
conditional probability images were generated for each land cover class. The areas
that are likely to be invaded by classes open mimosa and dense mimosa in 2015 is
show in figure 4.25 and figure 4. 26.
Figure4. 25- Map showing the probability of spatial spread of open mimosa
projected to 2015 according to markov conditional probability matrix
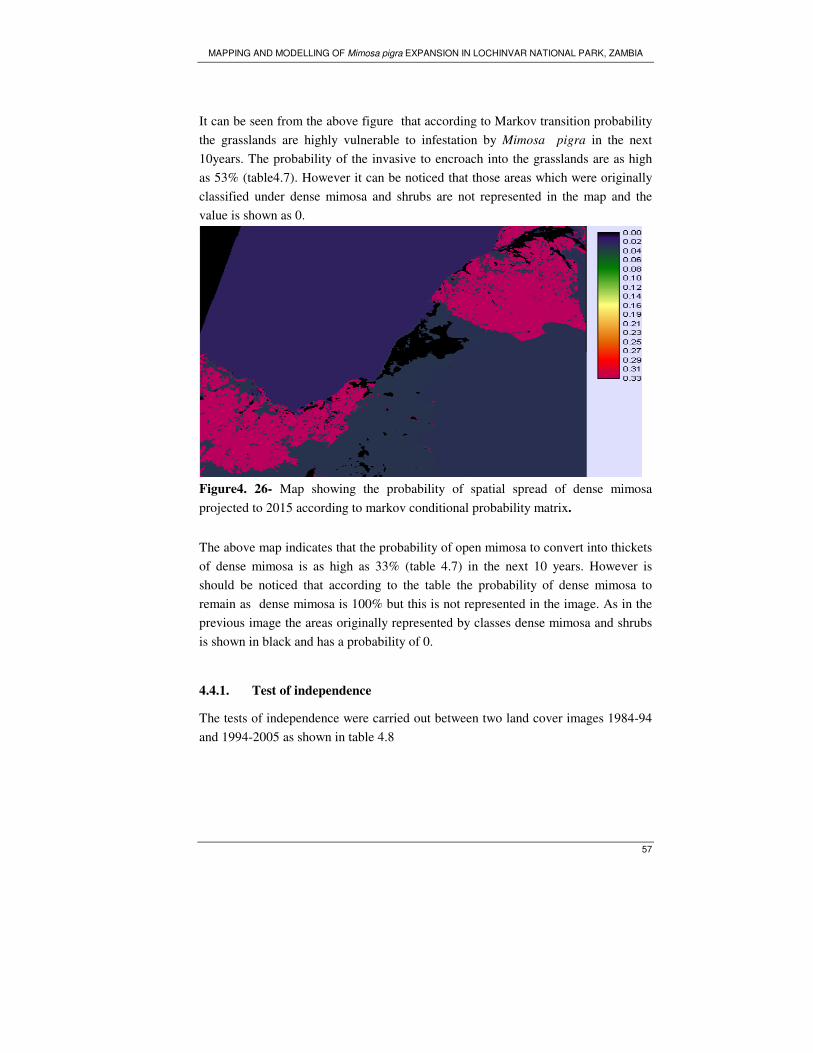
MAPPING AND MODELLING OF Mimosa pigra EXPANSION IN LOCHINVAR NATIONAL PARK, ZAMBIA
57
It can be seen from the above figure that according to Markov transition probability
the grasslands are highly vulnerable to infestation by Mimosa pigra in the next
10years. The probability of the invasive to encroach into the grasslands are as high
as 53% (table4.7). However it can be noticed that those areas which were originally
classified under dense mimosa and shrubs are not represented in the map and the
value is shown as 0.
Figure4. 26- Map showing the probability of spatial spread of dense mimosa
projected to 2015 according to markov conditional probability matrix.
The above map indicates that the probability of open mimosa to convert into thickets
of dense mimosa is as high as 33% (table 4.7) in the next 10 years. However is
should be noticed that according to the table the probability of dense mimosa to
remain as dense mimosa is 100% but this is not represented in the image. As in the
previous image the areas originally represented by classes dense mimosa and shrubs
is shown in black and has a probability of 0.
4.4.1. Test of independence
The tests of independence were carried out between two land cover images 1984-94
and 1994-2005 as shown in table 4.8
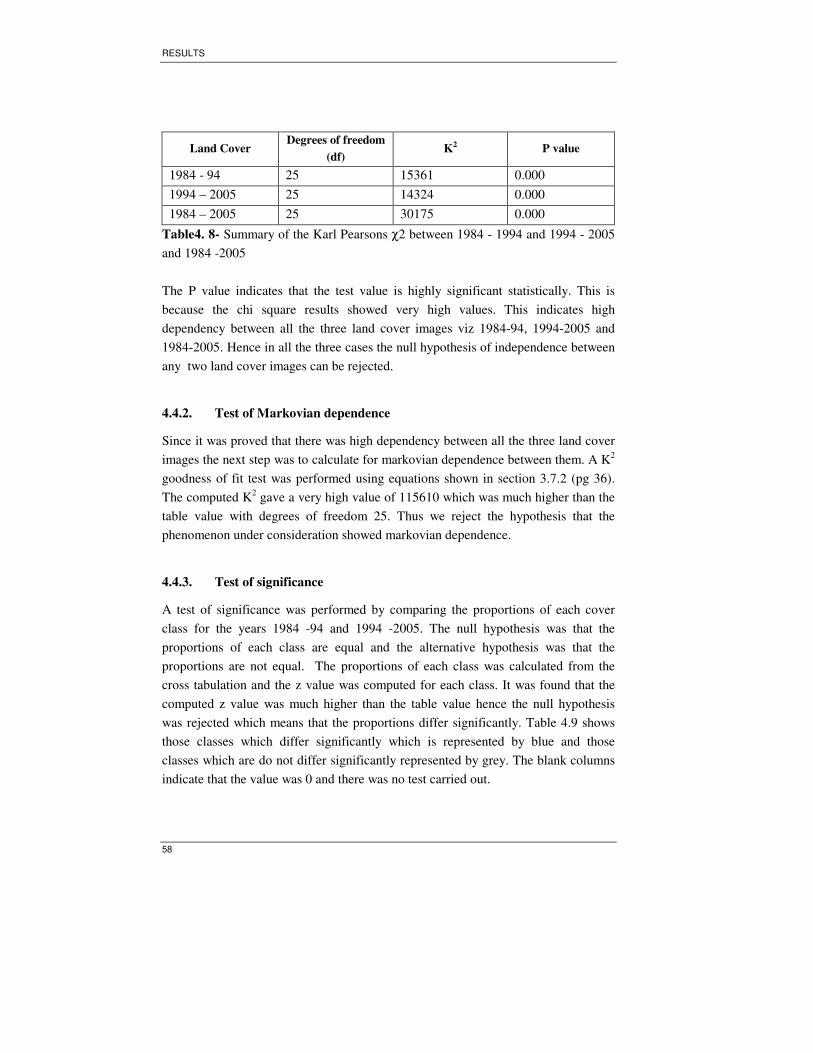
RESULTS
58
Land Cover Degrees of freedom
(df) K2 P value
1984 - 94 25 15361 0.000
1994 – 2005 25 14324 0.000
1984 – 2005 25 30175 0.000
Table4. 8- Summary of the Karl Pearsons χ2 between 1984 - 1994 and 1994 - 2005
and 1984 -2005
The P value indicates that the test value is highly significant statistically. This is
because the chi square results showed very high values. This indicates high
dependency between all the three land cover images viz 1984-94, 1994-2005 and
1984-2005. Hence in all the three cases the null hypothesis of independence between
any two land cover images can be rejected.
4.4.2. Test of Markovian dependence
Since it was proved that there was high dependency between all the three land cover
images the next step was to calculate for markovian dependence between them. A K2
goodness of fit test was performed using equations shown in section 3.7.2 (pg 36).
The computed K2 gave a very high value of 115610 which was much higher than the
table value with degrees of freedom 25. Thus we reject the hypothesis that the
phenomenon under consideration showed markovian dependence.
4.4.3. Test of significance
A test of significance was performed by comparing the proportions of each cover
class for the years 1984 -94 and 1994 -2005. The null hypothesis was that the
proportions of each class are equal and the alternative hypothesis was that the
proportions are not equal. The proportions of each class was calculated from the
cross tabulation and the z value was computed for each class. It was found that the
computed z value was much higher than the table value hence the null hypothesis
was rejected which means that the proportions differ significantly. Table 4.9 shows
those classes which differ significantly which is represented by blue and those
classes which are do not differ significantly represented by grey. The blank columns
indicate that the value was 0 and there was no test carried out.

MAPPING AND MODELLING OF Mimosa pigra EXPANSION IN LOCHINVAR NATIONAL PARK, ZAMBIA
59
Table4. 9- Table showing those classes that has changed in proportions when
comparing the land cover images of 1984-94 and 1994- 2005.
DISCUSSIONS
60
5. Discussions
5.1. Delineation of Mimosa pigra invaded areas using multitemporal
dataset
Supervised classification of ASTER 2005 and LANDSAT 1994 and 1984 has
revealed the fact that over the years, the aggressive alien shrub, Mimosa pigra has
been invading the Park area to a considerable extent by drastically reducing the area
under grasslands. Six cover classes have been assigned for the purpose of
classification. The overall accuracy was 74.4 % and the user’s accuracy and
producers for the classes of interest (open mimosa and dense mimosa) was 70 and
75% and 78 and 75% respectively. The confusion matrix reveals that there was some
spectral confusion between grasslands and open mimosa since both classes had
grassland in common (though the grass was dry in most areas). However it was
impossible to distinguish pure mimosa areas from the grasslands since the growth of
the invasive alien in terms of spatial extent was sporadic depending upon the
availability of water and sunlight. Hence it was found to grow in varying densities
mixed with grasslands within an area. The class open mimosa was assigned since it
has been proved that once an area is infested by mimosa even though to a small
extent the probability of changing back to pure grasslands is almost negligible. So
those areas can be considered as already invaded by mimosa.
The satellite image of 1984 does not detect any mimosa. This may be due to the fact
that in 1984 the area under mimosa was so small that LANDSAT could not detect it
with a spatial resolution of 30m. Before 1980 there was only one infestation
occupying approximately 2 ha at the head of the Nampongwe stream, which flows
through Chunga Lagoon (Douthwaite & van Lavieren, 1977; Sheppe & Osborne,
1971). The LANDSAT image of 1994 could detect 47.25 ha of mimosa. The results
obtained through personal communication of a study which is in progress on shrub
encroachment into grasslands in Lochinvar National Park conducted by Gennet (
2007) detects 241.83 ha of Mimosa pigra. However aerial survey conducted by
Thompson (1986) in late 80 s reveal that mimosa was spreading throughout the park
and showed signs of becoming an invasive where it occupied approximately 100 ha
He also reports that in 1994 few areas of mimosa mixed with dry grass was identified
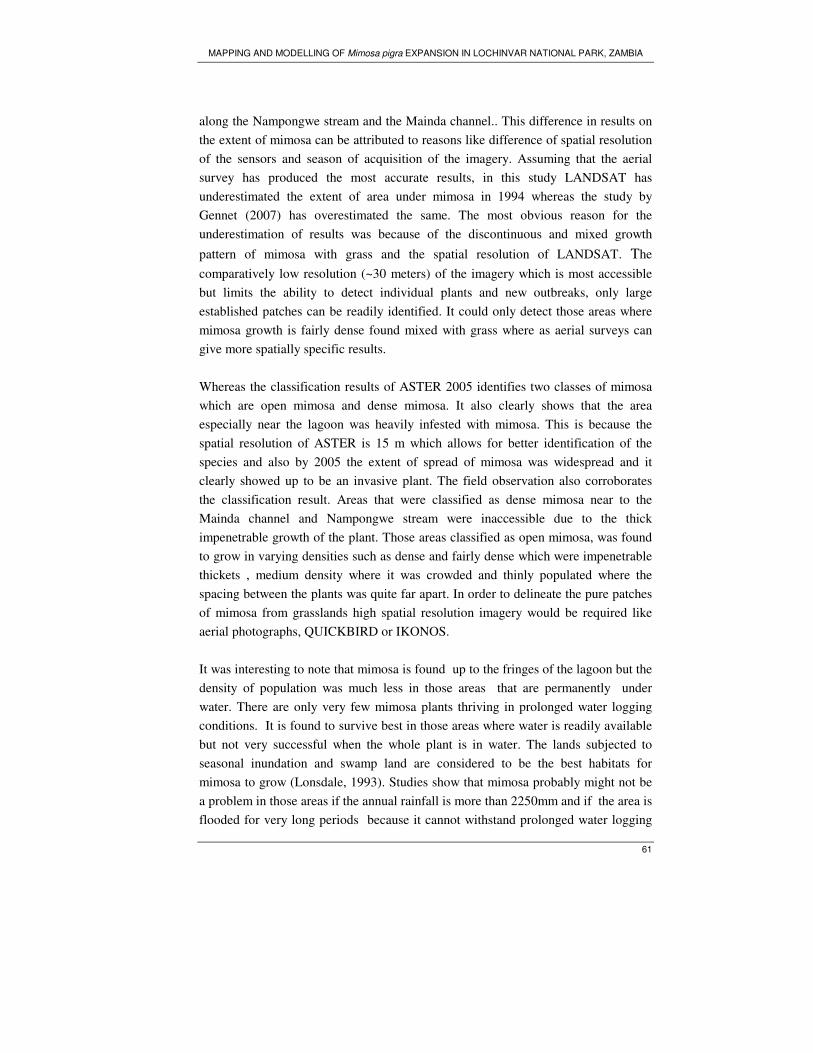
MAPPING AND MODELLING OF Mimosa pigra EXPANSION IN LOCHINVAR NATIONAL PARK, ZAMBIA
61
along the Nampongwe stream and the Mainda channel.. This difference in results on
the extent of mimosa can be attributed to reasons like difference of spatial resolution
of the sensors and season of acquisition of the imagery. Assuming that the aerial
survey has produced the most accurate results, in this study LANDSAT has
underestimated the extent of area under mimosa in 1994 whereas the study by
Gennet (2007) has overestimated the same. The most obvious reason for the
underestimation of results was because of the discontinuous and mixed growth
pattern of mimosa with grass and the spatial resolution of LANDSAT. The
comparatively low resolution (~30 meters) of the imagery which is most accessible
but limits the ability to detect individual plants and new outbreaks, only large
established patches can be readily identified. It could only detect those areas where
mimosa growth is fairly dense found mixed with grass where as aerial surveys can
give more spatially specific results.
Whereas the classification results of ASTER 2005 identifies two classes of mimosa
which are open mimosa and dense mimosa. It also clearly shows that the area
especially near the lagoon was heavily infested with mimosa. This is because the
spatial resolution of ASTER is 15 m which allows for better identification of the
species and also by 2005 the extent of spread of mimosa was widespread and it
clearly showed up to be an invasive plant. The field observation also corroborates
the classification result. Areas that were classified as dense mimosa near to the
Mainda channel and Nampongwe stream were inaccessible due to the thick
impenetrable growth of the plant. Those areas classified as open mimosa, was found
to grow in varying densities such as dense and fairly dense which were impenetrable
thickets , medium density where it was crowded and thinly populated where the
spacing between the plants was quite far apart. In order to delineate the pure patches
of mimosa from grasslands high spatial resolution imagery would be required like
aerial photographs, QUICKBIRD or IKONOS.
It was interesting to note that mimosa is found up to the fringes of the lagoon but the
density of population was much less in those areas that are permanently under
water. There are only very few mimosa plants thriving in prolonged water logging
conditions. It is found to survive best in those areas where water is readily available
but not very successful when the whole plant is in water. The lands subjected to
seasonal inundation and swamp land are considered to be the best habitats for
mimosa to grow (Lonsdale, 1993). Studies show that mimosa probably might not be
a problem in those areas if the annual rainfall is more than 2250mm and if the area is
flooded for very long periods because it cannot withstand prolonged water logging
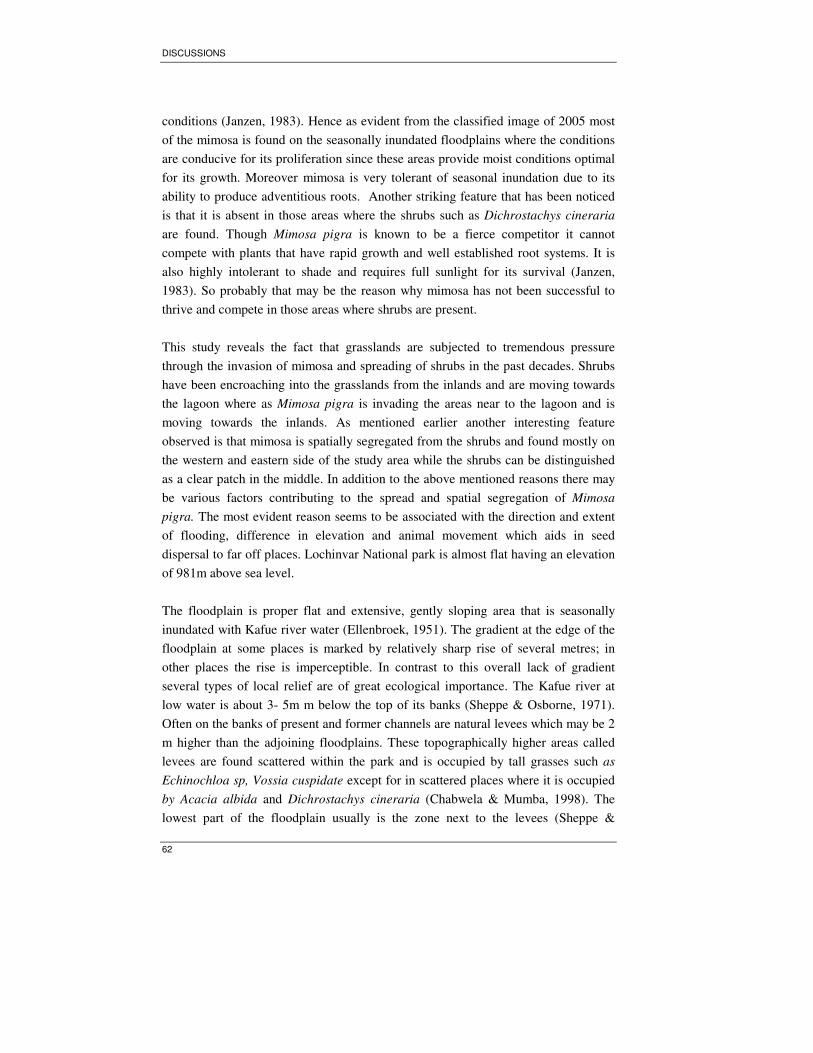
DISCUSSIONS
62
conditions (Janzen, 1983). Hence as evident from the classified image of 2005 most
of the mimosa is found on the seasonally inundated floodplains where the conditions
are conducive for its proliferation since these areas provide moist conditions optimal
for its growth. Moreover mimosa is very tolerant of seasonal inundation due to its
ability to produce adventitious roots. Another striking feature that has been noticed
is that it is absent in those areas where the shrubs such as Dichrostachys cineraria
are found. Though Mimosa pigra is known to be a fierce competitor it cannot
compete with plants that have rapid growth and well established root systems. It is
also highly intolerant to shade and requires full sunlight for its survival (Janzen,
1983). So probably that may be the reason why mimosa has not been successful to
thrive and compete in those areas where shrubs are present.
This study reveals the fact that grasslands are subjected to tremendous pressure
through the invasion of mimosa and spreading of shrubs in the past decades. Shrubs
have been encroaching into the grasslands from the inlands and are moving towards
the lagoon where as Mimosa pigra is invading the areas near to the lagoon and is
moving towards the inlands. As mentioned earlier another interesting feature
observed is that mimosa is spatially segregated from the shrubs and found mostly on
the western and eastern side of the study area while the shrubs can be distinguished
as a clear patch in the middle. In addition to the above mentioned reasons there may
be various factors contributing to the spread and spatial segregation of Mimosa
pigra. The most evident reason seems to be associated with the direction and extent
of flooding, difference in elevation and animal movement which aids in seed
dispersal to far off places. Lochinvar National park is almost flat having an elevation
of 981m above sea level.
The floodplain is proper flat and extensive, gently sloping area that is seasonally
inundated with Kafue river water (Ellenbroek, 1951). The gradient at the edge of the
floodplain at some places is marked by relatively sharp rise of several metres; in
other places the rise is imperceptible. In contrast to this overall lack of gradient
several types of local relief are of great ecological importance. The Kafue river at
low water is about 3- 5m m below the top of its banks (Sheppe & Osborne, 1971).
Often on the banks of present and former channels are natural levees which may be 2
m higher than the adjoining floodplains. These topographically higher areas called
levees are found scattered within the park and is occupied by tall grasses such as
Echinochloa sp, Vossia cuspidate except for in scattered places where it is occupied
by Acacia albida and Dichrostachys cineraria (Chabwela & Mumba, 1998). The
lowest part of the floodplain usually is the zone next to the levees (Sheppe &
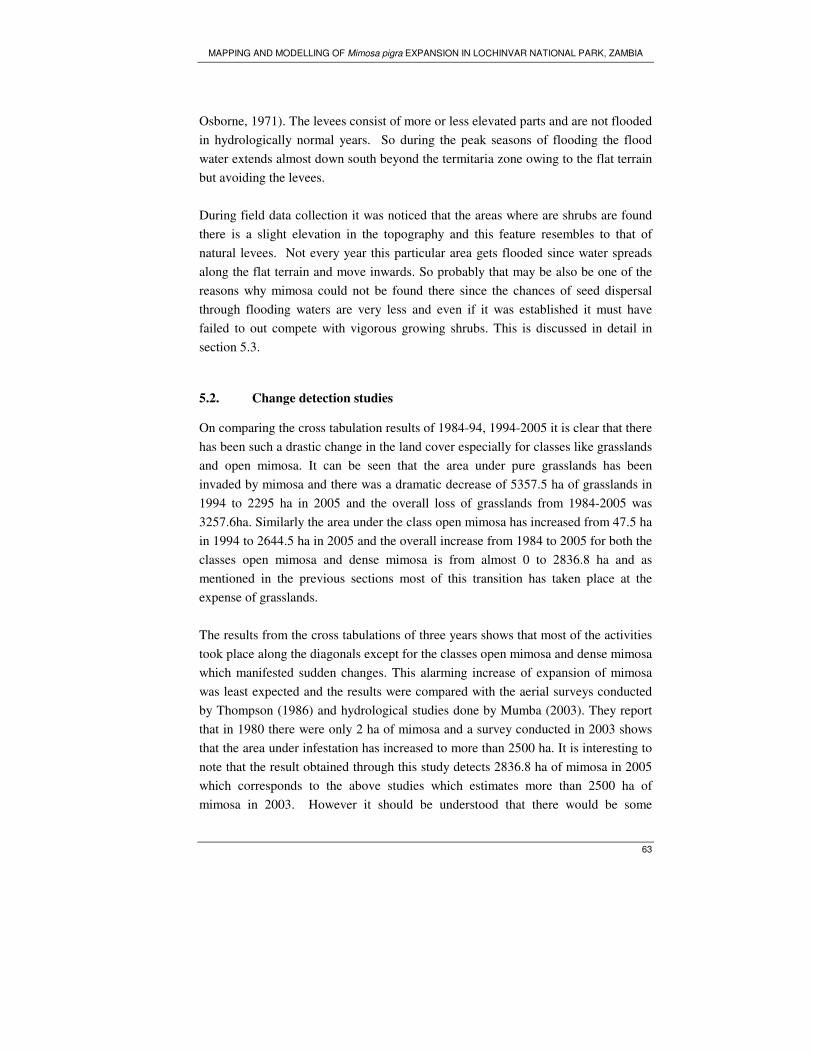
MAPPING AND MODELLING OF Mimosa pigra EXPANSION IN LOCHINVAR NATIONAL PARK, ZAMBIA
63
Osborne, 1971). The levees consist of more or less elevated parts and are not flooded
in hydrologically normal years. So during the peak seasons of flooding the flood
water extends almost down south beyond the termitaria zone owing to the flat terrain
but avoiding the levees.
During field data collection it was noticed that the areas where are shrubs are found
there is a slight elevation in the topography and this feature resembles to that of
natural levees. Not every year this particular area gets flooded since water spreads
along the flat terrain and move inwards. So probably that may be also be one of the
reasons why mimosa could not be found there since the chances of seed dispersal
through flooding waters are very less and even if it was established it must have
failed to out compete with vigorous growing shrubs. This is discussed in detail in
section 5.3.
5.2. Change detection studies
On comparing the cross tabulation results of 1984-94, 1994-2005 it is clear that there
has been such a drastic change in the land cover especially for classes like grasslands
and open mimosa. It can be seen that the area under pure grasslands has been
invaded by mimosa and there was a dramatic decrease of 5357.5 ha of grasslands in
1994 to 2295 ha in 2005 and the overall loss of grasslands from 1984-2005 was
3257.6ha. Similarly the area under the class open mimosa has increased from 47.5 ha
in 1994 to 2644.5 ha in 2005 and the overall increase from 1984 to 2005 for both the
classes open mimosa and dense mimosa is from almost 0 to 2836.8 ha and as
mentioned in the previous sections most of this transition has taken place at the
expense of grasslands.
The results from the cross tabulations of three years shows that most of the activities
took place along the diagonals except for the classes open mimosa and dense mimosa
which manifested sudden changes. This alarming increase of expansion of mimosa
was least expected and the results were compared with the aerial surveys conducted
by Thompson (1986) and hydrological studies done by Mumba (2003). They report
that in 1980 there were only 2 ha of mimosa and a survey conducted in 2003 shows
that the area under infestation has increased to more than 2500 ha. It is interesting to
note that the result obtained through this study detects 2836.8 ha of mimosa in 2005
which corresponds to the above studies which estimates more than 2500 ha of
mimosa in 2003. However it should be understood that there would be some
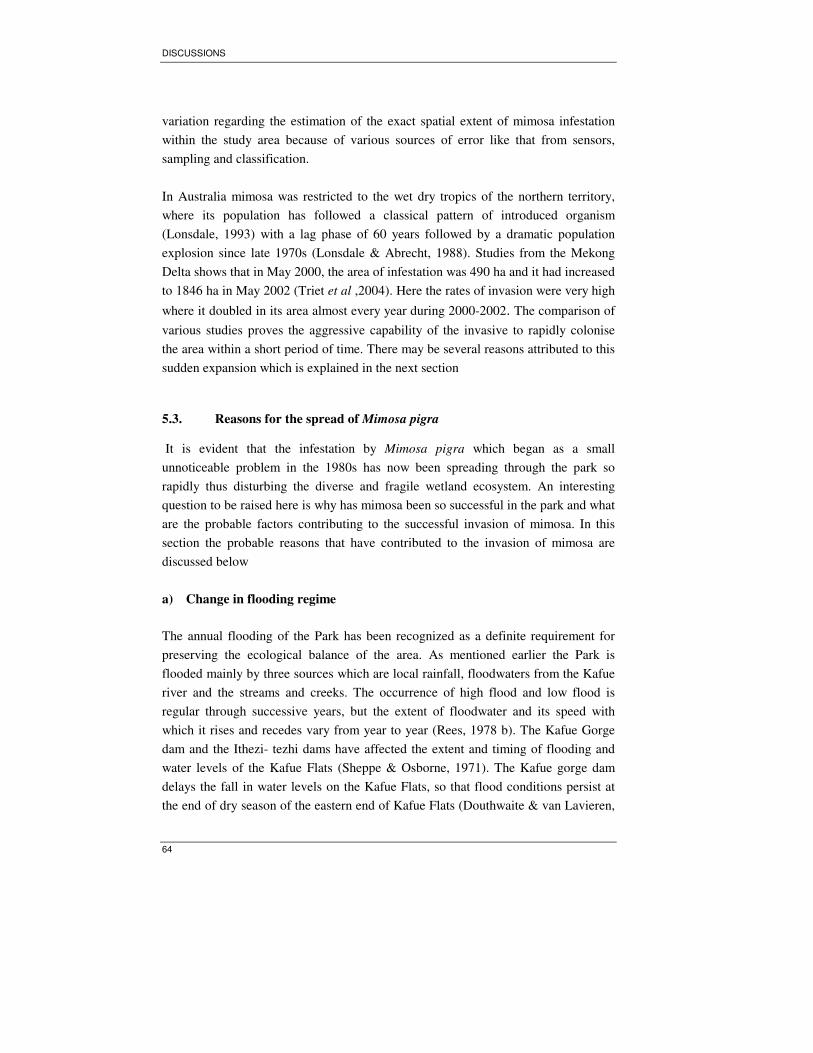
DISCUSSIONS
64
variation regarding the estimation of the exact spatial extent of mimosa infestation
within the study area because of various sources of error like that from sensors,
sampling and classification.
In Australia mimosa was restricted to the wet dry tropics of the northern territory,
where its population has followed a classical pattern of introduced organism
(Lonsdale, 1993) with a lag phase of 60 years followed by a dramatic population
explosion since late 1970s (Lonsdale & Abrecht, 1988). Studies from the Mekong
Delta shows that in May 2000, the area of infestation was 490 ha and it had increased
to 1846 ha in May 2002 (Triet et al ,2004). Here the rates of invasion were very high
where it doubled in its area almost every year during 2000-2002. The comparison of
various studies proves the aggressive capability of the invasive to rapidly colonise
the area within a short period of time. There may be several reasons attributed to this
sudden expansion which is explained in the next section
5.3. Reasons for the spread of Mimosa pigra
It is evident that the infestation by Mimosa pigra which began as a small
unnoticeable problem in the 1980s has now been spreading through the park so
rapidly thus disturbing the diverse and fragile wetland ecosystem. An interesting
question to be raised here is why has mimosa been so successful in the park and what
are the probable factors contributing to the successful invasion of mimosa. In this
section the probable reasons that have contributed to the invasion of mimosa are
discussed below
a) Change in flooding regime
The annual flooding of the Park has been recognized as a definite requirement for
preserving the ecological balance of the area. As mentioned earlier the Park is
flooded mainly by three sources which are local rainfall, floodwaters from the Kafue
river and the streams and creeks. The occurrence of high flood and low flood is
regular through successive years, but the extent of floodwater and its speed with
which it rises and recedes vary from year to year (Rees, 1978 b). The Kafue Gorge
dam and the Ithezi- tezhi dams have affected the extent and timing of flooding and
water levels of the Kafue Flats (Sheppe & Osborne, 1971). The Kafue gorge dam
delays the fall in water levels on the Kafue Flats, so that flood conditions persist at
the end of dry season of the eastern end of Kafue Flats (Douthwaite & van Lavieren,
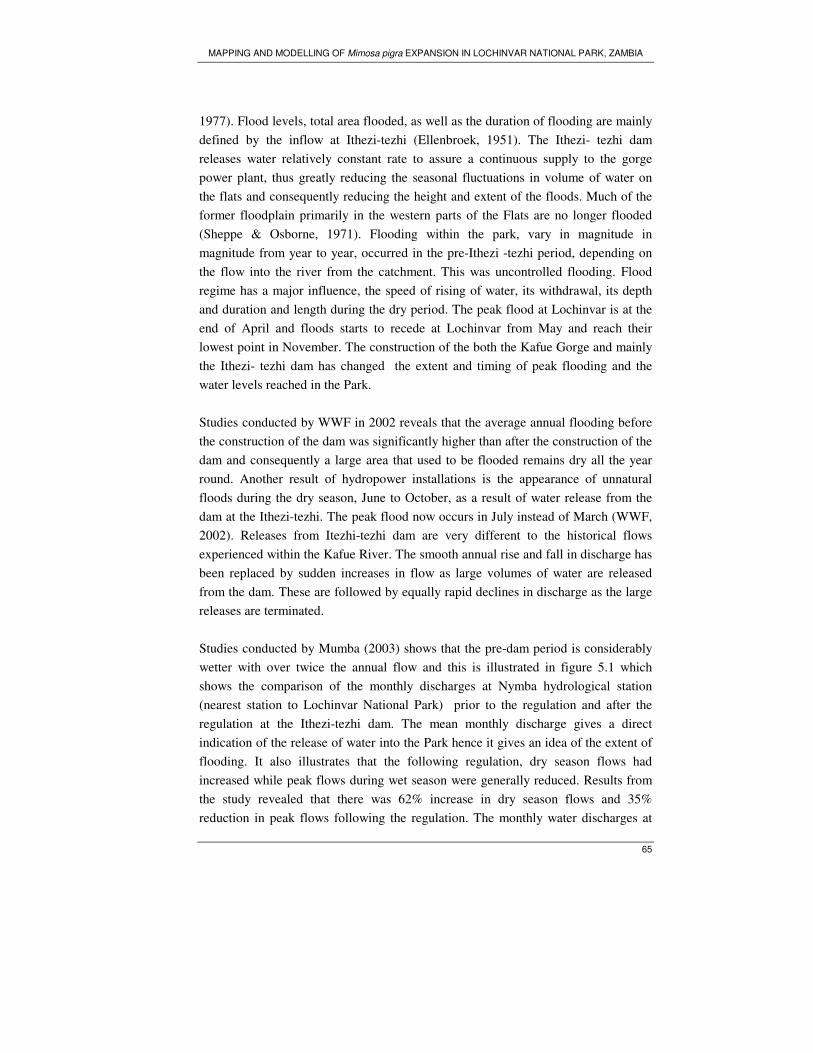
MAPPING AND MODELLING OF Mimosa pigra EXPANSION IN LOCHINVAR NATIONAL PARK, ZAMBIA
65
1977). Flood levels, total area flooded, as well as the duration of flooding are mainly
defined by the inflow at Ithezi-tezhi (Ellenbroek, 1951). The Ithezi- tezhi dam
releases water relatively constant rate to assure a continuous supply to the gorge
power plant, thus greatly reducing the seasonal fluctuations in volume of water on
the flats and consequently reducing the height and extent of the floods. Much of the
former floodplain primarily in the western parts of the Flats are no longer flooded
(Sheppe & Osborne, 1971). Flooding within the park, vary in magnitude in
magnitude from year to year, occurred in the pre-Ithezi -tezhi period, depending on
the flow into the river from the catchment. This was uncontrolled flooding. Flood
regime has a major influence, the speed of rising of water, its withdrawal, its depth
and duration and length during the dry period. The peak flood at Lochinvar is at the
end of April and floods starts to recede at Lochinvar from May and reach their
lowest point in November. The construction of the both the Kafue Gorge and mainly
the Ithezi- tezhi dam has changed the extent and timing of peak flooding and the
water levels reached in the Park.
Studies conducted by WWF in 2002 reveals that the average annual flooding before
the construction of the dam was significantly higher than after the construction of the
dam and consequently a large area that used to be flooded remains dry all the year
round. Another result of hydropower installations is the appearance of unnatural
floods during the dry season, June to October, as a result of water release from the
dam at the Ithezi-tezhi. The peak flood now occurs in July instead of March (WWF,
2002). Releases from Itezhi-tezhi dam are very different to the historical flows
experienced within the Kafue River. The smooth annual rise and fall in discharge has
been replaced by sudden increases in flow as large volumes of water are released
from the dam. These are followed by equally rapid declines in discharge as the large
releases are terminated.
Studies conducted by Mumba (2003) shows that the pre-dam period is considerably
wetter with over twice the annual flow and this is illustrated in figure 5.1 which
shows the comparison of the monthly discharges at Nymba hydrological station
(nearest station to Lochinvar National Park) prior to the regulation and after the
regulation at the Ithezi-tezhi dam. The mean monthly discharge gives a direct
indication of the release of water into the Park hence it gives an idea of the extent of
flooding. It also illustrates that the following regulation, dry season flows had
increased while peak flows during wet season were generally reduced. Results from
the study revealed that there was 62% increase in dry season flows and 35%
reduction in peak flows following the regulation. The monthly water discharges at
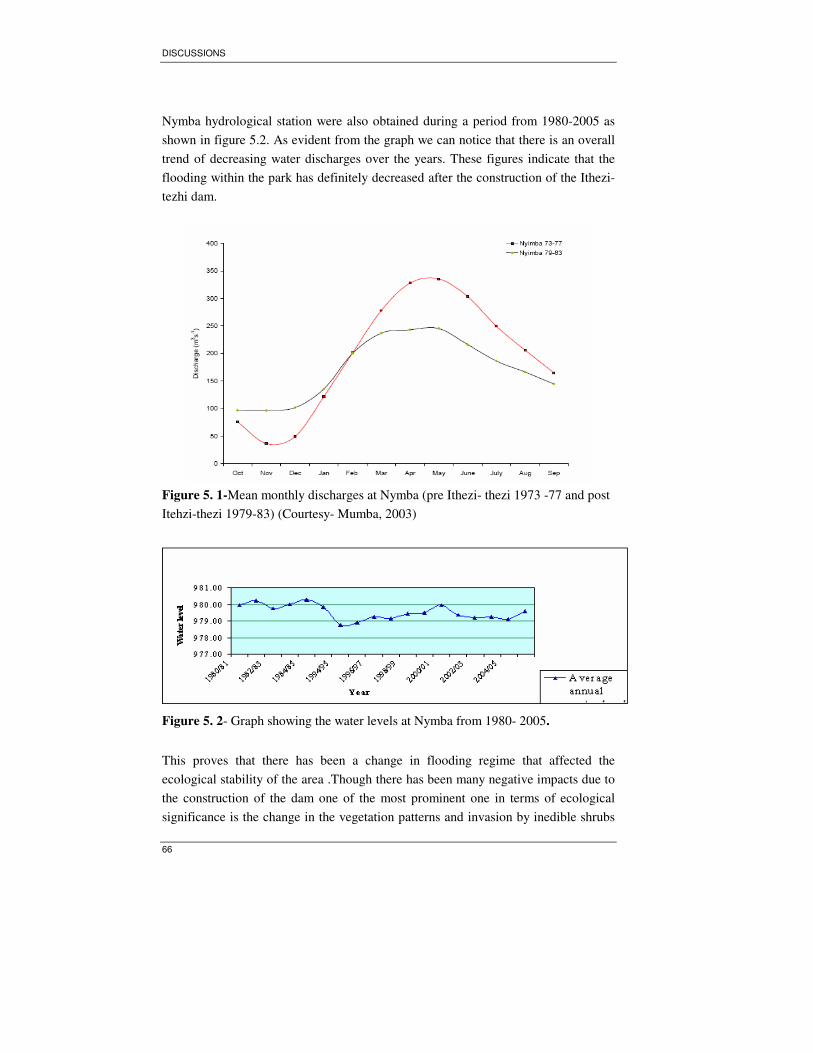
DISCUSSIONS
66
Nymba hydrological station were also obtained during a period from 1980-2005 as
shown in figure 5.2. As evident from the graph we can notice that there is an overall
trend of decreasing water discharges over the years. These figures indicate that the
flooding within the park has definitely decreased after the construction of the Ithezi-
tezhi dam.
Figure 5. 1-Mean monthly discharges at Nymba (pre Ithezi- thezi 1973 -77 and post
Itehzi-thezi 1979-83) (Courtesy- Mumba, 2003)
Figure 5. 2- Graph showing the water levels at Nymba from 1980- 2005.
This proves that there has been a change in flooding regime that affected the
ecological stability of the area .Though there has been many negative impacts due to
the construction of the dam one of the most prominent one in terms of ecological
significance is the change in the vegetation patterns and invasion by inedible shrubs
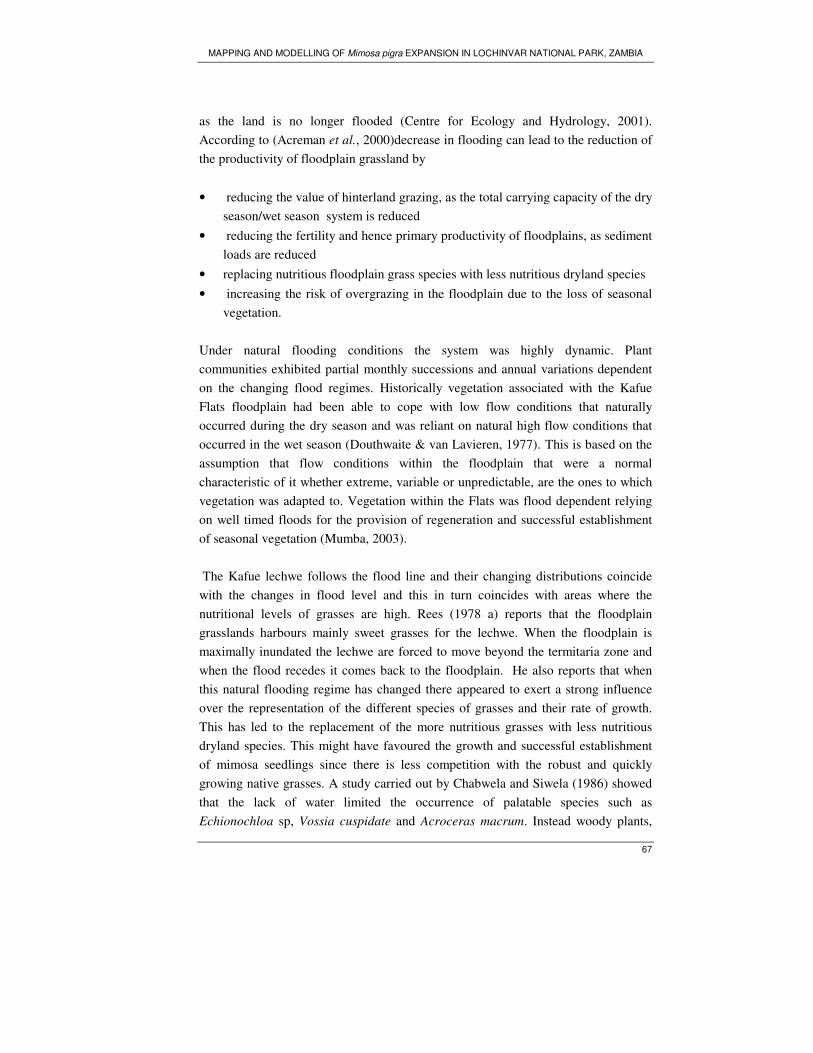
MAPPING AND MODELLING OF Mimosa pigra EXPANSION IN LOCHINVAR NATIONAL PARK, ZAMBIA
67
as the land is no longer flooded (Centre for Ecology and Hydrology, 2001).
According to (Acreman et al., 2000)decrease in flooding can lead to the reduction of
the productivity of floodplain grassland by
• reducing the value of hinterland grazing, as the total carrying capacity of the dry
season/wet season system is reduced
• reducing the fertility and hence primary productivity of floodplains, as sediment
loads are reduced
• replacing nutritious floodplain grass species with less nutritious dryland species
• increasing the risk of overgrazing in the floodplain due to the loss of seasonal
vegetation.
Under natural flooding conditions the system was highly dynamic. Plant
communities exhibited partial monthly successions and annual variations dependent
on the changing flood regimes. Historically vegetation associated with the Kafue
Flats floodplain had been able to cope with low flow conditions that naturally
occurred during the dry season and was reliant on natural high flow conditions that
occurred in the wet season (Douthwaite & van Lavieren, 1977). This is based on the
assumption that flow conditions within the floodplain that were a normal
characteristic of it whether extreme, variable or unpredictable, are the ones to which
vegetation was adapted to. Vegetation within the Flats was flood dependent relying
on well timed floods for the provision of regeneration and successful establishment
of seasonal vegetation (Mumba, 2003).
The Kafue lechwe follows the flood line and their changing distributions coincide
with the changes in flood level and this in turn coincides with areas where the
nutritional levels of grasses are high. Rees (1978 a) reports that the floodplain
grasslands harbours mainly sweet grasses for the lechwe. When the floodplain is
maximally inundated the lechwe are forced to move beyond the termitaria zone and
when the flood recedes it comes back to the floodplain. He also reports that when
this natural flooding regime has changed there appeared to exert a strong influence
over the representation of the different species of grasses and their rate of growth.
This has led to the replacement of the more nutritious grasses with less nutritious
dryland species. This might have favoured the growth and successful establishment
of mimosa seedlings since there is less competition with the robust and quickly
growing native grasses. A study carried out by Chabwela and Siwela (1986) showed
that the lack of water limited the occurrence of palatable species such as
Echionochloa sp, Vossia cuspidate and Acroceras macrum. Instead woody plants,
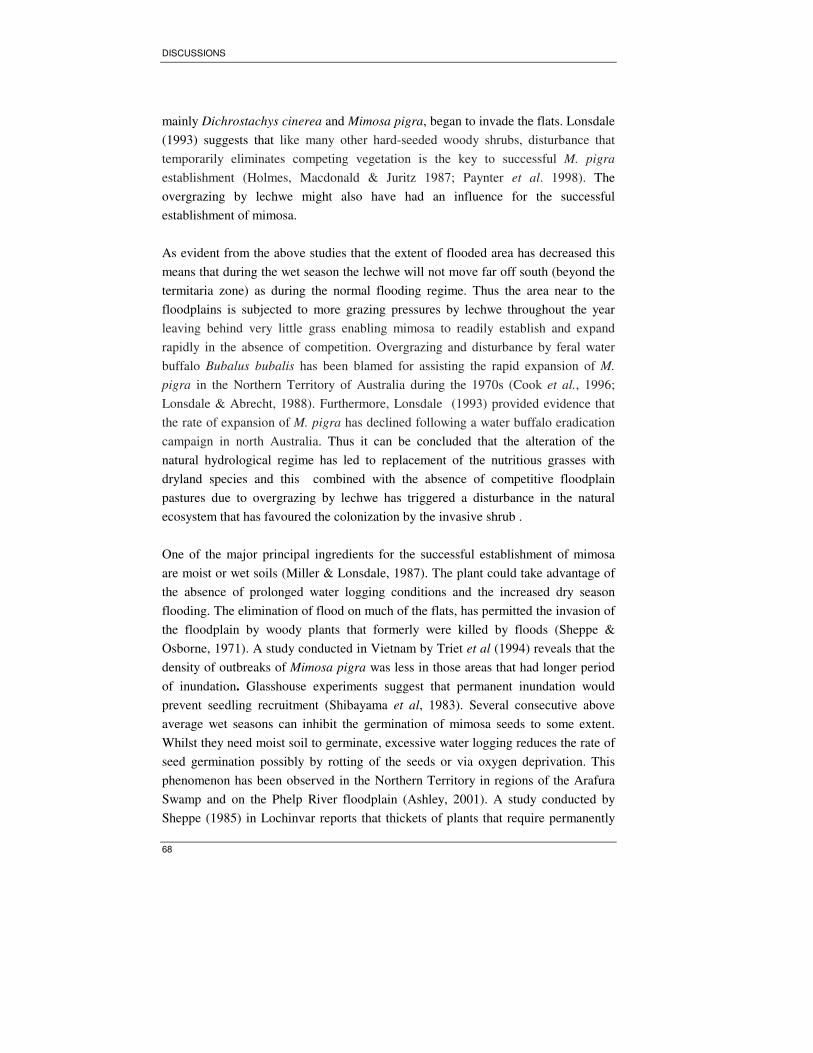
DISCUSSIONS
68
mainly Dichrostachys cinerea and Mimosa pigra, began to invade the flats. Lonsdale
(1993) suggests that like many other hard-seeded woody shrubs, disturbance that
temporarily eliminates competing vegetation is the key to successful M. pigra
establishment (Holmes, Macdonald & Juritz 1987; Paynter et al. 1998). The
overgrazing by lechwe might also have had an influence for the successful
establishment of mimosa.
As evident from the above studies that the extent of flooded area has decreased this
means that during the wet season the lechwe will not move far off south (beyond the
termitaria zone) as during the normal flooding regime. Thus the area near to the
floodplains is subjected to more grazing pressures by lechwe throughout the year
leaving behind very little grass enabling mimosa to readily establish and expand
rapidly in the absence of competition. Overgrazing and disturbance by feral water
buffalo Bubalus bubalis has been blamed for assisting the rapid expansion of M.
pigra in the Northern Territory of Australia during the 1970s (Cook et al., 1996;
Lonsdale & Abrecht, 1988). Furthermore, Lonsdale (1993) provided evidence that
the rate of expansion of M. pigra has declined following a water buffalo eradication
campaign in north Australia. Thus it can be concluded that the alteration of the
natural hydrological regime has led to replacement of the nutritious grasses with
dryland species and this combined with the absence of competitive floodplain
pastures due to overgrazing by lechwe has triggered a disturbance in the natural
ecosystem that has favoured the colonization by the invasive shrub .
One of the major principal ingredients for the successful establishment of mimosa
are moist or wet soils (Miller & Lonsdale, 1987). The plant could take advantage of
the absence of prolonged water logging conditions and the increased dry season
flooding. The elimination of flood on much of the flats, has permitted the invasion of
the floodplain by woody plants that formerly were killed by floods (Sheppe &
Osborne, 1971). A study conducted in Vietnam by Triet et al (1994) reveals that the
density of outbreaks of Mimosa pigra was less in those areas that had longer period
of inundation. Glasshouse experiments suggest that permanent inundation would
prevent seedling recruitment (Shibayama et al, 1983). Several consecutive above
average wet seasons can inhibit the germination of mimosa seeds to some extent.
Whilst they need moist soil to germinate, excessive water logging reduces the rate of
seed germination possibly by rotting of the seeds or via oxygen deprivation. This
phenomenon has been observed in the Northern Territory in regions of the Arafura
Swamp and on the Phelp River floodplain (Ashley, 2001). A study conducted by
Sheppe (1985) in Lochinvar reports that thickets of plants that require permanently
MAPPING AND MODELLING OF Mimosa pigra EXPANSION IN LOCHINVAR NATIONAL PARK, ZAMBIA
69
moist soil are becoming established along the shore of the new water bodies. Flow
disturbance is known to provide the stimulus for the establishment of opportunistic
plants particularly alien invasive species Rees (1978 c).
Mimosa seeds are dispersed mainly through water. Studies conducted by Lonsdale in
Australia suggest that one of the major factors contributing to the dramatic advance
by mimosa is flood waters. The seeds of mimosa can float on water for extended
periods (Miller et al 1981). Mimosa seeds are covered by hairy coats that help them
to float on water. The most heavily infested areas are along the watercourses such as
rivers, streams and areas that are affected by flooding. From the point of view of
mimosa expansion the most important feature of flooding is its horizontal extent –
the area covered, the length of the time that each part of the Park is under water.
The actual area liable to flooding is of prime importance for the establishment of
relationships between water level, water storage and extent of flooded area and plant
growth (Ellenbroek, 1951). But unfortunately no reliable data on these questions are
available though crude estimates of area flooded are available. This is because of the
complex pattern of advance of floods no single rate figure would be adequate.
Sheppe also reports that during the study it was observed that on one day the flood
was approaching its maximum extent at Lochinvar, the water was advancing up a dry
drainage channel at the rate of about a meter per hour, but at nearby point in a
steeper slope there was no perceptible advance in 24 hrs. In years of low floods the
river bank levees remain exposed, and the flood hardly reaches the termitaria but in
years of high floods the levees are covered though to a lesser extent and duration.
But generally during flooding the water spreads to eastern and the western sides of
the park beyond the termitaria zone because of the flat terrain leaving the small
portion of levees where the shrubs are found to be growing. This is because the
levees are higher in elevation by few cms which diverts the water to the sides of the
floodplain. A study conducted by Rees in 1978 reports that in levees the height
above the zero water level in is 0.5 and lower and those of the floodplains is 0.5 to
3.5.
b) Environmental conditions
There may be various environmental factors combined with other factors that have
contributed to the sudden expansion of mimosa. Mimosa is a drought resistant plant
and can withstand prolonged periods of dry conditions. Its seeds can remain active in
the ground for 10years and when favourable conditions come they can germinate
DISCUSSIONS
70
(Lonsdale, 1993). The metrological data of Lochinvar National Park indicates that
from a period of 1980 to 2005 the overall trend of rainfall pattern has been
decreasing but that of temperatures remain almost the same. This shows that the area
has been receiving lesser rainfall whilst the temperatures remaining high which
means that there has been a slight variation in the start and duration of local flooding
.This combined with the insufficient water release from the dam has contributed to
lesser extent of flooded area during the wet season and presence of moist conditions
during the dry season due to the regulated artificial water release from the dam have
added to the advantage of the expansion of woody invasive, Mimosa pigra. Mimosa
is found to tolerate wide range of soil and moisture conditions. It generally prefers
moist soil conditions and thrives well in seasonally inundated floodplains and during
dry season and is actually drought resistant (Miller et al, 1981).
c) Movement by animals and humans
In the park the winds generally tend to be from east, the dry months being the
windiest with August-September showing maximum velocities (Howard & Williams,
1982). Thus it is unlikely that mimosa seed have spread from the western end of the
park to the eastern end through wind dispersal.
The role of grazing animals in promoting plant invasions has been widely recognised
(Wilson et al, 1991). It is considered that another big factor that has contributed to
the spread of mimosa is through transport by animals especially the Kafue Lechwe.
Kafue Lechwe, a semi aquatic antelope is found in the floodplain grassland mostly
near the fringes of the lagoon where there is abundant grass. The movement of the
animal is marked by seasonal fluctuation related to the marked flooding cycle of the
Flats. This forces the Lechwe herds to annual cycle of movements and changes in
population density related to the availability of grazing. When the flood begins to
rise with the onset of rains, the male and the female herds starts migrating from the
lower lying areas (Sheppe & Osborne, 1971).
The seed pods of mimosa are covered with bristles that enable them to adhere to
these animals and this greatly helps to transport the seeds to far off places. Studies
conducted by Lonsdale and Abrecht (1988) in Australian wetlands reveal that many
of the outbreaks is due to the movement of vehicles and large mammals. These
factors can be responsible for outbreaks up to 80kms away from the large stands of
Mimosa pigra. Water birds can also be responsible for the dispersal of the seeds to
some of the remote sites.
MAPPING AND MODELLING OF Mimosa pigra EXPANSION IN LOCHINVAR NATIONAL PARK, ZAMBIA
71
5.4. Ecology of the invasive
Mimosa pigra was reported in the Park by Anon as early as 1958 in the FAO
publications of Ecology of the Kafue River Basins, Volume III. As mentioned earlier it
has shown up as sings to be an invasive only in the 1990s which means that over 40
years though it has been spreading it did not appear to be invading the area. There are
various factors contributing to the explosion of mimosa growth after this period but
from ecological point of view this may be considered as one of the phases of plant
invasion by woody aliens.
The plant invasion process for any invasive occurs in three phases: Introduction,
colonization and naturalization (Groves 1986). Although some invasive species
experiences rapid population growth, most of the invasives have a long lag time
between the initial introduction and subsequent population growth (Dayton, 1971).
Investigation of the population dynamics and ecology of mimosa invasion is yet another
study and is beyond the scope of this research. It is interesting to examine whether a
change in the natural flooding regime is only phenomenon to be blamed for the rapid
colonisation of the species or whether it is the inherent characteristic of the invasive to
explode into the area after passing the initial lag phase. The probable reason might be
that after the introduction and initial lag phase of 40 years was over it switched on to
the next phase of colonising the area where it could take advantage of the disturbances
caused due to the alteration of the natural flooding regime. A description of the
mechanism of the invasion by the invasive shrub into the area from an ecological point
of view is provided in appendix 4.
DISCUSSIONS
72
5.5. Analysis of Markov model
The next objective of this study was to examine if a stochastic modelling process like
Markov analysis could help in predicting the expansion of Mimosa pigra in future.
As mentioned in section 1.4 in pg 11 for predicting a land cover change in future
with this method the phenomenon under consideration should fulfill the assumptions
of markov chain analysis. So the first step towards this was to prove that if the land
cover changes between any two years are dependent or not and if they are whether
the changes that had occurred between the two decades are markovian or not. For
this it was necessary to prove that the land cover changes between any two years are
dependent. This is because the first assumption of markov chain is that the prediction
of land cover to the future depends only in state of the preceding land cover. Hence
its necessary to prove the dependency of any two land cover images. The results of
Karl Pearsons test for independence showed a very high value for all the land cover
maps of 1984-94, 1994-2005 and 1984-2005 thus proving that there is very high
dependency between them. Therefore in all the three cases the null hypothesis of
independency was rejected.
The next step was to test for Markovian dependence in order to examine whether the
land cover changes between 1984-94 and 1994 -2005 has followed the same pattern
and whether these changes recorded could be used to predict the invasion of Mimosa
pigra into new areas in the future. As mentioned in in section 4.4.2 pg 58 K square
tests was performed for the land cover changes between 1984-2005 using the land
cover image of 1994 to compute the expected values. It was found that the computed
value was much higher than the critical value which leads to the rejection of the null
hypothesis that there is markovian dependence. Since it has been proved that the
land cover change process at Lochinvar did not follow a markovian pattern the
extrapolation to the future may not be reliable.
The test of significance was done for each cover class to prove if there has been
statistical difference in the proportions of the various land cover classes. It was found
that there was significant difference in all the classes of interest viz grassland, open
mimosa and dense mimosa. The next question to be addressed was why markov
analysis was not found to be suitable to predict the land cover changes. There are
several reasons to this .One is the limitation of the model itself which is discussed in
the next section in detail. The second reason is that the changes in land cover during
MAPPING AND MODELLING OF Mimosa pigra EXPANSION IN LOCHINVAR NATIONAL PARK, ZAMBIA
73
this span of 20 years so abrupt especially during the last decade that a model like
markov cannot account for since it violates the basic assumption of markov model.
5.6. Limitations of the model
There are several limitations to this model since it makes some restrictive
assumptions. The computations have established that the land cover changes that has
occurred in Lochinvar National Park in the past 20 years with respect to mimosa
infestation does not follow a uniform pattern of growth hence the prediction to the
future with respect to mimosa infested areas are not dependent on that of preceding
years. This is evident on comparing the results of transition probabilities of markov
transition matrices of 1984-94 and 1994-2005. This can be further proved by the
markov conditional probability images depicting the spatial extent of open mimosa
and grasslands predicted in 2005 based on the land cover changes in 1984-94.
In this study it was found that on comparison of the predicted and the actual spatial
extent of the two classes the prediction by markov analysis highly underestimates the
area likely to be infested by Mimosa pigra in 2005. This is because according to
Markov first order dependence the projection of the future behavior in terms of
probabilities depends entirely upon the property of stationarity and the state of the
preceding year. Various studies in Australia have revealed that rate of mimosa
expansion does not follow a regular pattern every year. In certain years the
infestation doubles every year where as other years it remains passive. This means
that the phenomenon of mimosa invasion between 1984-2005 (1984-94 and 1994-
2005) is not compatible with the Markov first order dependence.
The Markov chain is said to be stationary or homogeneous in time when the
transition probabilities depend only on the time interval t, and if the time period at
which the process is examined is of no relevance, (Karlin & Taylor, 1975). The
simplest way of understanding the concept of stationarity is to cast it in terms of
homogeneity in time, or temporal homogeneity. Thus, a Markov process whose
probabilities are identical for two periods of elapsed time of the same duration
occurring at different points in time is said to be temporally homogeneous (Bell &
Hinojosa, 1976). Alternatively, its transition probabilities are said to be constant for
any given period of elapsed time whenever the period may occur. For example if we
compare the transition probability of the class grassland to open mimosa for the
years 1984-94 projected to 2005 and 1994-2005 projected to 2015 we find it to be
DISCUSSIONS
74
4% and 53% respectively. It is evident from this huge difference of predicted
transition probabilities between the two decades that the process is not temporally
homogenous. A temporally homogeneous process is stationary when the
(unconditional) probabilities of the system being in the different states at future
points in time are constant (Bell & Hinojosa, 1976). In this research the process of
stationarity was not proved by statistical analysis because it was beyond the scope of
this study. The problem of determining whether a given phenomenon is a stationary
Markov process is not a simple one and involves careful mathematical analysis (Bell
& Hinojosa, 1976). Moreover it was evident that the process of land cover change
was not markovian hence there was no point in testing whether the process is
stationary or not since it has already violated the first assumption of markov
According to this model the land use at any time, given all previous uses at earlier
times, depends at most upon the most recent use and not upon any earlier ones.
Markov property asserts that at points of change along these paths the earlier land
uses do not guide the future use (Bell, 1974). Markov property states that if it is
appropriate to regard land cover change as a stochastic random phenomenon, the
markov property states that the past land cover change is not a guide to the future
land cover if the present land cover is known. This means that if a land is now in use
for open mimosa was formerly grassland the probability of its conversion to dense
mimosa depends not the slightest upon its earlier use grassland but only on open
mimosa. This has been proved wrong when we examine the cross tabulation results,
markov matrix and conditional probability images of 1994-2005. We find that in
1984 and 94 the class dense mimosa was not identified but in 2005 this class was
identified.
The results prove that the transition to class dense mimosa is contributed from
classes grasslands and open mimosa. This may be because the changes that took
place during those 10 years were so rapid that markov property could not account
for. These models are difficult to accommodate higher order effects. Baker (1989)
suggests that these effects can be modeled by redefining the state space so that new
states are defined by both present and preceding states. A second order model, for
instance, would include m2
states instead of m states in a first order mode. Similarly
when the land cover change was predicted to 2005 we find that according to markov
the probability of grasslands to remain as grasslands in 2005 is as high as 81%.and
the probability of open mimosa to invade grasslands is only 4%. But it is evident
from the classified land cover image of 2005 that this is not true. Hence
MAPPING AND MODELLING OF Mimosa pigra EXPANSION IN LOCHINVAR NATIONAL PARK, ZAMBIA
75
This model is based on pure statistical processes and does link directly to any
biological mechanism (Lambin, 1994). The result from this study has proved that the
wetland ecosystem is highly dynamic. One of the biggest drawback is that influence
of exogenous and endogenous variables to the transitions, cannot be incorporated
into the model so that land cover change process can be understood (Weng, 2002).
As discussed earlier the spread of mimosa depends to a great extent on the pattern of
flooding and its extent and other factors such as soil and geomorphology. The
markov model does not take into account any of these variables. Thus for such a
dynamic environment which involves complex processes the predictive power of the
model would not be suitable. Another big drawback of the model that is evident
from the results is that spatial dependence of transitions is not accounted for in
simple transition model such as Markov chain.
Management of Mimosa pigra
Despite the acknowledged potential effects of mimosa invasion on native flora and
fauna in Lochinvar National Park very little effort has been put so far to control the
expansion of mimosa infested areas. It is clear beyond doubt that Mimosa pigra is an
enormous problem posing threat to the biologically diverse and unique wetlands. Yet
so far there has been no study related to the growth, spread patterns and management
of the invasive alien. So far the only major weed control programme was undertaken
in 2004 where there was a mechanical removal operation of a stretch of 0.8ha of
mimosa infested areas along the fringes of the lagoon. This was done because
mimosa was expanding to the roads which interfered with the frequent movement of
vehicles of the park management staff and the tourists. If mimosa is introduced to the
area, the prevention of spread is the next priority.
Efforts to prevent the spread of the invasive to new areas generally focus on the
control of major infestations, but these efforts are generally unsuccessful (Cook et
al., 1996). A detailed discussion on the available management options for the control
of mimosa within the Park is beyond the scope of this research. Major projects are
being undertaken this year through the joint collaboration between the
Environmental Council of Zambia, IUCN and Zambian Wildlife authority for the
effective control of the spread of the invasive alien. As with most of the invasives the
three options available for the preventing the spread of mimosa is through
mechanical, chemical or biological control. The Australian Weed Management
Committee has come with various control options to tackle the problem of mimosa
invasion as shown in table 5.1. Cook et al in his study describes that until biocontrol
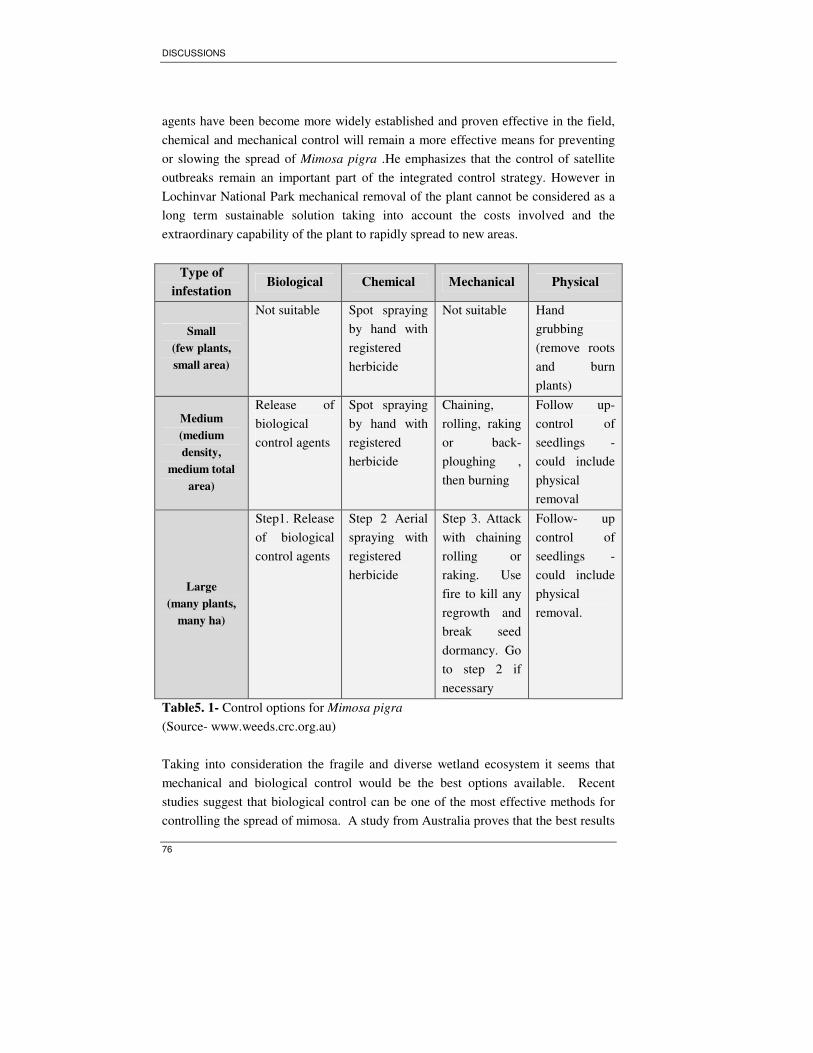
DISCUSSIONS
76
agents have been become more widely established and proven effective in the field,
chemical and mechanical control will remain a more effective means for preventing
or slowing the spread of Mimosa pigra .He emphasizes that the control of satellite
outbreaks remain an important part of the integrated control strategy. However in
Lochinvar National Park mechanical removal of the plant cannot be considered as a
long term sustainable solution taking into account the costs involved and the
extraordinary capability of the plant to rapidly spread to new areas.
Type of
infestation Biological Chemical Mechanical Physical
Small
(few plants,
small area)
Not suitable Spot spraying
by hand with
registered
herbicide
Not suitable Hand
grubbing
(remove roots
and burn
plants)
Medium
(medium
density,
medium total
area)
Release of
biological
control agents
Spot spraying
by hand with
registered
herbicide
Chaining,
rolling, raking
or back-
ploughing ,
then burning
Follow up-
control of
seedlings -
could include
physical
removal
Large
(many plants,
many ha)
Step1. Release
of biological
control agents
Step 2 Aerial
spraying with
registered
herbicide
Step 3. Attack
with chaining
rolling or
raking. Use
fire to kill any
regrowth and
break seed
dormancy. Go
to step 2 if
necessary
Follow- up
control of
seedlings -
could include
physical
removal.
Table5. 1- Control options for Mimosa pigra
(Source- www.weeds.crc.org.au)
Taking into consideration the fragile and diverse wetland ecosystem it seems that
mechanical and biological control would be the best options available. Recent
studies suggest that biological control can be one of the most effective methods for
controlling the spread of mimosa. A study from Australia proves that the best results
MAPPING AND MODELLING OF Mimosa pigra EXPANSION IN LOCHINVAR NATIONAL PARK, ZAMBIA
77
are obtained when the bio control agents are released at the commencement of
mimosa control because these agents require along time to be effective. All parts of
the plant — the seeds, flowers, leaves, tips, branches and roots — have been targeted
with at least one biological control species. So far, 13 agents (insects and fungi) have
been released. Four of these species have become effective in controlling mimosa by
reducing seed production and the size of the seed bank, and occasionally killing adult
plants (CSIRO, 2002). In the long term biocontrol on its own offers the only cost-
effective control option for treating very large infestations of mimosa because of the
high costs of chemicals, machinery and labour. However, the present biocontrol
agents are very slow acting and may provide effective control only after several
decades. Studies by Triet T et al (2004) in Thailand showed that for heavily infested
areas, strategic weed control programs, employing a combination of several
techniques each targeting a specific life date of mimosa have been recommended).
Another possible approach would be to encourage the use of mimosa biomass by
local communities.
In Mekong Delta, mimosa were used as fuel wood. There are also successful
experiments on the use of mimosa biomass as mushroom growing medium and to
produce foods for goats from young mimosa stems (Triet et al ,2004). There
remains a tough task ahead for the planners so as to explore the best options
available for mimosa control within the park and how to prevent the spread of alien
invasive to the remaining valuable wetlands. Various studies conducted in Australia
has shown that sowing of competitive pastures have assisted in controlling the
immature mimosa stands. However for dense and mature stands this measure might
not be suitable because of the lack of light and nutrients.
However in Lochinvar National Park the root cause of the problem has been
identified as the artificial flooding regime which has affected the hydrological
balance and the vegetation structure favouring the growth of the invasive. If the
natural flooding regimes are brought back it might be effective to control the rapid
spread of mimosa to a certain extent. As mentioned earlier though mimosa
withstands water logging conditions for long period the rate of growth and the seed
production is found to slow down to a great extent. But taking into account the
current status of widespread distribution of mimosa within the Park and the
enormous capability of the plant to invade new areas the question remains whether
mimicking the natural flooding alone would solve the problem of mimosa
eradication. Moreover if the plant is in its explosive growth phase little can be done
to prevent the further spread through the natural flooding regime.
CONCLUSIONS AND RECOMMENDATIONS
78
6. Conclusions and Recommendations
6.1. Conclusions
The study demonstrated that using multitemporal datasets from LANDSAT and
ASTER it was possible to map the extent of Mimosa pigra and observe the patterns
of expansion of the invasive alien in Lochinvar National Park, Zambia from 1984-
2005. The study helped to answer the following research questions.
Research Question 1: Which of the datasets available enables a better
identification of mimosa growing areas?
When compared to LANDSAT and ASTER datasets used for the study, ASTER
proves to be better for delineating the mimosa infested areas.
Research Question 2: Which of the image classification methods is optimal for
mimosa delineation?
Maximum Likelihood Classification was found to be the optimal method for mimosa
delineation
Research Question 3: What is the optimal number of land cover classes to
distinguish mimosa growing areas?
5 land cover classes were required for clearly distinguishing the mimosa infested
areas. They are Water, Grasslands, Open mimosa, Shrubs and Dense Mimosa
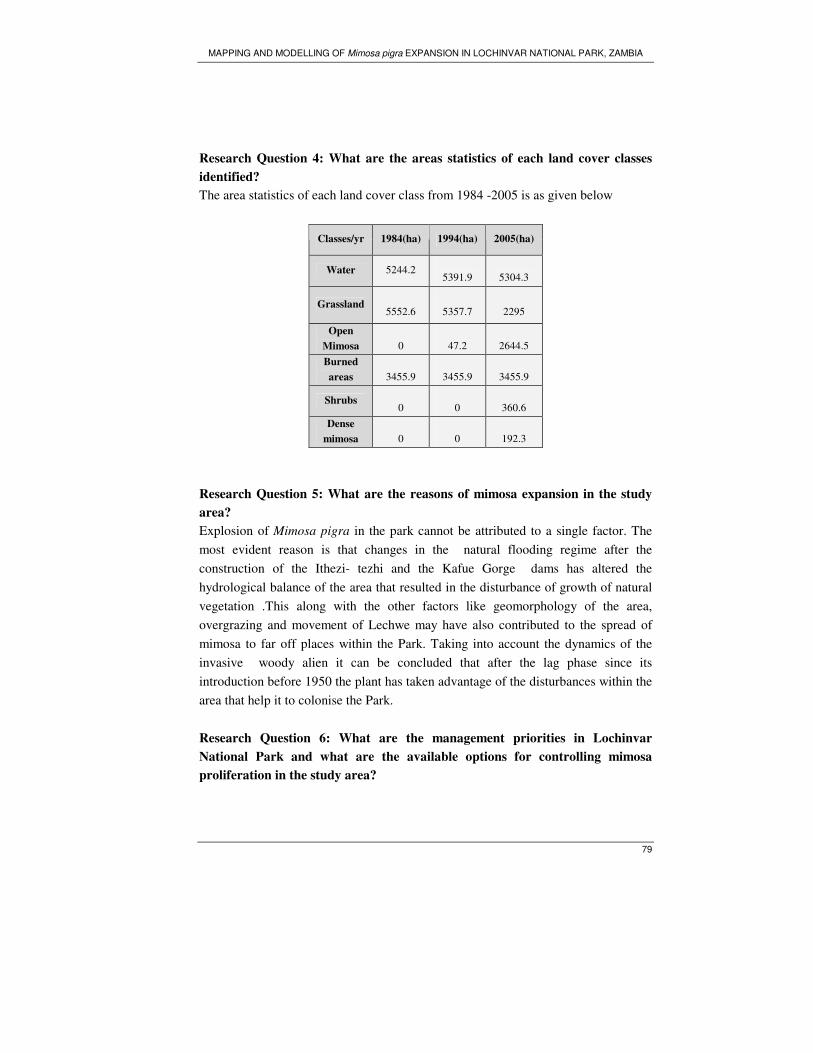
MAPPING AND MODELLING OF Mimosa pigra EXPANSION IN LOCHINVAR NATIONAL PARK, ZAMBIA
79
Research Question 4: What are the areas statistics of each land cover classes
identified?
The area statistics of each land cover class from 1984 -2005 is as given below
Classes/yr 1984(ha) 1994(ha) 2005(ha)
Water 5244.2
5391.9
5304.3
Grassland
5552.6
5357.7
2295
Open
Mimosa
0
47.2
2644.5
Burned
areas
3455.9
3455.9
3455.9
Shrubs
0
0
360.6
Dense
mimosa
0
0
192.3
Research Question 5: What are the reasons of mimosa expansion in the study
area?
Explosion of Mimosa pigra in the park cannot be attributed to a single factor. The
most evident reason is that changes in the natural flooding regime after the
construction of the Ithezi- tezhi and the Kafue Gorge dams has altered the
hydrological balance of the area that resulted in the disturbance of growth of natural
vegetation .This along with the other factors like geomorphology of the area,
overgrazing and movement of Lechwe may have also contributed to the spread of
mimosa to far off places within the Park. Taking into account the dynamics of the
invasive woody alien it can be concluded that after the lag phase since its
introduction before 1950 the plant has taken advantage of the disturbances within the
area that help it to colonise the Park.
Research Question 6: What are the management priorities in Lochinvar
National Park and what are the available options for controlling mimosa
proliferation in the study area?
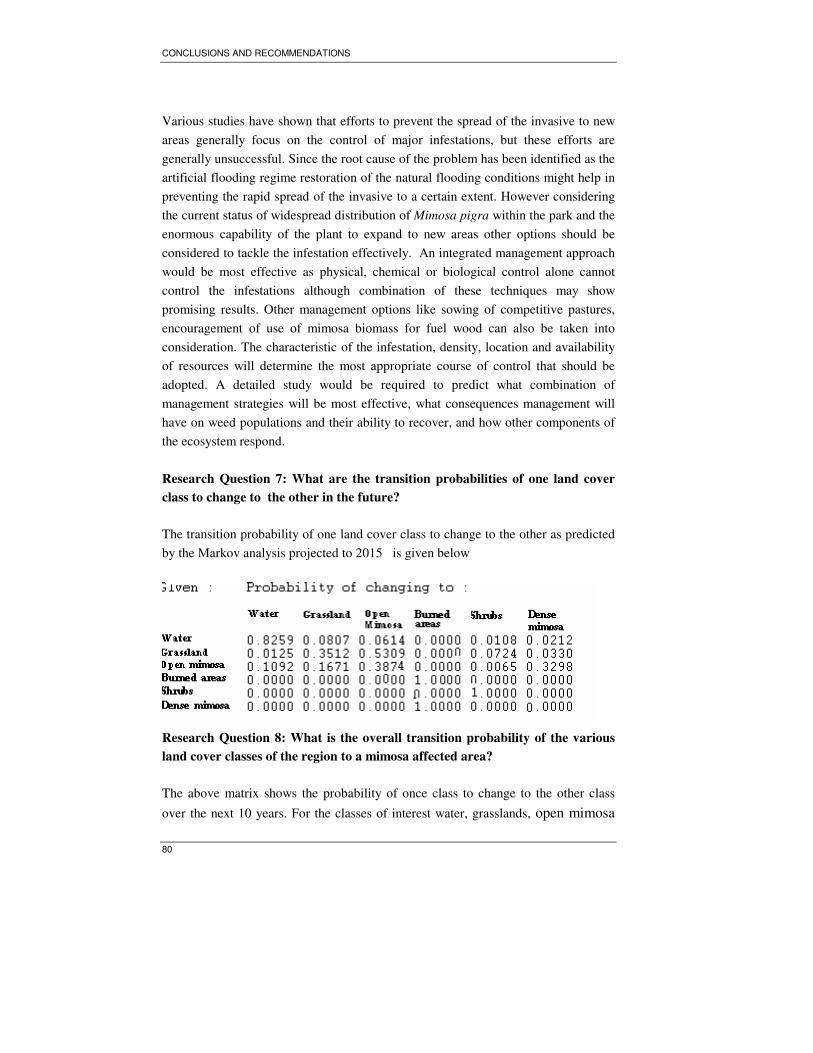
CONCLUSIONS AND RECOMMENDATIONS
80
Various studies have shown that efforts to prevent the spread of the invasive to new
areas generally focus on the control of major infestations, but these efforts are
generally unsuccessful. Since the root cause of the problem has been identified as the
artificial flooding regime restoration of the natural flooding conditions might help in
preventing the rapid spread of the invasive to a certain extent. However considering
the current status of widespread distribution of Mimosa pigra within the park and the
enormous capability of the plant to expand to new areas other options should be
considered to tackle the infestation effectively. An integrated management approach
would be most effective as physical, chemical or biological control alone cannot
control the infestations although combination of these techniques may show
promising results. Other management options like sowing of competitive pastures,
encouragement of use of mimosa biomass for fuel wood can also be taken into
consideration. The characteristic of the infestation, density, location and availability
of resources will determine the most appropriate course of control that should be
adopted. A detailed study would be required to predict what combination of
management strategies will be most effective, what consequences management will
have on weed populations and their ability to recover, and how other components of
the ecosystem respond.
Research Question 7: What are the transition probabilities of one land cover
class to change to the other in the future?
The transition probability of one land cover class to change to the other as predicted
by the Markov analysis projected to 2015 is given below
Research Question 8: What is the overall transition probability of the various
land cover classes of the region to a mimosa affected area?
The above matrix shows the probability of once class to change to the other class
over the next 10 years. For the classes of interest water, grasslands, open mimosa
MAPPING AND MODELLING OF Mimosa pigra EXPANSION IN LOCHINVAR NATIONAL PARK, ZAMBIA
81
and dense mimosa we find that the probability of water to change to class open
mimosa and dense mimosa is 6% and 2% respectively. The probability of grasslands
to remain as grasslands in the next 10 years is only 35% but the probability to change
to open mimosa and dense mimosa as high as 53% and3 % respectively. Similarly
for the class open mimosa the probability to remain in the same class after 10 years is
38% and the probability to change to class dense mimosa is 32%.and for class dense
mimosa the probability to remain in the same class is 100%.
6.2. Recommendations
This study has proved that there is ample scope for further research into the matter.
The following suggestions can be taken into account
A) A detailed study should be done to analyse how the flooding regime has actually
changed within the Park since the construction of the Ithezi –tezhi and the Kafue
Gorge dams. Though it has been stated that the flooding patterns have changed there
is lack of data regarding what was the extent of flooded area before and after the
construction of dams, how has it changed, what is the rate of flow of water, depth of
flooding and direction of flooding. Satellite imagery such as NOAA/AVHRR and
Radar can be promising tools to analyse the spatial extent and the temporal pattern of
flooding within the Park.
B) Further studies should be conducted relating to the change of vegetation patterns
within the Park in response to the hydrological imbalances created after the
construction of the Ithezi tezhi and Kafue Gorge dam. There is lack of information
regarding the quality of grasslands and the grazing pattern of lechwe during the pre
dam and post dam periods. This will provide an insight of how exactly the overall
change in the vegetation structure and grazing patterns has favoured the growth of
the invasive alien.
C) Further studies can take into consideration whether Markov chain can be used for
the prediction of species that do not expand as rapidly as in case of Mimosa pigra.
Studies by Gennet (personal communication, 2007) shows that shrubs have been
spreading the park over the years but at a much slower rate. Markov chain may
prove to be a useful tool to model the spread of steadily growing shrub species and
invasives rather than species like mimosa which exhibits an explosive and sporadic
growth pattern. This study has only analysed the dependence between the present

CONCLUSIONS AND RECOMMENDATIONS
82
land cover changes with respect to its previous land cover changes (first order
markov process). Higher order markov chains can incorporate a number of time lags
in the preceding years which would determine the prediction of the land cover
changes to the future. This involves complex mathematical computations but will be
helpful to provide better information regarding the probability of transition from one
cover class to the other in the future.
MAPPING AND MODELLING OF Mimosa pigra EXPANSION IN LOCHINVAR NATIONAL PARK, ZAMBIA
83
7. References
Acreman, M.C., Fraquharson, F.A.K., McCartney, M.P., Sullivan, C., Campbell, K.,
Hodgson, N., Morton, J., Smith, D., Birley, M., Knott, D., Lazenby, J.,
Wingfield, R., & Barbier, E.B. (2000). Managed flood releases from
reservoirs: issues and guidance - Report to DFID and the World
Commission on Dams. Center for Ecology and Hydrology, Wallingford,
UK.
Ashley M 2003. Mimosa pigra – practical solutions to an economic problem. In Wise
use of wetlands in northern Australia: Grazing management in wetlands
and riparian habitats.eds Myers B, McKaige M, Whitehead P & Douglas
M, Proceedings of a workshop held in Darwin, Northern Territory,
Australia, 2–4 October 2001, Centre for Tropical Wetlands Management,
Northern Territory University, Darwin, 52–54.
Aspinall, R.A. (2004) Modelling land use change with generalized linear models—a
multi-model analysis of change between 1860 and 2000 in Gallatin Valley,
Montana. Journal of Environmental Management, 72, 91-103.
Austin, M.P. (2002) Spatial prediction of species distribution: an interface between
ecological theory and statistical modelling. Ecological Modelling, 157, 101-
118.
Austin, M.P. & Belbin, L. (1981) An analysis of succession along an environmental
gradient using data from a lawn. Vegetatio, 47, 201-211.
Baker, W.L. (1989) A review of models of landscape change Landscape Ecology, 2,
111-133.
Balzter, H. (2000) Markov chain models for vegetation dynamics Ecological
Modelling, 126, 139-154.
Bambaradeniya, C.N.B. (2002) The status and implications of invasive alien species
in Sri Lanka. Zoos' Print Journal, 17, 930-935.
REFERENCES
84
Bell, E.J. (1974) Markov Analysis of Land Use Change -An Application of
Stochastic Processes to Remotely Sensed Data. Socio Economic Planning
Sciences 8, 311-316.
Bell, E.J. & Hinojosa, R.C. (1976) Markov analysis of land use change:Continuous
time and stationary processes. Socio- Economic Planning Sciences, 11, 13-
17.
Bell, E.J. & Hinojosa, R.C. (1977) Markov analysis of land use change:Continuous
time and stationary processes. Socio- Economic Planning Sciences, 11, 13-
17.
Binkley, C.S. (1980) Is Succession in Hardwood Forests a Stationary Markov
Process? Forest Science 26, 566-570.
Bourne, L.S. (1976) Monitoring change and evaluating the impact of planning policy
on urban structure : a markov chain experiment Plan Canada, 5-14.
Bowen, G.W. and Burgess, R.L. 1981. A quantitative analysis of forest island pattern
in selected Ohio landscapes. ORNL/ TM-7759. Oak Ridge National
Laboratory, Oak Ridge, Tennessee.
Briassoulis, H., 2000. Analysis of Land Use Change: Theoretical and Modelling
Approaches. The Web Book of Regional Science. Regional Research Institute,
West Virginia University, Morgantown, WV. (Online at
http://www.rri.wvu.edu/regscweb.htm)
Braithwaite, R.W., Lonsdale, W.M., & Estbergs, J.A. (1989) Alien vegetation and
native biota in tropical Australia: the impace of Mimosa pigra. Biological
Conservation, 48, 189-210.
Brown, D.G., Pijanowski, B.C., & Duh, J.D. (2000) Modeling the relationships
between land use and land cover on private lands in the Upper Midwest,
USA. Journal of Environmental Management, 59, 247-263.
Brown, L.A. (1970) On the Use of Markov Chains in Movement Research.
Economic Geography 46, 393-403.
Burgess, R.L. & Sharpe, D.M. (1981) Forest island dynamics in man-dominated
landscapes Springer- Verlag New York
MAPPING AND MODELLING OF Mimosa pigra EXPANSION IN LOCHINVAR NATIONAL PARK, ZAMBIA
85
Byers, J.E., Reichard, S., Randall, J.M., Parker, I.M., Smith, C.S., Lonsdale, W.M.,
Atkinson, I.A.E., Seastedt, T.R., Williamson, M., Chornesky, E., & Hayes,
D. (2002) Directing research to reduce the impacts of nonindigeneous
species. Conservation Biology, 16, 630-640.
Campbell, K. (2002) Introduction to Remote Sensing 3rd edn. Taylor and Francis
London
Centre for Ecology and Hydrology (CEH). 2001. Managed Flood Releases: A
working conference on guidelines for managed flood releases and lessons
learned from Itezhi-tezhi. Lusaka 13-14 March 2001. Workshop Report
Chabwela, H.N.W. & Mumba, W. (1998). Integrating water conservation and
population strategies on the Kafue Flats. In Water and Population
Dynamics (eds A. de Sherbinin & V. Dompka). American Association for
the Advancement of Science, Washington D.C, USA.
Chabwela, H.N and Siwela, A.S. 1986, In press. The Vegetative Structure of the
Kafue Flats North Bank after the Construction of the Dams. Proc.
EWRS/AAB 7th Symposium on Aquatic Weeds
Clarke, K.C. & Gaydos, L. (1998) Loose couling a cellular automaton model and
GIS :long term urban growth prediction for San Francisco and
Washington?Blatimore International journal of Geographical Information
Science, 12, 699-714.
Clarke, K.C., Hoppen, S., & Gaydos, L. (1997) A self modifying cellular automaton
model of historical urbanisation in the San Francisco Bay area Environment
and Planning B: Planning and Design 24.
Cook, G.D., Setterfield, S.A., & Maddison, J.P. (1996) Shrub invasion of a tropical
wetland: implications for weed management Ecological Applications 6,
531-537.
Cooksey, D. & Sheley, R.L. (1997) Noxious weed survey and mapping system
Rangelands, 19, 20-23.
CRC Weed Management (2003), Weeds of National Significance: Weed
Management Guide of Mimosa pigra. Accessed 1st November, 2006 from
REFERENCES
86
http://www.environment.gov.au/biodiversity/invasive/publications/pubs/m-
pigra.pdf
Crooks, K.R. & Soule, M.E. (1999) Mesopredator release and avifaunal extinctions
in a fragmented system Nature, 400, 563-566.
CSIRO. 2002. Mimosa under attack. Global Net News.com.
http://ausissues.com/ausissues/
AINews.nsf/0/DE44CB72D21850A6CA256C1000169466
Dayton, P.K. (1971) Competition, disturbance and community organization: the
provision and subsequent utilization of space in a rocky intertidal
community Ecological Monographs, 41, 351-389.
Douthwaite, R.J. & van Lavieren, L.P. (1977). A description of the vegetation of
Lochinvar National Park, Zambia - Technical Report 34. National Council
for Scientific Research, Lusaka, Zambia.
Fanshawe, D.B (1971). The Vegetation of Zambia For. Res. Bull. No.7. Govt
Printer, Lusaka , ppiv+67
Feller, W. (1968) An introduction to probability theory and its applications 3rd edn.
John Wiley and Sons New York
Fischer, G. & Sun, L. (2001) Model based analysis of future land-use development in
China. Agriculture, Ecosystems and Environment, 85, 163-176.
Forman, R.T.T. & Godron, M. (1986) Landscape Ecology John Wiley & Sons New
York.
Ellenbroek, G.R. (1951). Ecology and Productivity of an African Wetland System:
The Kafue Flats, Zambia,. PhD Thesis, W.Junk Publishers.
ERDAS. (2001).ERDAS Field Guide, 7th
edition (Leica Geosystems GIS and
Mapping), LLC
Geohegan, J., Wainger, L.A., & Bockstael, N.E. (1997) Spatial landscape indices in
a hedonic framework: an ecological economics analysis using GIS
Ecological Economics 23, 251-264.
MAPPING AND MODELLING OF Mimosa pigra EXPANSION IN LOCHINVAR NATIONAL PARK, ZAMBIA
87
Ghersa, C.M., Roush, M.L., & Radosevich, S.R. (1994) Coevolution of
agroecosystems and weed management: Weed management practices have
become closely linked to social and economic rather than biological factors
BioScience 44, 85-94.
Grime JP (1979) Plant strategies and vegetation processes. Wiley, Chichester
Groves, R.H. (1986) Plant invasions of Australia: an overview. In Groves, R.H. &
Burdon, J.J. (Eds) Ecology of biological invasions: an Australian
perspective, pp. 137-149. Australian Academy of Science, Canberra
Guisan, A. & Zimmermann, N.E. (2000) Predictive habitat distribution models in
ecology Ecological Modelling, 135, 147-186.
Higgins, S.I., Richardson, D.M., & Cowling, R.M. (1999) Predicting the landscape-
scale distribution of alien plants and their threat to plant diversity.
Conservation Biology, 213, 303-313.
Hill, D., Coquillard, P., de Vaugelas, J., & Meinesz, A. (1998) An algorithmic model
for invasive species: Application to Caulerpa taxifolia (Vahl) C. Agardh
development in the North-Western Mediterranean Sea. Ecological
Modelling, 109, 251-265.
Holmes PM Macdonald IAW & Juritz JM 1987. Effects of clearing treatment on
seed banks of the alien invasive shrubs Acacia saligna and Acacia cyclops
in the southern and south-western Cape, South Africa. Journal of Applied
Ecology 24:1045-1051.
Holway, D.A., Suarez, A.V., & Case, T.J. (1998) Loss of intraspecific aggression in
the sucess of a widespread invasive social insects Science 282, 949-952.
Horn, H. S. 1975 a. Markovian process o f forest succession Ecology and evolution
of communities (M. L. Cody and J. M. Diamond, eds), p 196-213. Belknap
Press, Cambridge, Mass. 545 p.
Horn, H. S. 1975b. Forest succession. Sci Am 231:91-98.
Howard, G.W. and Williams, G.J., Eds. 1982. Proceedings of the National seminar
on Environment and Change: The consequences of hydroelectric power
REFERENCES
88
development on the utilization of the Kafue Flats, Lusaka, April, 1978.
KRBC, University of Zambia, Lusaka.
Humphries, S.E., Groves, R.H. & Mitchell, D.S. (1991) Plant invasions of Australian
ecosystems: a status review and management directions. Australian National
Parks and Wildlife Service, Canberra.
Idrisi (2006), Idrisi Help Manual, Clark Labs, Clark University
IUCN (2004). An Evaluation of the Impact of Invasive Weeds on Important
Migratory Waterbirds Sites and their Rehabilitation : The Case of Kafue
Flats, Techincal Report, University of Zambia, Zambia.
Jahan, S. (1986) The determination of stability and similarity of Markovian land use
change processes:a theoretical and empirical analyses Socio Economic
Planning Sciences, 20, 243-251.
Janzen, D.H. (1983) Mimosa pigra, Costa Rican Natural History University of
Chicago Press, Chicago
Joshi, C., de Leeuw, J., van Andel, J., Skidmore, A.K., Lekhak, H.D., van Duren,
I.C., & Norbu, N. (2006) Indirect remote sensing of a cryptic forest
understorey invasive species. Forest Ecology and Management, 225, 245-
256.
Karlin, S. & Taylor, H.M. (1975) A First Course in Stochastic Processes, 2nd edn.
Academic Press, New York.
Krummel, J.R., Gardner, R.H., Sugihara, G., & O'Neill, R.V. (1987) Landscape
patterns in a disturbed environment Oikos 48, 321-324.
Lambin, E. F., 1994, Modelling deforestation processes: a review. TREES series B:
Research Report 1, European Commission, EUR 15744 EN.
Landis, J.D. (1994) The California urban future model: a new - generation of
metropolitan simulation- models. Environment and Planning B, 21.
Lawrence, R.L. & Ripple, W.J. (1999) Calculating Change Curves for Multitemporal
Satellite Imagery: Mount St. Helens 1980–1995. Remote Sensing of
Environment, 67, 309-319.
MAPPING AND MODELLING OF Mimosa pigra EXPANSION IN LOCHINVAR NATIONAL PARK, ZAMBIA
89
Leak, W.B. (1970) Successional change in northern-hardwoods predicted by birth
and death simulations Ecology, 51, 794-801.
Leprieur, C., Kerry, Y.H., S, M., & Meunier, J.C. (2000) Monitoring vegetation
cover across semi-arid regions: Comparison of remote observations from
various scales International Journal of Remote Sensing, 21, 281-300.
Li, X. & Yeh, A.G.-O. (2002) Neural-network-based cellular automata for simulating
multiple land use changes using GIS. International journal of Geographical
Information Science, 16, 323-343.
Lillesand, T.M. & Keifer, R.W. (1979) Remote Sensing and Image Interpretation
John Wiley & Sons New York
Logofet, D.O. & Lesnaya, E.K. (2000) The mathematics of Markov models: What
Markov chains can really predict in forest succession Ecological Modelling,
126, 285-298.
Logsdon, G.M., Bell, E.J., & Westerlund, F.V. (1996) Probability Mapping of Land
use Change: A GIS Interface for Visualizing Transition Probabilities
Comput.Environ and Urban Systems 20, 389-398.
Lonsdale, W.M. (1983) Rates of spread of an invading species - Mimosa pigra in
northern Australia. Journal of Ecology, 81, 513-521.
Lonsdale, W.M. (1992) The biology of Mimosa pigra CSIRO.
Lonsdale, W.M. (1993) Rates of spread of an invading species - Mimosa pigra in
northern Australia. Journal of Ecology, 81, 513-521.
Lonsdale, W.M., Harley, K.LS. and Miller, I.L. 1985. The biology of Mimosa pigra.
In: Proceedings (2) 10th Asian Pacific Weed Science Society Conference,
Chiangmai Thailand, pp. 484–490
Lonsdale, W.M. & Abrecht, D.G. (1988) Seedling mortality in Mimosa pigra, an
invasive tropical shrub Journal of Ecology, 77, 371-385.
Lo´ pez-Granados, E. M., Bocco, G., & Mendoza-Cantu´ , M. (2001). Prediccio´ n
del cambio de cobertura y uso de suelo. El caso de la ciudad de
Morelia.Investigaciones Geogra´ficas, Boletı´n del Instituto de Geografı´a,
UNAM,
REFERENCES
90
45, 56–76.
Lough, T.J., Wilson, J.B., Mark, A.F., & Evans, A.C. (1987) Succession in New
Zealand alpine cushion community: A markovian model Vegetatio, 71, 129-
138.
Lowe, S., Browne, M., & Boudjelas, S. (2003) 100 of the world's worst invasive
alien species the Invasive Species Specialist Group of the Species Survival
Commission (SSC) of The World Conservation Union (IUCN), Auckland,
New Zealand.
Mather, P.M. (1998) Computer Processing of Remotely Sensed Images 3rd edn.
John Wiley & Sons New Jersey.
Miller IL, Nemestothy L & Pickering SE 1981. Mimosa pigra in the Northern
Territory.Technical Bulletin 51, Northern Territory Department of Primary
Production, Darwin.
Miller, I.L. & Lonsdale, W.M. (1987) Early records of Mimosa pigra in Northern
Territory Plant Protection Quaterly 2, 140-142.
Miller, I.L. 1988. Aspects of the Biology and Control of Mimosa pigra L. MSc Agr
Dissertation, University of Sydney, Sydney, Australia.
Miller, I.L., Nemestothy, L. and Pickering, S.E. 1981 Mimosa pigra in the Northern
Territory. Technical Bulletin No. 51, Northern Territory Department of
Primary Production, Darwin.
Mooney, H.A. & Drake, J.A. (1987) The ecology of biological invasions
Environment 29, 10-15.
Morisette, J.T., Khorram, S., & Mace, T. (1999) Land-cover change detection
enhanced with generalized leniar models. International Journal of Remote
Sensing, 20.
Muller, M.R. & Middleton, J. (1994) AMarkov model of land-use change dynamics
in the Niagara Region, Ontario, Canada. Landscape Ecology, 9, 151-157.
MAPPING AND MODELLING OF Mimosa pigra EXPANSION IN LOCHINVAR NATIONAL PARK, ZAMBIA
91
Mumba, M. (2005). Hydrological and Ecological Changes in Kafue Flats Floodplain,
Southern Zambia, aftr dam construction: The case of Chunga Lagoon, PhD
Thesis, University of London, London, UK
Napompeth, B. (2003) Invasive alien species of continental Southeast Asia: the case
of Thailand. In Prevention and Management of Invasive Alien Species:
Workshop on Forging Cooperation throughout South and Southeast Asia
(eds N. Pallewatte, J.K. Reaser & A. Gutierrez). Global Invasive Species
Programme, Cape Town, South Africa.
Naylor, J.B., Endress, B.A., & Parks, C.G. (2005) Multiscale Detection of Sulfur
Cinnquefoil using Aerial Photography Rangeland Ecology and
Management 58, 447-451.
Pacific Island Ecosystems at Risk. 2002. Mimosa pigra L., Accessed 8th
December
,2006 from
http;//www.hear.org/pier_v3.3/mipig.htm. 3 p.
Paynter 2004. Evaluating Mimosa pigra biological control in Australia. In Research
andmanagement of Mimosa pigra, eds Julien M, Flanagan G, Heard T,
Hennecke B, Paynter Q & Wilson C, CSIRO Entomology, Canberra, 141–
148.
PCA (2004) What the heck is an invasive plant? (Leaflet), Vol. 2006. Alien Plant
Working Group, Plant Conservation Alliance, USA.
Peters, A.J., Reed, B.C., Eve, M.D., & Mc Daniel, K.C. (1992) Remote sensing of
broom snake weed( Gutierrezia sarothrae) with NOAA-10 spectral image
processing Weed Technology, 6, 1015-1020.
Petit, C.C., Scudder, T., & Lambin, E. (2000) Quantifying processes of land- cover
change by remote sensing: Resettlement and rapid land -cover changes in
South eastern Zambia International Journal of Remote Sensing, 22, 3435-
3456.
Petit, C.C., Scudder, T., & Lambin, E.F. (2001) Quantifying processes of land-cover
change by remote sensing: resettlement and rapid land-cover changes in
south-eastern Zambia. International Journal of Remote Sensing, 22, 3435-
3456.
REFERENCES
92
Pickett STA, White PS (1985) Natural disturbance and patch dynamics: an
introduction. In: Pickett STA, White PS (eds) The ecology of natural
disturbance and patch dynamics Academic Press, Orlando, pp 3–13
Platt, W.J. (1975) The colonization and formation of equilibrium plant species
associations on badger disturbances in a tall-grass prairie. Ecological
Monographs, 45, 285-305.
Ponnamperuma, F.N (1964). Dynamic aspects of flood soils and the nutrition of the
rice plant .Symposium of Mineral Nutrition of the Rice Plant.
International Rice Research Institute, , Philippines, pp 293-328
Rees, W.A. (1978 a) The Ecology of the Kafue Lechwe: Soils, Water Levels and
Vegetation Journal of Applied Ecology, 15, 163-176.
Rees, W.A. (1978 b) The Ecology of the Kafue Lechwe: As Affected by the Kafue
Gorge Hydroelectric Scheme Journal of Applied Ecology, 15, 205-217.
Ripley, H.T. (2003) Mapping invasive species, Vol. 2006. Hyperspectral Data
International, Inc, Halifax, Canada.
Robinson, V.B. (1978) Information theory and sequences of land use: an application
Professional Geographer 30, 174-179.
Rooney, T.P. (2005) Distribution of ecologically-invasive plants along off-road
vehicle trails in the Chequamegon national forest, Wisconsin. The Michigan
Botanist, 44, 178-182.
Saxena, K.G. (1991) Biological invasions in the Indian subcontinent: review of
invasion by plants. In Ramakrishnan, P.S. (Ed.) Ecology of biological
invasion in the tropics, pp. 53-73. International Scientific Publications, New
Delhi.
Sheppe, W. & Osborne, T. (1971) Patterns of Use of a Flood Plain by Zambian
Mammals Ecological Monographs 41, 179-205.
Shibayama H, Kittipong P, Premasthira C, Sangtong T & Supatanakul C 1983.
Habitats, seed germination and growth of Mimosa pigraL.Proceedings of an
International SymposiumMimosa pigra management, Chiang Mai Thailand,
International Plant Protection Centre,Corvalis USA, 56–62.
MAPPING AND MODELLING OF Mimosa pigra EXPANSION IN LOCHINVAR NATIONAL PARK, ZAMBIA
93
Stephenson, C.M., MacKenzie, M.L., Edwards, C., & Travis, J.M.J. (2006)
Modelling establishment probabilities of an exotic plant, Rhododendron
ponticum, invading a heterogeneous, woodland landscape using logistic
regression with spatial autocorrelation. Ecological Modelling, 193, 747-
758.
Stewart, W.J. (1994) Intoduction to the Numerical Solution of Markov Chains
Princeton University Press, Princeton.
Thomas, N., Hendrix, C., & Congalton, R.G. (2003) A comparison of urban mapping
methods using high-resolution digital imagery Photogrammetric
Engineering and Remote Sensing 69, 963-972.
Thompson, S.R. (1986) Report on new invasion by Mimosa pigra in an African
National Park. Aquaphyte.
Thornton, P.K. & Jones, P.G. (1998) A Conceptual Approach to Dynamic
Agricultural Land- Use Modelling Agricultural Systems 57, 505-521.
Tobler, W. (1970) A Computer Movie Simulating Urban Growth in the Detroit
Region Economic Geography, 46, 234-240.
Triet T, Kiet L C, Thi NTL, Dan PQ 2004. The invasion by Mimosa pigra of the
wetlands of the Mekong Delta, Vietnam. In Research and management of
Mimosa pigra, eds Julien M, Flanagan G, Heard T, Hennecke B, Paynter Q
& Wilson C, CSIRO Entomology, Canberra, 45–51.
Tucker, C.J. (1979) Red and photographic infra red linear combinations for
monitoring vegetation Remote Sensing of Environment, 8, 127-150.
Turner, M.G. (1987) Spatial simulation of landscape changes in Georgia: A
comparison of 3 transition models Landscape Ecology 1, 29-36.
Turner, M.G., Wear, D.N., & Flamm, R.O. (1996) Land ownership and land-cover
change in the southern Applachian highlands and the Olympic peninsula
Ecological Applications, 6, 1150-1172.
Underwood, E., Ustin, S., & DiPietro, D. (2003) Mapping nonnative plants using
hyperspectral imagery. Remote Sensing of Environment, 86, 150-161.
REFERENCES
94
Usher, M.B. (1966) A matrix approach to the management of renewable resources
with special reference to selection forests Journal of Applied Ecology, 3,
355-367.
Usher, M.B. & Parr, T.W. (1977) Are there successional changes in arthropod
decomposer communities? Journal of Environmental Management 5, 151-
160.
van Gils, H., Delfino, J., Rugege, D., & Janssen, L. (2004) Efficacy of Chromolaena
odorata control in a South African conservation forest South African
Journal of Science, 100, 251-253.
van Rensburg, H.J (1968). Multipurpose survey of the Kafue River basin, Zambia.
Vol IV, Ecology of the Kafue Flats . Part I, List of plant species
.pp.178.Part II, Ecology and Development. Pp. 138. F.A.O.Rome
Veldkamp, A. & Lambin, E.F. (2001) Predicting land-use change (Editorial).
Agriculture, Ecosystems and Environment, 85, 1-6.
Vitousek, P.M. (1990) Biological invasions and ecosystem processes; towards an
integration of population biology and ecosystem studies. Oikos, 57, 7-13.
Vitousek, P.M., Antonio, D., Loope, L.L., & Westbrooks, R. (1996) Biological
invasions as global environmental change American Scientist 84, 468-478.
Wanichanantakul, P. and Chinawong, S. 1979. Some aspects of the biology of
Mimosa pigra in northern Thailand. In: Proceedings of the Seventh Asian–
Pacific Weed Science Society Conference, Sydney, 1979, pp. 381–383.
Wear, D.N., Turner, M.G., & Naiman, R.J. (1998) Land cover along an urban- rural
gradient : implications for water quality Ecological Applications, 8, 619-
630.
Weng, Q. (2002) Land use change analysis in the Zhujiang Delta of China using
satellite remote sensing, GIS and stochastic modelling. Journal of
Environmental Management, 64, 273-284.
Williamson, M. (1996) Biological invasions, Chapman & Hall, London.
Wilson BA, Brocklehurst PS & Whitehead PJ 1991. Classification, distribution
andenvironmental relationships of coastal floodplain vegetation, Northern
MAPPING AND MODELLING OF Mimosa pigra EXPANSION IN LOCHINVAR NATIONAL PARK, ZAMBIA
95
Territory, Australia,March–May 1990. Technical Memorandum 91/2, Land
Conservation Unit, Conservation Commission of the Northern Territory,
Palmerston
WWF, 2002. Integrated Water Management Project for the Kafue Flats
Young, J.A. & Longland, W.S. (1996) Impact of alien plants on Grant Basin
rangelands. Weed Technology, 10, 384-391.
Zedler, J.B. & Kerceher, S. (2004) Causes and Consequences of Invasive Plants in
Wetlands: Opportunities, Opportunists and Outcomes Critical Reviews in
Plant Sciences 23, 431-452.
Zhang, X., Friedl, M.A., Schaaf, C.B., Strahler, A.H., & Hodges, J.C.F. (2003)
Monitoring vegetation phenology using MODIS Remote Sensing of
Environment, 84, 471-475.
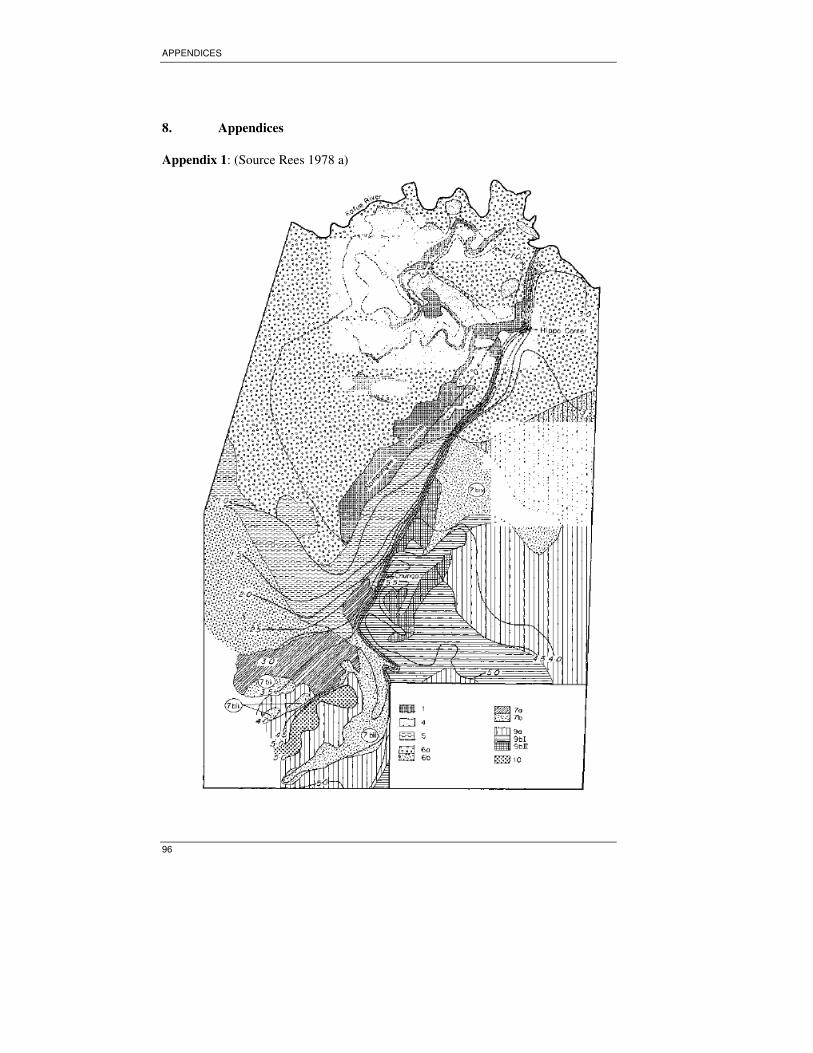
APPENDICES
96
8. Appendices
Appendix 1: (Source Rees 1978 a)
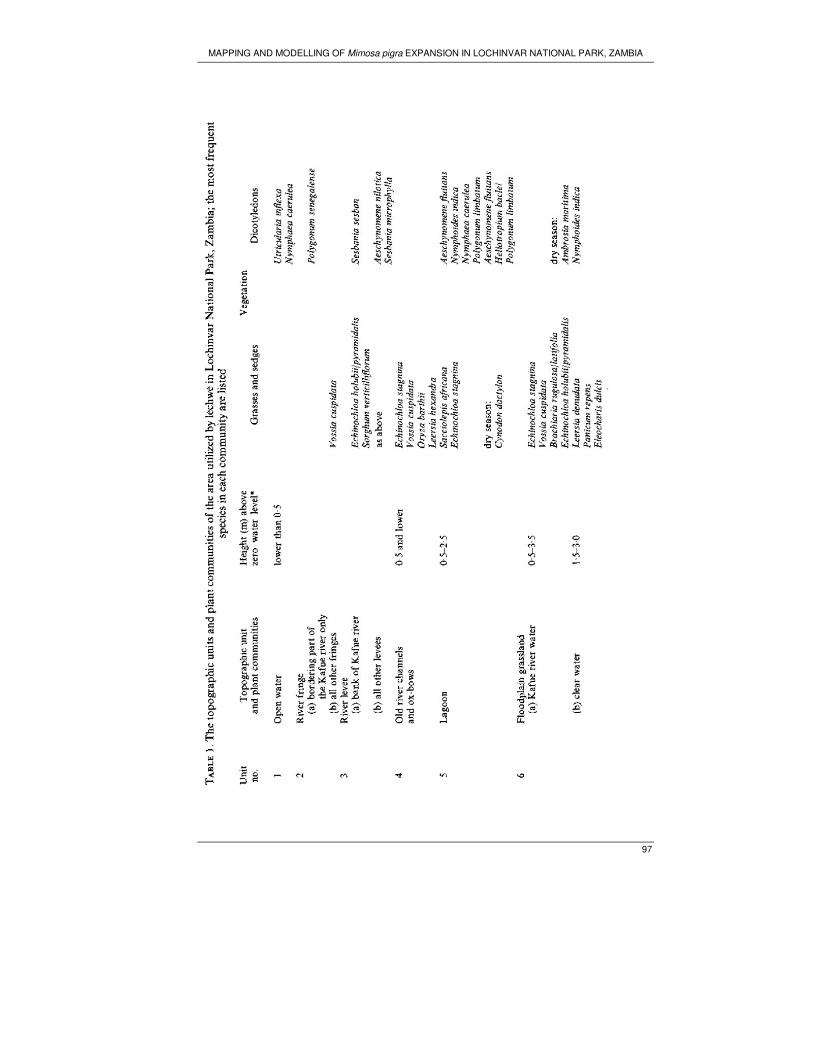
MAPPING AND MODELLING OF Mimosa pigra EXPANSION IN LOCHINVAR NATIONAL PARK, ZAMBIA
97
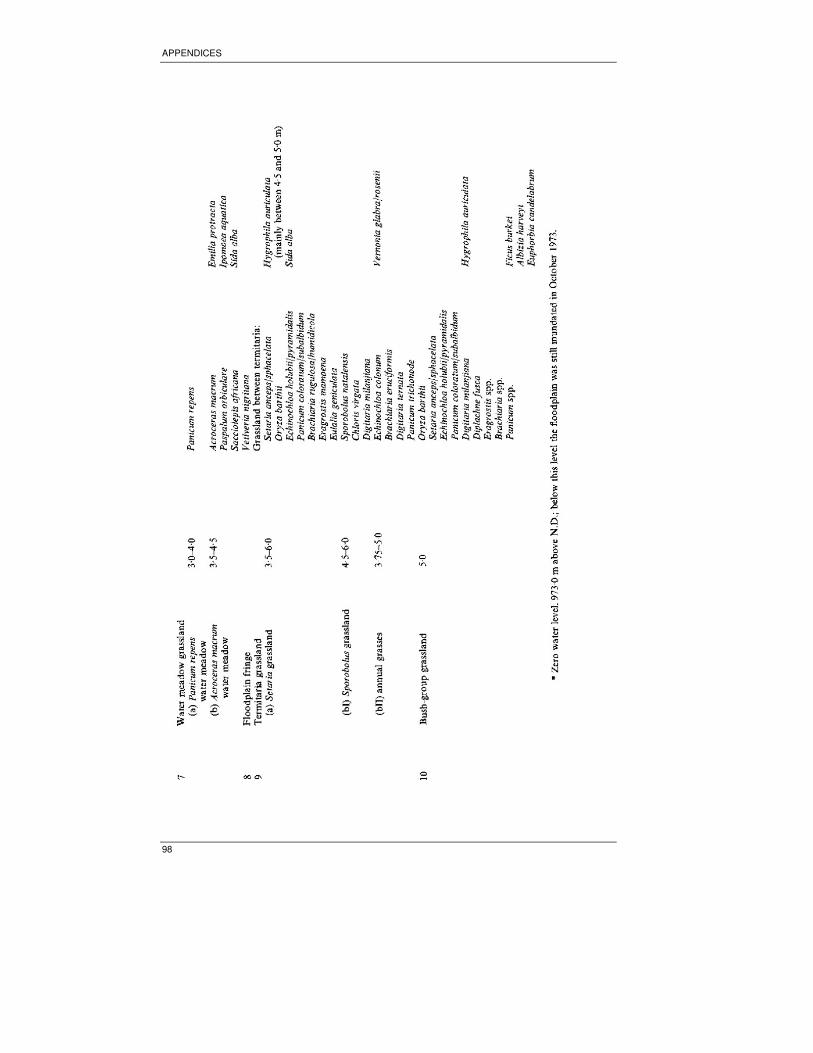
APPENDICES
98
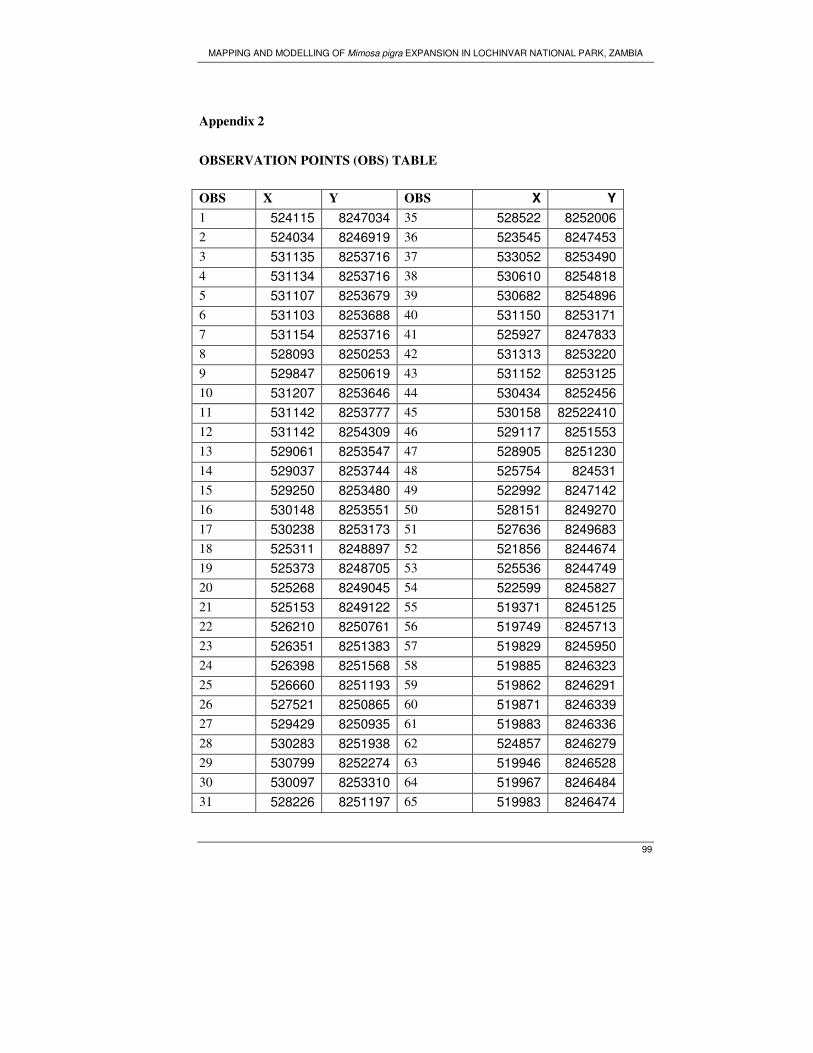
MAPPING AND MODELLING OF Mimosa pigra EXPANSION IN LOCHINVAR NATIONAL PARK, ZAMBIA
99
Appendix 2
OBSERVATION POINTS (OBS) TABLE
OBS X Y OBS X Y
1 524115 8247034 35 528522 8252006
2 524034 8246919 36 523545 8247453
3 531135 8253716 37 533052 8253490
4 531134 8253716 38 530610 8254818
5 531107 8253679 39 530682 8254896
6 531103 8253688 40 531150 8253171
7 531154 8253716 41 525927 8247833
8 528093 8250253 42 531313 8253220
9 529847 8250619 43 531152 8253125
10 531207 8253646 44 530434 8252456
11 531142 8253777 45 530158 82522410
12 531142 8254309 46 529117 8251553
13 529061 8253547 47 528905 8251230
14 529037 8253744 48 525754 824531
15 529250 8253480 49 522992 8247142
16 530148 8253551 50 528151 8249270
17 530238 8253173 51 527636 8249683
18 525311 8248897 52 521856 8244674
19 525373 8248705 53 525536 8244749
20 525268 8249045 54 522599 8245827
21 525153 8249122 55 519371 8245125
22 526210 8250761 56 519749 8245713
23 526351 8251383 57 519829 8245950
24 526398 8251568 58 519885 8246323
25 526660 8251193 59 519862 8246291
26 527521 8250865 60 519871 8246339
27 529429 8250935 61 519883 8246336
28 530283 8251938 62 524857 8246279
29 530799 8252274 63 519946 8246528
30 530097 8253310 64 519967 8246484
31 528226 8251197 65 519983 8246474
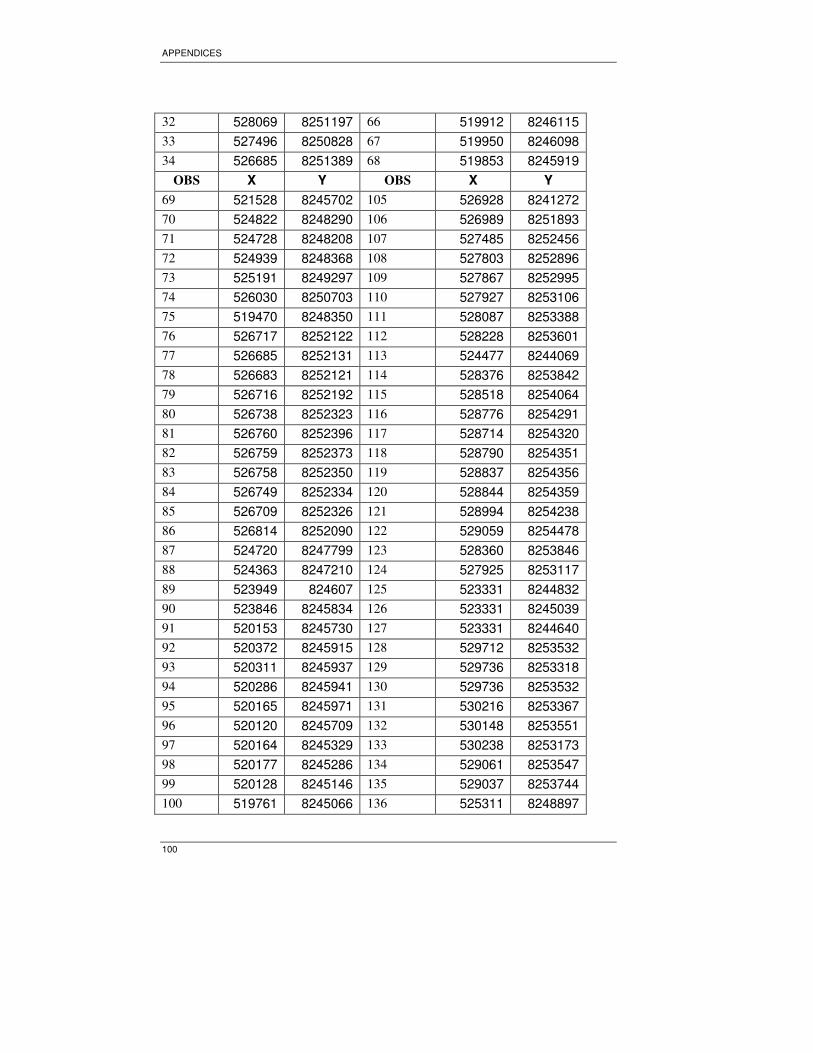
APPENDICES
100
32 528069 8251197 66 519912 8246115
33 527496 8250828 67 519950 8246098
34 526685 8251389 68 519853 8245919
OBS X Y OBS X Y
69 521528 8245702 105 526928 8241272
70 524822 8248290 106 526989 8251893
71 524728 8248208 107 527485 8252456
72 524939 8248368 108 527803 8252896
73 525191 8249297 109 527867 8252995
74 526030 8250703 110 527927 8253106
75 519470 8248350 111 528087 8253388
76 526717 8252122 112 528228 8253601
77 526685 8252131 113 524477 8244069
78 526683 8252121 114 528376 8253842
79 526716 8252192 115 528518 8254064
80 526738 8252323 116 528776 8254291
81 526760 8252396 117 528714 8254320
82 526759 8252373 118 528790 8254351
83 526758 8252350 119 528837 8254356
84 526749 8252334 120 528844 8254359
85 526709 8252326 121 528994 8254238
86 526814 8252090 122 529059 8254478
87 524720 8247799 123 528360 8253846
88 524363 8247210 124 527925 8253117
89 523949 824607 125 523331 8244832
90 523846 8245834 126 523331 8245039
91 520153 8245730 127 523331 8244640
92 520372 8245915 128 529712 8253532
93 520311 8245937 129 529736 8253318
94 520286 8245941 130 529736 8253532
95 520165 8245971 131 530216 8253367
96 520120 8245709 132 530148 8253551
97 520164 8245329 133 530238 8253173
98 520177 8245286 134 529061 8253547
99 520128 8245146 135 529037 8253744
100 519761 8245066 136 525311 8248897
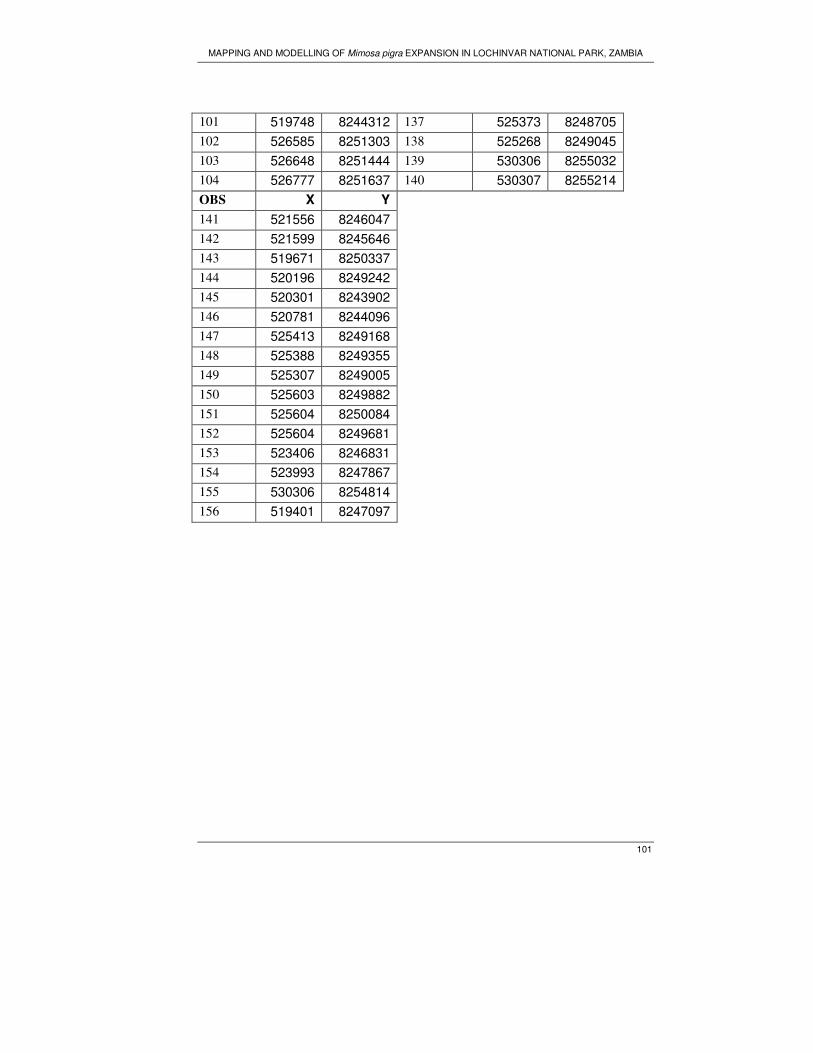
MAPPING AND MODELLING OF Mimosa pigra EXPANSION IN LOCHINVAR NATIONAL PARK, ZAMBIA
101
101 519748 8244312 137 525373 8248705
102 526585 8251303 138 525268 8249045
103 526648 8251444 139 530306 8255032
104 526777 8251637 140 530307 8255214
OBS X Y
141 521556 8246047
142 521599 8245646
143 519671 8250337
144 520196 8249242
145 520301 8243902
146 520781 8244096
147 525413 8249168
148 525388 8249355
149 525307 8249005
150 525603 8249882
151 525604 8250084
152 525604 8249681
153 523406 8246831
154 523993 8247867
155 530306 8254814
156 519401 8247097
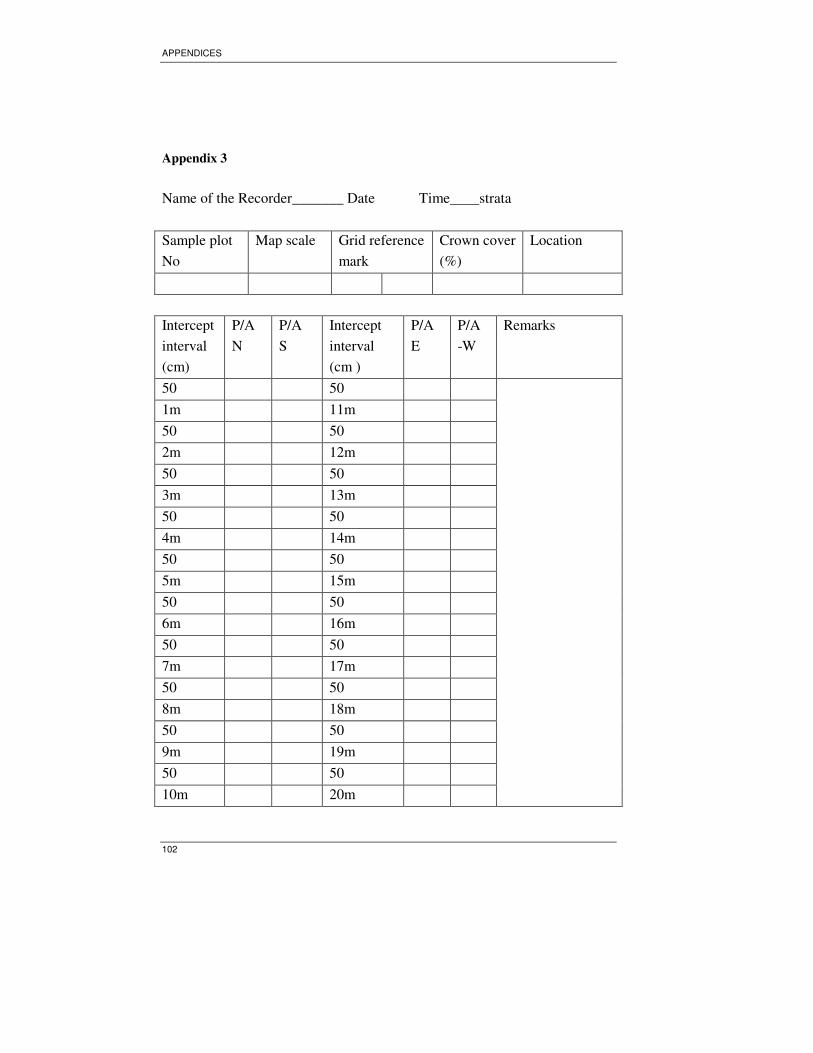
APPENDICES
102
Appendix 3
Name of the Recorder_______ Date Time strata
Sample plot
No
Map scale Grid reference
mark
Crown cover
(%)
Location
Intercept
interval
(cm)
P/A
N
P/A
S
Intercept
interval
(cm )
P/A
E
P/A
-W
Remarks
50 50
1m 11m
50 50
2m 12m
50 50
3m 13m
50 50
4m 14m
50 50
5m 15m
50 50
6m 16m
50 50
7m 17m
50 50
8m 18m
50 50
9m 19m
50 50
10m 20m
MAPPING AND MODELLING OF Mimosa pigra EXPANSION IN LOCHINVAR NATIONAL PARK, ZAMBIA
103
Appendix 4
ECOLOGY OF INVASION OF Mimosa pigra
In this section we describe the process of invasion of Mimosa pigra in the area.. There
are a number of factors that influence invasion dynamics, including life history traits
of native and exotic species, and physical characteristics of the site, such as soil
texture and climate. We have a limited understanding of the relative importance of
these different processes and environmental conditions on invasion dynamics The
populations of introduced species often remain small and localized for long periods of
time before they exhibit very rapid expansion. The plant invasion process for any
invasive occurs in three phases: Introduction, colonization and naturalization (Groves
1986). While these phases are of human construct, they help us to understand how the
invasion process works at different ecological and geographical scales(Platt, 1975). For
woody invasives it’s only the ability to establish (introduction) and the rate of growth
(colonization) in a new environment that are believed to differ from other plants.
According to (Crooks & Soule, 1999)this time lag may be due to the nature of
population growth and range of expansion, genetic factors to improve fitness or
environmental factors related to improving the ecological conditions for the organism.
Studies in Australia shows that Mimosa pigra had first been reported in 1880 , it was
noticed as signs of becoming a weed after 36 years and it was perceived as a problem as
invading the are after 90 years. This has also been the case with other invasives like
Chromolaena odorata which was first noticed in 1955 started as a problem after 7
years and given a pest status after 20years where it started invading the area.
Grime (1979) reports that disturbance might be a major factor favouring plant
invasions. Pickett and White (1985) view disturbance more completely as 'any
relatively discrete event in time that disrupts ecosystem, community or population
structure and changes resources or substrate availability or the physical environment'.
Disturbance does not always lead to plant invasion, but it may provide a temporary
location or "safe site" for a potential invasive species to establish a founding
population. Some form of disturbance usually accompanies the success of invasive
plant species. For example, Humphries et al. (1991) lists a number of major
"environmental" weeds in Australia. He reports that in case of Mimosa pigra
expansion in Australia the disturbance that favoured the speed or establishment of
the invasive alien the most was water level fluctuations and clearing. Similarly in
other invasives such as water hyacinth human interference and nutrient enrichment,
buffel grass floods and cattle, mission grass vehicular spread and animal movement
APPENDICES
104
contributed to the fast spread of species. In Lochinvar National Park the disturbance
that might have affected contributed to the spread of mimosa might be the change of
the flooding patterns as discussed in section 4.3a
The second stage of colonisation is characterised by geometric, exponential
population growth. Colonization occurs when plants in an introduced, founding
(original) population reproduce and then increase sufficiently to become self-
perpetuating. This is considered as an explosive growth phase, the invasive often
becomes apparent This rate of spread is similar to the population growth rate of an
organism in an ideal, resource limitless environment and is therefore believed to be
more a function of intrinsic biological characteristics of the species than of its
growing environment. During this phase populations of invasive plant species
expands by satellite populations that are often isolated from their source. However
establishment of a new satellite requires the existence of a vacant site for a dispersing
propagules to occupy(Saxena, 1991). Thus, colonization by an invasive species can
continue geometrically as both advancing fronts from existing patches and the wide-
ranging satellites that arise from them. In the case of Lochinvar National Park the
satellite outbreaks might have caused due to the dispersion of seeds by water and
movement of animals or vehicles. The establishment of the plant would have taken
advantage of the open spaces found between the grasses . For example, (Ghersa et
al., 1994) determined that satellite populations of johnsongrass that were uniformly
distributed over a previously vacant area occupied that area more quickly than the
advancing front of its adjacent source population.
It has been reported that in most invasive woody aliens at some carrying capacity,
K, the population approaches a quasi-threshold density where its population growth
may remain near one, i.e., stabilize and not expand very quickly (naturalization) The
K density occurs when niche occupancy and available resources limit the rate of
spread(Williamson, 1996). The conversion to annual grasslands from tussock
grasslands in California is an example where biological characteristics play an
important role in the invasion process, thus the intrinsic biology of the plant species
and the extrinsic nature of the ecosystem are equally important in determining the
naturalization of invasive plant species.