MAP/Ming Visiting Professorship, Engineering School ... · y = 47.5x – 91,240 r2 = 0.99 29%...
75
Transcript of MAP/Ming Visiting Professorship, Engineering School ... · y = 47.5x – 91,240 r2 = 0.99 29%...

MAP/Ming Visiting Professorship, Engineering School, Stanford University, 28 March 2007
CEE 173L/273L: Advanced Energy End-Use Efficiency
Public Lectures in Advanced Energy Efficiency:
3. Transportation
Amory B. Lovins, SAEChairman and Chief Scientist
Rocky Mountain Institutewww .rmi.org
Copyright © 2007 Stanford University. All rights reserved. Distribution licensed to Rocky Mountain Institute.

The world consumes a cubic mile of oilper year—85 million barrels per day
[courtesy of CAPT Scott Pugh, USN Ret., RMI Military Principal]
85,000,000 x 30 inches(12 inches/foot)(6,000 feet/nautical mile)
= 35,416 nautical miles
20-inch pipeline
= 1,475 knots ≈ Mach 2
35,416 nm24 hours 21,600nm
circumference1 barrel of crude oil =42 U.S. gallons
30 inches
20 inches


Whalers ran out of customersbefore they ran out of whales…
Rise and fall of the U.S. whaling fleet, 1821–1884
0
20
40
60
80
100
120
1821 1826 1831 1836 1841 1846 1851 1856 1861 1866 1871 1876 1881
year
Sperm oil production (100,000 gal/y)
Whale oil production (100,000 gal/y)
Sperm oil price (2000 $/gal)
Whale oil price (2000 $/gal)
Whaling-fleet displacement (10,000tons)
Crude-oil wellhead price (2000 $/gal)
Crude-oil production (100,000 gal/y)
…even before Drake struck oil in 1859!
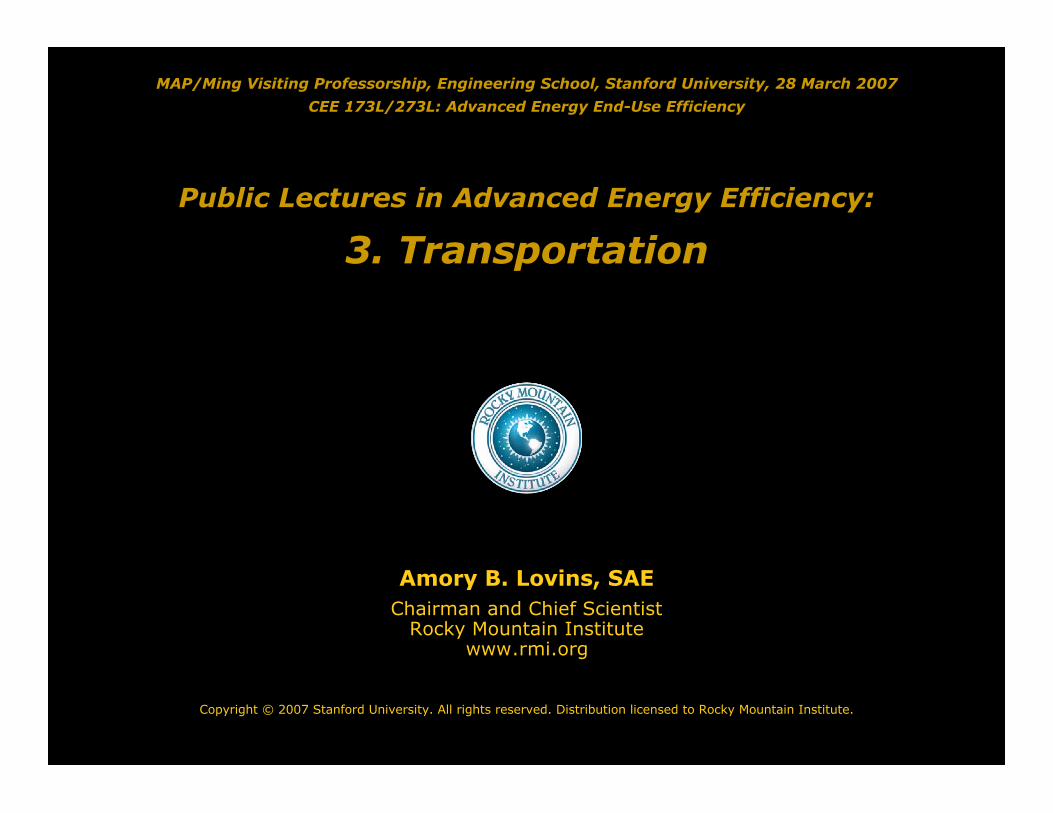
Some recent wildcat discoveries
◊ 8.3 million bbl/d play in the Detroit Formation◊ 1.6 million bbl/d play in heavy trucks◊ 1.2 million bbl/d play in industrial fuels/feeds◊ 1.1 million bbl/d play in buildings◊ 0.9 million bbl/d play in aircraft◊ 1.6 million bbl/d play in other oil end-uses◊ > 5 million bbl/d play in robustly competitive
biofuels, chiefly cellulosic ethanol, and inbiomaterials and biolubricants
◊ 12 TCF/y play in electricity and gas end-uses
Shouldn’t we drill the most prospective plays first?
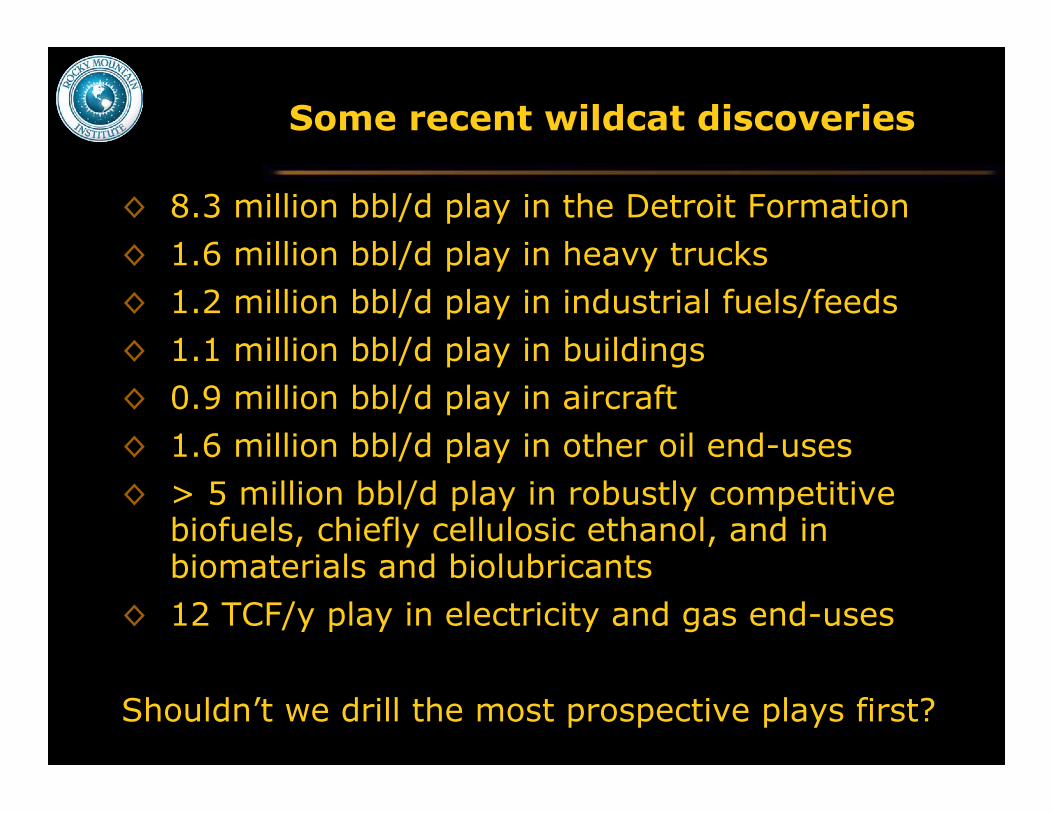
20 Sept 2004 detailed study
Independent, peer-reviewed
Transparent, uncontested
OSD- and ONR-cosponsored
For business & mil. leaders,built around competitivestrategy for cars, trucks,planes, fuels, and military
329-page book & completetechnical details are freedownloads from:
www.oilendgame.com
Over the next fewdecades, the U.S. caneliminate its use of oiland revitalize itseconomy, all led bybusiness for profit
This work was cosponsored by OSD and ONR. The views expressed are those of the authors alone, not of the sponsors.
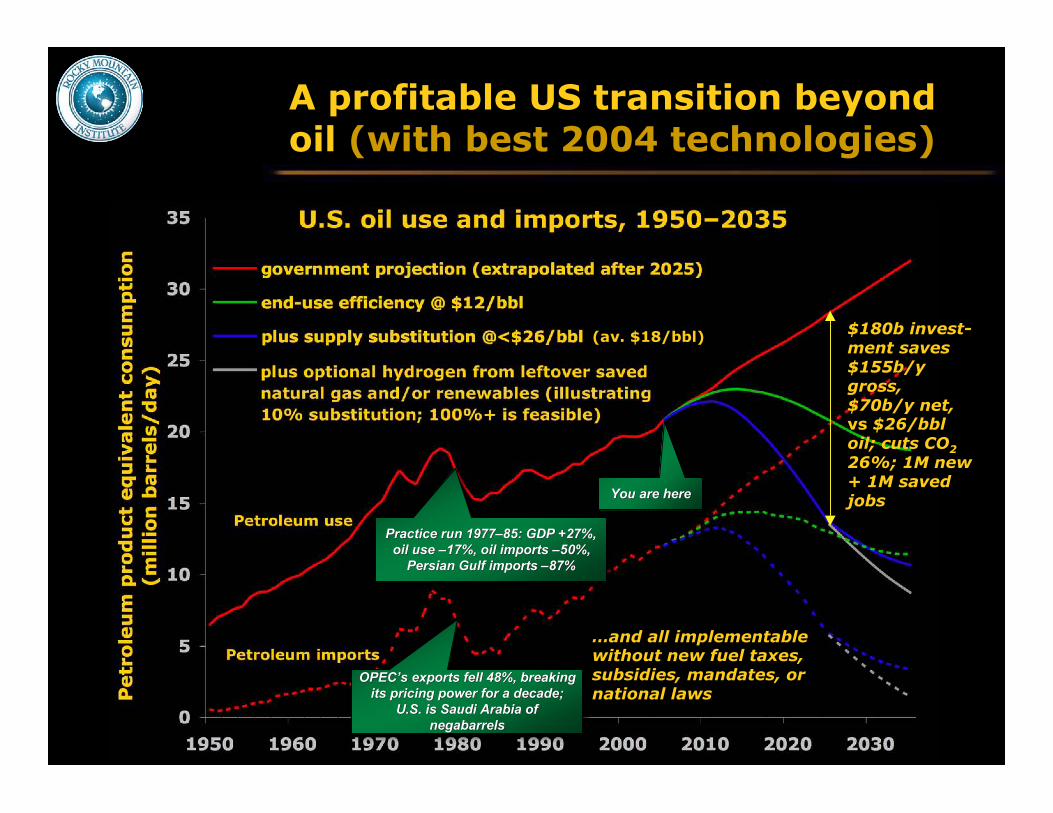
A profitable US transition beyondoil (with best 2004 technologies)
(av. $18/bbl)
Practice run 1977Practice run 1977––85: GDP +27%,85: GDP +27%,oil use oil use ––17%, oil imports 17%, oil imports ––50%,50%,
Persian Gulf imports Persian Gulf imports ––87%87%
You are hereYou are here
$180b invest-ment saves$155b/ygross,$70b/y net,vs $26/bbloil; cuts CO226%; 1M new+ 1M savedjobs
…and all implementablewithout new fuel taxes,subsidies, mandates, ornational laws
OPECOPEC’’s exports fell 48%, breakings exports fell 48%, breakingits pricing power for a decade;its pricing power for a decade;
U.S. is Saudi Arabia ofU.S. is Saudi Arabia ofnegabarrelsnegabarrels

CARS: save 69% at $0.15/L
BLDGS/IND: big, cheap savings; often lower capex
Vehicles use 70% of US oil, but integ-rating low mass & drag with advancedpropulsion saves ~2/3 very cheaply
TRUCKS: save 25% free,65% @ $0.07/L
PLANES: save 20% free,45–65% @ ≤$0.12/L
Technology is improving faster for efficient end-use than for energy supply
250 km/h, 2.5 L/100 km
Surprise:ultralightingis free —offset bysimplerautomakingand the 2×smallerpowertrain

Light and heavy trucks = 70% of projected 2000–25rise in total U.S. consumption of petroleum products(by volume)
1
0
2
4
6
8
10
12
14
16
18
20
22
1970 1975 1980 1985 1990 1995 2000 2005 2010 2015 2020 2025
Source: Transportation Energy Data Book: Edition 23, DOE/ORNL-6970, October 2003, and EIA Annual Energy Outlook 2004, January 2004
Millio
ns o
f B
arr
els
per
Day
Domestic
Production
Actual Projected
Light Trucks
Heavy Vehicles
Year
Air
Marine
RailOff-road
Cars
Transportation Petroleum Use by Mode (1970-2025)% of2000–2025growth: 7%
15%
55%
3%
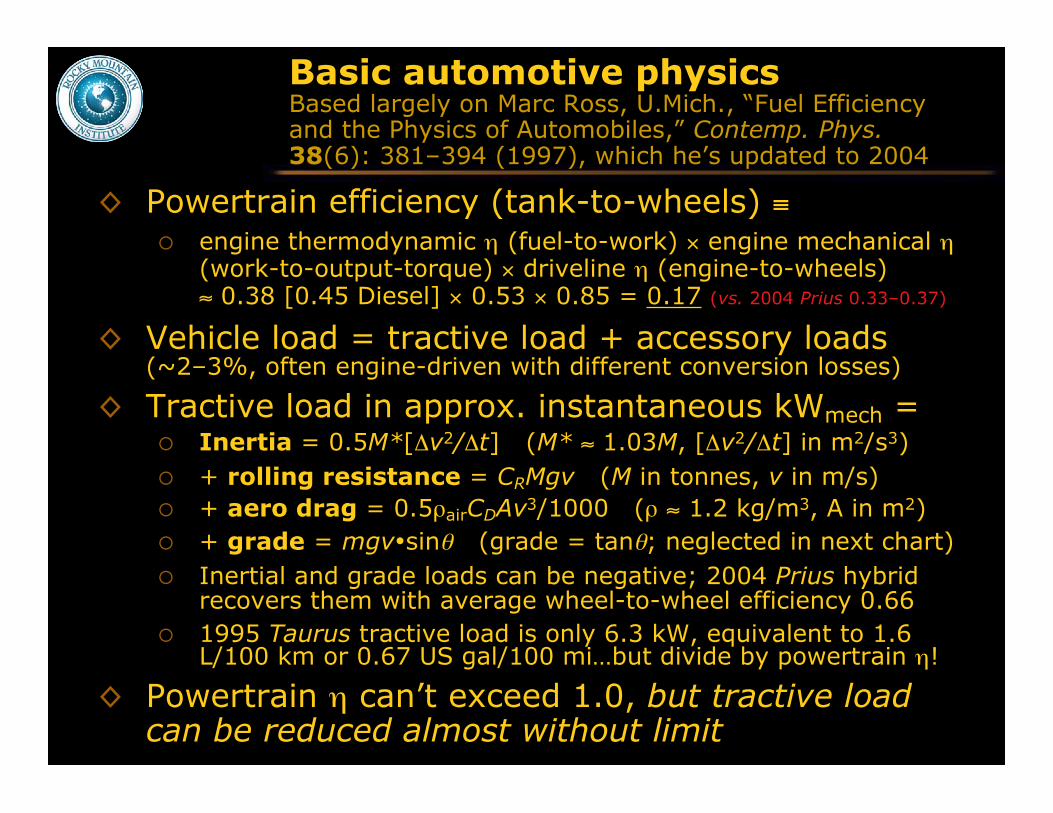
Basic automotive physicsBased largely on Marc Ross, U.Mich., “Fuel Efficiencyand the Physics of Automobiles,” Contemp. Phys.38(6): 381–394 (1997), which he’s updated to 2004
◊ Powertrain efficiency (tank-to-wheels) ≡ engine thermodynamic η (fuel-to-work) × engine mechanical η
(work-to-output-torque) × driveline η (engine-to-wheels)≈ 0.38 [0.45 Diesel] × 0.53 × 0.85 = 0.17 (vs. 2004 Prius 0.33–0.37)
◊ Vehicle load = tractive load + accessory loads(~2–3%, often engine-driven with different conversion losses)
◊ Tractive load in approx. instantaneous kWmech = Inertia = 0.5M*[Δv2/Δt] (M* ≈ 1.03M, [Δv2/Δt] in m2/s3) + rolling resistance = CRMgv (M in tonnes, v in m/s) + aero drag = 0.5ρairCDAv3/1000 (ρ ≈ 1.2 kg/m3, A in m2) + grade = mgv•sinθ (grade = tanθ; neglected in next chart) Inertial and grade loads can be negative; 2004 Prius hybrid
recovers them with average wheel-to-wheel efficiency 0.66 1995 Taurus tractive load is only 6.3 kW, equivalent to 1.6
L/100 km or 0.67 US gal/100 mi…but divide by powertrain η!
◊ Powertrain η can’t exceed 1.0, but tractive loadcan be reduced almost without limit
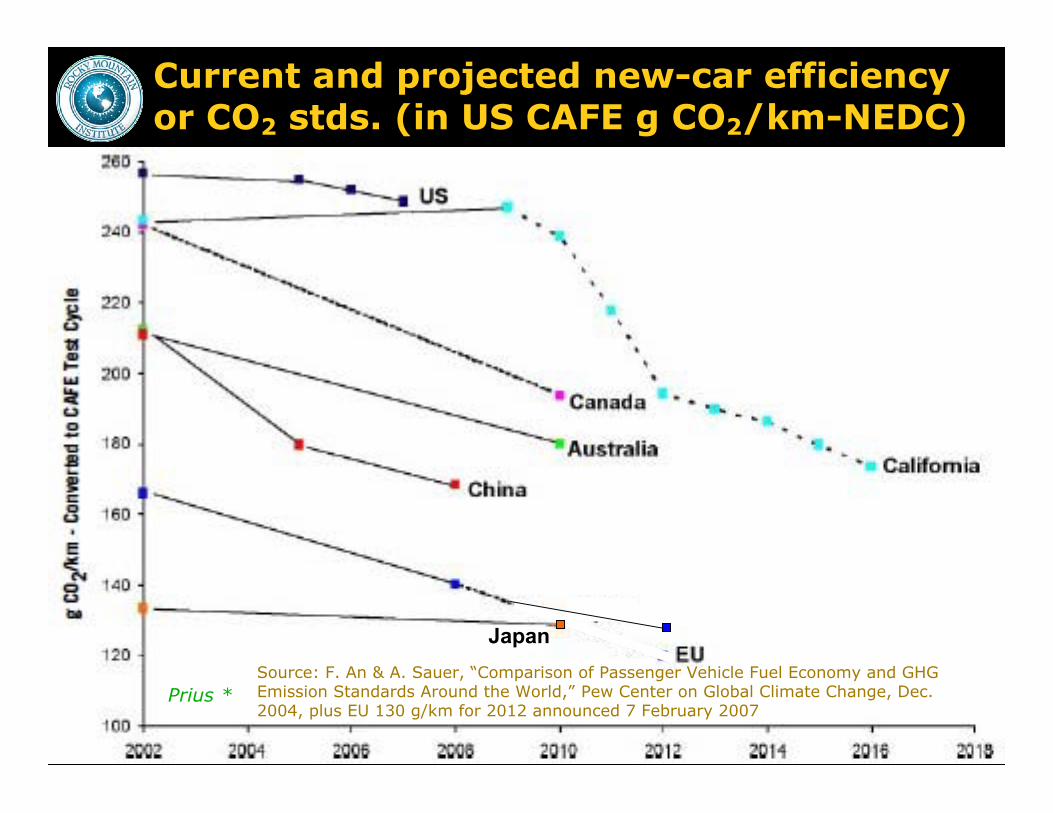
Current and projected new-car efficiencyor CO2 stds. (in US CAFE g CO2/km-NEDC)
Source: F. An & A. Sauer, “Comparison of Passenger Vehicle Fuel Economy and GHGEmission Standards Around the World,” Pew Center on Global Climate Change, Dec.2004, plus EU 130 g/km for 2012 announced 7 February 2007
Prius *
Japan

Challenging a basic assumption inDetroit and Washington
◊ Efficiency assumed to be a tradeoff—makes carssmall, unsafe, sluggish, costly, ugly,…
◊ Hence policy intervention needed to induce cus-tomers to buy the compromised vehicles
Rocky Mountain Institute (RMI) • www.rmi.org

How many people still buyphonograph records…
…or cathode-ray-tube TVs instead of big flat-panel TVs?
◊ An engineering end-run around tax/CAFE gridlock
◊ A robust business model based solely on value tocustomer and competitive advantage to suppliers
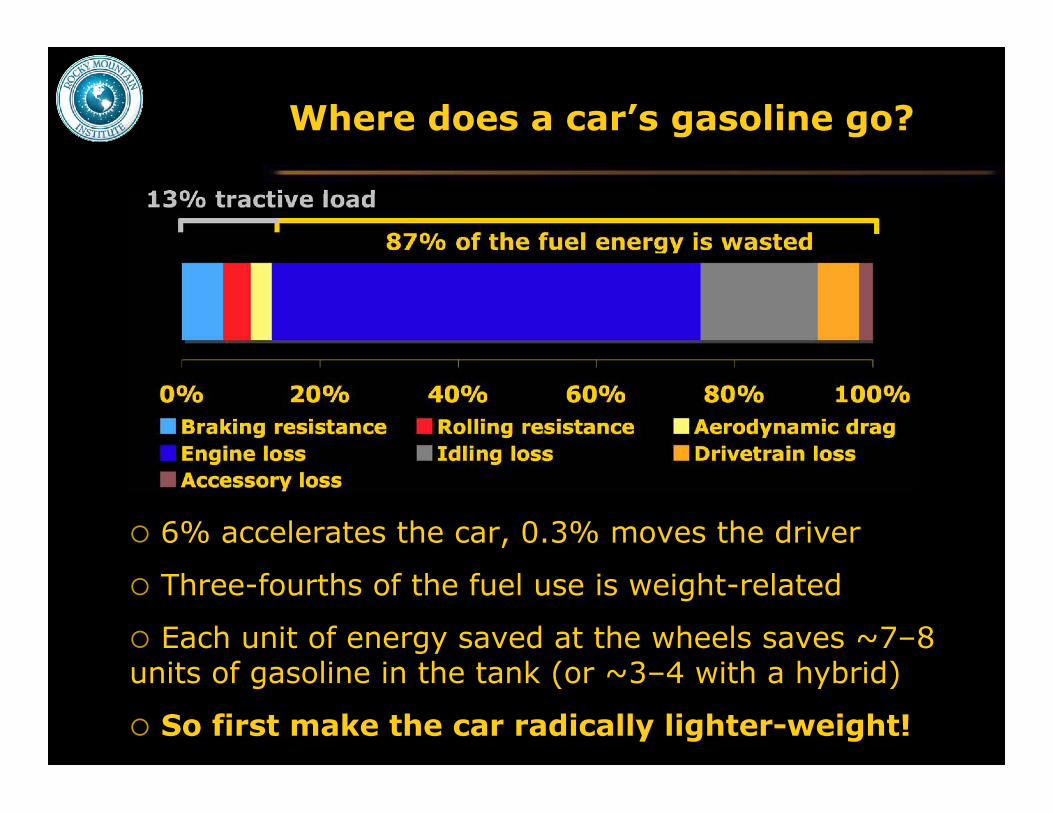
Where does a car’s gasoline go?
6% accelerates the car, 0.3% moves the driver
Three-fourths of the fuel use is weight-related
Each unit of energy saved at the wheels saves ~7–8units of gasoline in the tank (or ~3–4 with a hybrid)
So first make the car radically lighter-weight!

Henry Ford said it best…
"I had been experimenting principally upon thecutting down of weight. Excess weight kills any self-propelled vehicle….Weight may be desirable in asteam roller but nowhere else.
The most beautiful things in the world are thosefrom which all excess weight has been eliminated….Whenever any one suggests to me that I mightincrease weight or add a part, I look into decreasingweight and eliminating a part!”
— Henry Ford, My Life and Work
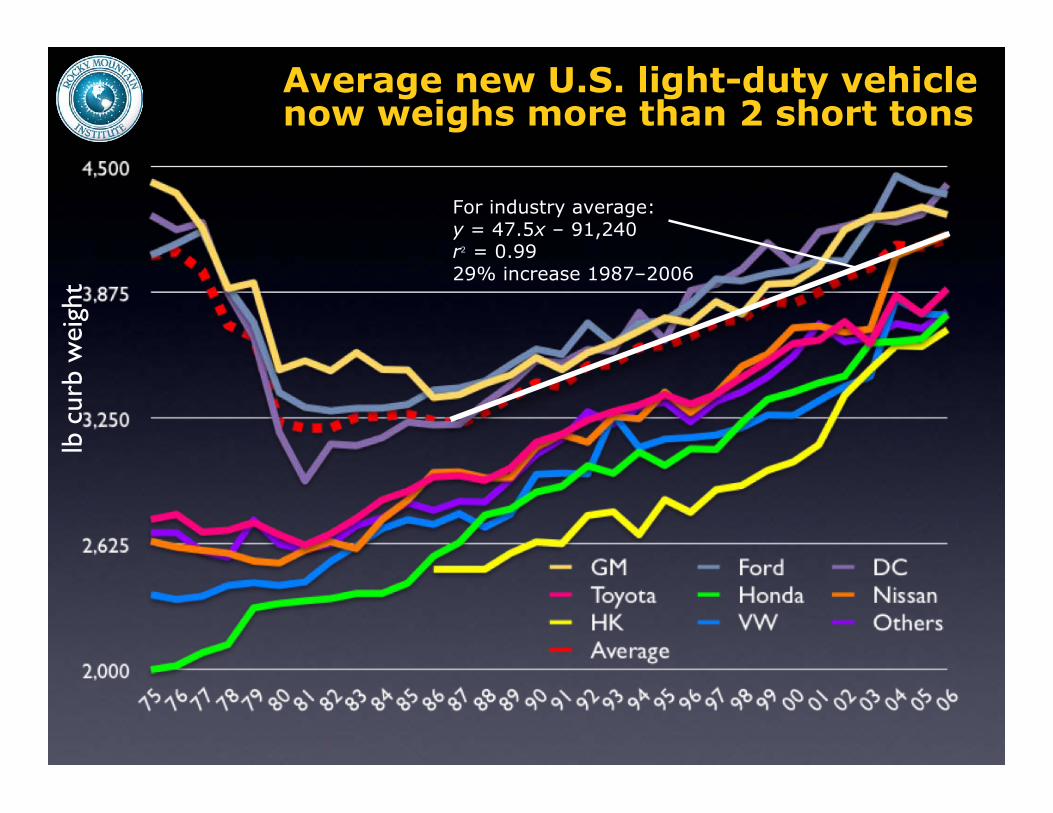
Average new U.S. light-duty vehiclenow weighs more than 2 short tons
lb c
urb
wei
ght
For industry average:y = 47.5x – 91,240r2 = 0.9929% increase 1987–2006
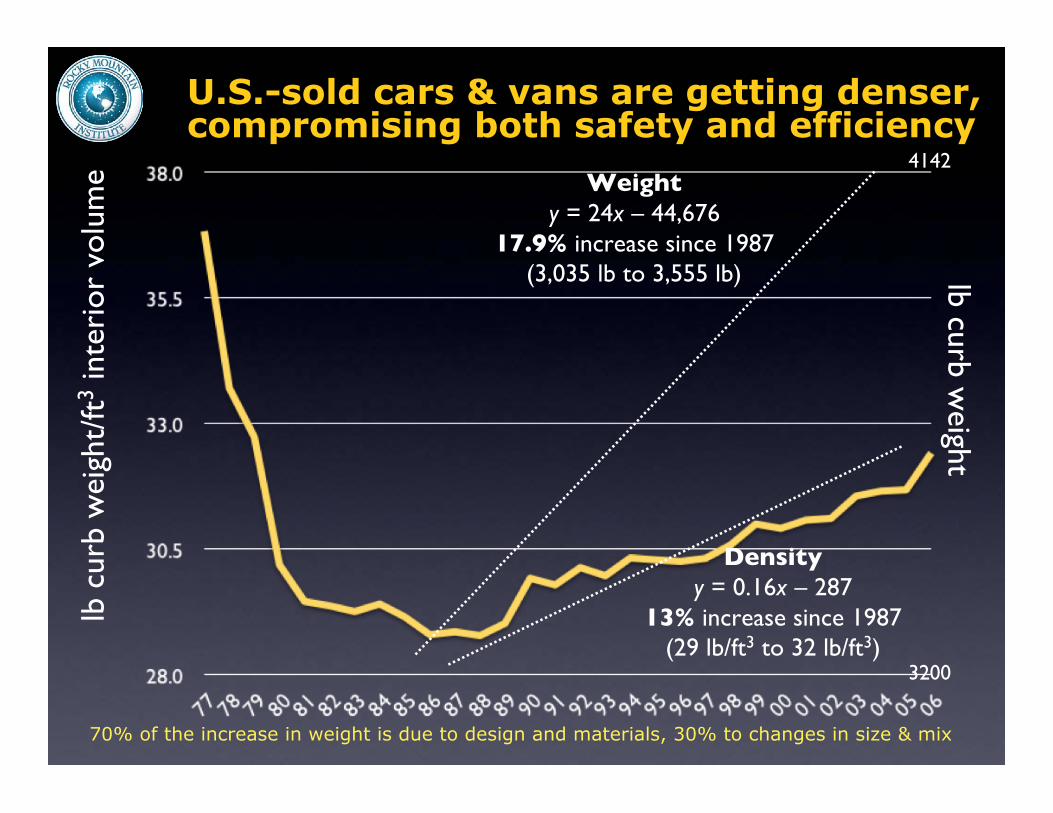
U.S.-sold cars & vans are getting denser,compromising both safety and efficiency
4142
3200
lb curb weight
lb c
urb
wei
ght/
ft3
inte
rior
vol
ume
Densityy = 0.16x – 287
13% increase since 1987(29 lb/ft3 to 32 lb/ft3)
Weighty = 24x – 44,676
17.9% increase since 1987(3,035 lb to 3,555 lb)
70% of the increase in weight is due to design and materials, 30% to changes in size & mix
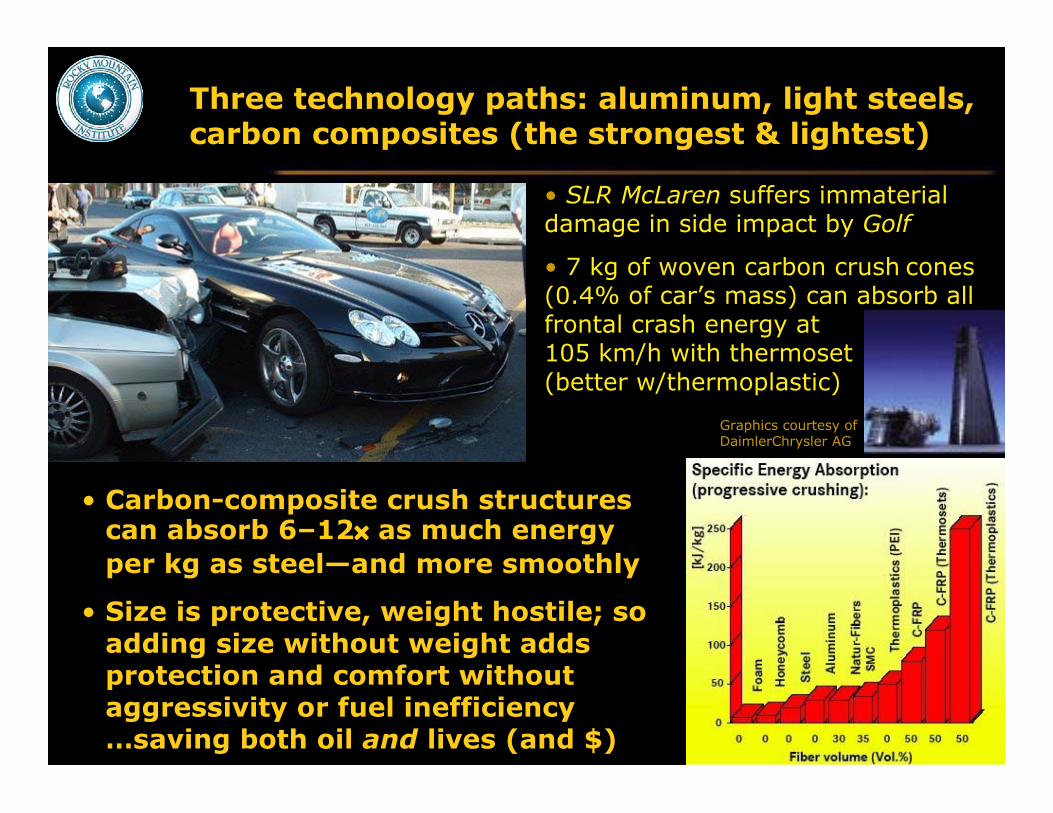
Three technology paths: aluminum, light steels,carbon composites (the strongest & lightest)
• Carbon-composite crush structurescan absorb 6–12× as much energyper kg as steel—and more smoothly
• Size is protective, weight hostile; soadding size without weight addsprotection and comfort withoutaggressivity or fuel inefficiency…saving both oil and lives (and $)
• SLR McLaren suffers immaterialdamage in side impact by Golf
• 7 kg of woven carbon crush cones(0.4% of car’s mass) can absorb allfrontal crash energy at105 km/h with thermoset(better w/thermoplastic)
Graphics courtesy ofDaimlerChrysler AG
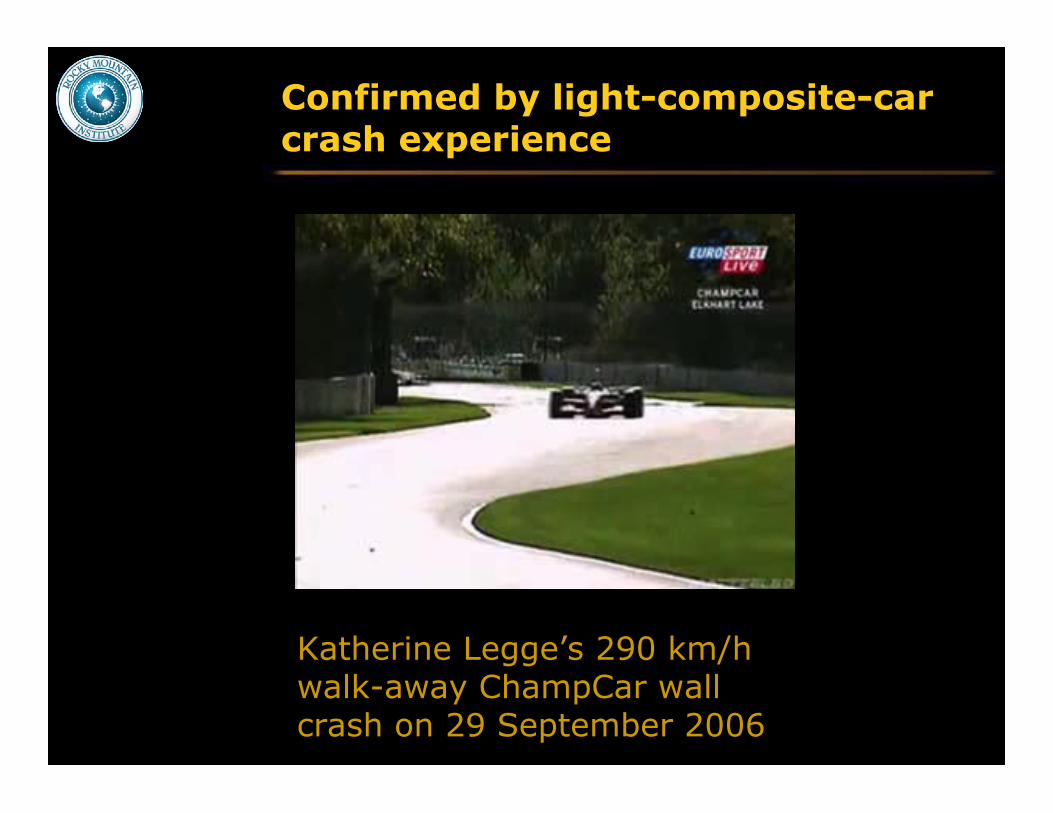
Confirmed by light-composite-carcrash experience
Katherine Legge’s 290 km/hwalk-away ChampCar wallcrash on 29 September 2006
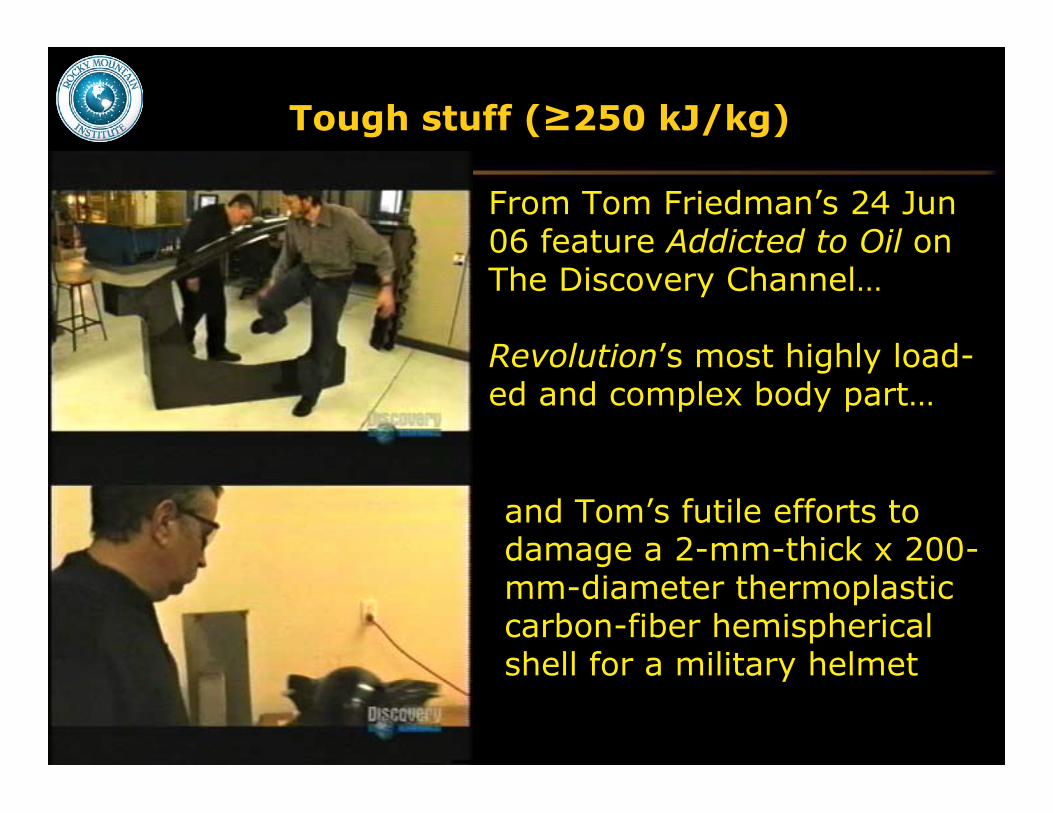
Tough stuff (≥250 kJ/kg)
From Tom Friedman’s 24 Jun06 feature Addicted to Oil onThe Discovery Channel…
Revolution’s most highly load-ed and complex body part…
and Tom’s futile efforts todamage a 2-mm-thick x 200-mm-diameter thermoplasticcarbon-fiber hemisphericalshell for a military helmet
-650
-400
-150
100
350
600
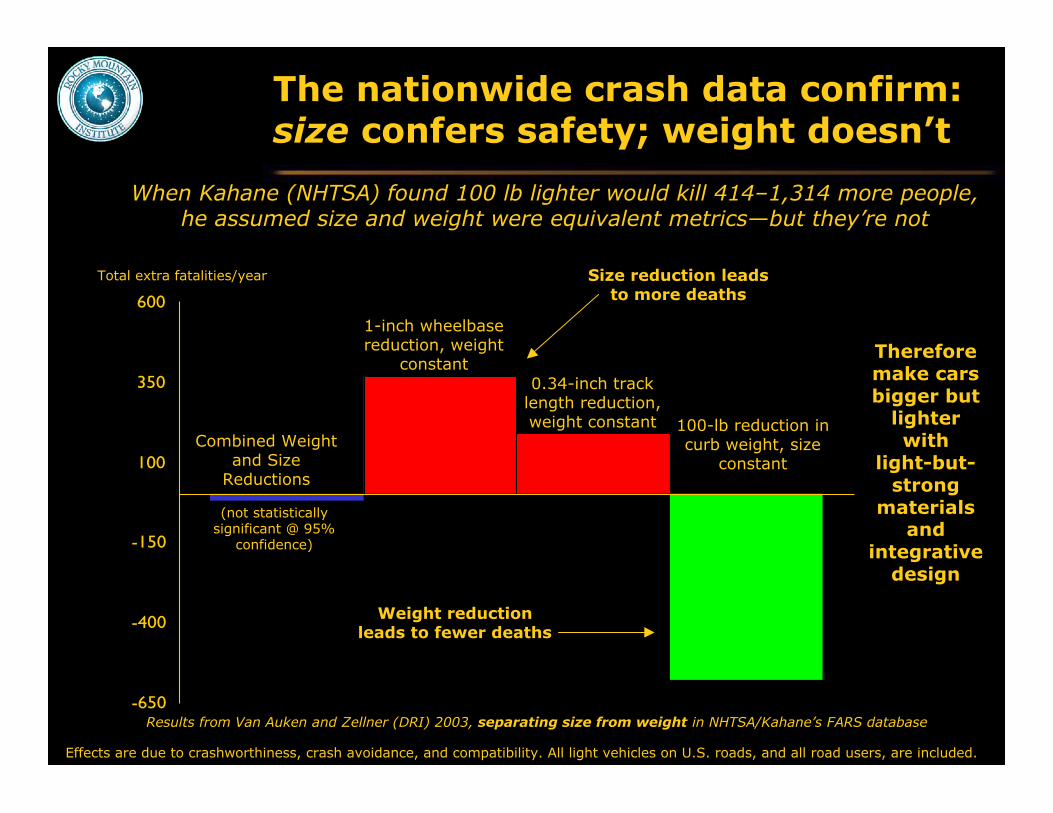
The nationwide crash data confirm:size confers safety; weight doesn’t
Combined Weightand Size
Reductions
1-inch wheelbasereduction, weight
constant0.34-inch track
length reduction,weight constant 100-lb reduction in
curb weight, sizeconstant
Weight reductionleads to fewer deaths
Size reduction leadsto more deaths
Effects are due to crashworthiness, crash avoidance, and compatibility. All light vehicles on U.S. roads, and all road users, are included.
(not statisticallysignificant @ 95%
confidence)
Results from Van Auken and Zellner (DRI) 2003, separating size from weight in NHTSA/Kahane’s FARS database
When Kahane (NHTSA) found 100 lb lighter would kill 414–1,314 more people,he assumed size and weight were equivalent metrics—but they’re not
Total extra fatalities/year
Thereforemake carsbigger but
lighterwith
light-but-strong
materialsand
integrativedesign
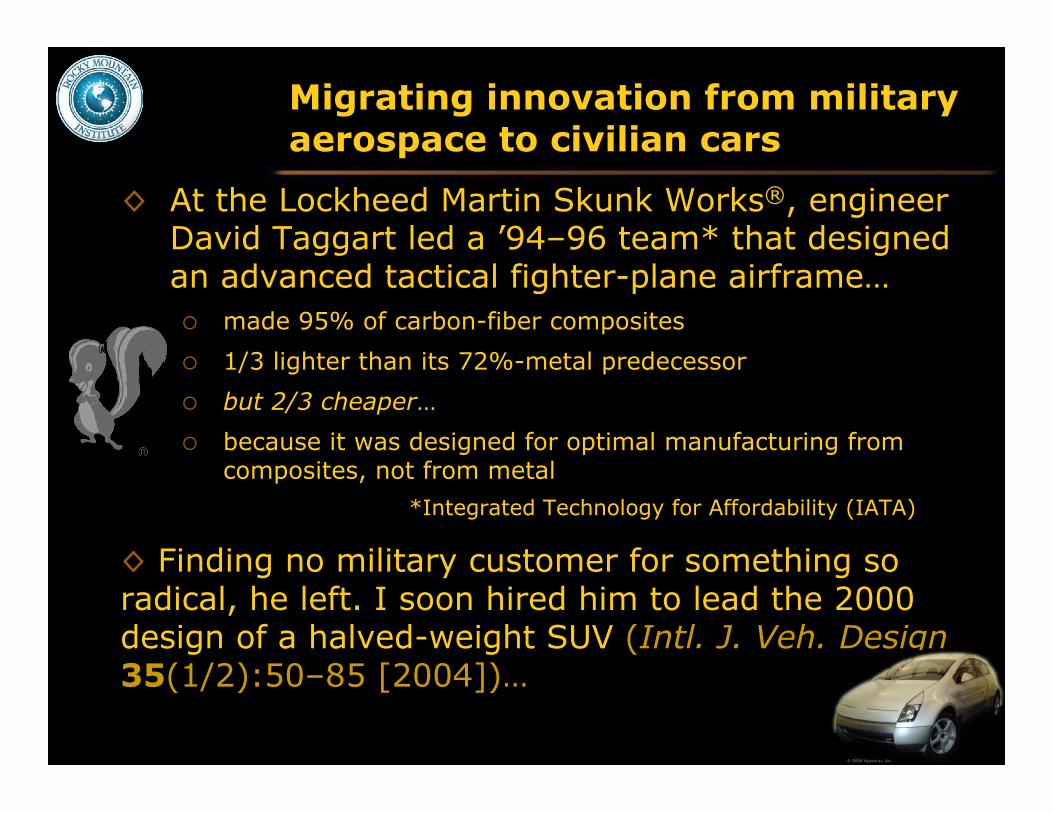
Migrating innovation from militaryaerospace to civilian cars
◊ At the Lockheed Martin Skunk Works®, engineerDavid Taggart led a ’94–96 team* that designedan advanced tactical fighter-plane airframe… made 95% of carbon-fiber composites
1/3 lighter than its 72%-metal predecessor
but 2/3 cheaper…
because it was designed for optimal manufacturing fromcomposites, not from metal
*Integrated Technology for Affordability (IATA)
◊ Finding no military customer for something soradical, he left. I soon hired him to lead the 2000design of a halved-weight SUV (Intl. J. Veh. Design35(1/2):50–85 [2004])…
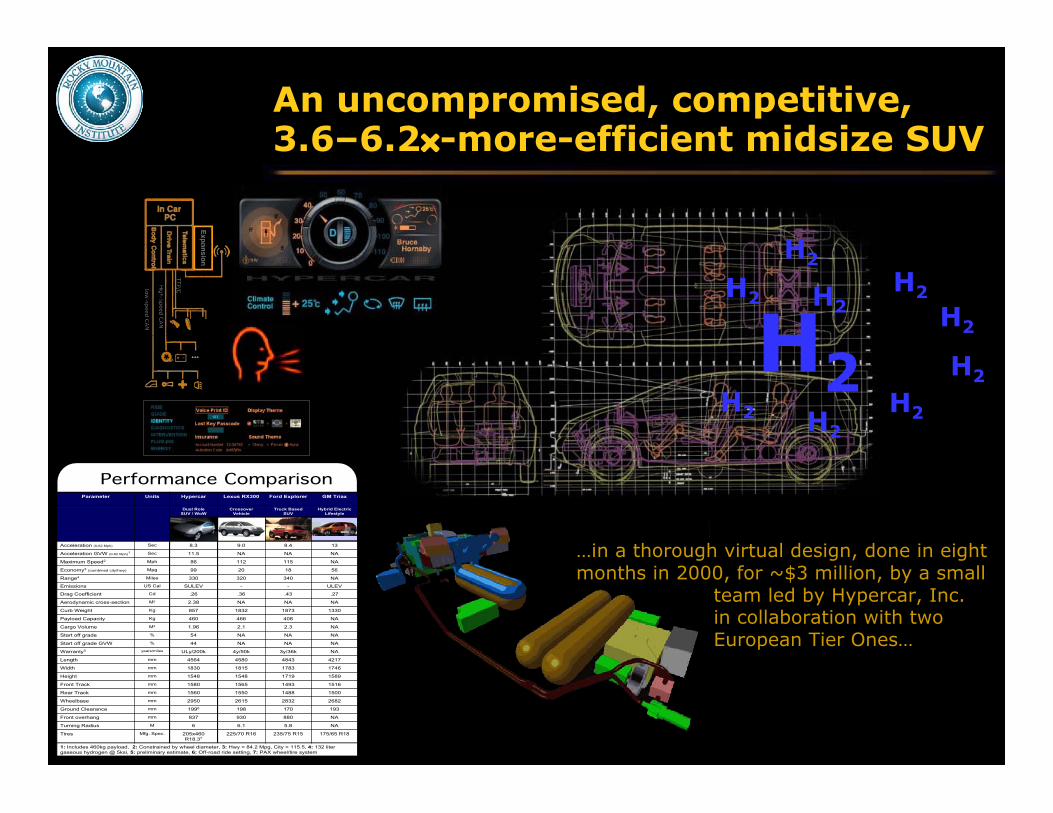
An uncompromised, competitive,3.6–6.2×-more-efficient midsize SUV
NA408466460KgPayload Capacity
NA2.32.11.96M3Cargo Volume
NANANA54%Start off grade
NANANA44%Start off grade GVW
NANANA11.5SecAcceleration GVW (0-62 Mph)1
1: Includes 460kg payload, 2: Constrained by wheel diameter, 3: Hwy = 84.2 Mpg, City = 115.5, 4: 132 liter gaseous hydrogen @ 5ksi, 5: preliminary estimate, 6: Off-road ride setting, 7: PAX wheel/tire system
NA340320330MilesRange4
Hybrid Electric Lifestyle
Truck Based SUV
Crossover Vehicle
Dual Role SUV / WoW
1931701981996mmGround Clearance
NA3y/36k4y/50kULy/200kyears/milesWarranty5
NANANA2.38M2Aerodynamic cross-section
.27.43.36.26CdDrag Coefficient
175/65 R18235/75 R15225/70 R16205x460 R18.37
Mfg. Spec.Tires
NA5.86.16MTurning Radius
NA880930837mmFront overhang
2682283226152950mmWheelbase
1500148815501560mmRear Track
1516149315651580mmFront Track
1589171915481548mmHeight
1746178318151830mmWidth
4217484345804564mmLength
133018731832857KgCurb Weight
ULEV--SULEVUS CalEmissions
56182099MpgEconomy3 (combined city/hwy)
NA11511286MphMaximum Speed2
138.49.08.3SecAcceleration (0-62 Mph)
GM TriaxFord ExplorerLexus RX300HypercarUnitsParameter
Performance Comparison
H2H2
H2
H2
H2
H2
H2
H2
H2
H2
…in a thorough virtual design, done in eightmonths in 2000, for ~$3 million, by a small team led by Hypercar, Inc. in collaboration with two European Tier Ones…
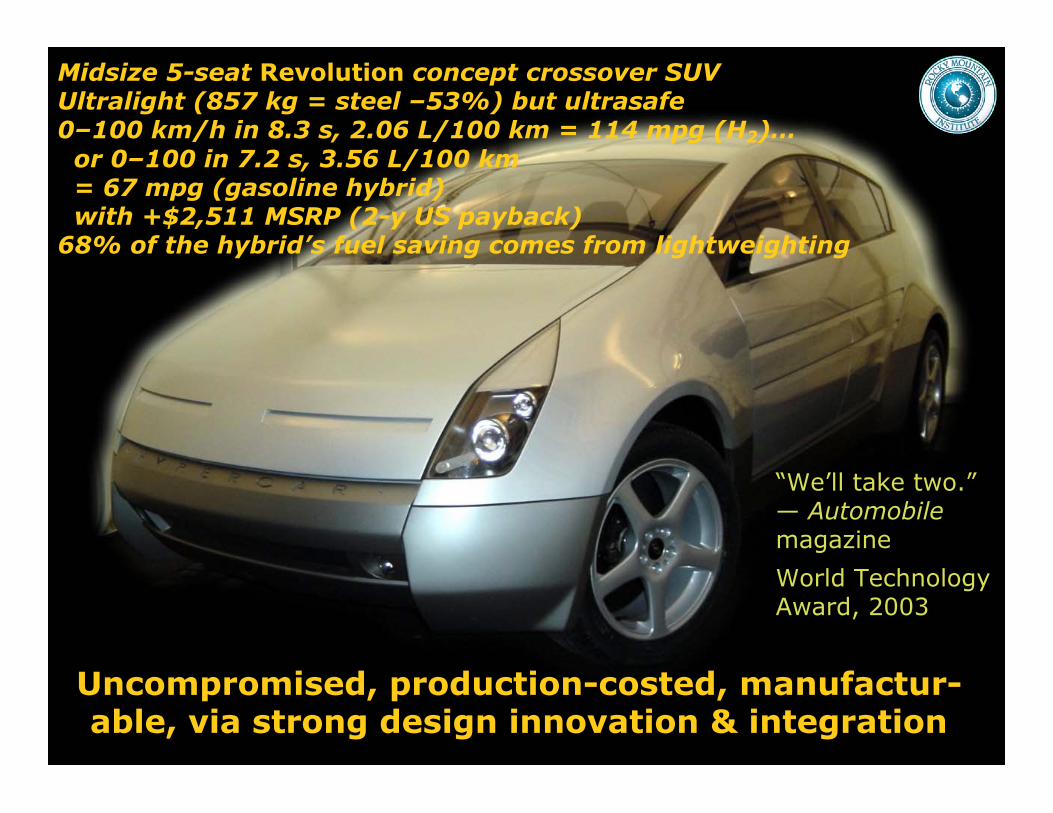
Uncompromised, production-costed, manufactur-able, via strong design innovation & integration
Midsize 5-seat Revolution concept crossover SUVUltralight (857 kg = steel –53%) but ultrasafe0–100 km/h in 8.3 s, 2.06 L/100 km = 114 mpg (H2)… or 0–100 in 7.2 s, 3.56 L/100 km = 67 mpg (gasoline hybrid) with +$2,511 MSRP (2-y US payback)68% of the hybrid’s fuel saving comes from lightweighting
“We’ll take two.”— Automobilemagazine
World TechnologyAward, 2003

In the United States, like finding a Saudi Arabia under Detroit
In ultimate worldwide full-scale production, a nega-OPEC
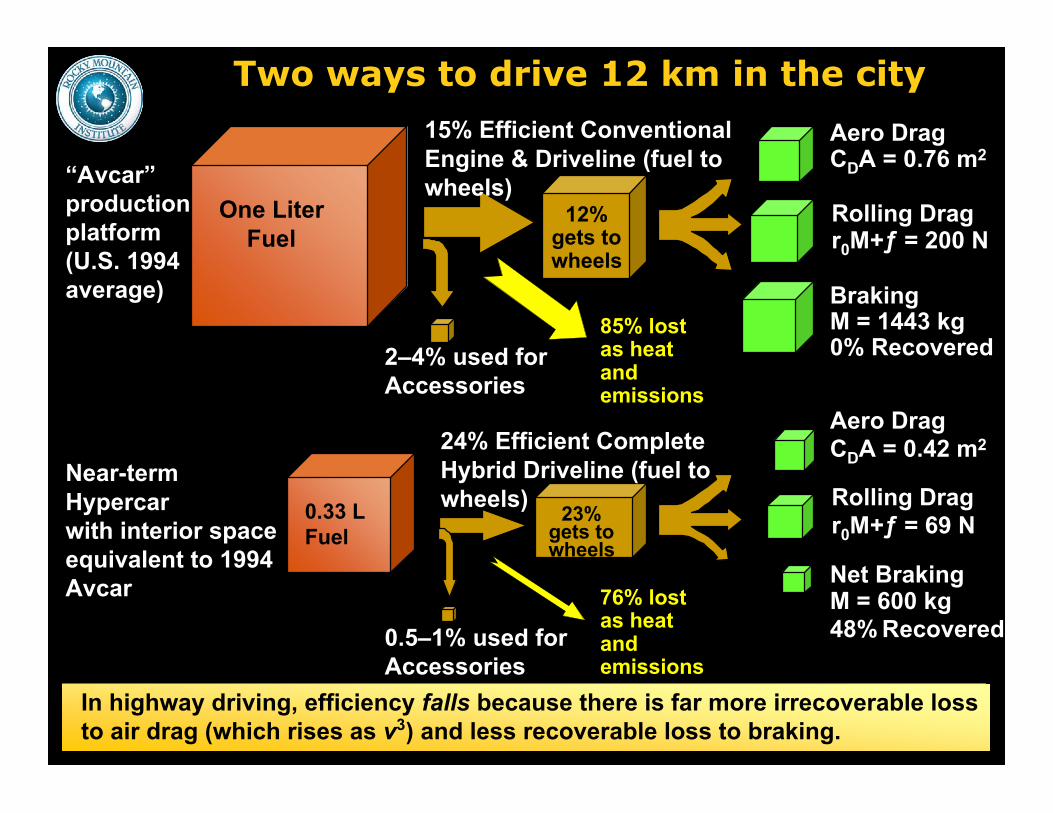
Near-termHypercarwith interior spaceequivalent to 1994Avcar
One LiterFuel
12%gets towheels
Aero DragCDA = 0.76 m2
Rolling Dragr0M+ƒ = 200 N
BrakingM = 1443 kg0% Recovered
15% Efficient ConventionalEngine & Driveline (fuel towheels)
In highway driving, efficiency falls because there is far more irrecoverable lossto air drag (which rises as v3) and less recoverable loss to braking.
Aero DragCDA = 0.42 m2
Rolling Dragr0M+ƒ = 69 N
Net BrakingM = 600 kg48% Recovered
24% Efficient CompleteHybrid Driveline (fuel towheels)0.33 L
Fuel23%
gets towheels
“Avcar”productionplatform(U.S. 1994average)
0.5–1% used forAccessories
2–4% used forAccessories
Two ways to drive 12 km in the city
85% lostas heatandemissions
76% lostas heatandemissions

Decompounding mass and com–plexity also decompounds cost
Only ~40–80 kg C, 20–45 kWe, no paint?,little assembly, radical simplification assignificant components/systems go away
Exotic materials, low-volume specialpropulsion components, innovative design
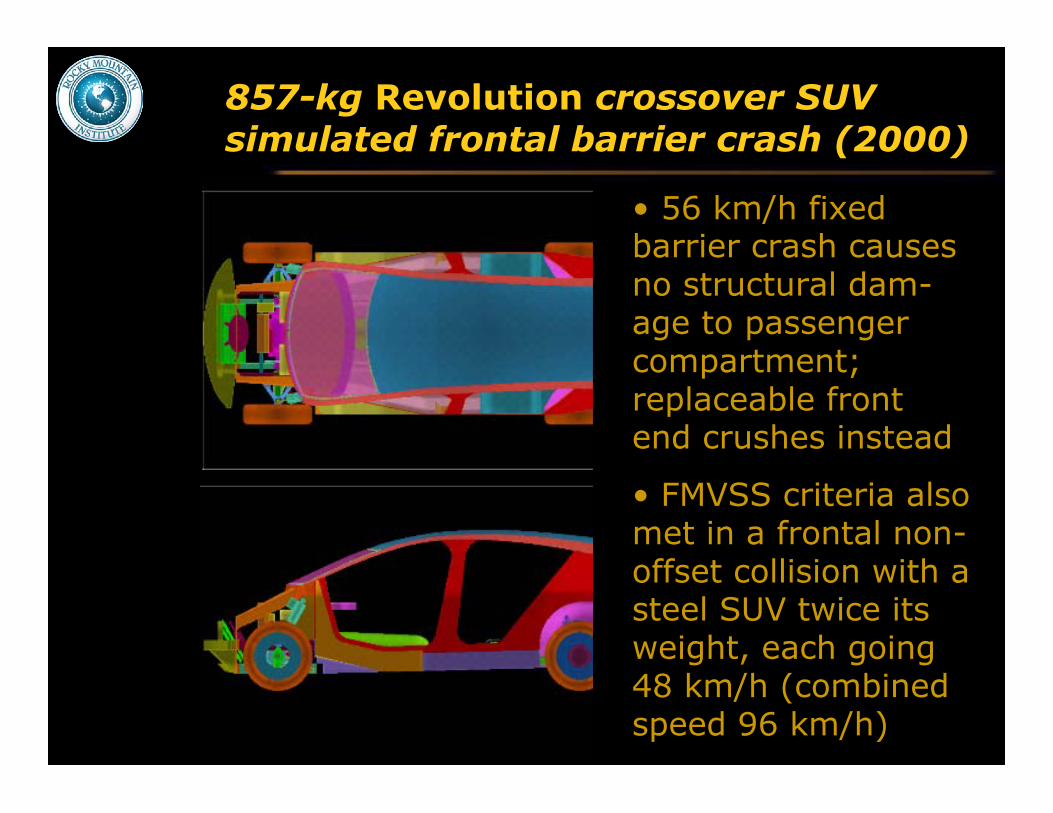
857-kg Revolution crossover SUVsimulated frontal barrier crash (2000)
• 56 km/h fixedbarrier crash causesno structural dam-age to passengercompartment;replaceable frontend crushes instead
• FMVSS criteria alsomet in a frontal non-offset collision with asteel SUV twice itsweight, each going48 km/h (combinedspeed 96 km/h)
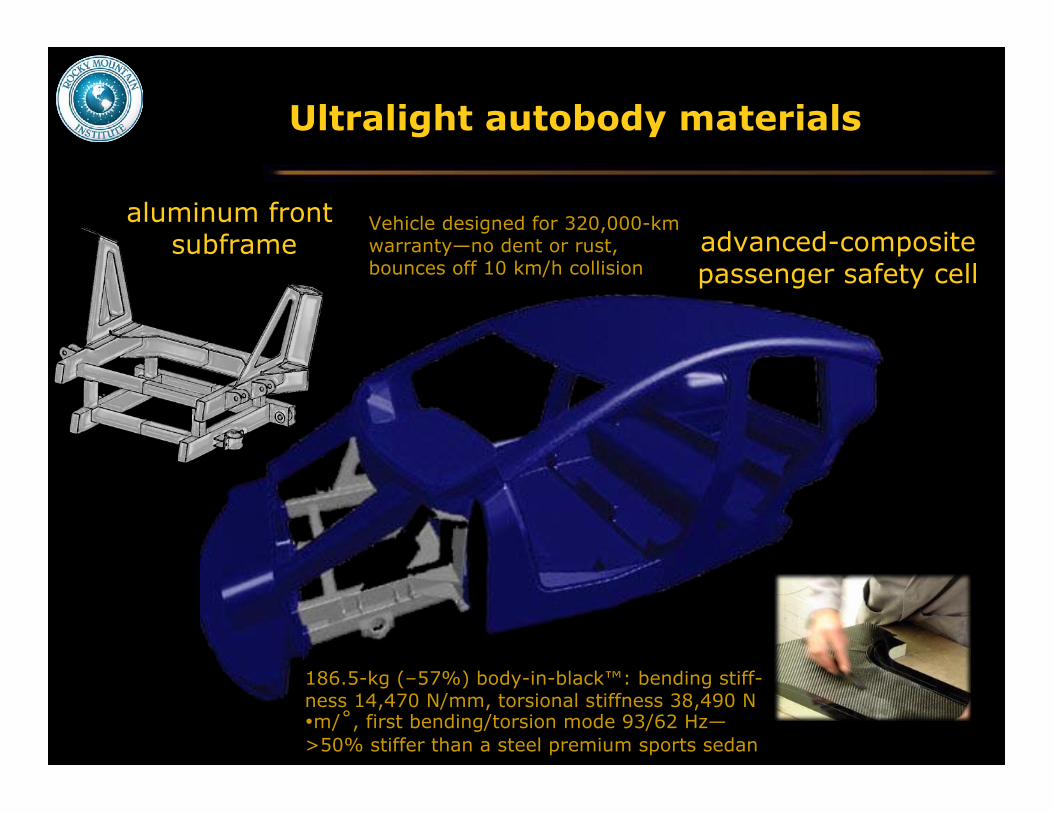
Ultralight autobody materials
aluminum front subframe advanced-composite
passenger safety cell
186.5-kg (–57%) body-in-black™: bending stiff-ness 14,470 N/mm, torsional stiffness 38,490 N•m/˚, first bending/torsion mode 93/62 Hz—>50% stiffer than a steel premium sports sedan
Vehicle designed for 320,000-kmwarranty—no dent or rust,bounces off 10 km/h collision
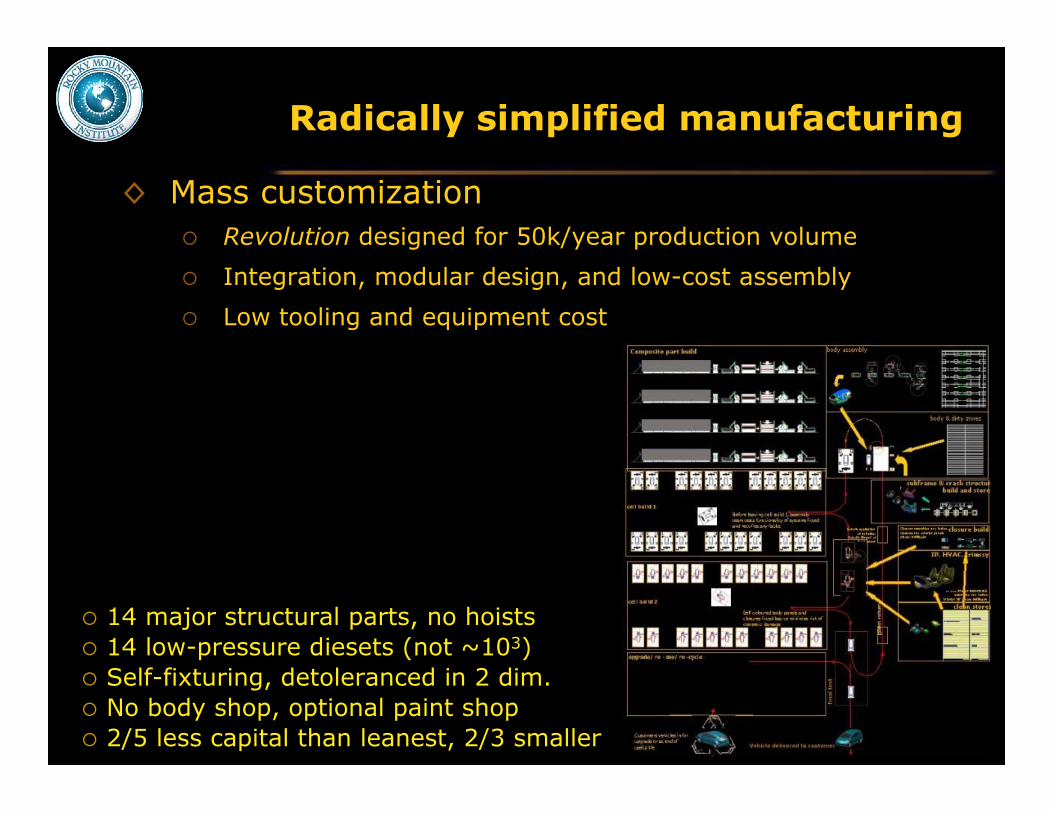
Radically simplified manufacturing
◊ Mass customization Revolution designed for 50k/year production volume
Integration, modular design, and low-cost assembly
Low tooling and equipment cost
14 major structural parts, no hoists 14 low-pressure diesets (not ~103) Self-fixturing, detoleranced in 2 dim. No body shop, optional paint shop 2/5 less capital than leanest, 2/3 smaller

Rapid progress with midvolume cost-competitive advanced composites
◊ BMW: 60 specialists at Landshut, world’s biggestRTM press, series production 2000+5…? Already making >1k/y carbon roofs, hoods,…
Website strongly praises carbon composites
◊ Honda and Toyota: carbon-fiber airplanes
◊ Fiberforge®: 1999 RMI spinoff (W. Colo.) Patented digital automated fiber placement process
Thermoform to net shape with ≤1-minute cycle time
≥80% of hand-layup aerospace performance @ 20% of cost
Mature process at scale beats Al in $/part, steel in $/bodyat midvolume, and steel in $/car at any volume
Sample & development customers include OEMsand Tier 1s, e.g. JCI Genus seat (NAIAS 05)
World Techn. Award ’03, Davos Tech Pioneer ’07
Concept Z22(2000)

Automated volume mfg. of continuous-fiber-reinforced thermoplastic structuresSee www.fiberforge.com for technical details and papers
1. Digitally controlled automated fiber placement tocreate a flat preform (tailored blank™)◊ Fast (1.35 m/s and rising), precise, CAD-driven
◊ Variable thickness, fiber mix/alignment/location
◊ Ideal for anisotropic parts optimized to load paths
Carbon/nylon-6 seat-back frame (NAIAS ’05)
Carbon/PEEK 200-mm hemisphere
SOME DIVERSE MATERIALSSYSTEMS & APPLICATIONS
This video is Fiberforge proprietary
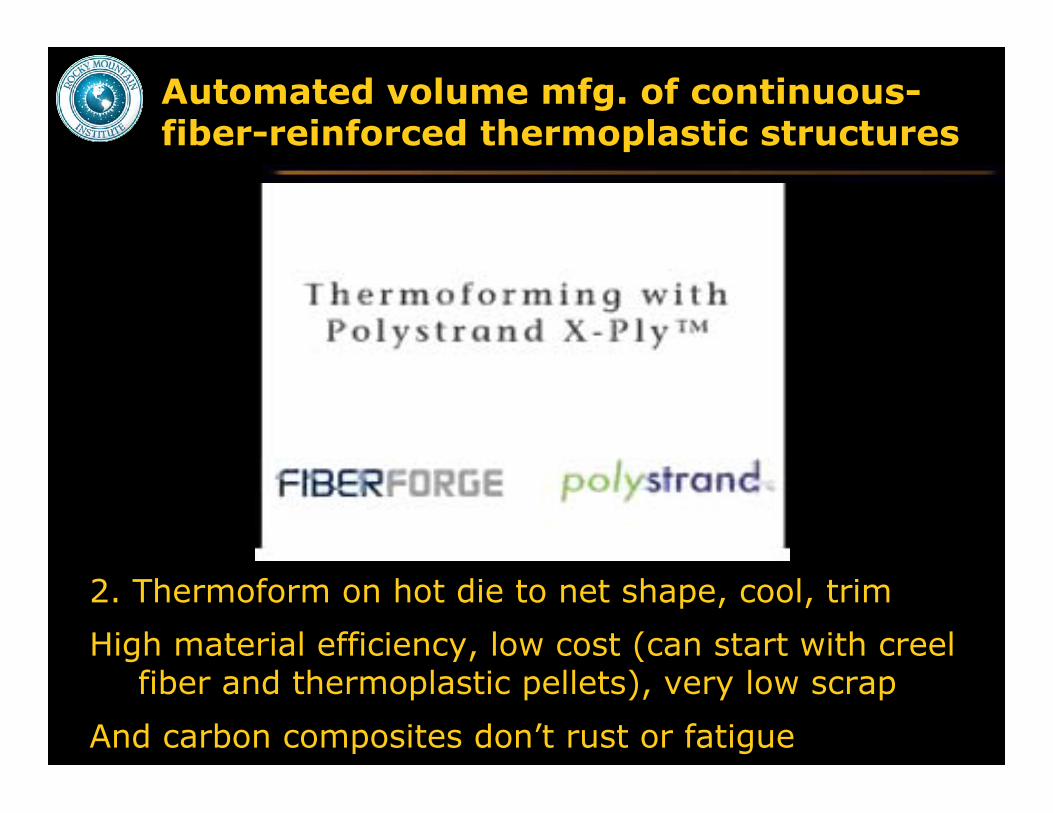
Automated volume mfg. of continuous-fiber-reinforced thermoplastic structures
2. Thermoform on hot die to net shape, cool, trim
High material efficiency, low cost (can start with creelfiber and thermoplastic pellets), very low scrap
And carbon composites don’t rust or fatigue

Car design: six ko-ans (公案)
◊ Big fuel savings cost less than small fuelsavings
◊ To leap forward, think backwards
◊ By not saving fuel, more fuel is saved
◊ To make cars inexpensive, use costly materials
◊ To make cars safer, make them much lighter
◊ To get the cleanest and most efficient cars,don’t mandate them—just let the customerdemand and get superior design
Result: an automotive hiyaku (飛躍, leapfrog)

Light-vehicle analysis based ondetailed, production-costedvirtual design for midsize SUV
• Crossover concept SUV designed with two Tier I’s in2000; combination of unique public & proprietary data• Three powertrain variants resimulated by consultants• Production cost independently analyzed at 499-line-item level of detail, largely by industry bids @ 50,000/y• Scaled to all light vehicles by well-validated methods

Ultralight-but-safe light vehiclesopen a new doubled-efficiencydesign space at no extra cost
500
1,000
1,500
2,000
2,500
3,000
3,500
4,000
4,500
5,000
11.8 7.8 5.9 4.7 3.9 3.4 2.9 2.6
0
All Vehicles Shown in Green are Adjusted to EIA’s 2025 Acceleration Capability for That Class of VehicleRMI’s 2004 Average Vehicles are for EIA’s 2025 Sales Mix
NRC 2001Light Trucks
NRC Low2001 Light
Trucks
NRC High2001 Cars
NRC Low2001 Cars
Pric
e In
crea
se (M
SRP
2000
$)
Absolute Liters per 100 Kilometers(EPA Adjusted, Combined City/Highway)
2004 RMIConventionalWisdom Light
Truck
2004 RMI Conventional Wisdom Average Car
DeCicco & Ross 1995 Full Avg.
DeCicco, An & Ross 2001 Mod & Adv Cars
2004 RMIState of theArt AverageLight Truck
2004 RMIState of theArt Average
Car
2004 Prius(2004 Actual to ~2007 Goal)
2002 ULSAB-AVC Hybrid(Rough RMI Estimate ofInitial and More Mature Cost)
2002 ULSAB-AVC
*33 steel firms + Porsche Eng.: 2,200-lbTaurus-class, 52 mpg, 5✩ safety, $9,538production cost; BIW –52 kg, –$7
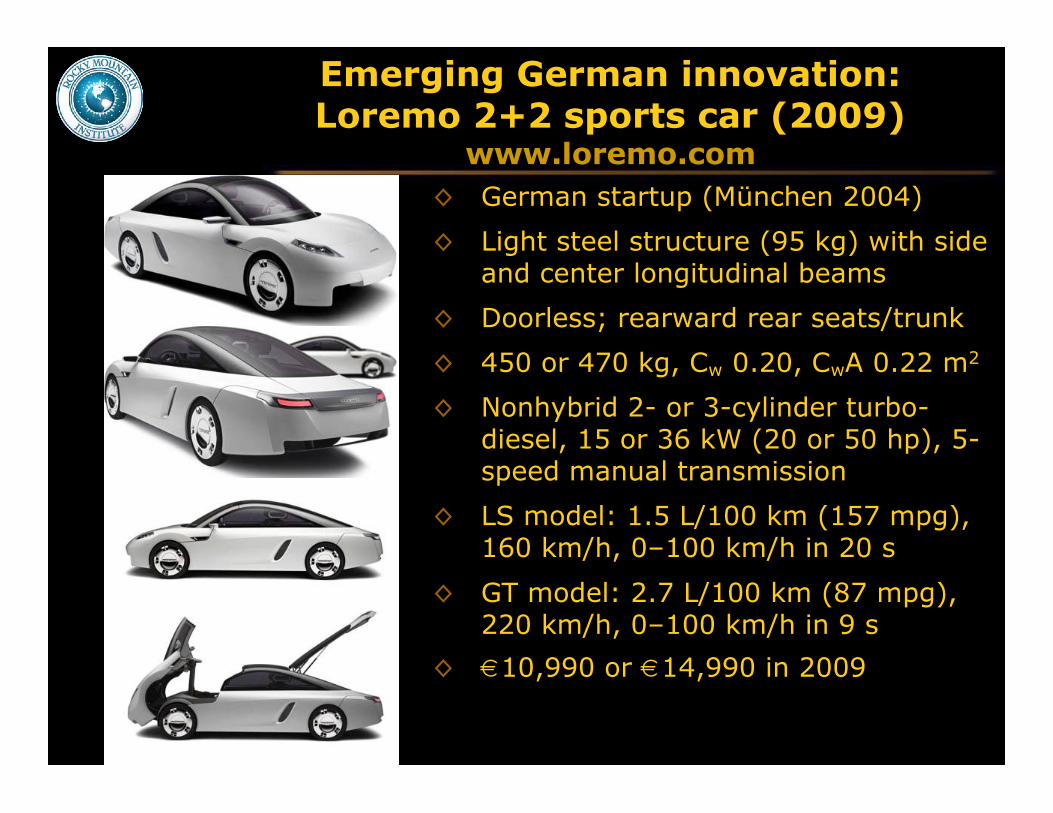
Emerging German innovation:Loremo 2+2 sports car (2009)
www.loremo.com◊ German startup (München 2004)
◊ Light steel structure (95 kg) with sideand center longitudinal beams
◊ Doorless; rearward rear seats/trunk
◊ 450 or 470 kg, Cw 0.20, CwA 0.22 m2
◊ Nonhybrid 2- or 3-cylinder turbo-diesel, 15 or 36 kW (20 or 50 hp), 5-speed manual transmission
◊ LS model: 1.5 L/100 km (157 mpg),160 km/h, 0–100 km/h in 20 s
◊ GT model: 2.7 L/100 km (87 mpg),220 km/h, 0–100 km/h in 9 s
◊ €10,990 or €14,990 in 2009

Stages of the emergingautomotive [r]evolution
◊ An excellent hybrid, properly driven, doubles efficiency Considerably more if new diesels can meet ratcheting air regs
◊ Ultralighting (+ better aero and tires) redoubles eff’y.
◊ Cellulosic-ethanol E85 quadruples oil efficiency again Biofuels can make driving a way to protect, not harm, the climate
◊ A good plug-in hybrid (such as Toyota is rumored toplan for initial release MY08) redoubles fuel efficiencyagain, and could be attractive if the power grid buysits electric storage function Precursor of “vehicle-to-grid” fuel-cell play—power plant on wheels
So far, these stages can save 97% of the oil/km used today
◊ Hydrogen fuel cells also compete via cheaper ¢/kmand 2–6× less CO2/km (or zero CO2 if renewable)

857-kg curb mass (÷2), low drag, load ÷3,so 89 km/h on same power as normal a/c,so ready now for direct hydrogen fuel cells
137-liter 345-bar H2 storage(small enough to package):
3.4 kg for 532-km range
35-kW fuel cell (smallenough to afford early:~32x less cumulativeproduction needed toreach needed price)
35-kWload-leveling
batteries
Identical logic for HEVs, PHEVs, BEVs
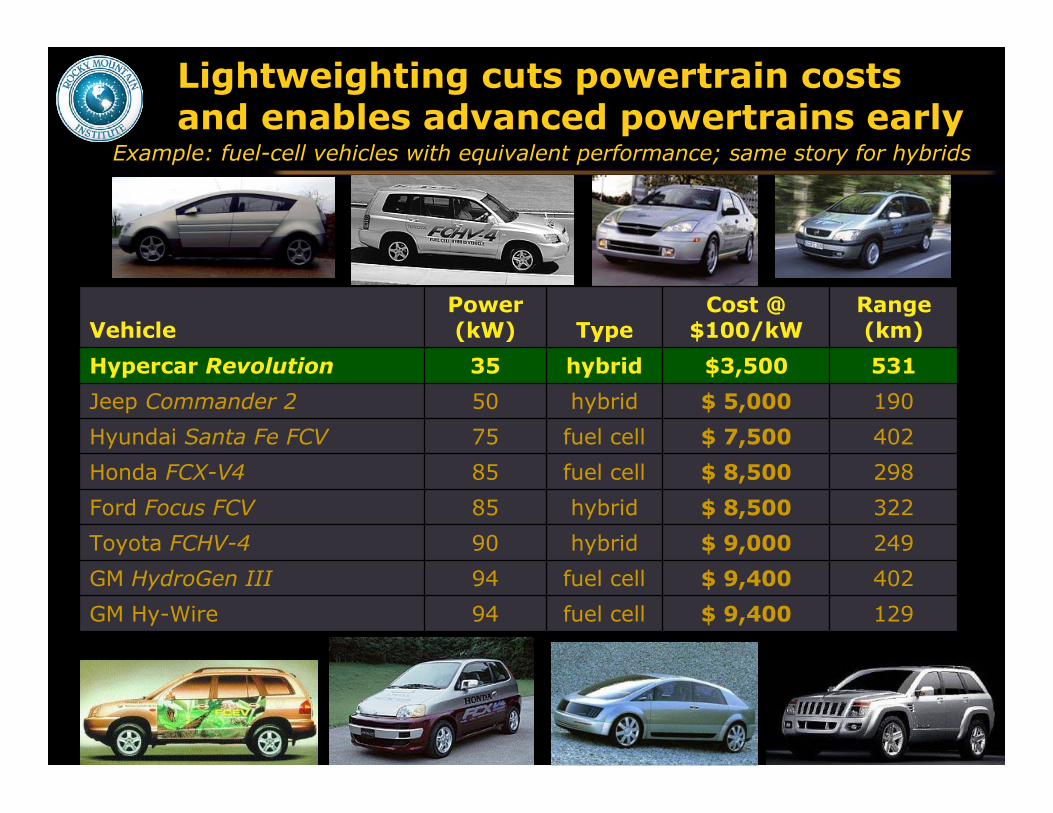
Lightweighting cuts powertrain costsand enables advanced powertrains early
190$ 5,000hybrid50Jeep Commander 2
129$ 9,400fuel cell94GM Hy-Wire
402$ 9,400fuel cell94GM HydroGen III
249$ 9,000hybrid90Toyota FCHV-4
322$ 8,500hybrid85Ford Focus FCV
298$ 8,500fuel cell85Honda FCX-V4
402$ 7,500fuel cell75Hyundai Santa Fe FCV
531$3,500hybrid35Hypercar Revolution
Range(km)
Cost @$100/kWType
Power(kW)Vehicle
Example: fuel-cell vehicles with equivalent performance; same story for hybrids

Platform physics is more important thanpowertrain—and is vital to its economics
◊ Cars can run clean IC engines on gasoline or NG (≡1η)◊ Better ones using hydrogen in IC engines (≤1.5 η)◊ Still better ones using H2 in IC-engine hybrids (~2.5η)
Ford “Model U” concept car…but tanks >4× bigger (niche market)
◊ Better still: ultralight autobodies, low CDA & r0 (≥3η)◊ Power those platforms with IC-engine hybrids (3.5–4η)
Hypercar 5-seat carbon Revolution has the same mc & CD as 2-seataluminum Honda Insight…Insight-engine hybrid version 3.6L/100km
◊ Best: put fuel cells in such superefficient bodies (5–6η)◊ The aim isn’t just saving fuel and pollution
Also strategic goals in automaking, plug-in power-plants-on-wheels,off-oil, primary fuel flexibility, accelerated transition to renewables,…
◊ H2 needs 5η vehicles far more than vice versa◊ 5η vehicles make robust the business case for
providing the H2 that their fuel cells would need
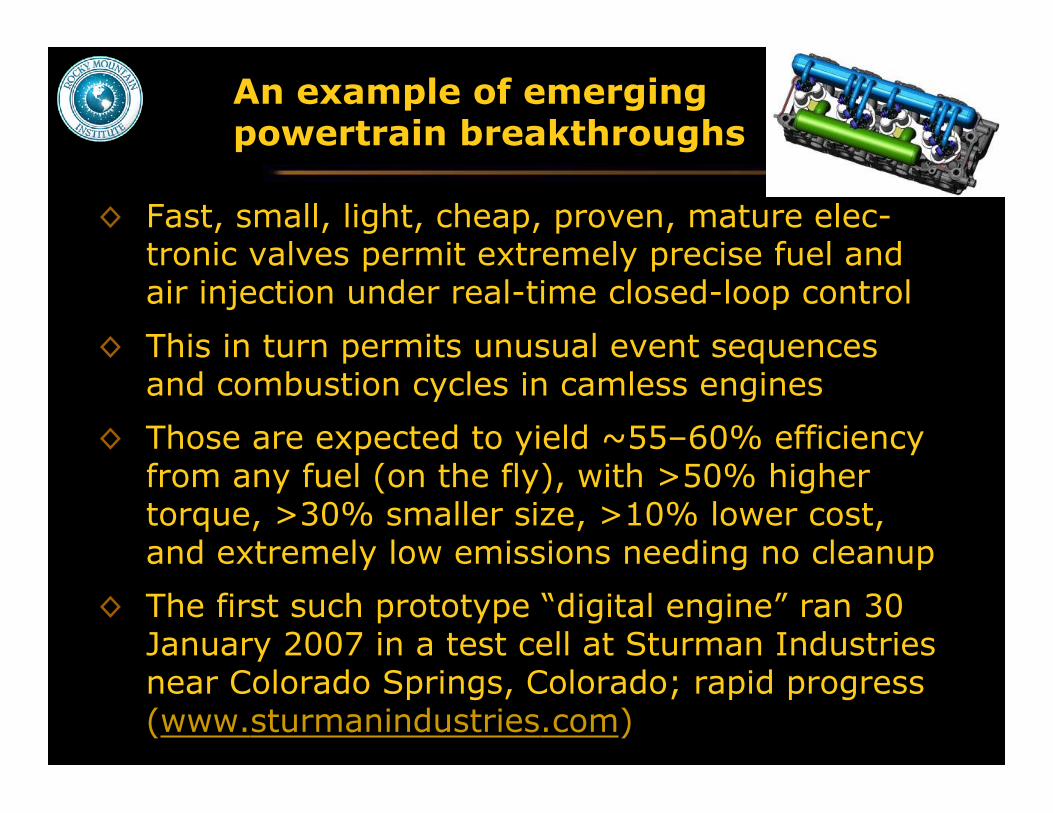
An example of emergingpowertrain breakthroughs
◊ Fast, small, light, cheap, proven, mature elec-tronic valves permit extremely precise fuel andair injection under real-time closed-loop control
◊ This in turn permits unusual event sequencesand combustion cycles in camless engines
◊ Those are expected to yield ~55–60% efficiencyfrom any fuel (on the fly), with >50% highertorque, >30% smaller size, >10% lower cost,and extremely low emissions needing no cleanup
◊ The first such prototype “digital engine” ran 30January 2007 in a test cell at Sturman Industriesnear Colorado Springs, Colorado; rapid progress(www.sturmanindustries.com)
And what about plug-in hybrids?
◊ Better platform physics are the key to makingPHEVs efficient and affordable
◊ PHEVs can further improve powertrain efficiencyand, depending on fuel and power sources, emitcomparable or less CO2 per km driven
◊ PHEVs can charge with cheap offpeak electricityand sell valuable storage at peak hours back tothe grid, paying for the batteries (which theutility may finance or own)
◊ PHEVs add offpeak storage to the grid, expand-ing markets for variable renewables (windpower)
◊ This needs a “smart garage”
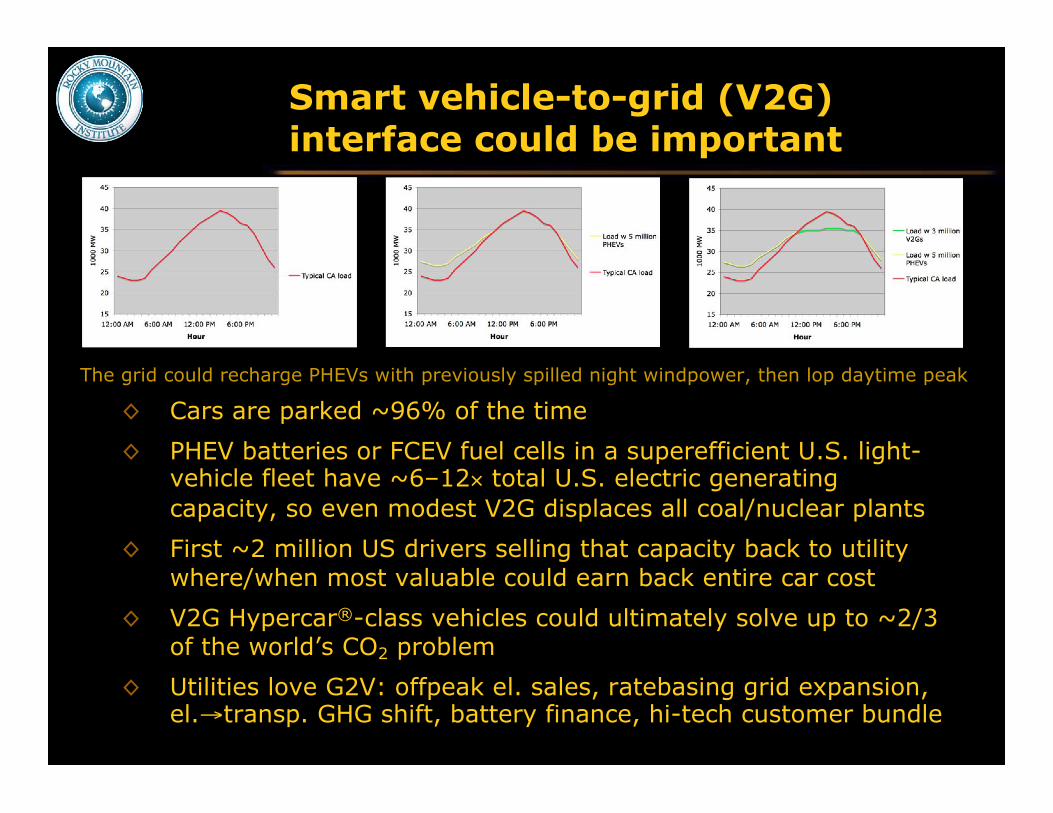
Smart vehicle-to-grid (V2G)interface could be important
◊ Cars are parked ~96% of the time
◊ PHEV batteries or FCEV fuel cells in a superefficient U.S. light-vehicle fleet have ~6–12× total U.S. electric generatingcapacity, so even modest V2G displaces all coal/nuclear plants
◊ First ~2 million US drivers selling that capacity back to utilitywhere/when most valuable could earn back entire car cost
◊ V2G Hypercar®-class vehicles could ultimately solve up to ~2/3of the world’s CO2 problem
◊ Utilities love G2V: offpeak el. sales, ratebasing grid expansion,el.→transp. GHG shift, battery finance, hi-tech customer bundle
The grid could recharge PHEVs with previously spilled night windpower, then lop daytime peak
Today’s cars: the highestexpression of the Iron Age
◊ Extraordinary technical and commercial achievement, $1T/y industry
◊ The most complex mass-produced artifact in human history
◊ Produced every 2 seconds in the U.S. alone
◊ Costs less per kg than a McDonald’s quarter-pound hamburger
◊ Meets demanding and often conflicting requirements with great skill
◊ But many reasons for rapid and fundamental change now emerging convergent products and shrinking niches
in saturated core markets
at cutthroat commodity prices
with stagnant basic innovation
and growing global overcapacity
forcing increasing consolidation
yet thin profits limit investment & recruitment…
thus a great industry but a bad business
◊ Time for something completely different!
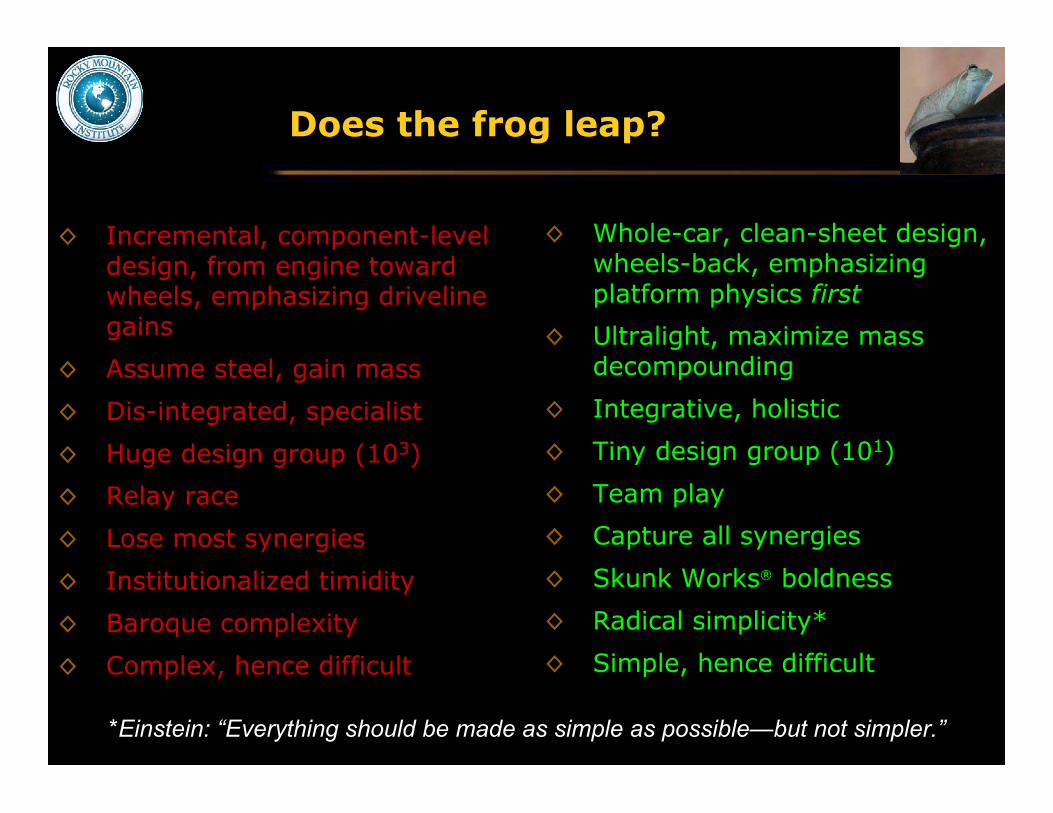
Does the frog leap?
◊ Incremental, component-leveldesign, from engine towardwheels, emphasizing drivelinegains
◊ Assume steel, gain mass
◊ Dis-integrated, specialist
◊ Huge design group (103)
◊ Relay race
◊ Lose most synergies
◊ Institutionalized timidity
◊ Baroque complexity
◊ Complex, hence difficult
◊ Whole-car, clean-sheet design,wheels-back, emphasizingplatform physics first
◊ Ultralight, maximize massdecompounding
◊ Integrative, holistic
◊ Tiny design group (101)
◊ Team play
◊ Capture all synergies
◊ Skunk Works® boldness
◊ Radical simplicity*
◊ Simple, hence difficult
*Einstein: “Everything should be made as simple as possible—but not simpler.”

Is Detroit ready for transformationby such disruptive technologies?
◊ Tremendous engineering talent…if unleashed
◊ Weak balance sheets, slow innovation, manycultural and structural rigidities
◊ Tend to treat sunk costs as unamortized assets Must base strategic choices on economics, not accounting
Must also consider cost per car, not per part or per kg
◊ Incoherence persists: lobbying and litigationstrategy tends to stomp on internal innovation GM’s EV-1, 2001 anti-CAFE, now Pavley (California CO2 law)
◊ But cultural obstacles are starting to weaken underthe assault of Schumpeterian “creative destruction” Better to embrace disruptive technology early than be forced
into it late and grudgingly

Can Detroit use efficiency asa transformative strategy?
◊ Boeing’s crisis in 1997 was like Detroit’s today Wrenching changes instituted at BCA, including TPS (e.g., moving
assembly); manufacturing and costs brought back under control But what about growth? What was in the pipeline after 777?
◊ In 2003, Airbus for the first time outproduced Boeing “This is really a pivotal moment…could be the beginning of the end for
Boeing's storied airplane business,” said Richard L. Aboulafia, a TealGroup aerospace analyst, in 2003
◊ Boeing’s bold, efficiency-led 2004 response: 787 Dreamliner ≥20% more efficient than comparable modern aircraft, same price 80% advanced composite by volume, 50% by mass
› Bigger windows, higher-pressure cabin 3-day final assembly (737 takes 11 days) 513 orders (490 firm + 23 pending), 314 additional options Sold out until 2013—fastest order takeoff of any airliner in history Now rolling out 787’s radical advances to all models (Yellowstone)
◊ Airbus: Ultra-jumbo A380, 2 years late, ~€5b over budget Response? Efficient, composite A350—probably too late

Key straws in theshifting winds of Detroit
◊ 2004: RMI suggests OEMs imitate Boeing2006: Alan Mulally, leader of Boeing CommercialAirplanes, becomes CEO of Ford “[He] said the automaker would require a full transformation
…of the product line and…of the business”—not the typicalDetroit turnaround. —New York Times, 24 Oct 2006, p. 1
◊ OEMs’ increasing openness to basic mfg. change
◊ UAW and dealers now pushing innovation as thebest hope of saving the OEMs
◊ Emerging prospects of leapfrogs by China, India,and even new market entrants
◊ Competition, at a fundamental level and at apace last seen in the 1920s, will change OEMs’managers or their minds, whichever comes first

Heavy trucks: save 25% free,65% @ 25¢/gallon
Better aero & tires, better engines etc., less weight
6.2 to 11.8 mpg with 60% IRRby improving aero drag, tires,engines, mass, driveline, acces.loads & APU; then ~16 mpg viaoperational improvements;being built 2005
PACCAR high-eff.concept truck
Colani/Spitzer tanker (Europe),reportedly 11.25 mpg
Big haulers’ margins double from 3% to 6–7%…so create demand pull—currently underway, led by major customers
Two recentconcept trucks
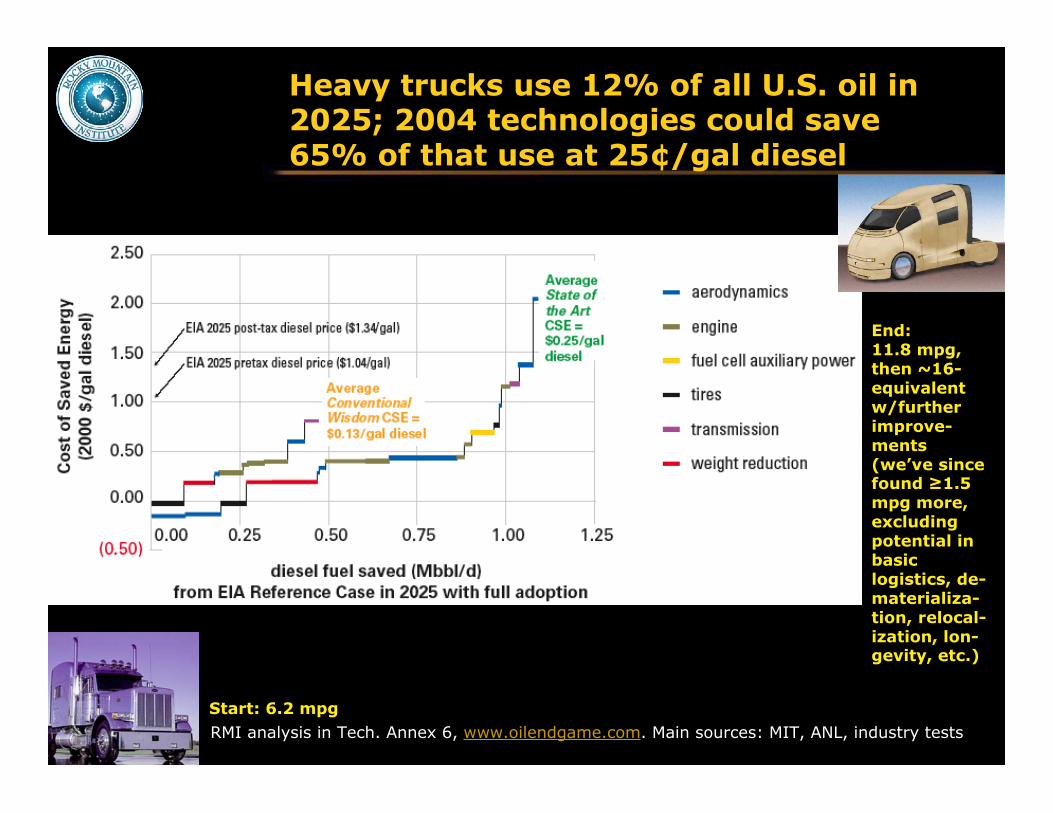
End:11.8 mpg,then ~16-equivalentw/furtherimprove-ments(we’ve sincefound ≥1.5mpg more,excludingpotential inbasiclogistics, de-materializa-tion, relocal-ization, lon-gevity, etc.)
RMI analysis in Tech. Annex 6, www.oilendgame.com. Main sources: MIT, ANL, industry tests
Heavy trucks use 12% of all U.S. oil in2025; 2004 technologies could save65% of that use at 25¢/gal diesel
Start: 6.2 mpg

56% engine +12% idling & aux 2%
trans19%
aero 11%tires
4.5%movestruck
100% First, reduce aeroand tire drag by 50%
Each unit of avoided energy flow or friction in the pipe saves ten unitsof fuel at the power plant
6.5%movescargo
1%
driveline
Result: 50% less fuel Reduce idletime by 80%
with APU
Losses and savings multiplySavings downstream make
upstream equipment smaller and cheaper
This and following slide courtesy of M. Ogburn, RMI
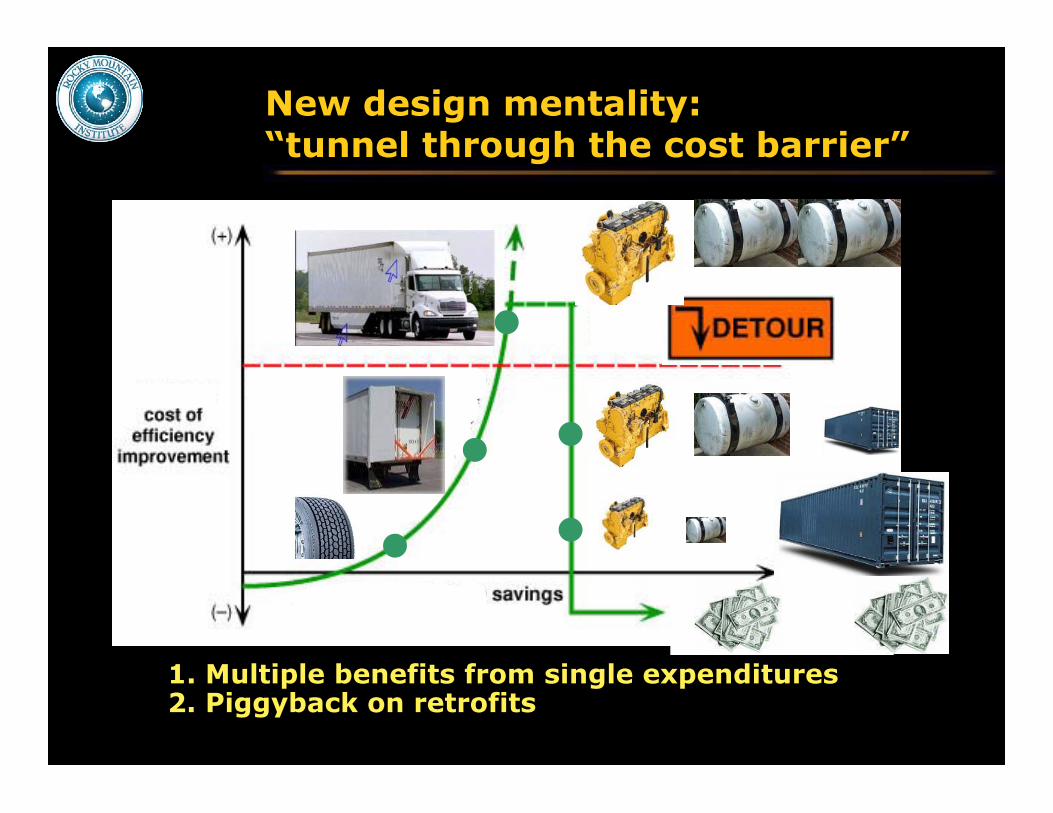
New design mentality:“tunnel through the cost barrier”
1. Multiple benefits from single expenditures2. Piggyback on retrofits
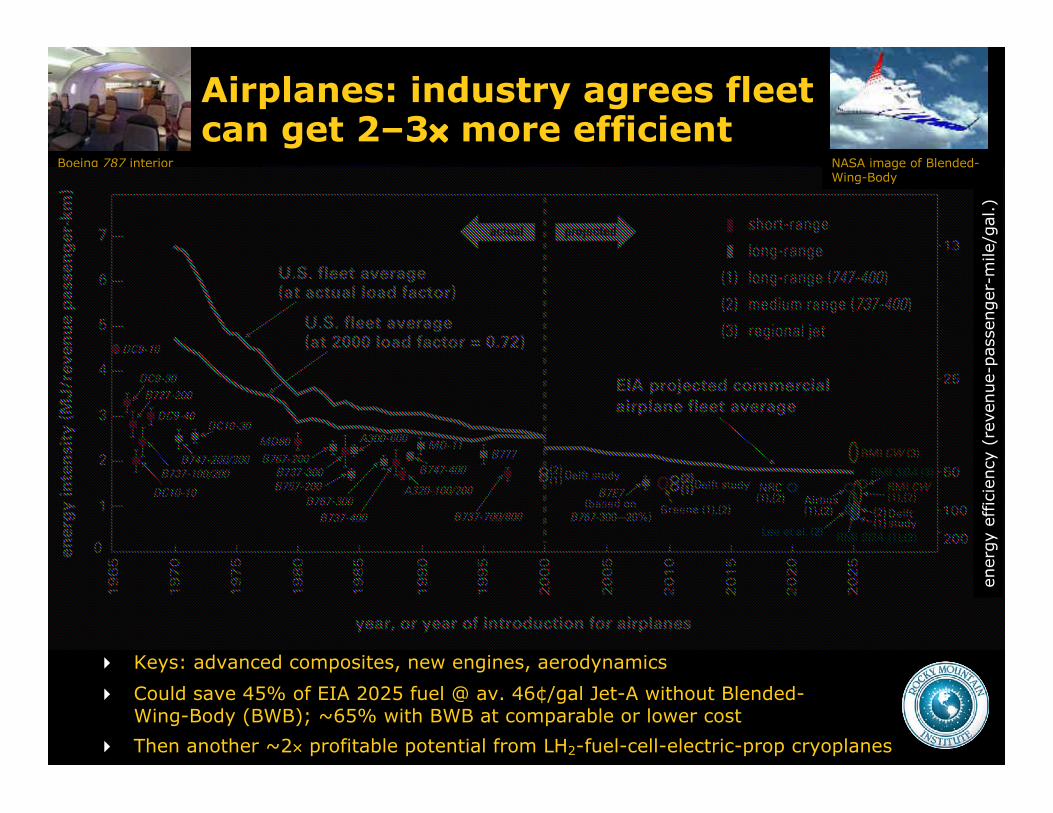
Airplanes: industry agrees fleetcan get 2–3× more efficient
Keys: advanced composites, new engines, aerodynamics
Could save 45% of EIA 2025 fuel @ av. 46¢/gal Jet-A without Blended-Wing-Body (BWB); ~65% with BWB at comparable or lower cost
Then another ~2× profitable potential from LH2-fuel-cell-electric-prop cryoplanes
Boeing 787 interior
ener
gy
effici
ency
(re
venue-
pas
senger
-mile
/gal
.)
NASA image of Blended-Wing-Body

Conservatisms include no…
◊ Adaptive engines (ADVENT,…)
◊ Highly integrated adaptive structures, e.g.,morphing aircraft forms and flight surfaces
◊ Powered wheels, inductive runway integration
◊ Advanced electric end-use efficiency
◊ Efficient high-speed propeller propulsion
◊ Pneumatic blowing, plasma boundary-layer,…
◊ Full accounting for system benefits of integratingBWB, adaptive engines, and other advanced tech
◊ Leaner force structures (~5–10x fewer aircraft?)possible with new capabilities, especially BWB
◊ LH2 cryoplanes

Ultramodern aeronautical technologyembodied in a gliding bird
Courtesy of Dr. Paul MacCready, founder andChairman, AeroVironment, Inc.
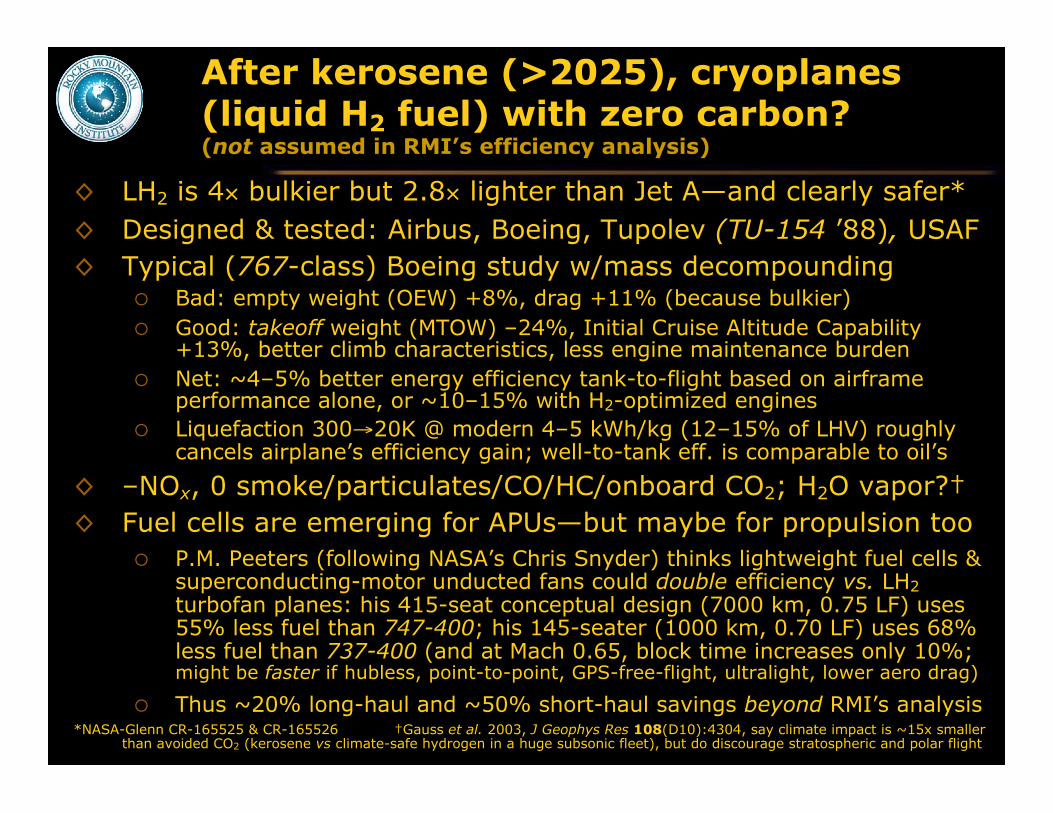
After kerosene (>2025), cryoplanes(liquid H2 fuel) with zero carbon?(not assumed in RMI’s efficiency analysis)
◊ LH2 is 4× bulkier but 2.8× lighter than Jet A—and clearly safer*◊ Designed & tested: Airbus, Boeing, Tupolev (TU-154 ’88), USAF◊ Typical (767-class) Boeing study w/mass decompounding
Bad: empty weight (OEW) +8%, drag +11% (because bulkier) Good: takeoff weight (MTOW) –24%, Initial Cruise Altitude Capability
+13%, better climb characteristics, less engine maintenance burden Net: ~4–5% better energy efficiency tank-to-flight based on airframe
performance alone, or ~10–15% with H2-optimized engines Liquefaction 300→20K @ modern 4–5 kWh/kg (12–15% of LHV) roughly
cancels airplane’s efficiency gain; well-to-tank eff. is comparable to oil’s
◊ –NOx, 0 smoke/particulates/CO/HC/onboard CO2; H2O vapor?†◊ Fuel cells are emerging for APUs—but maybe for propulsion too
P.M. Peeters (following NASA’s Chris Snyder) thinks lightweight fuel cells &superconducting-motor unducted fans could double efficiency vs. LH2turbofan planes: his 415-seat conceptual design (7000 km, 0.75 LF) uses55% less fuel than 747-400; his 145-seater (1000 km, 0.70 LF) uses 68%less fuel than 737-400 (and at Mach 0.65, block time increases only 10%;might be faster if hubless, point-to-point, GPS-free-flight, ultralight, lower aero drag)
Thus ~20% long-haul and ~50% short-haul savings beyond RMI’s analysis*NASA-Glenn CR-165525 & CR-165526 †Gauss et al. 2003, J Geophys Res 108(D10):4304, say climate impact is ~15x smaller
than avoided CO2 (kerosene vs climate-safe hydrogen in a huge subsonic fleet), but do discourage stratospheric and polar flight
Hypothetically assuming full deployment in 2025 (actually we realize halfthe savings by then); these curves assume no further invention in 2005–25
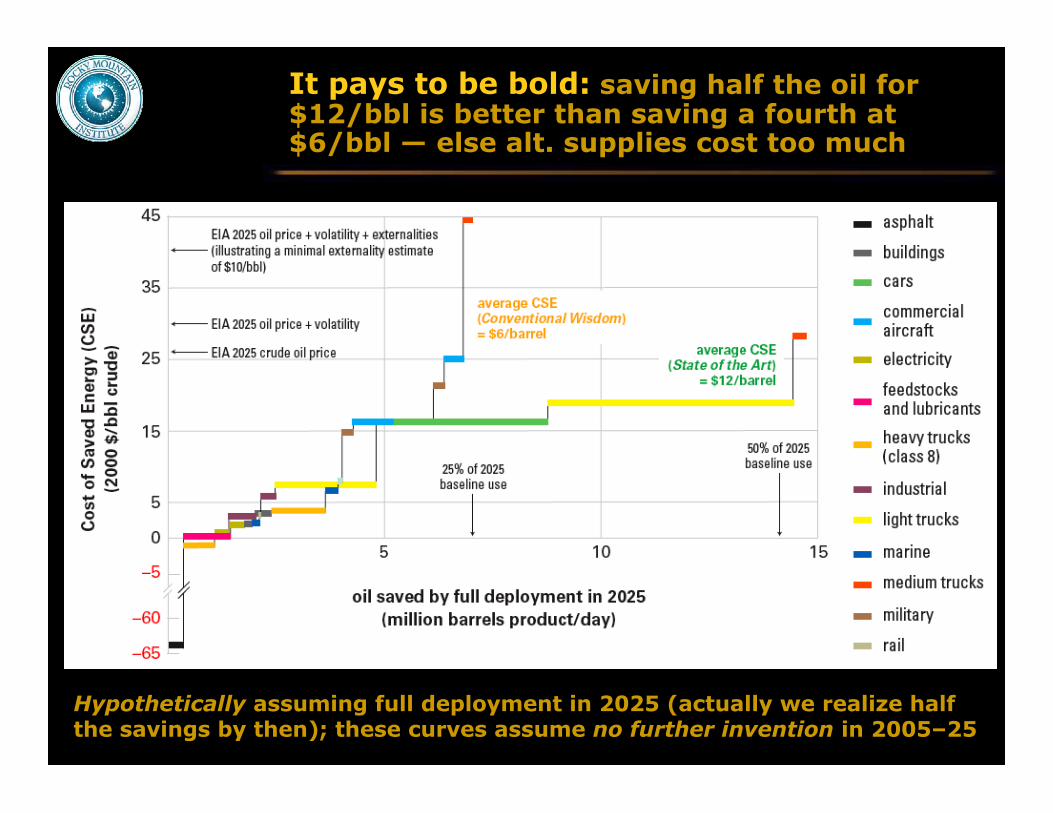
It pays to be bold: saving half the oil for$12/bbl is better than saving a fourth at$6/bbl — else alt. supplies cost too much
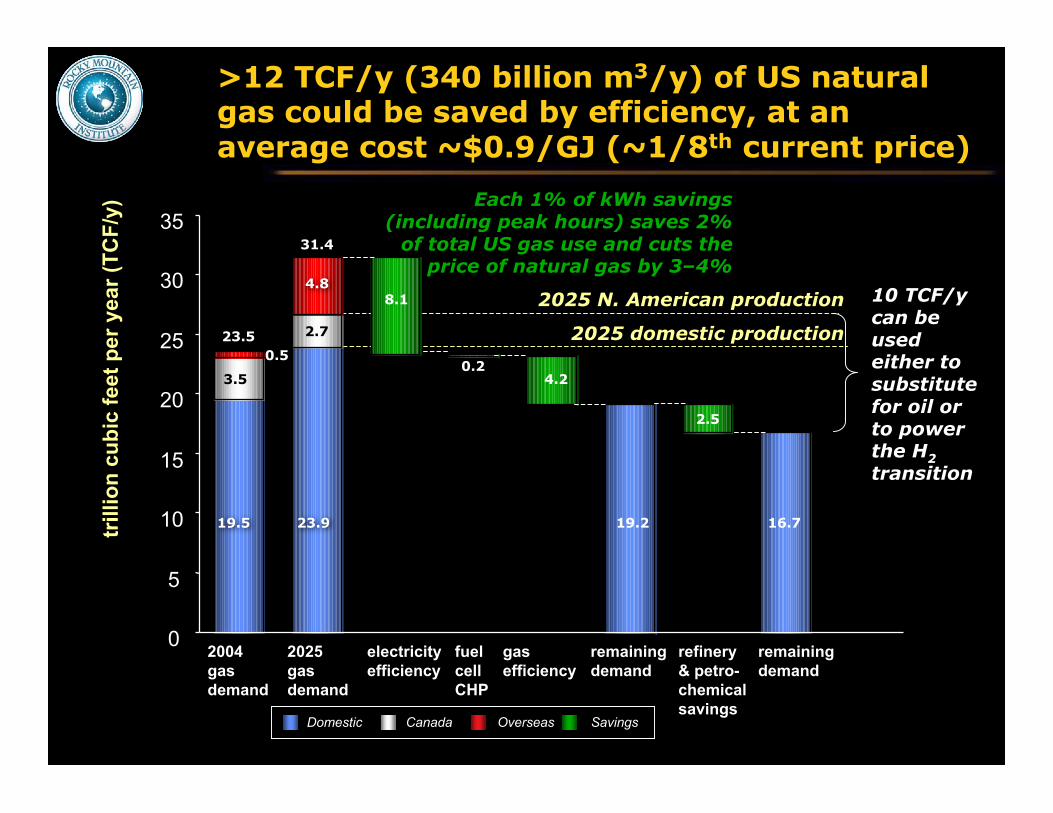
>12 TCF/y (340 billion m3/y) of US naturalgas could be saved by efficiency, at anaverage cost ~$0.9/GJ (~1/8th current price)
0
5
10
15
20
25
30
35
2004 gasdemand
2025 gasdemand
electricityefficiency
fuel cell CHP
gas efficiency
remaining demand
refinery & petro-chemical savings
remaining demand
4.2
trill
ion
cubi
c fe
et p
er y
ear (
TCF/
y)
23.5
31.4
8.1
19.2
2.5
16.719.5 23.9
3.5
2.7
4.8
0.5
Domestic Canada Overseas Savings
2025 N. American production
2025 domestic production
10 TCF/ycan beusedeither tosubstitutefor oil orto powerthe H2transition
0.2
Each 1% of kWh savings(including peak hours) saves 2%
of total US gas use and cuts theprice of natural gas by 3–4%

Biofuels Substitution Supply Curve (Net Mbbl/d)
$0
$10
$20
$30
$40
$50
$60
$70
$80
$90
0.00 1.00 2.00 3.00 4.00 5.00
SOA net Mbbl/d
$26/bbl
net biofuel supply (million bbl/d)
2000
$/b
bl a
t bi
ofue
l re
finer
y ga
te
CW Net Mbbl/d
Old technologiesOld technologies(e.g., corn-(e.g., corn-
ethanol): notethanol): noteconomic withouteconomic without
subsidiessubsidies
New lignocellulosicNew lignocellulosictechnologiestechnologies’’
potential: 2potential: 2×× yield, yield,lower capex, farlower capex, far
lower energy inputlower energy input
+ 1 Mbbl/d in biomaterials/biolubricants
New biofuel technologies could provide3.7 Mbbl/d cheaper than oil—withoutsubsidies or crop/land/water problems
CostlierCostlier feedstocks feedstocksmake 1make 1 Mbbl Mbbl/d of/d of
biomaterialsbiomaterials
• Brazil has replaced 26% of gasoline with sugar-cane ethanol, competitivewithout subsidy (the startup subsidy has been recovered ~50× over)• Sweden is going off oil by 2020 via cellulosic ethanol; also anticipates H2• Europe in 2003 made 17× as much biodiesel as US: oil companiesdistribute >50%; shifts farmers from subsidy to revenue
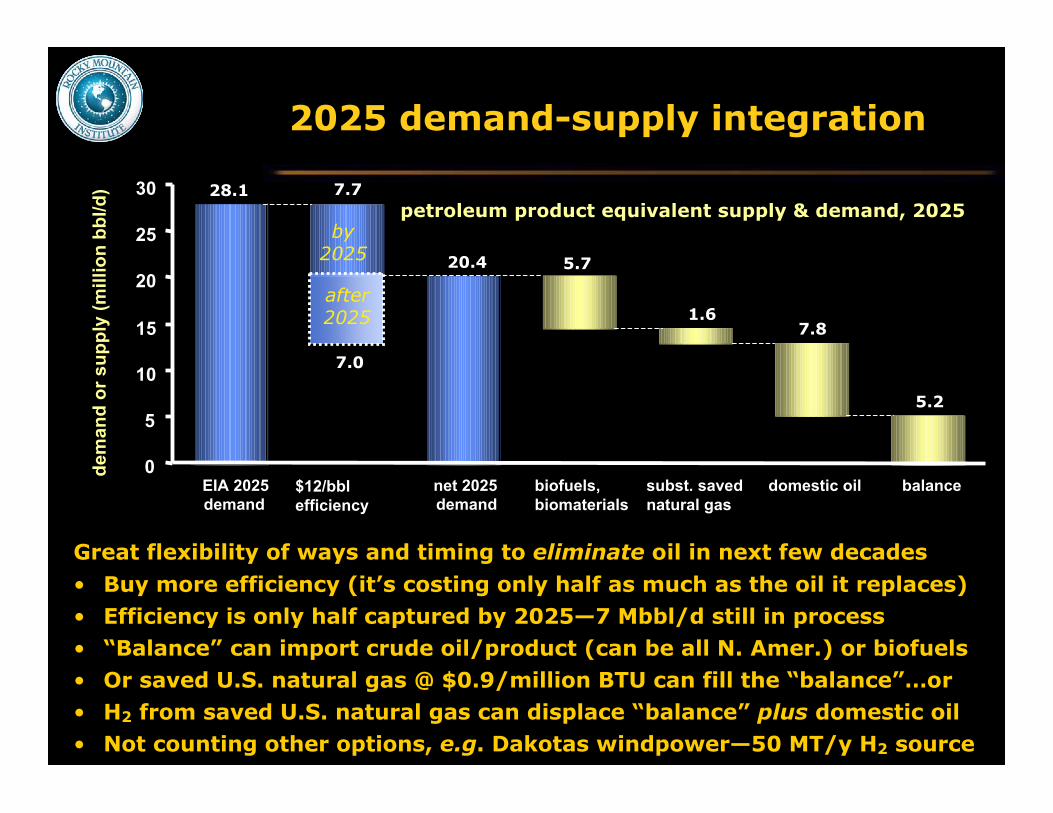
Great flexibility of ways and timing to eliminate oil in next few decades• Buy more efficiency (it’s costing only half as much as the oil it replaces)• Efficiency is only half captured by 2025—7 Mbbl/d still in process• “Balance” can import crude oil/product (can be all N. Amer.) or biofuels• Or saved U.S. natural gas @ $0.9/million BTU can fill the “balance”…or• H2 from saved U.S. natural gas can displace “balance” plus domestic oil• Not counting other options, e.g. Dakotas windpower—50 MT/y H2 source
2025 demand-supply integration
petroleum product equivalent supply & demand, 2025
0
5
10
15
20
25
30
EIA 2025demand
$12/bbl efficiency
net 2025demand
biofuels,biomaterials
subst. savednatural gas
domestic oil balance
dem
and
or s
uppl
y (m
illio
n bb
l/d) 28.1 7.7
20.4 5.7
1.67.8
5.2
after2025
by2025
7.0

Mobilization: AcceleratingChange
4.5 Mbbl/d saved, $391 billion in retail fuel savings
90–100% State of the Art vehicles by 2040
Conventional Wisdom State of the ArtAverage Vehicles(rather like today’s cars) (27% more efficient, 1-y payback) (ultralight hybrids)

Big, fast changes have happened
◊ U.S. automakers switched in 6 years from 85% open woodbodies to 70% closed steel bodies—and in 6 months frommaking four million light vehicles per year to making thetanks and planes that won World War II
◊ Boeing transformed its planes in 4 years, 2004–08
◊ GM’s small team took EV1 from launch to street in 3 years
◊ Major technological diffusions take 12–15 years for 10%→90% stock adoption, but policy can speed takeoff by 3 years
◊ In 1977–85, U.S. cut oil intensity 5.2%/y—equivalent, at agiven GDP, to a Gulf every 2.5 years
Biggest contribution: U.S.-made new cars gained 7.4 mpg in 6 y(47%, 4.9%/y)—96% from smarter design, only 4% from smaller size
◊ If every light vehicle on the road in 2025 were as efficient asthe best 2004 cars & SUVs, they’d save twice as much oil asthe U.S. now imports from the Persian Gulf
Military energy efficiency: “endurance”as the emerging fifth strategic vector
◊ After speed, stealth, precision, networking…
◊ DoD is increasingly handicapped by half-century-old pattern ofusing & getting energy, designed for massive steel forces“floating to victory on a sea of oil” 6/7ths of fuel that defeated Axis came from Texas; today, war-
fighting is 16× more oil-intensive, and Texas is a net importer of oil
◊ Today’s warfighting needs just the opposite—unprecedentedagility, mobility, maneuver, range, persistence, reliability,autonomy, low cost—via inherently far greater “endurance”
◊ Fat fuel-logistics tail now a magnet for insurgents, a seriousmilitary liability, and a huge financial burden
◊ DoD needs less/little/no reliance on long, brittle supply chains…and ≥3–4× lower platform fuel consumption, which is feasible
◊ Yet DoD has assumed fuel logistics to be free and invulnerable
◊ Major strategic shift to efficiency now emerging
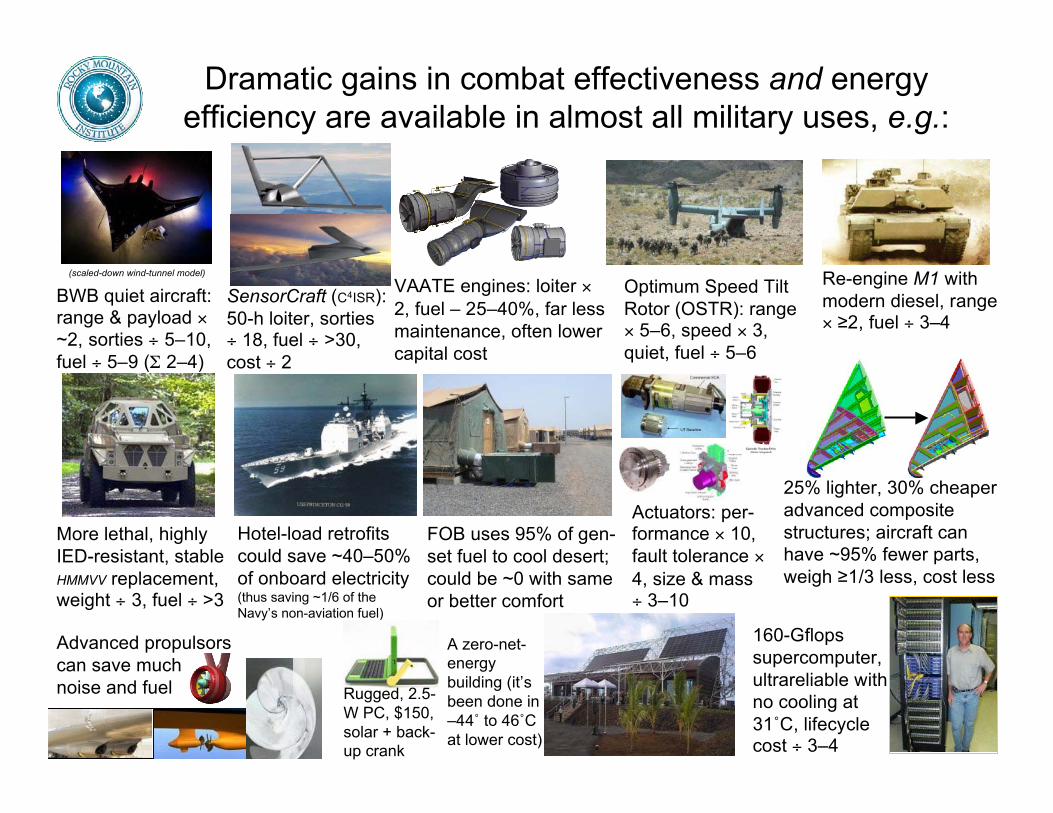
Dramatic gains in combat effectiveness and energyefficiency are available in almost all military uses, e.g.:
25% lighter, 30% cheaperadvanced compositestructures; aircraft canhave ~95% fewer parts,weigh ≥1/3 less, cost less
VAATE engines: loiter ×2, fuel – 25–40%, far lessmaintenance, often lowercapital cost
SensorCraft (C4ISR):50-h loiter, sorties÷ 18, fuel ÷ >30,cost ÷ 2
BWB quiet aircraft:range & payload ×~2, sorties ÷ 5–10,fuel ÷ 5–9 (Σ 2–4)
(scaled-down wind-tunnel model)
More lethal, highlyIED-resistant, stableHMMVV replacement,weight ÷ 3, fuel ÷ >3
Hotel-load retrofitscould save ~40–50%of onboard electricity(thus saving ~1/6 of theNavy’s non-aviation fuel)
Advanced propulsorscan save muchnoise and fuel
160-Gflopssupercomputer,ultrareliable withno cooling at31˚C, lifecyclecost ÷ 3–4
Rugged, 2.5-W PC, $150,solar + back-up crank
FOB uses 95% of gen-set fuel to cool desert;could be ~0 with sameor better comfort
Re-engine M1 withmodern diesel, range× ≥2, fuel ÷ 3–4
A zero-net-energybuilding (it’sbeen done in–44˚ to 46˚Cat lower cost)
Actuators: per-formance × 10,fault tolerance ×4, size & mass÷ 3–10
Optimum Speed TiltRotor (OSTR): range× 5–6, speed × 3,quiet, fuel ÷ 5–6
What if DoD investment in advanced lightmaterials could transform the U.S. economyas profoundly as Internet, GPS, and chips?
◊Advanced materials & propul-sion systems can find a SaudiArabia (>9 Mbbl/d) of saved oilunder Detroit & Seattle…
◊…and help DoD transform itsforces, strengthen warfightingcapability, and cut fuel cost bybillions of $/y and logistics costby tens of billions of $/y
◊The U.S. could cut oil use by50% by 2025, imports by 75%
◊The key DoD action needed isS&T investment in advancedmaterials, especially high-vol-ume/low-cost manufacturing
The prize◊ A nega-Gulf every 7 y◊ Vastly less world
dependence on oil andconflict over oil
◊ A competitive Big 3◊ Cheaper oil; more
balanced U.S. trade,global development,and diplomacy
◊ More capable andconfident warfighting
◊ Less need for it◊ A safer world

Even 100% (not ~55%) implementation by2025 would occur at reasonable speed
nuclear
gas
actual total energyconsumption
government

Implementation is underway via“institutional acupuncture”
◊ RMI’s 3-year, $4-million effort is leading & consolidating shifts
◊ Need to shift strategy & investment in six sectors Aviation: Boeing did it (787 Dreamliner)…and beat Airbus
Heavy trucks: Wal-Mart led it (with other buyers being added)
Military: emerging as the federal leader in getting U.S. off oil
Fuels: strong investor interest and industrial activity
Finance: rapidly growing interest/realignment will drive others
◊ Cars and light trucks: slowest, hardest, but now changing Alan Mulally’s move from Boeing to Ford with transformational intent
UAW and dealers not blocking but eager for fundamental innovation
Schumpeterian “creative destruction” is causing top executives to be farmore open to previously unthinkable change
Emerging prospects of leapfrogs by China, India, ?new market entrants
Competition, at a fundamental level and at a pace last seen in the1920s, will change automakers’ managers or their minds, whichevercomes first—watch this space!

There have been some skeptics….
Getting off oil, you say?

Now they’re more interested

Innovative public vehicles too(though our analysis assumes none)
◊ Novel ultralight rail (www.cybertran.com) w/systemcost ~$2.5M/km or $15k/seat; in testing at AlamedaNaval Air Station
◊ Curitiba (Brazil) “surface subway” bus system 3/4 of commuting in Houston-sized city, beats cars
◊ T.U. Delft highway “Superbus” for 2008 Olympics “Triple stretch limo,” 0.1 MJ/p-km (<TGV, <maglev) @ 250 km/h,
2.5m W × 50m L, 2 m high at cruise, CD 0.18, 6 T GWV (n=25)
CyberTran test vehicle, ~$100k, 12m L, 2m H & W, 6–20seats w/122-cm pitch, 4 doors on each side, 149 kW, 3.4T empty, 4.54 T loaded, 30–240+ km/h, styled to taste;guideway for two lanes can be retrofitted over a typicalroad median, yielding 1.3–2.1× more seats/system milethan a saturated 4-lane road; cf. ULTra, www.atsitd.co.uk,and Austrans, www.austrans.com/index.php
The solution is not just technical:transportation is a means, not an end
◊ The aim is to get access to where we want to be Be there already (sensible land-use) Virtual mobility (move only electrons) Physical mobility (move protoplasm…but how?)
› Walking› Personal vehicle (bicycle, scooter, motorcycle, car,…)› Shared personal vehicle or public vehicle
◊ How far does public policy let trips and negatripscompete fairly—not just transport modes?
◊ What if we stopped mandating/subsidizing sprawl?◊ What if drivers got what they paid for and paid for
what they got? if all modes, & negatrips, competed?◊ All key Qs…but focus here is on vehicle technology
Whole-system efficiency potential is far larger (~10x) Even better styling flexibility; if it’s not efficient, it’s not beautiful

Peeling layer upon endless layer ofthe tears-free efficiency onion…
◊ Beyond Hypercars® (4–6×): transport demand mgt;mode-switching (Curitiba/Bogatá/Lima bus, Cyber-tran™, hybrid bikes…); vehicle-sharing (Stattauto,ZIPcar,…); mobility-/access-based business models(mobility.ch…); don’t mandate/subsidize sprawl…: 10×
◊ Beyond efficient aircraft (2–5×): big operational gainsat airport & system levels; point-to-point in smalleraircraft (hubless w/gate & slot competition); air taxis;mobility-/access-based models; virtual mobility…: 10×
◊ Beyond efficient trucks (2–3×): trains, logistics,…: 10×
◊ This is what we can now clearly see as practical andprofitable—but innovation will probably continue
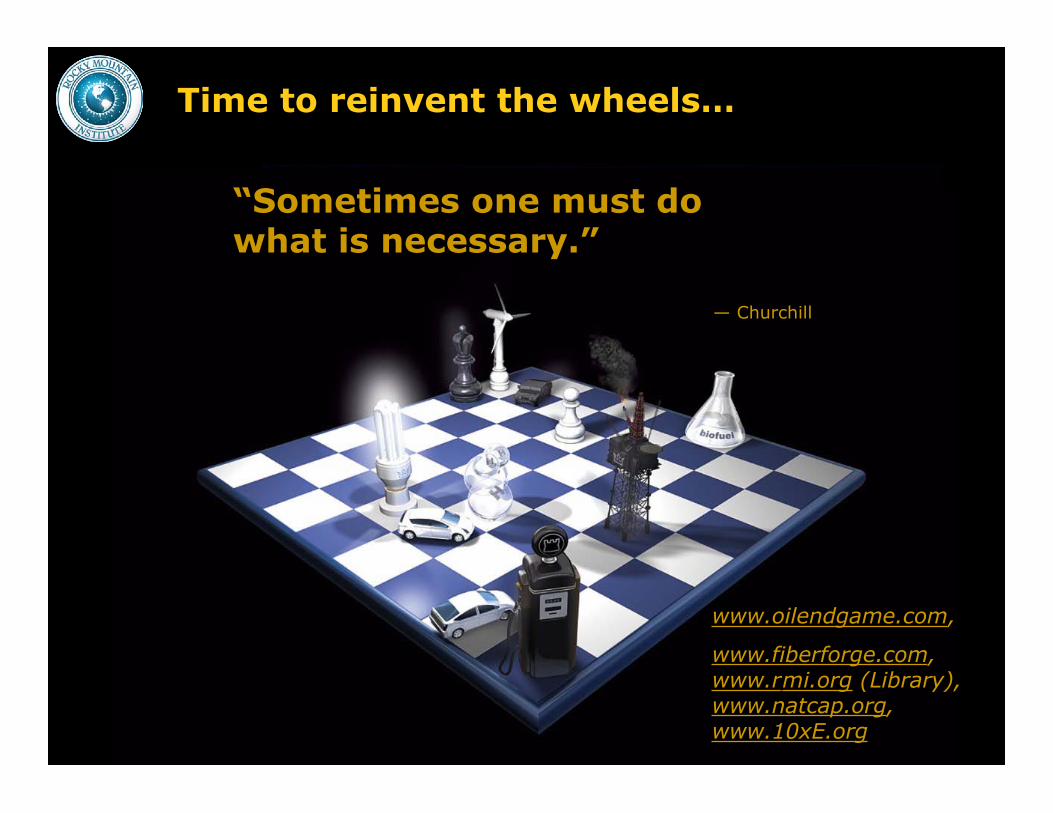
Time to reinvent the wheels…
www.oilendgame.com,
www.fiberforge.com,www.r mi.org (Library),www.natcap.org,www.10xE.org
“Sometimes one must dowhat is necessary.”
— Churchill