MAP KeysMAP Keys The Keys to Revenue ClSCycle Success · 15: Analysis of HFMAs MAP ... Total...
81
MAP Keys℠ MAP Keys The Keys to Revenue C l S Cycle Success Sandra Wolfskill, FHFMA Director, Healthcare Finance Policy Revenue Cycle MAP Healthcare Financial Management Association hfmamap.org Spring Institute 2014 May 19, 2014
-
Upload
phunghuong -
Category
Documents
-
view
215 -
download
0
Transcript of MAP KeysMAP Keys The Keys to Revenue ClSCycle Success · 15: Analysis of HFMAs MAP ... Total...

MAP Keys℠MAP KeysThe Keys to Revenue C l SCycle Success
Sandra Wolfskill, FHFMADirector, Healthcare Finance PolicyRevenue Cycle MAPHealthcare Financial Management Association
hfmamap.org
Spring Institute 2014May 19, 2014
OVERVIEWBackground to the MAP InitiativesMAP Keys℠MAP KeysMAP App – the ToolsMAP AwardsMAP AwardsMAP EventMAP ResearchImplementing Metrics for revenue cycle improvementQuestions …
hfmamap.org
Q
2
C-Suite Focus Shift to Revenue CycleIncreased attention to revenue cycle management y g– Cash flow– Revenues
Focus on specific process improvementFocus on specific process improvement– Cash collection– Work flow
Customer satisfaction– Customer satisfaction– Reduction in process variation
Use of metrics to track performance
hfmamap.org 3

EVIDENCE-BASED IMPROVEMENT
MeasuringComponents
g
– What are consensus measures of revenue cycle excellence?
Comparing
– How are peers performing and what are valid performance targets?
Improving
– How do high performers achieve and maintain success?
hfmamap.org 4
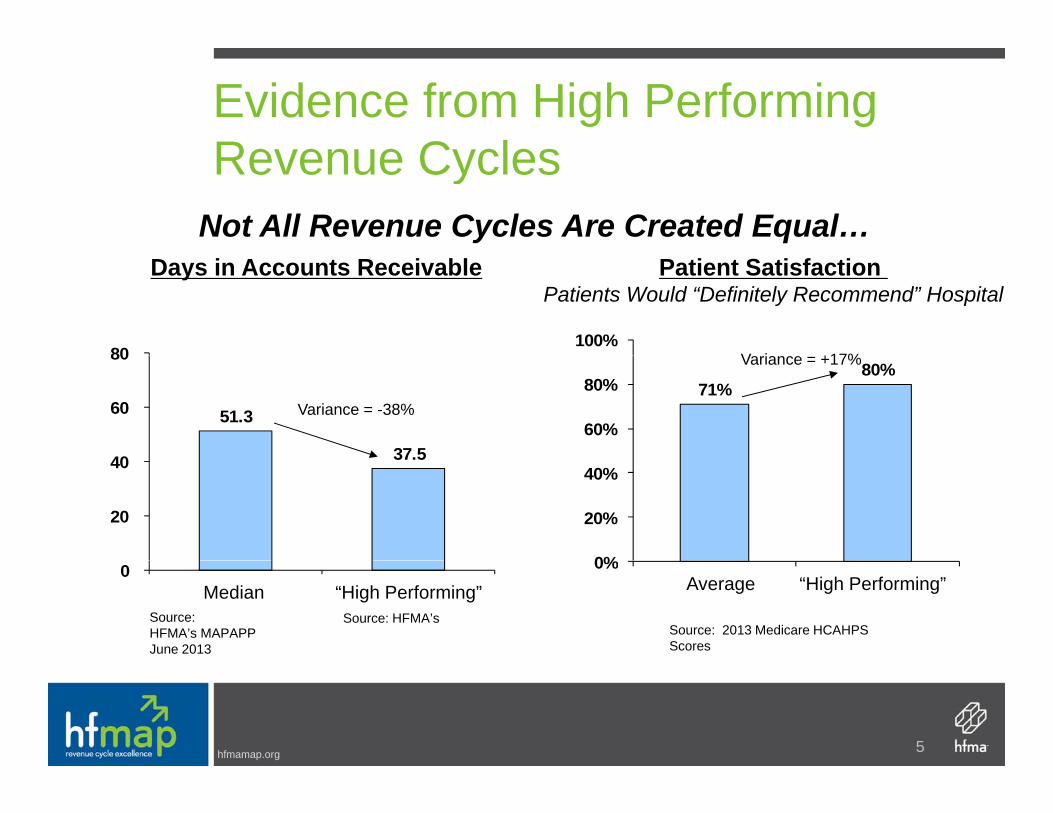
Evidence from High Performing Revenue CyclesRevenue Cycles
Not All Revenue Cycles Are Created Equal…
80100%
Days in Accounts Receivable Patient Satisfaction Patients Would “Definitely Recommend” Hospital
V i +17%
51.3
37.540
60
80
71%80%
60%
80%Variance = +17%
Variance = -38%
37.5
20
40
0%
20%
40%
0 0%Average “High Performing”
Source: 2013 Medicare HCAHPS Scores
Median “High Performing”Source: HFMA’s MAPAPP June 2013
Source: HFMA’s
hfmamap.org 5

Fundamentals for Successful ComparisonComparison
• Standardization
Timeliness• Timeliness
• Well-defined customized “peer”Well defined, customized peer
hfmamap.org 6
Why Is Measuring Performance Important?Important?
Creates a framework for analyzing dataCreates a framework for analyzing data
Understand your performance progress
– Internally throughout the organization
– Externally with peers and high performers
Identify resource needs
– Allocate labor, technology, and other resources to areas where they
will have greatest impact
hfmamap.org 7

Timeliness Affects Relevance
Performance can shift rapidly in response to such
Current data is needed to set appropriate performance targets
Performance can shift rapidly in response to such factors as:
– Economyy
– Regulatory environment
– Shifts in insurance coverage/self payShifts in insurance coverage/self pay
– Industry rate of technology adoption, such as EHRs
hfmamap.org 8
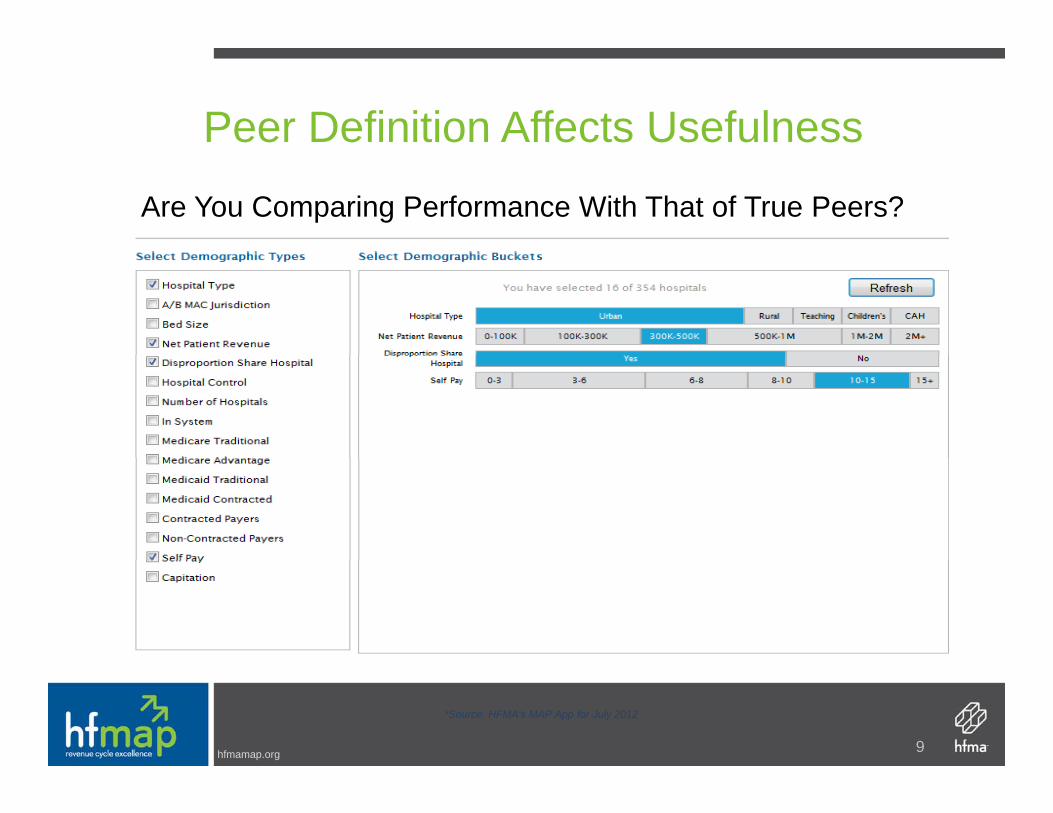
Peer Definition Affects Usefulness
Are You Comparing Performance With That of True Peers?
hfmamap.org 9
*Source: HFMA's MAP App for July 2012

Why Prioritize Revenue C l M t?Cycle Management?
“Good” is no longer good enoughg g g
– Payment trends demand efficiency and effectiveness
– Regulatory change is adding complexity to the paymentRegulatory change is adding complexity to the payment processes
– Consumers expect high levels of revenue cycle service• Patient financial communication• Transparent pricing • Prompt and accurate billing – Patient-Friendly Billing™ • Seamless payment experience• Seamless payment experience
hfmamap.org 10

The Right Data Guide Performance ImprovementImprovement
Internal view– Quantifying performance change across key areas of your
revenue cycle, will position you to effectively:
• Set organizational goals and objectives
• Improve organizational effectiveness and efficiencies
• Use data to change behaviors
hfmamap.org 11

Industry Expectations
External view
– Moody’s looks for:
• Comparison against a carefully selected set of peers• Comparison against a carefully selected set of peers
• Frequency and depth with which senior leadership and board
members review comparative datap
• Leadership actions based on hospital performance relative to
key indicators
hfmamap.org 12

Just How Above “Good” D Y N d t B ?Do You Need to Be?
To Optimize Improvement Efforts, You Need to First Understand What A Change in Performance Will Mean
d d
Understand What A Change in Performance Will Mean.
You need
Industry accepted
You need targets that are:
Measurable and quantifiable
Defined by true “peer groups”
hfmamap.org 13

Example: Days in A/R
Consider a Hospital Where Days in A/R Improved to 38.7, and p y p ,Performance has been Sustained Most Months for the Past Year
Days in
JANFEBMARAPR Days in
A/R
38.7
APRMAYJUNJUL
IMPROVED & SUSTAINED
AUGSEPTOCT
hfmamap.org 14

Example: Days in A/RMeanwhile, Days in A/R for the Organization’s Peers Have Dropped Even More
DAYS IN A/R AMONG PEER GROUPS OF SIMILAR REVENUEDAYS IN A/R AMONG PEER GROUPS OF SIMILAR REVENUE, PAYER MIX
38.7Case Example Hospital
38.0Peer 1
35 5Peer 3
38.1Peer 2
Source: Analysis of HFMA's MAP AppSM ,
33.0 34.0 35.0 36.0 37.0 38.0 39.0
35.5Peer 3
hfmamap.org
15
Source: Analysis of HFMA s MAP App ,
How HFMA RespondedHow HFMA Responded …
hfmamap.org

hfmamap.org
Defining the Industry’s Standards
hfmamap.org
Task Force Purpose
Leading industry representativesLeading industry representatives Supported by HFMA staffCharged to identify a common set of revenueCharged to identify a common set of revenue cycle performance indicators that will allow hospitals to measure in a consistent way for p ythe purpose of peer to peer comparison
hfmamap.org 19

Task Force Charge
Review current KPIs and other industryReview current KPIs and other industry definition sources for completeness, validity and relevancyIdentify and prioritize the top KPIsFinalize and approve KPI definitionsppReview work product with NACsPrepare recommendations for HFMA Board epa e eco e dat o s o oa dapproval
hfmamap.org 20
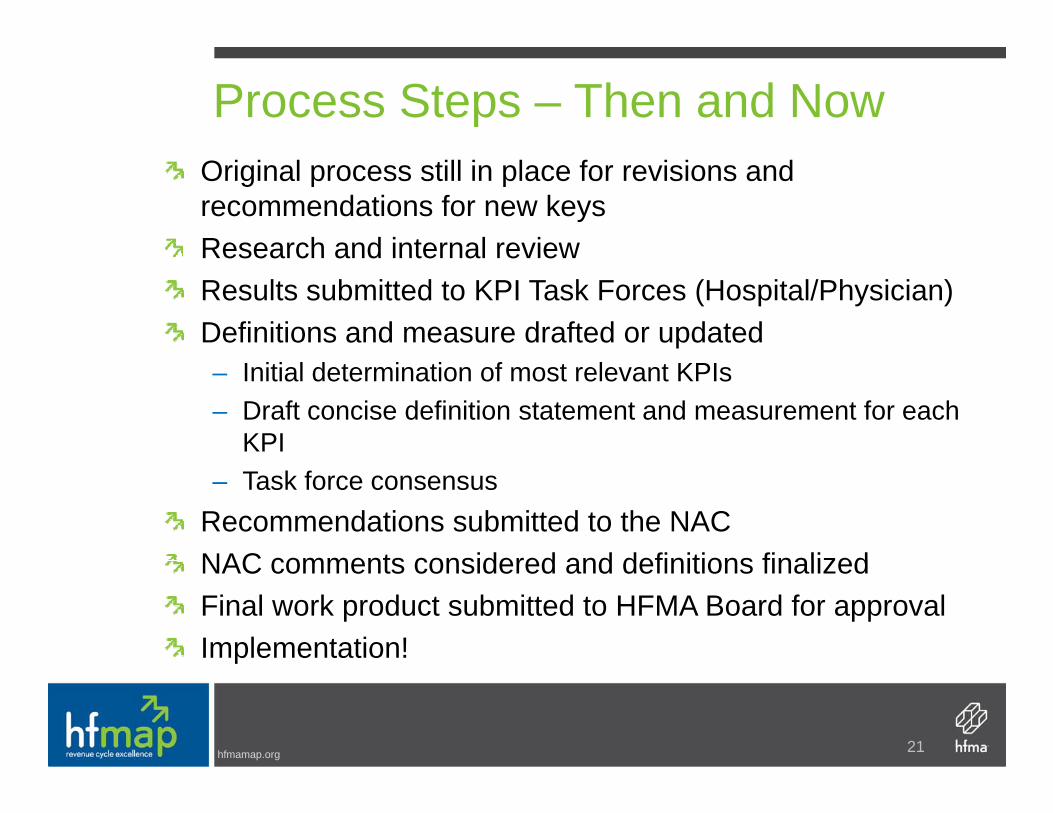
Process Steps – Then and NowOriginal process still in place for revisions and recommendations for new keysResearch and internal reviewResearch and internal reviewResults submitted to KPI Task Forces (Hospital/Physician)Definitions and measure drafted or updated– Initial determination of most relevant KPIs– Draft concise definition statement and measurement for each
KPI– Task force consensus
Recommendations submitted to the NACNAC comments considered and definitions finalizedNAC comments considered and definitions finalizedFinal work product submitted to HFMA Board for approvalImplementation!
hfmamap.org
p
21

And the Results Are …
Objective industry-standard metricsClear, consistent and unbiased terms to define the essentials of revenue cycle performanceperformanceGateway to valid peer comparisons through HFMA’s MAP App toolHFMAs MAP App toolTool for identifying high performing and improving revenue cycles across aimproving revenue cycles across a standardized set of KPIs
hfmamap.org 22
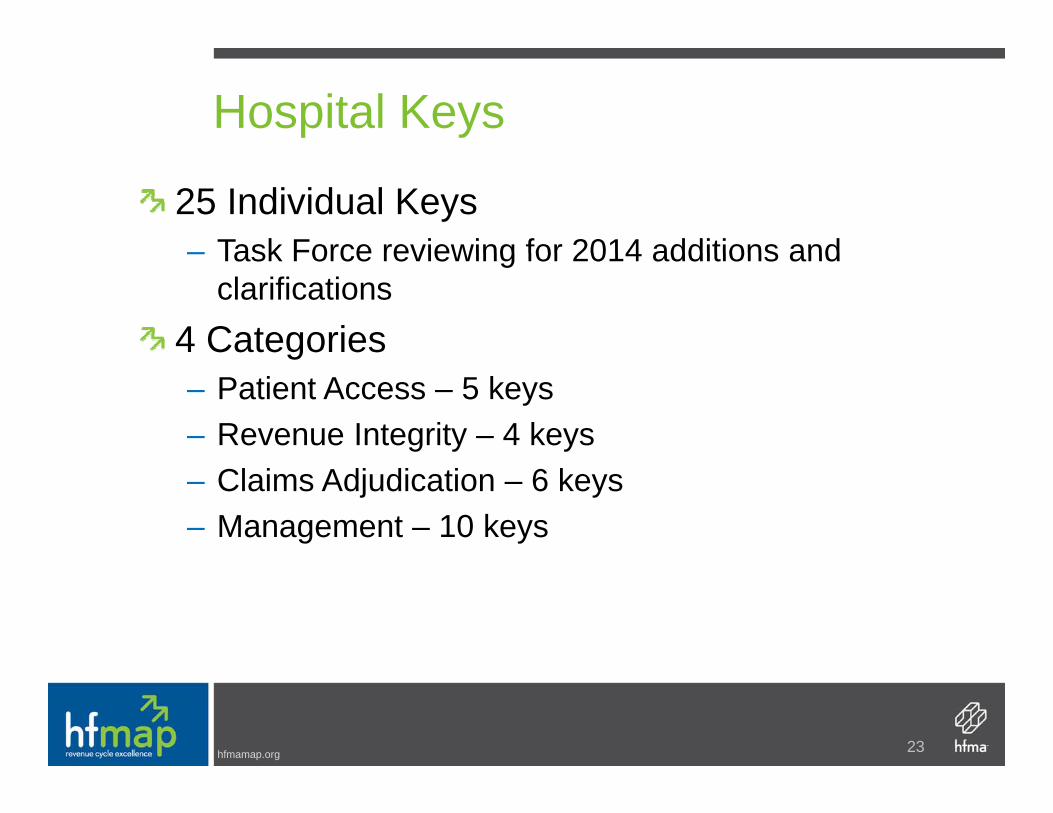
Hospital Keys
25 Individual Keys– Task Force reviewing for 2014 additions and– Task Force reviewing for 2014 additions and
clarifications4 Categoriesg– Patient Access – 5 keys– Revenue Integrity – 4 keys– Claims Adjudication – 6 keys– Management – 10 keys
hfmamap.org 23
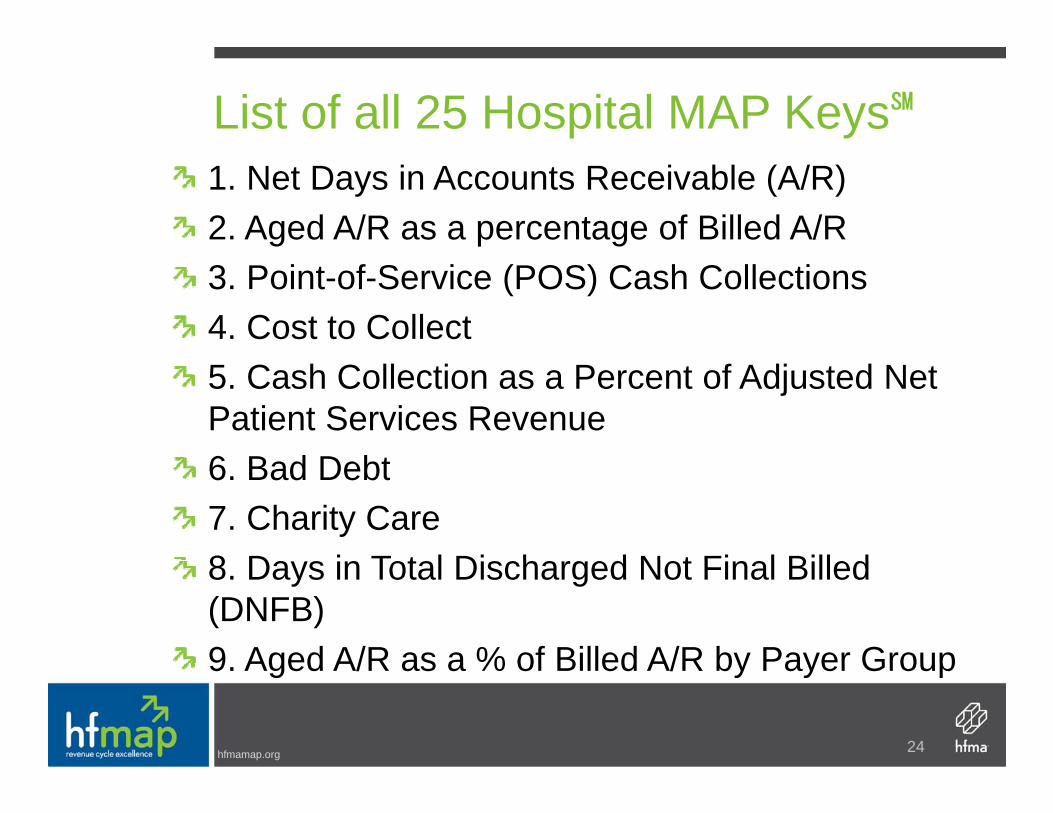
List of all 25 Hospital MAP Keys℠1. Net Days in Accounts Receivable (A/R)2. Aged A/R as a percentage of Billed A/R3. Point-of-Service (POS) Cash Collections4. Cost to Collect5. Cash Collection as a Percent of Adjusted Net Patient Services Revenue6 B d D bt6. Bad Debt7. Charity Care8 D i T t l Di h d N t Fi l Bill d8. Days in Total Discharged Not Final Billed (DNFB)9 Aged A/R as a % of Billed A/R by Payer Group
hfmamap.org
9. Aged A/R as a % of Billed A/R by Payer Group
24

List of all 25 Hospital MAP Keys℠10. Days in Final Billed Not Submitted to Payer (FBNS)11. Days in Total Discharged Not Submitted to Payer (DNSP)12 L t Ch % f T t l Ch12. Late Charges as % of Total Charges13. Initial Denial Rate – Zero Pay14 Initial Denial Rate Partial Pay14. Initial Denial Rate - Partial Pay15. Denials Overturned by Appeal16 Net Days Revenue in Credit Balance16. Net Days Revenue in Credit Balance17. Pre-registration Rate
hfmamap.org 25

List of all 25 Hospital MAP Keys℠
18. Insurance Verification Rate19 Service Authorization Rate19. Service Authorization Rate20. Denial write-offs as a percent of net revenue21. Charity as a Percent of Uncompensated Care21. Charity as a Percent of Uncompensated Care22. Case Mix Index23. Cost to Collect by Functional Area3 Cos o Co ec by u c o a ea24. UB04 (837I) Clean Claim Rate25.Conversion rate of uninsured Inpatient to ppayer source
hfmamap.org 26
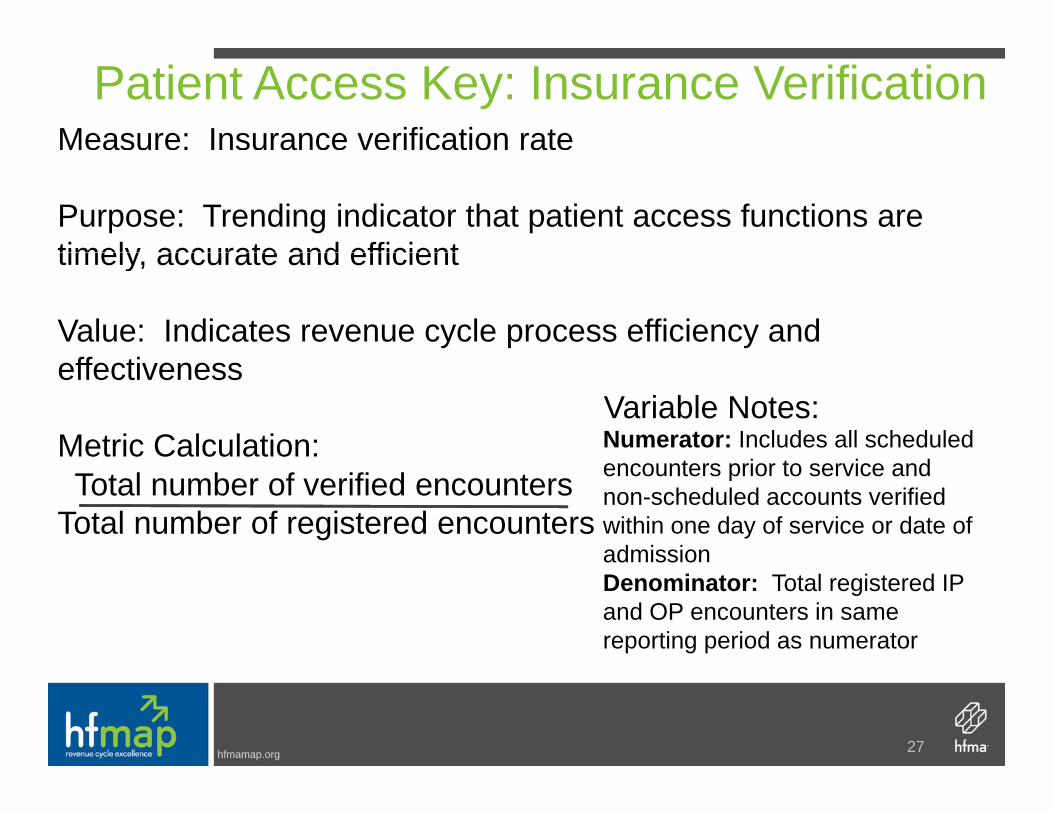
Patient Access Key: Insurance Verification Measure: Insurance verification rate
Purpose: Trending indicator that patient access functions are timely accurate and efficienttimely, accurate and efficient
Value: Indicates revenue cycle process efficiency and effectiveness
Variable Notes:Metric Calculation: Numerator: Includes all scheduled
Total number of verified encountersTotal number of registered encounters
encounters prior to service and non-scheduled accounts verified within one day of service or date of admissionadmissionDenominator: Total registered IP and OP encounters in same reporting period as numerator
hfmamap.org 27
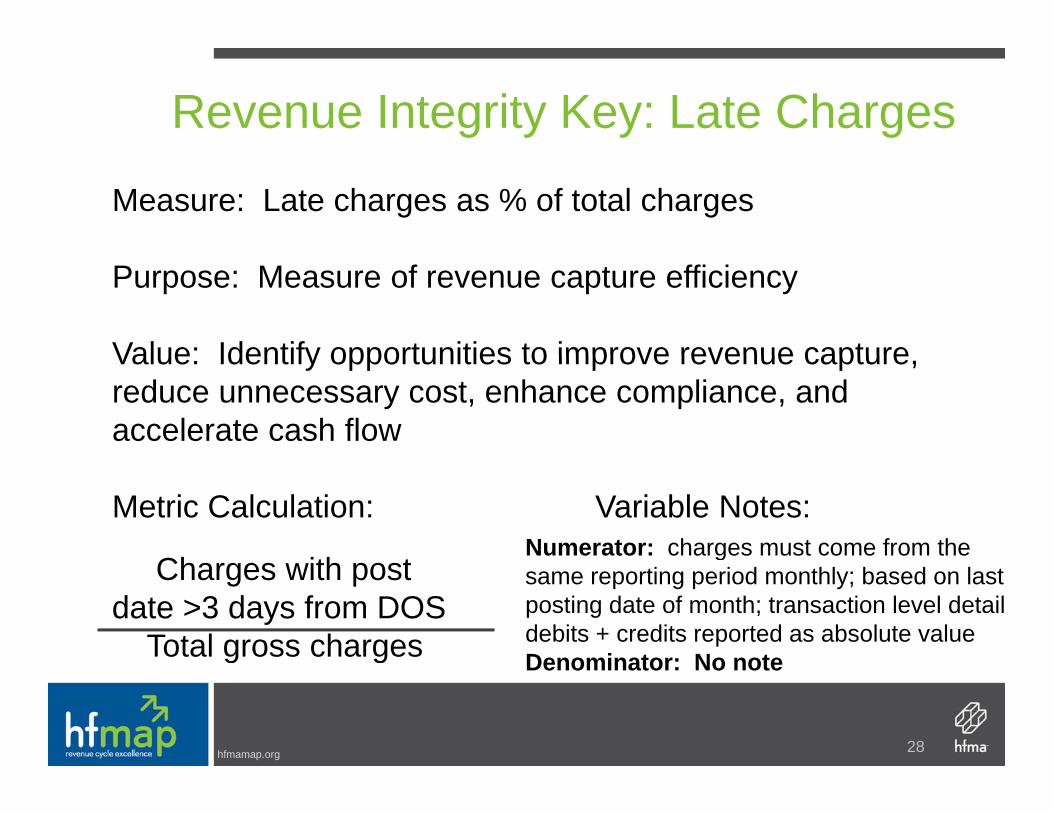
Revenue Integrity Key: Late Charges
Measure: Late charges as % of total charges
Purpose: Measure of revenue capture efficiency
Value: Identify opportunities to improve revenue captureValue: Identify opportunities to improve revenue capture, reduce unnecessary cost, enhance compliance, and accelerate cash flow
Metric Calculation: Variable Notes:
Ch ith tNumerator: charges must come from the
Charges with postdate >3 days from DOS
Total gross charges
same reporting period monthly; based on last posting date of month; transaction level detaildebits + credits reported as absolute valueDenominator: No note
hfmamap.org 28
g g Denominator: No note

Claims Adjudication Key: Days in FBNSMeasure: Days in final billed not submitted to the payer
Purpose: Trending indicator of claims impacted by payer/Purpose: Trending indicator of claims impacted by payer/regulatory edits within claims processing system
V l T k i t f i t l/ t l i t t lValue: Track impact of internal/external requirements to clean claim production which impacts positive cash flow
Metric Calculation: Variable Notes:
Gross dollars in FBNSNumerator: Excludes In-house and DNFB;Excludes rebills and late charge bills
Average Daily Gross RevenueDenominator: No notes
hfmamap.org 29
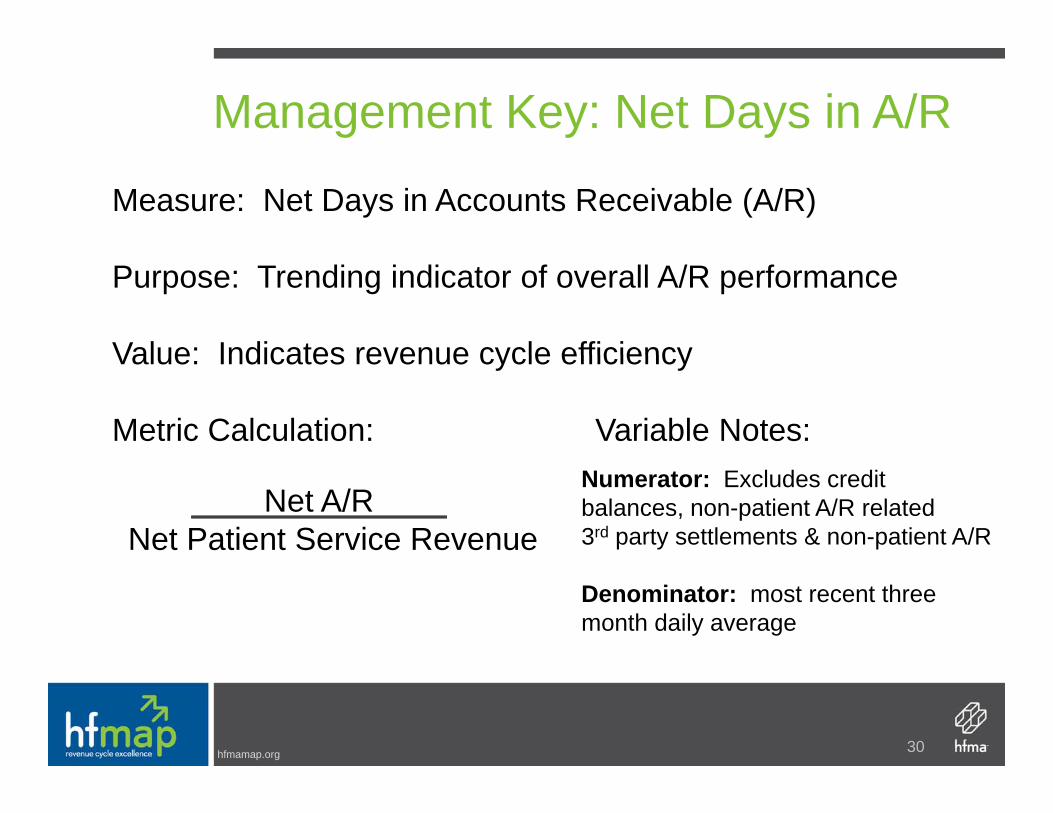
Management Key: Net Days in A/R
Measure: Net Days in Accounts Receivable (A/R)
Purpose: Trending indicator of overall A/R performance
Value: Indicates revenue cycle efficiencyValue: Indicates revenue cycle efficiency
Metric Calculation: Variable Notes:
Net A/RNet Patient Service Revenue
Numerator: Excludes credit balances, non-patient A/R related 3rd party settlements & non-patient A/R
Denominator: most recent threemonth daily average
hfmamap.org 30
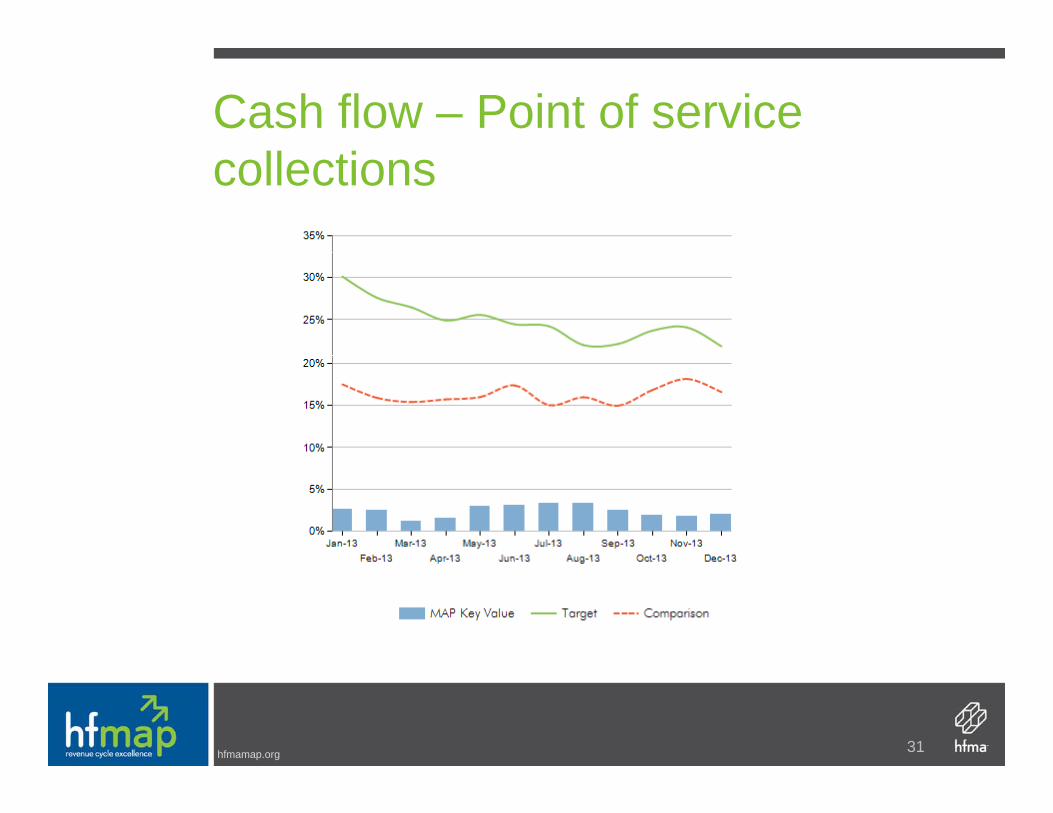
Cash flow – Point of service collections
hfmamap.org 31

Cash flow – Cash collections as % of net PSR
hfmamap.org 32
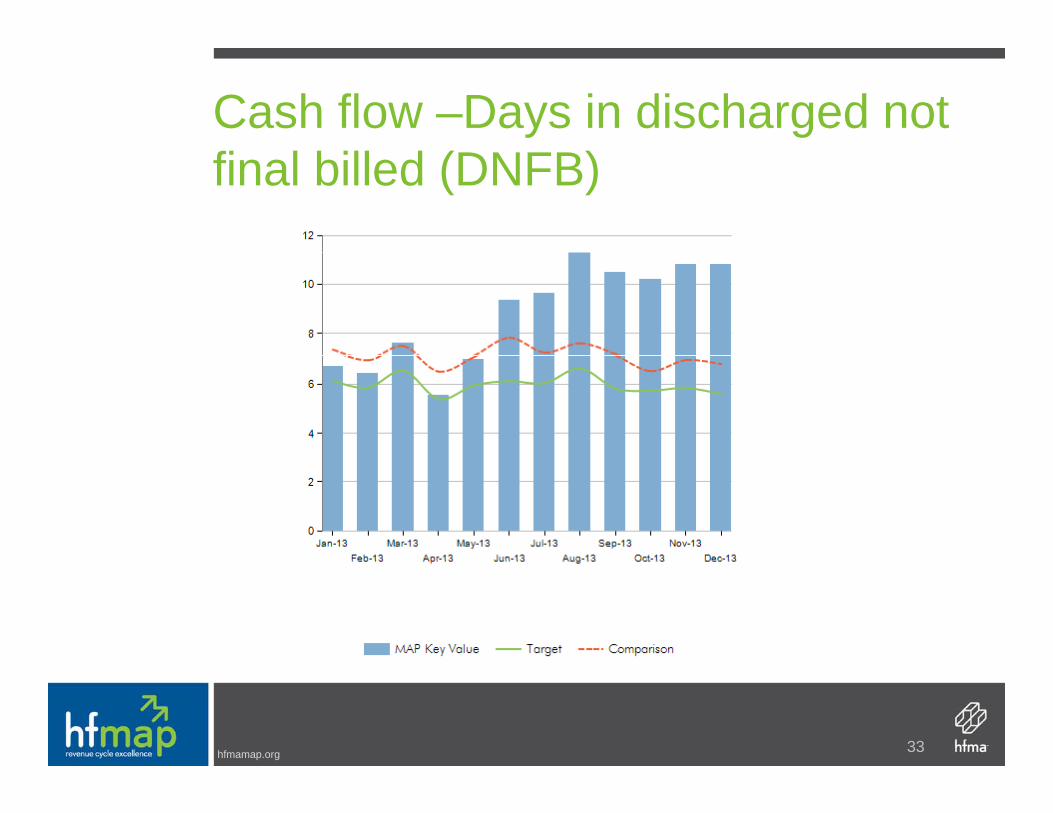
Cash flow –Days in discharged not final billed (DNFB)
hfmamap.org 33

Cash flow – Final billed not submitted to payer (FBNS)
hfmamap.org 34

Components of net patient service revenue – Bad debt
hfmamap.org 35
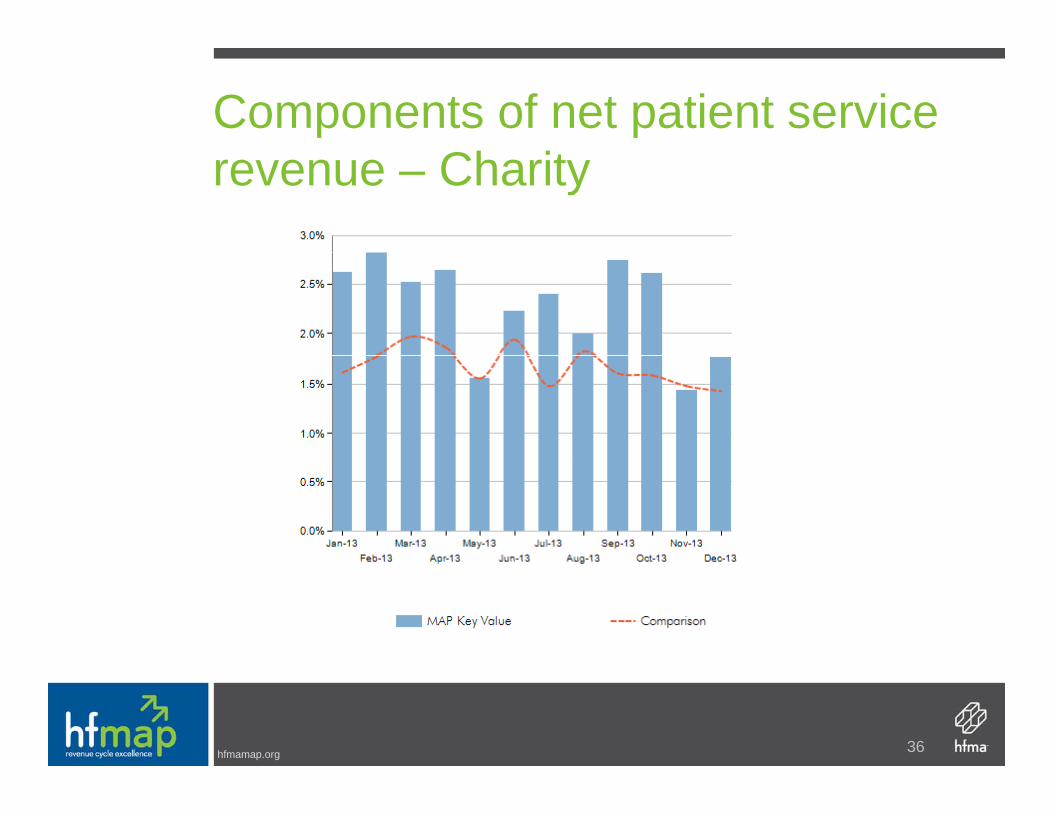
Components of net patient service revenue – Charity
hfmamap.org 36

Expense – Revenue cycle operations – Cost to collect w/o IT
hfmamap.org 37

Physician Practice Management Keys14 Individual Keys14 Individual Keys4 Categories – Patient Access – 2 keysPatient Access 2 keys– Revenue Integrity – 1 keys– Claims Adjudication – 2 keys– Management – 9 keys
Similar concept to hospital side with other keys unique to physician practice management
hfmamap.org 38

14 Physician Practice Management ℠MAP Keys℠
1a. Primary Physician Practice Operating Margin y y g gRatio1b. Specialty Physician Practice Operating Margin R tiRatio1c.Net Income/Loss per Primary FTE§ Physician1d N t I /L S i lt FTE§ Ph i i1d.Net Income/Loss per Specialty FTE§ Physician2. Practice Net Days in Accounts Receivable (A/R)3 Practice Cash Collection Percentage3. Practice Cash Collection Percentage4a.Total Primary Physician Compensation as a Percentage of Net Revenue
hfmamap.org
Percentage of Net Revenue
39

14 Physician Practice Management ℠
4b. Total Specialty Physician Compensation as a P f N R
MAP Keys℠
Percentage of Net Revenue5. Percent of Patient Schedule Occupied6 P f i l S i D i l P t6. Professional Services Denial Percentage7. Point-of Service (POS) Collection Rate8 T t l Ch L D8. Total Charge Lag Days9.Aged Accounts Receivable (A/R) by Payer Group as a Percentage of Outstanding Total A/RGroup as a Percentage of Outstanding Total A/R10.Aged Accounts Receivable (A/R) as a Percentage of Outstanding Accounts Receivable
hfmamap.org
g g
40

% Patient Schedule OccupiedPeer Group: Nationwide
0.94
0.9
0.92
0 84
0.86
0.88
0.8
0.82
0.84
0.78Aug‐12 Sep‐12 Oct‐12 Nov‐12 Dec‐12 Jan‐13 Feb‐13 Mar‐13 Apr‐13 May‐13 Jun‐13 Jul‐13
A/B MAC 5 & 6 Median Performance 90th Decile 75th Percentile
hfmamap.org

POS Collection RatePeer Group: Nationwide
80.0%
60.0%
70.0%
30 0%
40.0%
50.0%
10.0%
20.0%
30.0%
0.0%Aug‐12 Sep‐12 Oct‐12 Nov‐12 Dec‐12 Jan‐13 Feb‐13 Mar‐13 Apr‐13 May‐13 Jun‐13 Jul‐13
A/B MAC 5 & 6 Median Performance 90th Decile 75th Percentile
hfmamap.org

Charge Lag DaysPeer Group: Nationwide
7
5
6
3
4
1
2
0Aug‐12 Sep‐12 Oct‐12 Nov‐12 Dec‐12 Jan‐13 Feb‐13 Mar‐13 Apr‐13 May‐13 Jun‐13 Jul‐13
A/B MAC 5 & 6 Median Performance 90th Decile 75th Percentile
hfmamap.org
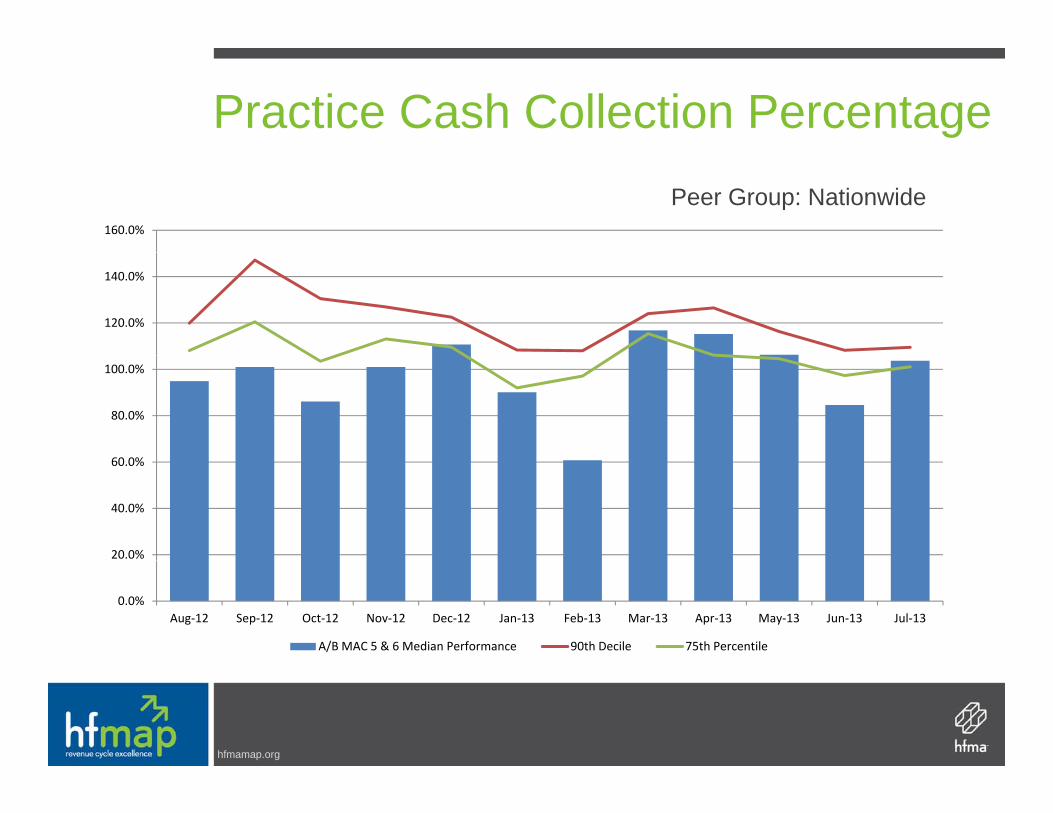
Practice Cash Collection PercentagePeer Group: Nationwide
160.0%
120.0%
140.0%
60 0%
80.0%
100.0%
20.0%
40.0%
60.0%
0.0%Aug‐12 Sep‐12 Oct‐12 Nov‐12 Dec‐12 Jan‐13 Feb‐13 Mar‐13 Apr‐13 May‐13 Jun‐13 Jul‐13
A/B MAC 5 & 6 Median Performance 90th Decile 75th Percentile
hfmamap.org

Practice Net Days in A/RPeer Group: Nationwide
70
50
60
30
40
10
20
0Aug‐12 Sep‐12 Oct‐12 Nov‐12 Dec‐12 Jan‐13 Feb‐13 Mar‐13 Apr‐13 May‐13 Jun‐13 Jul‐13
A/B MAC 5 & 6 Median Performance 90th Decile 75th Percentile
hfmamap.org

Aged A/R 90+Peer Group: Nationwide
20.0%
14.0%
16.0%
18.0%
8.0%
10.0%
12.0%
2 0%
4.0%
6.0%
0.0%
2.0%
Aug‐12 Sep‐12 Oct‐12 Nov‐12 Dec‐12 Jan‐13 Feb‐13 Mar‐13 Apr‐13 May‐13 Jun‐13 Jul‐13
A/B MAC 5 & 6 Median Performance 90th Decile 75th Percentile
hfmamap.org

A/R: Medicare Traditional 90+Peer Group: Nationwide
4.5%
3 0%
3.5%
4.0%
2.0%
2.5%
3.0%
0 5%
1.0%
1.5%
0.0%
0.5%
Aug‐12 Sep‐12 Oct‐12 Nov‐12 Dec‐12 Jan‐13 Feb‐13 Mar‐13 Apr‐13 May‐13 Jun‐13 Jul‐13
A/B MAC 5 & 6 Median Performance 90th Decile 75th Percentile
hfmamap.org

Payment Denial RatePeer Group: Nationwide
16.0%
12.0%
14.0%
6 0%
8.0%
10.0%
2.0%
4.0%
6.0%
0.0%Aug‐12 Sep‐12 Oct‐12 Nov‐12 Dec‐12 Jan‐13 Feb‐13 Mar‐13 Apr‐13 May‐13 Jun‐13 Jul‐13
A/B MAC 5 & 6 Median Performance 90th Decile 75th Percentile
hfmamap.org
MAP App – The ToolMAP App The Tool
hfmamap.org
hfmamap.org©2014 HFMA
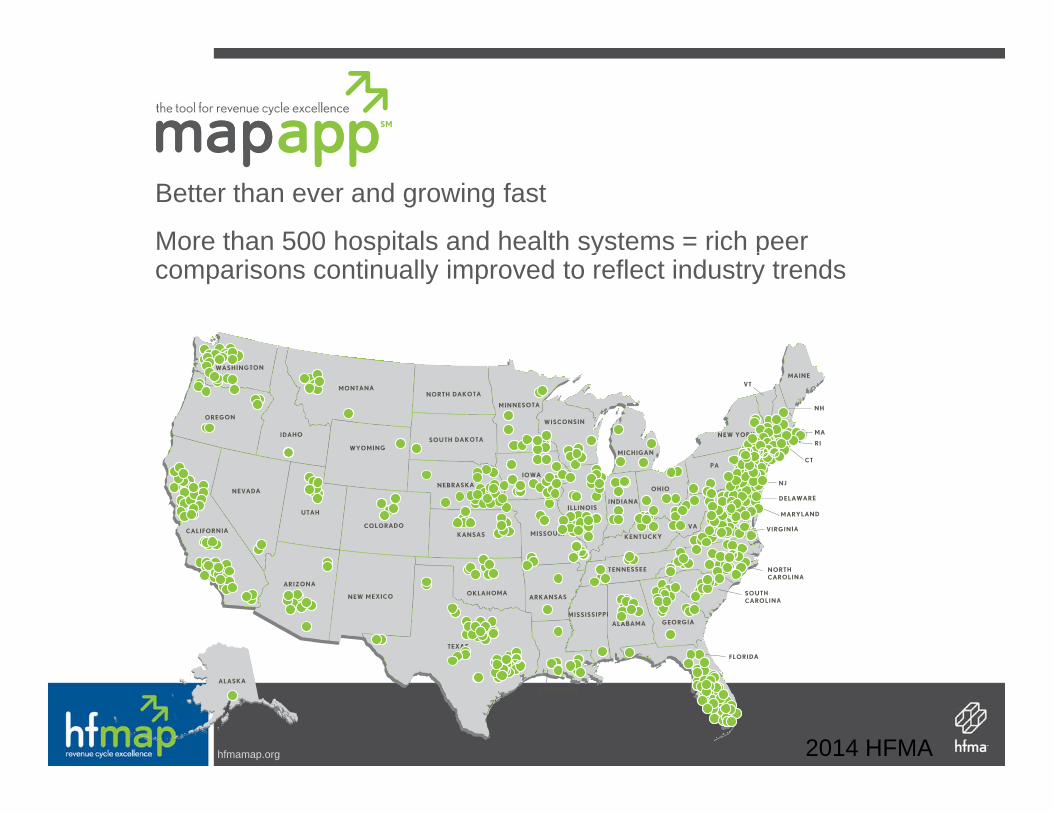
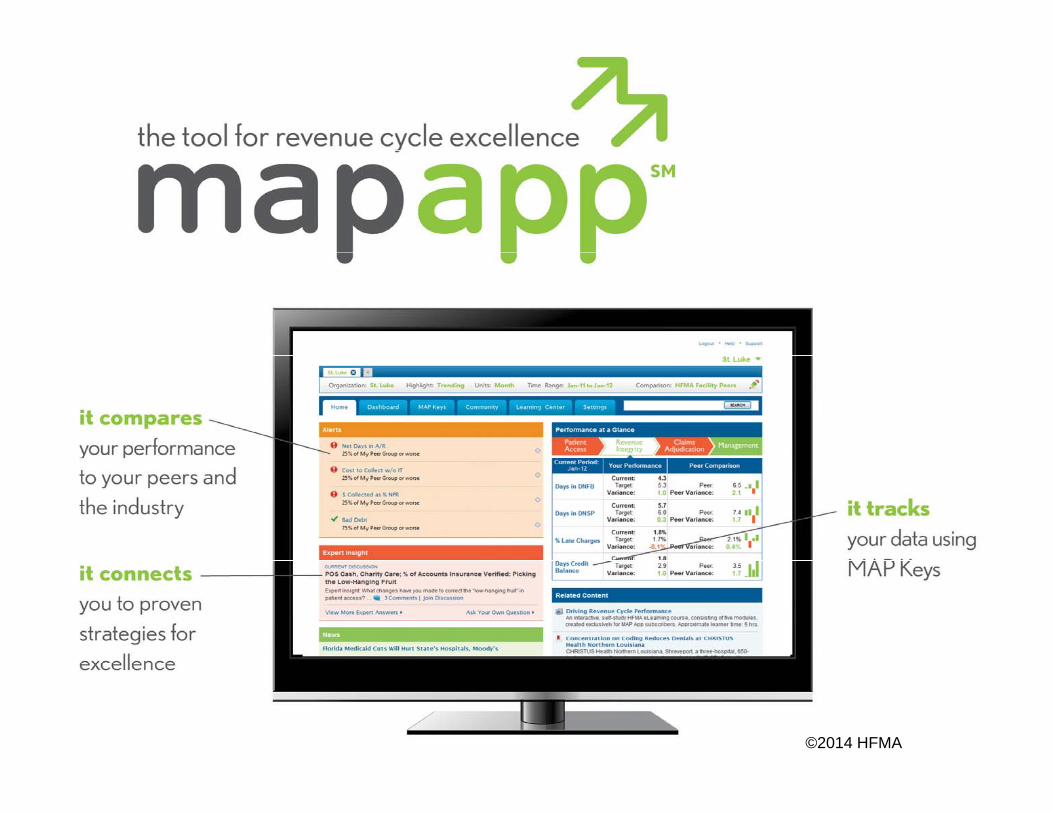
Better than ever and growing fast
More than 500 hospitals and health systems = rich peer p y pcomparisons continually improved to reflect industry trends
hfmamap.org 2014 HFMA

MAP AwardsMAP Awards
hfmamap.org
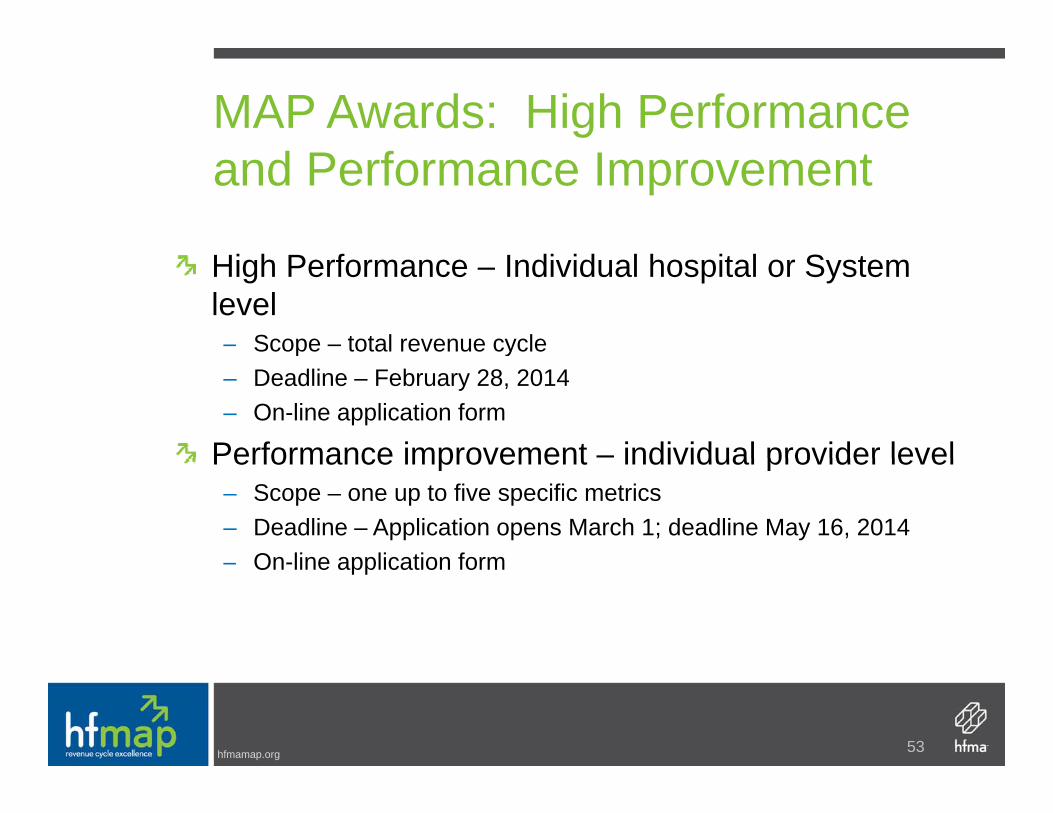
MAP Awards: High Performance and Performance Improvement
High Performance – Individual hospital or System level– Scope – total revenue cyclep y– Deadline – February 28, 2014– On-line application form
Performance improvement – individual provider levelPerformance improvement individual provider level– Scope – one up to five specific metrics– Deadline – Application opens March 1; deadline May 16, 2014
On line application form– On-line application form
hfmamap.org 53

Data from 2013 High Performing Revenue Cycle Award Submissions:
Net Days in A/R
Aged A/R 90 days and
greater DNFB FBNS DNSPBad Debt
Write Off %Cash
CollectionPOS Cash Collection
Charity Care Write
Off %M di 40 55 23 0% 5 90 60 6 50 2 2% M di 99 2% 11 7% 3 0%Median 40.55 23.0% 5.90 .60 6.50 2.2% Median 99.2% 11.7% 3.0%Percentile 90 27.15 10.7% 2.80 .00 4.17 0.5% Percentile 90 104.8% 38.5% 6.4%
75 34.03 16.4% 4.50 .00 5.34 1.3% 75 102.8% 24.4% 5.2%50 40.55 23.0% 5.90 .60 6.50 2.2% 50 99.2% 11.7% 3.0%25 47.60 29.6% 8.95 1.78 10.56 2.9% 25 95.9% 2.6% 1.4%10 52.45 41.3% 15.00 3.95 20.43 5.0% 10 87.7% 0.3% 0.6%
D f 2012 Hi h P f i R C l A d S b i iData from 2012 High Performing Revenue Cycle Award Submissions:
Net Days in A/R
Aged A/R 90 days and
greater DNFB FBNS DNSPBad Debt
Write Off %Cash
CollectionPOS Cash Collection
Charity Care Write
Off %Median 39.02 22.9% 6.03 .77 6.87 2.1% Median 97.7% 13.6% 2.8%Percentile 90 27.22 6.8% 4.08 .08 4.60 0.6% Percentile 90 102.8% 41.4% 8.1%
75 33.23 11.3% 4.92 .37 5.50 1.3% 75 100.5% 22.0% 5.3%50 39.02 22.9% 6.03 .77 6.87 2.1% 50 97.7% 13.6% 2.8%25 44 00 29 5% 8 01 1 29 9 25 3 3% 25 95 2% 5 4% 1 7%25 44.00 29.5% 8.01 1.29 9.25 3.3% 25 95.2% 5.4% 1.7%10 57.20 39.0% 10.82 3.22 13.03 5.4% 10 91.3% 1.4% 1.1%
Data from 2011 High Performing Revenue Cycle Award Submissions:Aged A/R Charity
Net Days in A/R
ged /90 days and
greater DNFB FBNS DNSPBad Debt
Write Off %Cash
CollectionPOS Cash Collection
C a tyCare Write
Off %Median 40.33 24.0% 5.73 .85 6.73 2.0% Median 100.0% 20.0% 3.0%Percentile 90 31.64 10.4% 3.73 .10 4.69 1.0% Percentile 90 105.0% 53.0% 6.5%
75 35.63 16.0% 4.65 .39 5.68 1.0% 75 101.8% 36.0% 4.8%50 40.33 24.0% 5.73 .85 6.73 2.0% 50 100.0% 20.0% 3.0%25 46.59 28.0% 6.98 1.53 8.40 3.0% 25 96.3% 7.0% 2.0%10 54.01 35.0% 9.97 2.41 10.22 5.7% 10 91.0% 5.0% 1.0%
hfmamap.org
MAP EventMAP Event
hfmamap.org

MAP EventOpen to all revenue cycle professionalsEducation focus on measure, apply, perform
tconceptsHighlights innovation in revenue cycle operationsBrings together providers physicians and payers toBrings together providers, physicians and payers to demonstrate winning strategiesProvides opportunities to learn from high performing revenue cycle professionalsPeer reviewed vendors provide additional sessions
hfmamap.org 56

Your Challenges
Organizations must continue to do more with lessOrganizations must continue to do more with less
Greatest opportunity is the value of your data
Don’t keep sticking your toe in the water to check the
temperature….do something about it….jump in
The way to achieving high performance is through
benchmarking and performance trackingbenchmarking and performance tracking
hfmamap.org 57
The Secret Sauce: Begin With the Keys!Calculate the potential improvement valueCalculate the potential improvement value to the organizationUse KPIs that are standardized and includeUse KPIs that are standardized and include peer comparison of validated data to provide “best practice”p pSelect measurements that are meaningful to your organizationy gUse data to change behaviors
hfmamap.org 58

MAP Research: SuccessfulMAP Research: Successful Practices
hfmamap.org

Highly Effective HabitsResearch Has Shown that High-Performing Revenue Cycles Focus on SixResearch Has Shown that High-Performing Revenue Cycles Focus on Six Key AreasPatient Friendly Billing Project Research Report Key Revenue Cycle CompetenciesResearch Report
People
y y p
Processes Technology Metrics Communication Culture
hfmamap.org
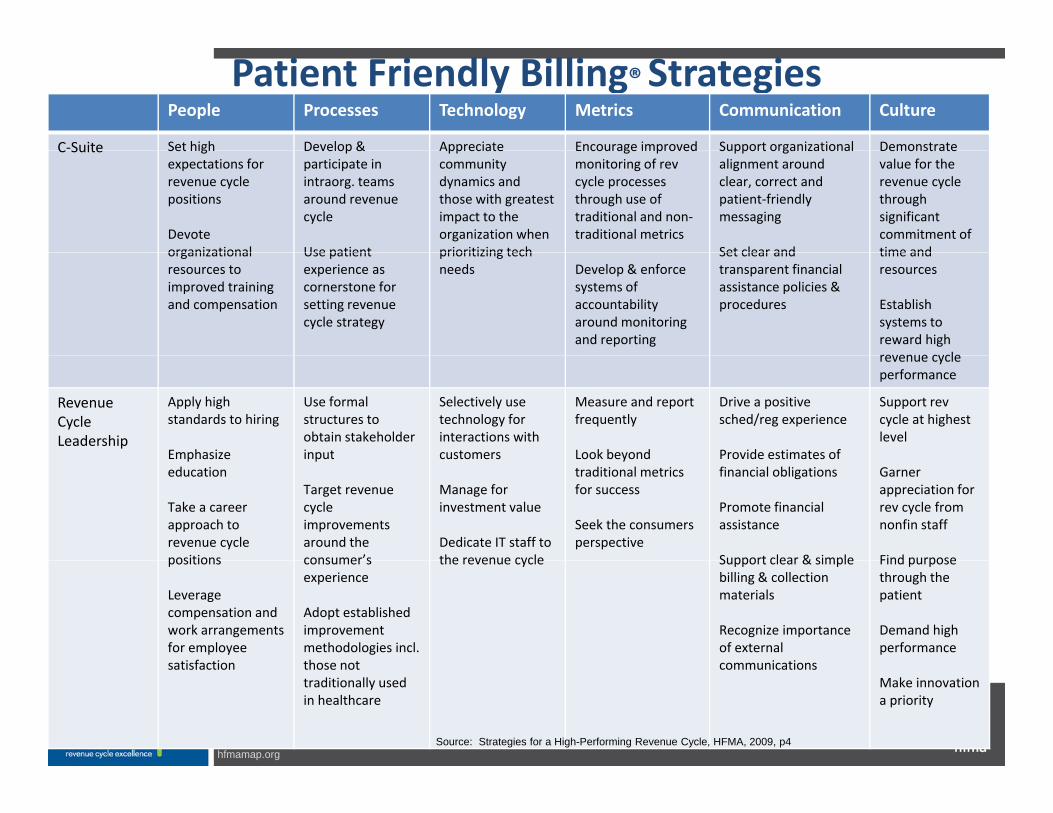
Patient Friendly Billing® StrategiesPeople Processes Technology Metrics Communication Culture
C‐Suite Set high Develop & Appreciate Encourage improved Support organizational DemonstrateC Suite Set highexpectations for revenue cycle positions
Devote organizational
Develop & participate in intraorg. teams around revenue cycle
Use patient
Appreciate community dynamics and those with greatest impact to the organization when prioritizing tech
Encourage improved monitoring of rev cycle processes through use of traditional and non‐traditional metrics
Support organizational alignment around clear, correct and patient‐friendly messaging
Set clear and
Demonstrate value for the revenue cycle through significant commitment of time andorganizational
resources to improved training and compensation
Use patient experience as cornerstone for setting revenue cycle strategy
prioritizing tech needs Develop & enforce
systems of accountability around monitoring and reporting
Set clear and transparent financial assistance policies & procedures
time and resources
Establish systems to reward high revenue cyclerevenue cycle performance
Revenue Cycle Leadership
Apply high standards to hiring
Emphasize
Use formal structures to obtain stakeholder input
Selectively use technology for interactions with customers
Measure and report frequently
Look beyond
Drive a positive sched/reg experience
Provide estimates of
Support rev cycle at highest level
Emphasize education
Take a career approach to revenue cycle positions
input
Target revenue cycle improvements around the consumer’s
customers
Manage for investment value
Dedicate IT staff to the revenue cycle
Look beyond traditional metrics for success
Seek the consumers perspective
Provide estimates of financial obligations
Promote financial assistance
Support clear & simple
Garner appreciation for rev cycle from nonfin staff
Find purposepositions
Leverage compensation and work arrangements for employee satisfaction
consumer s experience
Adopt established improvement methodologies incl. those not
the revenue cycle Support clear & simple billing & collection materials
Recognize importance of external communications
Find purpose through the patient
Demand high performance
hfmamap.org
satisfaction those not traditionally used in healthcare
communicationsMake innovation a priority
Source: Strategies for a High-Performing Revenue Cycle, HFMA, 2009, p4

Designing Operational MetricsMultiple levels from macro (Map Keys) to detailed to vendorsFi t l l KFirst level Keys:• Cash by major payer category daily and month-end• Cash to Net %• Discharged not final billed – Days in A/R (include failed claims)• Accounts receivable aging• Self pay A/R (include % of total A/R)p y ( )• Gross A/R days and Net AR days• Bad debt write-offs as % of GPR• Charity write-offs as % of GPR• Charity write-offs as % of GPR• Denial write-offs as % of GPR• Denial A/R
P t V i A/R
hfmamap.org
• Payment Variance A/R
62
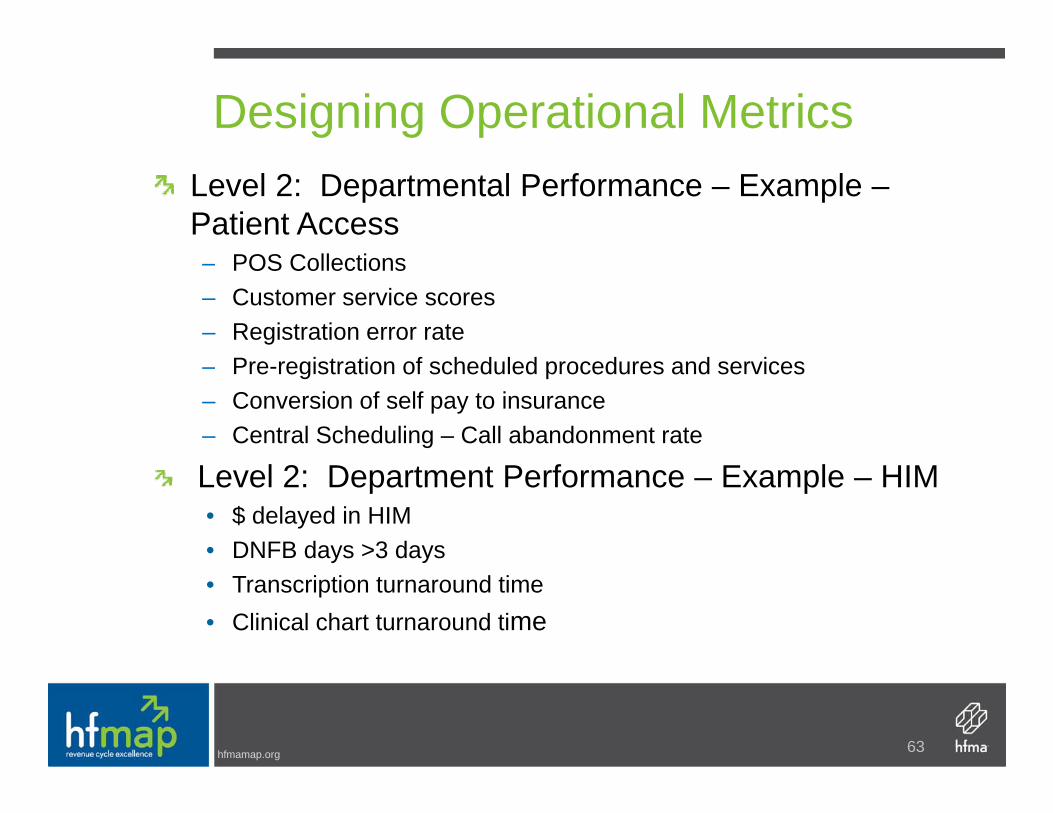
Designing Operational MetricsLevel 2: Departmental Performance – Example –Patient Access– POS Collections– Customer service scores– Registration error rate– Pre-registration of scheduled procedures and services– Conversion of self pay to insurance– Central Scheduling – Call abandonment rate
Level 2: Department Performance – Example – HIM• $ delayed in HIM• DNFB days >3 daysy y• Transcription turnaround time• Clinical chart turnaround time
hfmamap.org 63
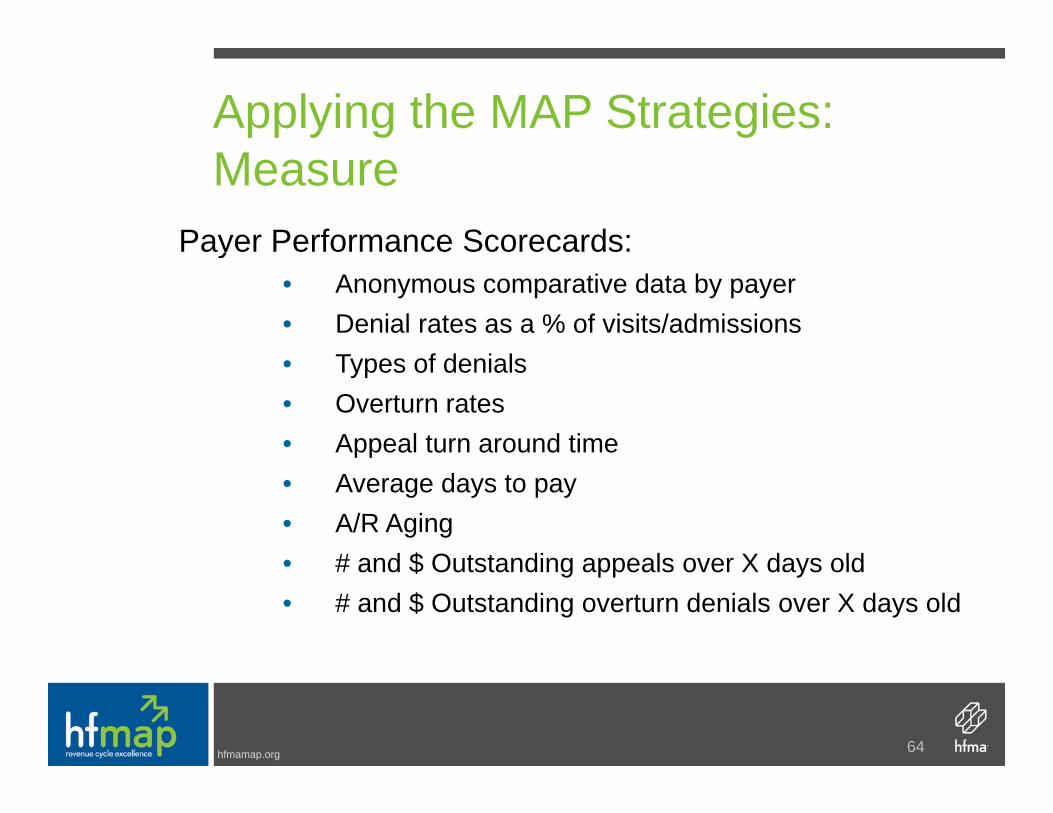
Applying the MAP Strategies: Measure
Payer Performance Scorecards:y• Anonymous comparative data by payer• Denial rates as a % of visits/admissions
T f d i l• Types of denials• Overturn rates• Appeal turn around time• Average days to pay• A/R Aging • # and $ Outstanding appeals over X days old• # and $ Outstanding appeals over X days old• # and $ Outstanding overturn denials over X days old
hfmamap.org 64

MAP Strategy: Apply
Sharing performance with payersComparing denial rates among payersDriving improvement in appeals resolution daysComparing average days to payComparing average days to payUsing scorecard data to change managed care contract terms
hfmamap.org 65
MAP Strategy: Perform
Use data to reduce days in A/RUse data to improve denial resolution rates and timesLower denial rates equates to $X increase in cash collectionsReduce bad debtsReduce bad debts
hfmamap.org 66

Finding Your Opportunities …
Identify segments of the revenue cycle where performance is laggingPrepare a Gap Analysis to confirm specific target areasUse the ideal revenue cycle steps from the Gap Analysis and y p p ybest practices from industry sources to redesign for the futureSet performance expectations over reasonable period of timeTrain staffTrain staffImplement and continue to track the relevant KPIs to demonstrate progress on a routine basis
hfmamap.org 67
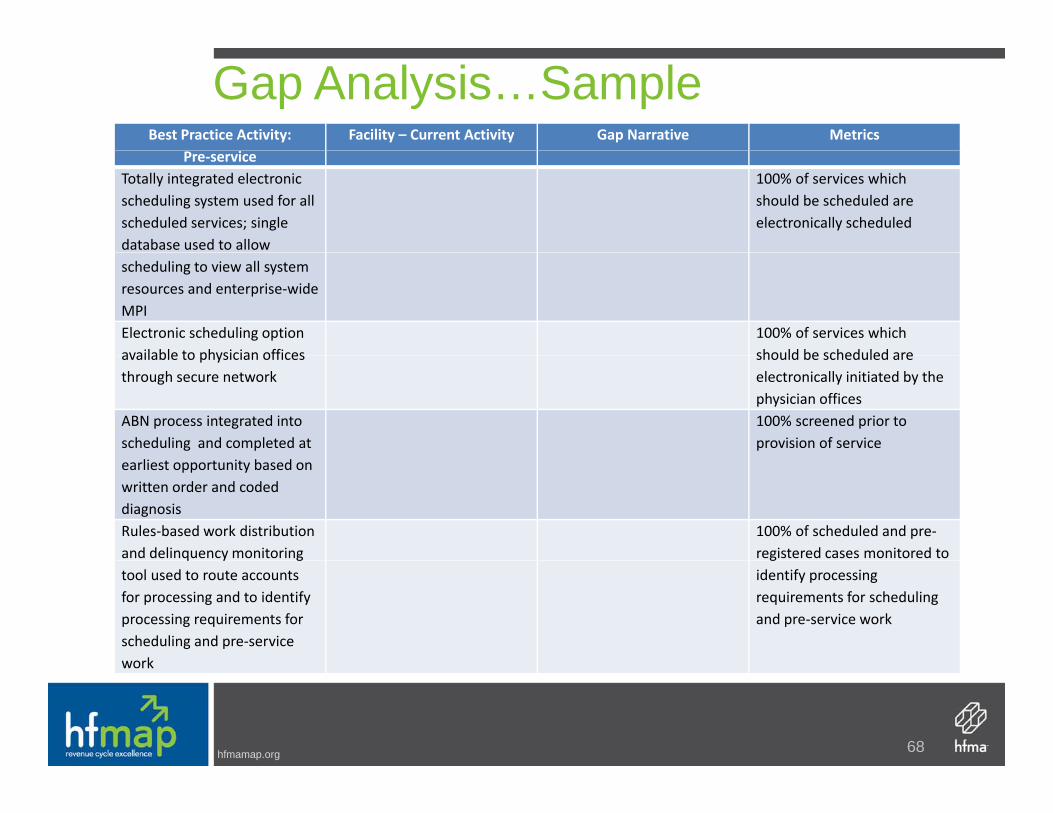
Gap Analysis…SampleBest Practice Activity: Facility – Current Activity Gap Narrative Metrics
Pre‐serviceTotally integrated electronic scheduling system used for all scheduled services; single database used to allow
100% of services which should be scheduled are electronically scheduled
scheduling to view all system resources and enterprise‐wide MPIElectronic scheduling option available to physician offices
100% of services which should be scheduled areavailable to physician offices
through secure networkshould be scheduled are electronically initiated by the physician offices
ABN process integrated into scheduling and completed at
100% screened prior to provision of service
earliest opportunity based on written order and coded diagnosisRules‐based work distribution and delinquency monitoring
100% of scheduled and pre‐registered cases monitored to q y g
tool used to route accounts for processing and to identify processing requirements for scheduling and pre‐service work
gidentify processing requirements for scheduling and pre‐service work
hfmamap.org
work
68

In Closing…What is Your Approach to Metrics?
CFO
hfmamap.org 69

QuestionsQuestions
hfmamap.org
Appendix: Gap Analysis WorksheetAppendix: Gap Analysis Worksheet
hfmamap.org
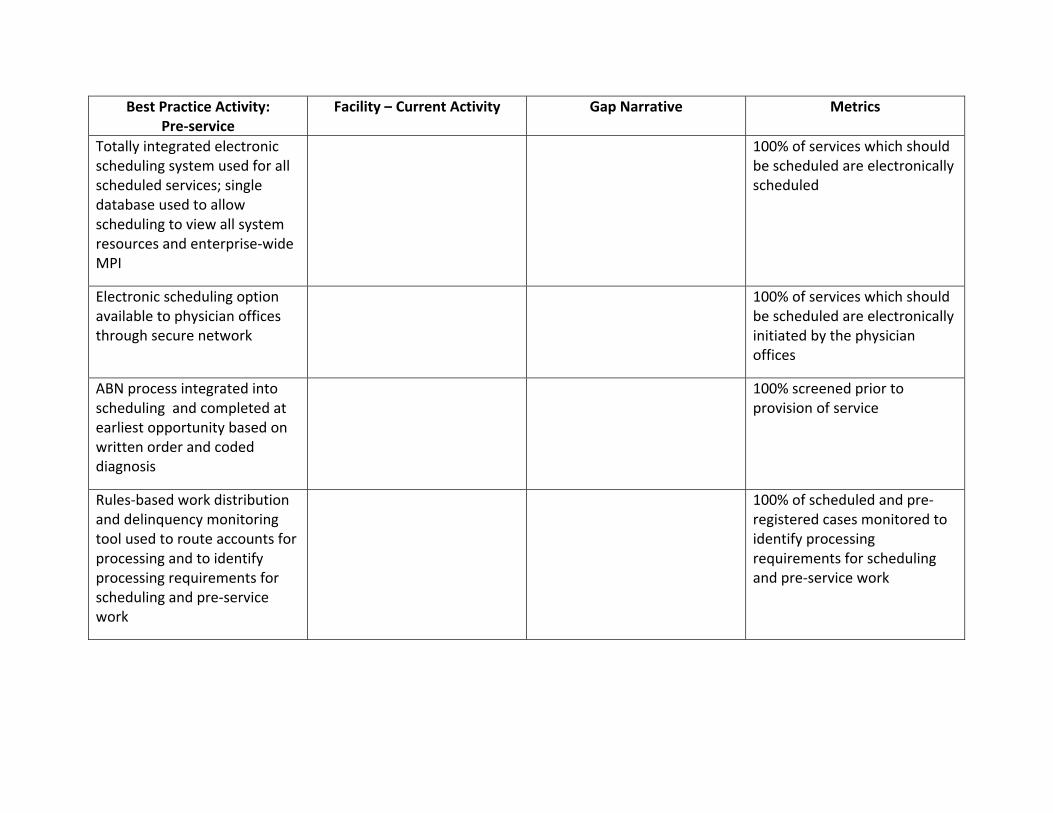
Best Practice Activity: Pre‐service
Facility – Current Activity Gap Narrative Metrics
Totally integrated electronic scheduling system used for all scheduled services; single database used to allow scheduling to view all system resources and enterprise‐wide MPI
100% of services which should be scheduled are electronically scheduled
Electronic scheduling option available to physician offices through secure network
100% of services which should be scheduled are electronically initiated by the physician offices
ABN process integrated into scheduling and completed at earliest opportunity based on written order and coded diagnosis
100% screened prior to provision of service
Rules‐based work distribution and delinquency monitoring tool used to route accounts for processing and to identify processing requirements for scheduling and pre‐service work
100% of scheduled and pre‐registered cases monitored to identify processing requirements for scheduling and pre‐service work
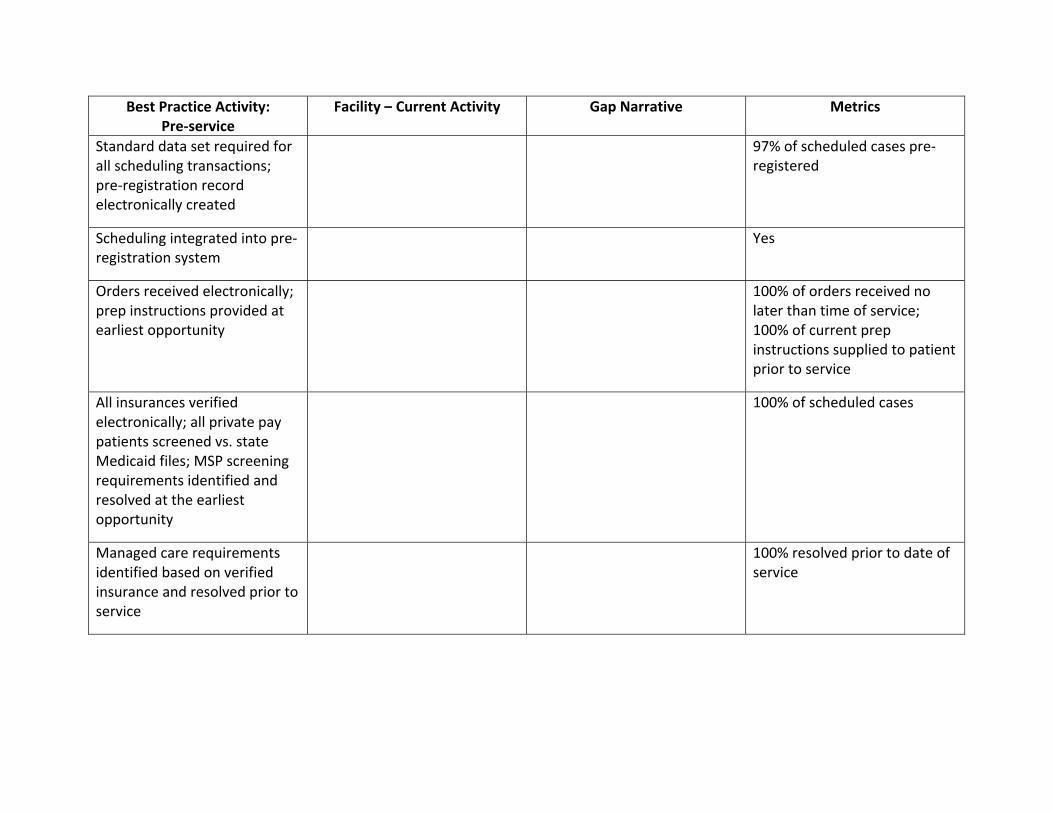
Best Practice Activity: Pre‐service
Facility – Current Activity Gap Narrative Metrics
Standard data set required for all scheduling transactions; pre‐registration record electronically created
97% of scheduled cases pre‐registered
Scheduling integrated into pre‐registration system
Yes
Orders received electronically; prep instructions provided at earliest opportunity
100% of orders received no later than time of service; 100% of current prep instructions supplied to patient prior to service
All insurances verified electronically; all private pay patients screened vs. state Medicaid files; MSP screening requirements identified and resolved at the earliest opportunity
100% of scheduled cases
Managed care requirements identified based on verified insurance and resolved prior to service
100% resolved prior to date of service
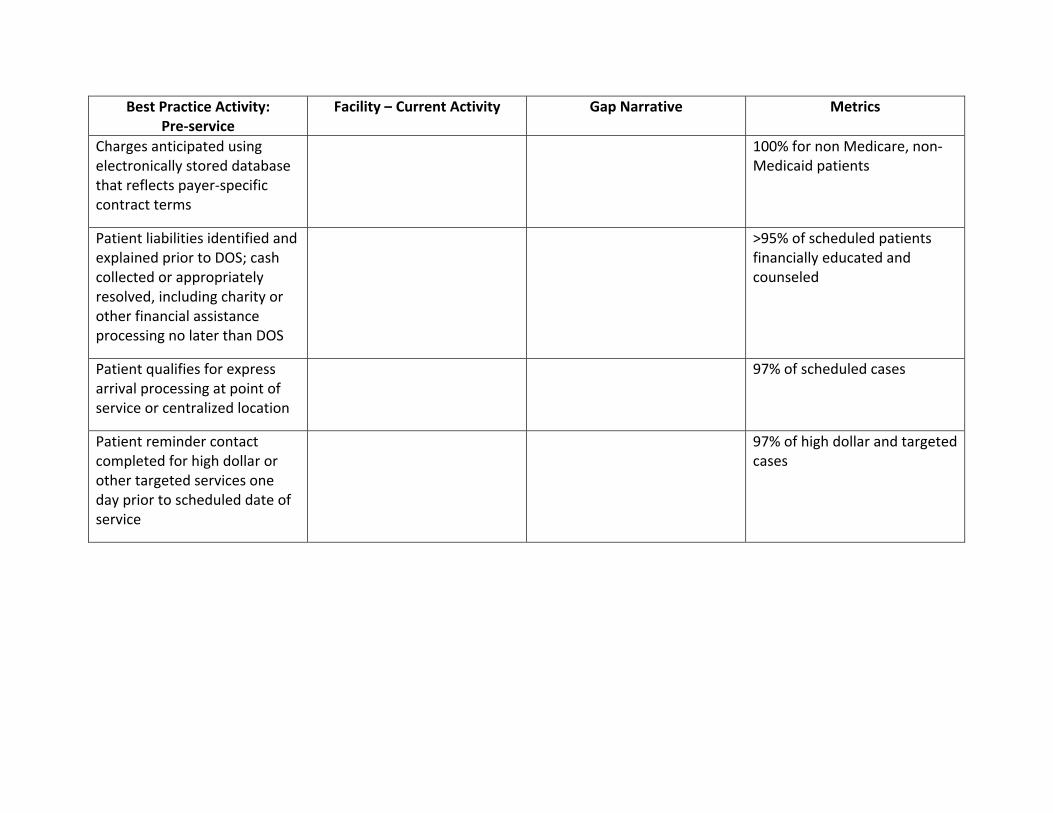
Best Practice Activity: Pre‐service
Facility – Current Activity Gap Narrative Metrics
Charges anticipated using electronically stored database that reflects payer‐specific contract terms
100% for non Medicare, non‐Medicaid patients
Patient liabilities identified and explained prior to DOS; cash collected or appropriately resolved, including charity or other financial assistance processing no later than DOS
>95% of scheduled patients financially educated and counseled
Patient qualifies for express arrival processing at point of service or centralized location
97% of scheduled cases
Patient reminder contact completed for high dollar or other targeted services one day prior to scheduled date of service
97% of high dollar and targeted cases

Best Practice Activity: Time of Service
Facility – Current Activity Gap Narrative Metrics
Expedited patient arrival processing at point of service or convenient centralized area completed for all scheduled patients, including account activation upon arrival; insurance cards and other documents scanned directly into patient’s electronic folder
97% of scheduled patients qualified for expedited processing
Comprehensive patient access processing completed for unscheduled ancillary patients; insurance cards and other documents scanned directly into patient’s electronic folder
100%
Point of service collections or account resolution completed for all patients
>95% of patients with identified patient liability; 100% cash posted electronically
Service provided; charges posted concurrently on day services provided; exceptional situations immediately identified and appropriate system controls used to eliminate late charge posting
98% accurate and timely charge capture

Best Practice Activity: Time of Service
Facility – Current Activity Gap Narrative Metrics
Charge master updating and user education provided on a routine basis
Yes, no less than monthly
Ongoing patient financial liabilities monitored for high dollar accounts; account resolution options updated and revisited with patient, as appropriate
100% when required
Ongoing case management (Utilization Review) and discharge planning is completed, as appropriate
95% payer acceptance of clinical treatment plans; 95% clinical denial overturn rate
Concurrent coding completed at earliest opportunity; coding completed no later than three days after completion of service
<0.5 day in AR held for coding; 0.5 day in AR held for dictation; coding completed <3 days from DOS
Medical Records coding is completed by credentialed individuals and coding quality is routinely monitored by HIM management
Audit schedule completed monthly
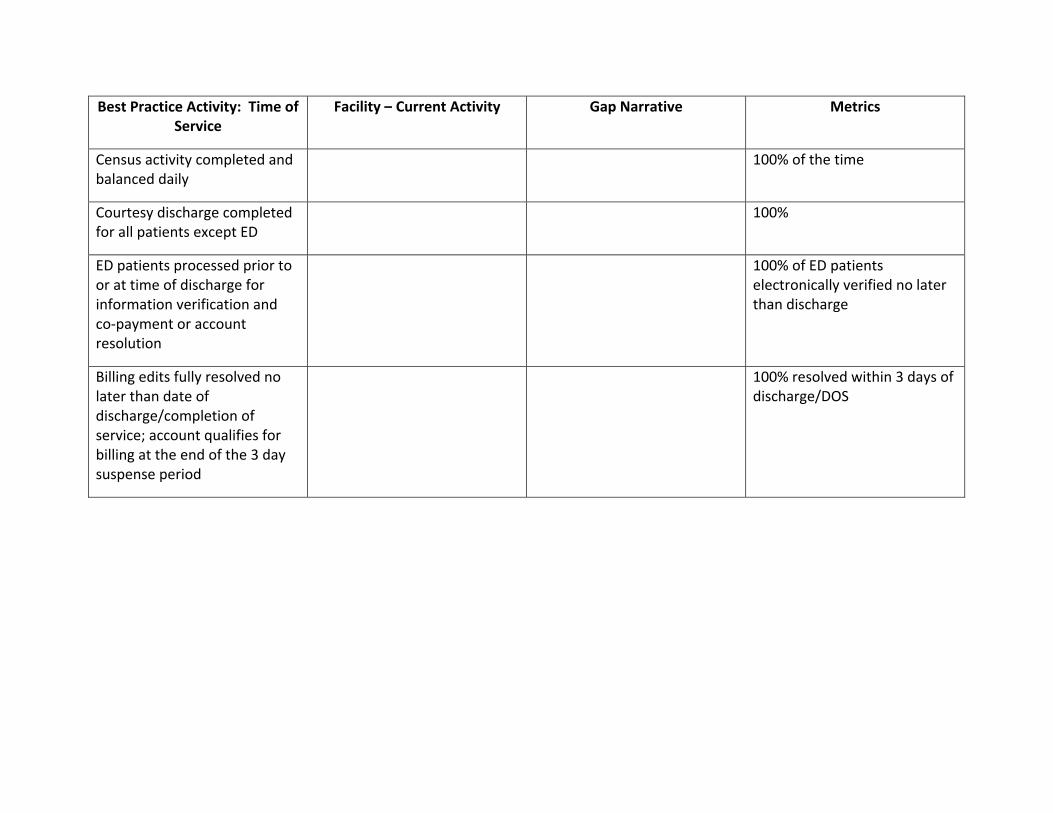
Best Practice Activity: Time of Service
Facility – Current Activity Gap Narrative Metrics
Census activity completed and balanced daily
100% of the time
Courtesy discharge completed for all patients except ED
100%
ED patients processed prior to or at time of discharge for information verification and co‐payment or account resolution
100% of ED patients electronically verified no later than discharge
Billing edits fully resolved no later than date of discharge/completion of service; account qualifies for billing at the end of the 3 day suspense period
100% resolved within 3 days of discharge/DOS

Best Practice Activity: Post Service
Facility – Current Activity Gap Narrative Metrics
Electronic billing system used to complete compliance checking
100% clean claims released without manual intervention; all claims edited electronically
All contractual adjustments applied at time of billing
At time of billing, or <24 hours from receipt of payment
Payer and patient liabilities correctly pro‐rated at time of billing
97% accuracy rate
Clean claims released daily to payers without intervention
97% of all claims clean
Self Pay statements formatting in accordance with HFMA Patient Friendly Billing Project guidelines
Follow PFB project guidelines
Processing of Medicare supplemental insurance claims expedited
0 days from receipt of Medicare adjudication
Follow‐up queues automatically created based on specific payers’ clean claim payment cycles
No more than 20% of AR >90 days from discharge; no more than 10% of AR >120 days from discharge
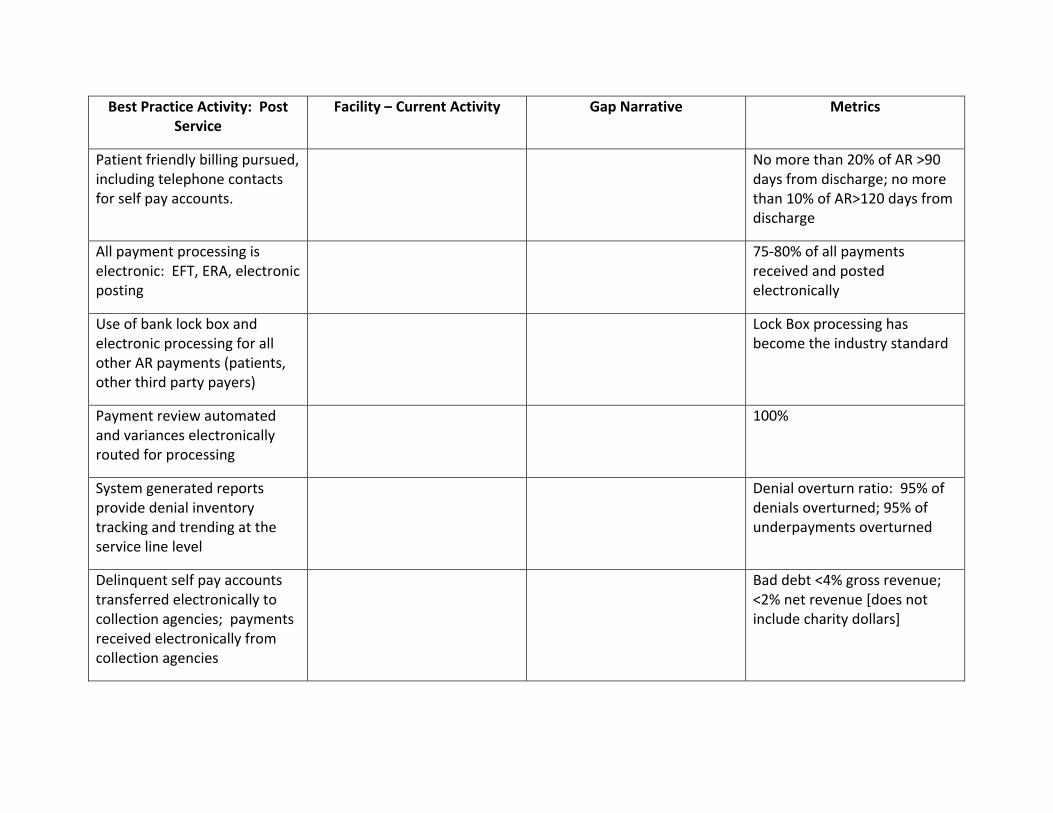
Best Practice Activity: Post Service
Facility – Current Activity Gap Narrative Metrics
Patient friendly billing pursued, including telephone contacts for self pay accounts.
No more than 20% of AR >90 days from discharge; no more than 10% of AR>120 days from discharge
All payment processing is electronic: EFT, ERA, electronic posting
75‐80% of all payments received and posted electronically
Use of bank lock box and electronic processing for all other AR payments (patients, other third party payers)
Lock Box processing has become the industry standard
Payment review automated and variances electronically routed for processing
100%
System generated reports provide denial inventory tracking and trending at the service line level
Denial overturn ratio: 95% of denials overturned; 95% of underpayments overturned
Delinquent self pay accounts transferred electronically to collection agencies; payments received electronically from collection agencies
Bad debt <4% gross revenue; <2% net revenue [does not include charity dollars]
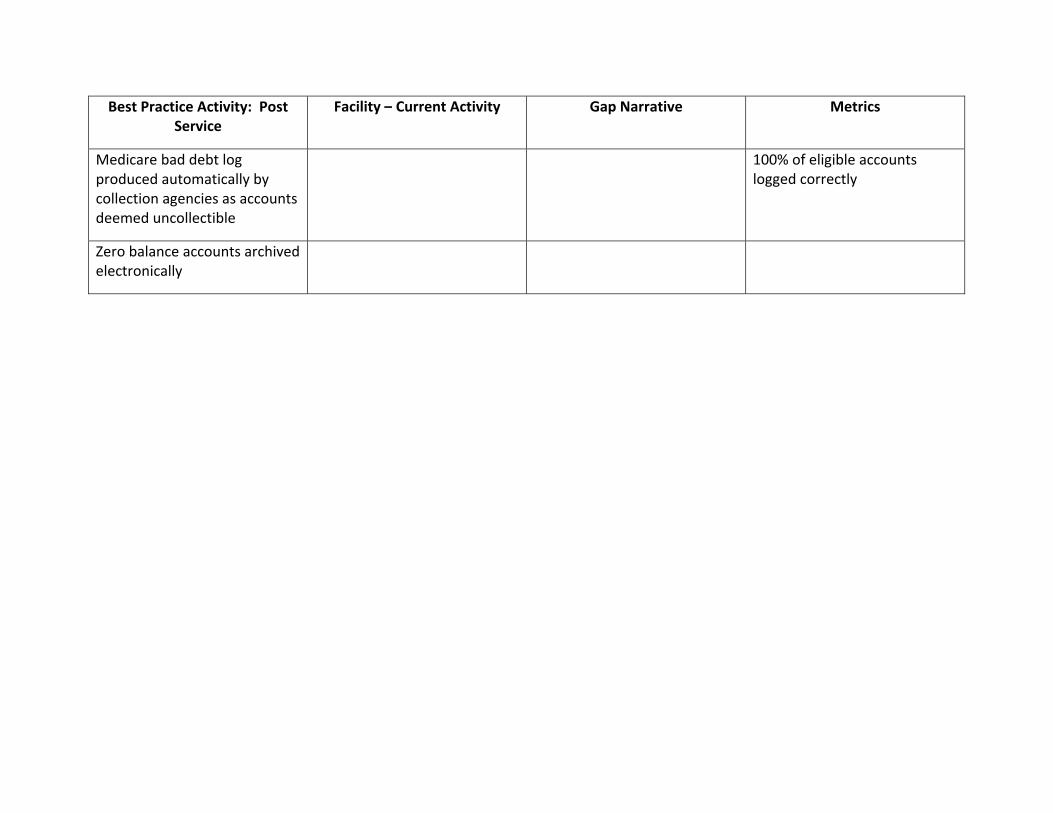
Best Practice Activity: Post Service
Facility – Current Activity Gap Narrative Metrics
Medicare bad debt log produced automatically by collection agencies as accounts deemed uncollectible
100% of eligible accounts logged correctly
Zero balance accounts archived electronically

Sandra J Wolfskill, FHFMA Director Healthcare Finance Policy Revenue Cycle MAPDirector, Healthcare Finance Policy, Revenue Cycle MAPHFMA
Ms Wolfskill is responsible for revenue cycle and MAP initiatives at HFMA. Herextensive experience in revenue cycle management includes leading engagements with clients engaged in process mapping and analysis project management staffingclients engaged in process mapping and analysis, project management, staffing analyses, using contemporary metrics to identify improvement opportunities, staff education, interim management and system implementation testing and training. Prior to joining HFMA, she worked closely with HFMA in supporting the task force work which lead to the CRCR study guide and certification process.
Background and AffiliationsMs. Wolfskill received a BA cum laude from Wittenberg University and a Master of Arts degree from The University of Delaware. Prior to founding her consulting firm, Sandra had extensive revenue cycle experience and provider management experience in a variety of positions including serving as the chief financial officer for a smalla variety of positions, including serving as the chief financial officer for a small community hospital.
When not engaged in revenue cycle opportunities, Sandra, along with her best friend Donna, can be found breeding and showing their Dandie Dinmont Terriers and judging dog shows in the United States Europe Canada China and Russiadog shows in the United States, Europe, Canada, China and Russia.
Contact InformationMs. Wolfskill can be reached by telephone at (708) 492-3419 and/or by e-mail at [email protected].
hfmamap.org
72