Map Book - umcasia.org for PAS_Final.pdfAsia since 1997. For more information, ... (UMC) and the All...
68
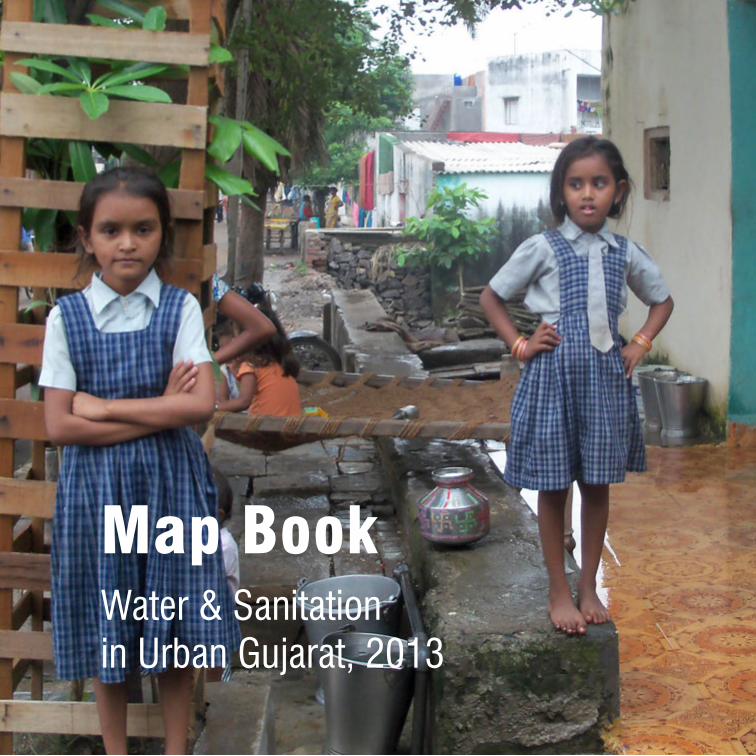
Map Book Water & Sanitation in Urban Gujarat, 2013
Transcript of Map Book - umcasia.org for PAS_Final.pdfAsia since 1997. For more information, ... (UMC) and the All...
Map Book Water & Sanitationin Urban Gujarat, 2013

The Urban Management Centre (UMC) is a not-for-profit organization, that works towards professionalizing urban management in India and worldwide. UMC provides technical assistance and support to city governments and facilitates change through peer-to-peer learning processes. It enhances the capacity of city governments by providing expertise and ready access to innovations on good governance implemented in India and abroad. UMC extensively works in the areas of urban water and sanitation, heritage management, planning, urban health, municipal finance, urban management, urban transportation and institutional restructuring. UMC is a legacy organization of International City/County Management Association (ICMA) and hence is also known as ICMA-South Asia since 1997. For more information, visit our website: www.umcasia.org
PAS, a seven-year action research project, has been initiated by CEPT University with funding from the Bill and Melinda Gates Foundation. PAS aims to develop better information on water and sanitation performance at the local level to be used to improve the financial viability, quality and reliability of services. It uses performance indicators and benchmarks on water and sanitation services in all the 400 plus cities in Gujarat and Maharashtra. Urban Management Centre (UMC) and the All India Institute of Local Self Government (AIILSG) are CEPT University’s project partners in Gujarat and Maharashtra, respectively. More details are available on:www.pas.org.in.
UMCURBAN MANAGEMENT CENTRE
in collaboration with ICMA
UMCURBAN MANAGEMENT CENTRE
Prepared by Urban Management Centre (UMC)
ISBN : 978-81-909120-6-8
July 2014
All photographs by UMC
Data from this book can be used and quoted with due acknowledgement
to the organisation and the program
Cover photo: A slum household with individual piped water connection in Rajkot

Map Book Water & Sanitationin Urban Gujarat, 2013
Prepared by
Urban Management Centre (UMC)
Under the
Performance Assessment System (PAS) Program
Urban Management Centrec/o 3rd Floor, AUDA building, UsmanpuraAhmedabad, Gujarat, IndiaTelefax: 91 79 27546403/ [email protected]

The map book presents the status of key performance indicators (KPIs) for water and sanitation derived under the PAS program for all 167 cities of Gujarat. The PAS assessment framework is aligned with the service level benchmarking (SLB) initiative of Ministry of Urban Development (MoUD) and includes equity and other local action indicators. The PAS program led by CEPT University with Urban Management Centre (UMC) as the project partner in Gujarat, is financially supported by The Bill and Melinda Gates Foundation.
The PAS project was initiated in 2009 and has completed five years. The project will continue for two more years until 2016. Data collection under the PAS program has been an extensive exercise. During the last 5 years, the project team has travelled to all cities in Gujarat to collect information and data on water and sanitation, understand ground realities, validate the data with the urban local body (ULB) officials and engage with them on various performance monitoring and improvement initiatives. Over the course of time, the PAS project team has provided training and support to ULB staff to collect, and collate data and analyze water and sanitation data and use it for better decision making.
ULBs in Gujarat have begun to fill the required information on the PAS portal annually on their own. Once reported, data is shared, discussed, reviewed and validated with the PAS team. While the reliability of reported data has improved over the years, most data still falls low on a reliability scale because of lack of evidentiary proofs and supporting documents.
During these five years, the urban water and sanitation sector in Gujarat has seen positive improvements. There are a total of 49.7 Lakh urban households in Gujarat cities (Census 2011). Currently, 83.7% households have access to piped water supply as compared to 77.2 % households in 2009. Similarly percentage of households with access to toilets (individual and community) has also increased from 78.4% to 86.4%. While Gujarat has seen an overall improvement in the urban water and sanitation sector, there are regional and sectoral disparities. Close to 84% of urban households in the State are connected to piped water supply, the coverage of sewage network in the State is still limited at 54.2% and largely concentrated in larger cities. Geographically, coastal cities in the Saurashtra region under-perform in most sectors.
Preface

Through this map book we have attempted to highlight these differences and transformations in the State by spatially mapping the available city level data on a GIS platform. We believe geographical representation of water and sanitation data through maps can help highlight key inequalities and can prove to be a useful decision making tool. Urban local bodies can easily visualize the status of water and sanitation in their cities in comparison with other peer cities. Similarly district level authorities and State level agencies can undertake targeted interventions in cities and regions where access to water and sanitation is lagging behind.
We sincerely hope this map book will motivate our governments to keep data and information in a format which is useful in effective monitoring of services. We also hope that the State Government and ULBs in Gujarat will continue to collect water and sanitation data under the SLB framework, and record and analyse this data periodically .
The map book also serves as a means to share the findings of the SLB data of Gujarat with a wider audience such as Non Governmental Organizations (NGOs) and researchers working towards improving the water and sanitation situation in Gujarat.
The process of preparing this map book has been a great learning process for us and has allowed us to visualize and analyse data and arrive at key focus areas in the in the State.
We thank the project team leaders Dr. Meera Mehta and Dr. Dinesh Mehta from CEPT University for their advice and support. Special thanks to the officers from the Urban Development and Housing Department (UD&HD), Gujarat Urban Development Mission (GUDM), Gujarat Urban Development Company (GUDC), Gujarat Municipal Finance Board (GMFB), the Directorate of Municipalities (DOM) and all 167 urban local bodies in Gujarat for sharing data on water and sanitation over the last five years. Lastly, we would like to appreciate the effort by the UMC team including Meghna Malhotra, Vanishree Herlekar, Arvind Singh, Vinay Patel, Vimal Sharma, Bhavesh Patel, Krunal Parmar, Anurag Anthony, Rajiv Reddy, and Sai Kiran to bring out this map book.
The Urban Management Centre will be happy to receive comments and feedback on this work.
Manvita BaradiDirector, Urban Management Centre
July 2014
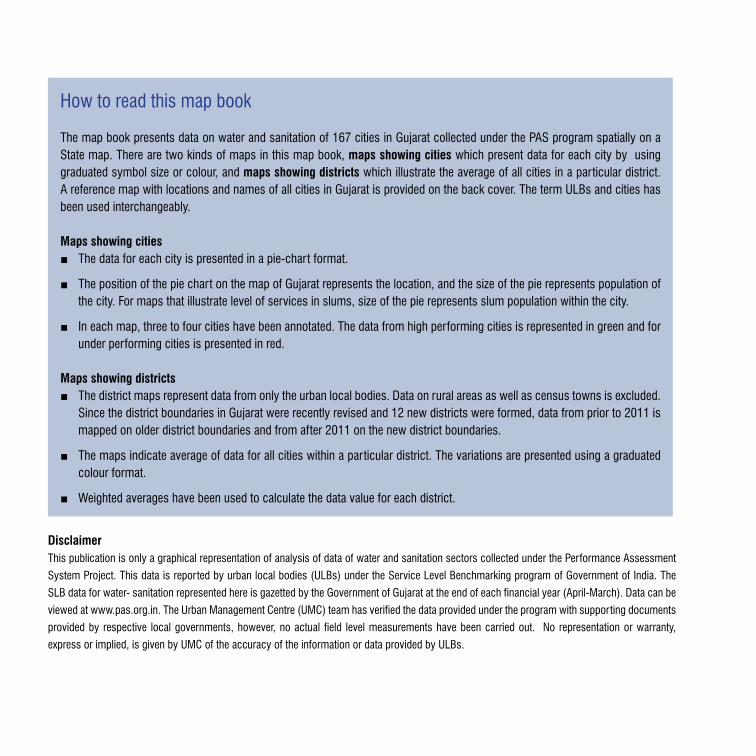
How to read this map book
The map book presents data on water and sanitation of 167 cities in Gujarat collected under the PAS program spatially on a State map. There are two kinds of maps in this map book, maps showing cities which present data for each city by using graduated symbol size or colour, and maps showing districts which illustrate the average of all cities in a particular district. A reference map with locations and names of all cities in Gujarat is provided on the back cover. The term ULBs and cities has been used interchangeably.
Maps showing cities ■ The data for each city is presented in a pie-chart format.
■ The position of the pie chart on the map of Gujarat represents the location, and the size of the pie represents population of the city. For maps that illustrate level of services in slums, size of the pie represents slum population within the city.
■ In each map, three to four cities have been annotated. The data from high performing cities is represented in green and for under performing cities is presented in red.
Maps showing districts ■ The district maps represent data from only the urban local bodies. Data on rural areas as well as census towns is excluded.
Since the district boundaries in Gujarat were recently revised and 12 new districts were formed, data from prior to 2011 is mapped on older district boundaries and from after 2011 on the new district boundaries.
■ The maps indicate average of data for all cities within a particular district. The variations are presented using a graduated colour format.
■ Weighted averages have been used to calculate the data value for each district.
DisclaimerThis publication is only a graphical representation of analysis of data of water and sanitation sectors collected under the Performance Assessment
System Project. This data is reported by urban local bodies (ULBs) under the Service Level Benchmarking program of Government of India. The
SLB data for water- sanitation represented here is gazetted by the Government of Gujarat at the end of each financial year (April-March). Data can be
viewed at www.pas.org.in. The Urban Management Centre (UMC) team has verified the data provided under the program with supporting documents
provided by respective local governments, however, no actual field level measurements have been carried out. No representation or warranty,
express or implied, is given by UMC of the accuracy of the information or data provided by ULBs.
1
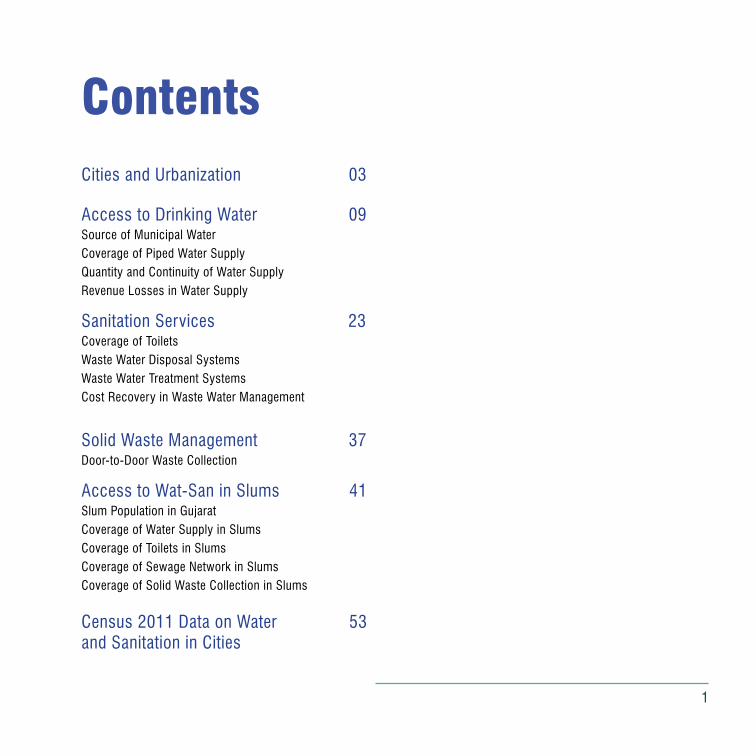
ContentsCities and Urbanization 03
Access to Drinking Water 09Source of Municipal Water Coverage of Piped Water Supply Quantity and Continuity of Water Supply Revenue Losses in Water Supply
Sanitation Services 23Coverage of Toilets Waste Water Disposal Systems Waste Water Treatment Systems Cost Recovery in Waste Water Management
Solid Waste Management 37Door-to-Door Waste Collection
Access to Wat-San in Slums 41Slum Population in Gujarat Coverage of Water Supply in Slums Coverage of Toilets in Slums Coverage of Sewage Network in Slums Coverage of Solid Waste Collection in Slums
Census 2011 Data on Water 53and Sanitation in Cities
2 Map Book I Water and Sanitation in Urban Gujarat, 2013
3
Cities and Urbanization
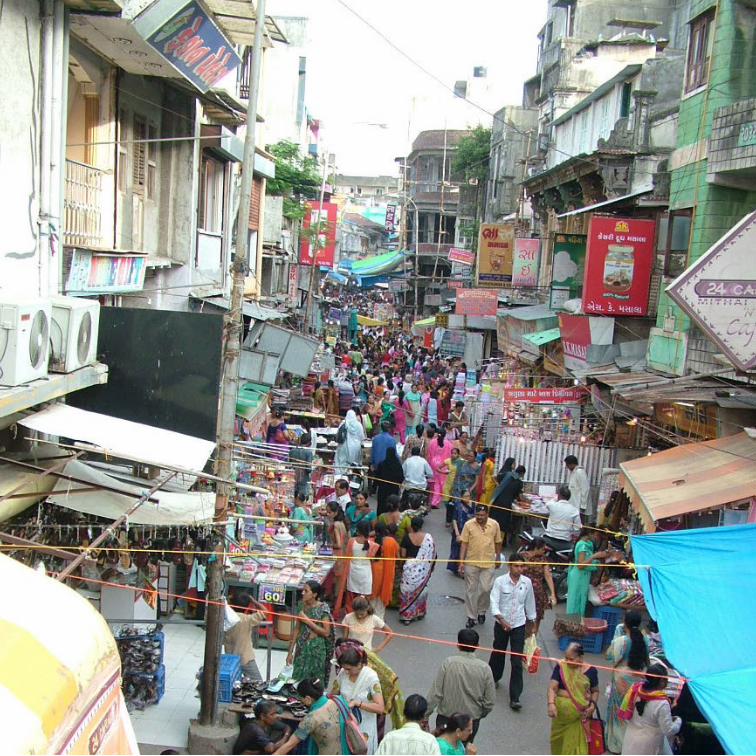
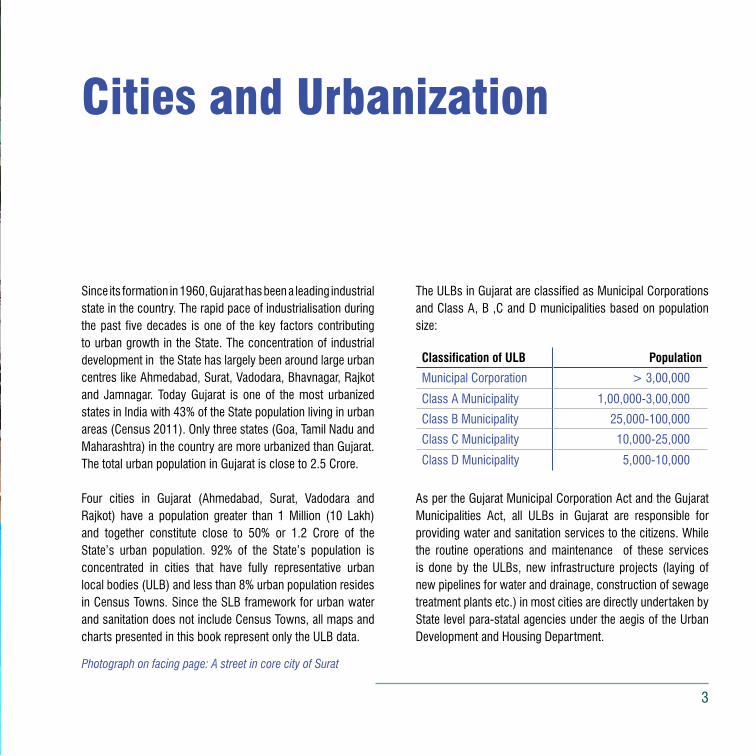
Since its formation in 1960, Gujarat has been a leading industrial state in the country. The rapid pace of industrialisation during the past five decades is one of the key factors contributing to urban growth in the State. The concentration of industrial development in the State has largely been around large urban centres like Ahmedabad, Surat, Vadodara, Bhavnagar, Rajkot and Jamnagar. Today Gujarat is one of the most urbanized states in India with 43% of the State population living in urban areas (Census 2011). Only three states (Goa, Tamil Nadu and Maharashtra) in the country are more urbanized than Gujarat. The total urban population in Gujarat is close to 2.5 Crore.
Four cities in Gujarat (Ahmedabad, Surat, Vadodara and Rajkot) have a population greater than 1 Million (10 Lakh) and together constitute close to 50% or 1.2 Crore of the State’s urban population. 92% of the State’s population is concentrated in cities that have fully representative urban local bodies (ULB) and less than 8% urban population resides in Census Towns. Since the SLB framework for urban water and sanitation does not include Census Towns, all maps and charts presented in this book represent only the ULB data.
The ULBs in Gujarat are classified as Municipal Corporations and Class A, B ,C and D municipalities based on population size:
As per the Gujarat Municipal Corporation Act and the Gujarat Municipalities Act, all ULBs in Gujarat are responsible for providing water and sanitation services to the citizens. While the routine operations and maintenance of these services is done by the ULBs, new infrastructure projects (laying of new pipelines for water and drainage, construction of sewage treatment plants etc.) in most cities are directly undertaken by State level para-statal agencies under the aegis of the Urban Development and Housing Department.
Photograph on facing page: A street in core city of Surat
Classification of ULB Population
Municipal Corporation > 3,00,000
Class A Municipality 1,00,000-3,00,000
Class B Municipality 25,000-100,000
Class C Municipality 10,000-25,000
Class D Municipality 5,000-10,000
4 Map Book I Water and Sanitation in Urban Gujarat, 2013
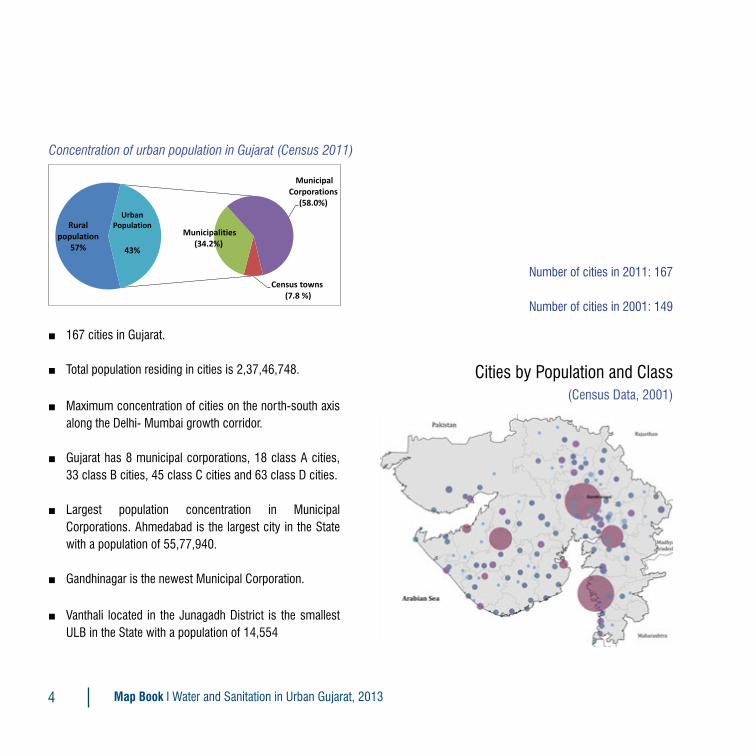
■ 167 cities in Gujarat.
■ Total population residing in cities is 2,37,46,748.
■ Maximum concentration of cities on the north-south axis along the Delhi- Mumbai growth corridor.
■ Gujarat has 8 municipal corporations, 18 class A cities, 33 class B cities, 45 class C cities and 63 class D cities.
■ Largest population concentration in Municipal Corporations. Ahmedabad is the largest city in the State with a population of 55,77,940.
■ Gandhinagar is the newest Municipal Corporation.
■ Vanthali located in the Junagadh District is the smallest ULB in the State with a population of 14,554
Number of cities in 2011: 167
Number of cities in 2001: 149
Rural population
57%
Census towns (7.8 %)
Municipalities (34.2%)
Municipal Corporations
(58.0%)
43%
Gujarat's Population Distribution
Urban Population
Cities by Population and Class(Census Data, 2001)
Concentration of urban population in Gujarat (Census 2011)
5
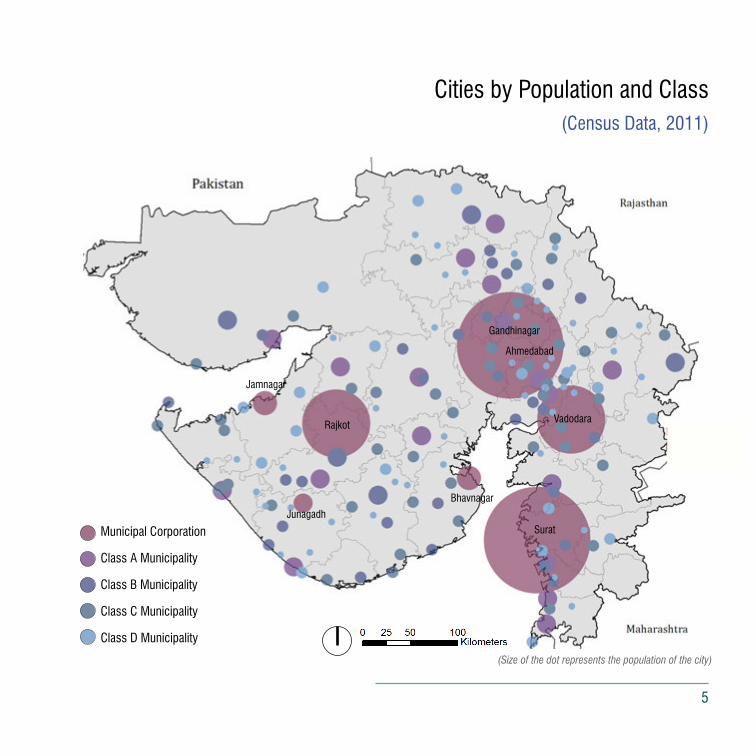
Cities by Population and Class(Census Data, 2011)
Municipal Corporation
Class A Municipality
Class B Municipality
Class C Municipality
Class D Municipality
(Size of the dot represents the population of the city)
Gandhinagar
Ahmedabad
Rajkot
Surat
Vadodara
Junagadh
Jamnagar
Bhavnagar

6 Map Book I Water and Sanitation in Urban Gujarat, 2013
■ 33 districts in Gujarat.
■ 7 new districts formed in 2012 (Aravalli, Banaskantha, Botad, Chhota Udaipur, Gir Somnath, Mahisagar, Devbhoomi Dwarka).
■ Ahmedabad and Surat districts are the most urbanized districts with more than 50% urban population followed by Vadodara and Rajkot.
■ Anand District has the largest number (11) of ULBs.
■ Districts in North Gujarat have the least number of people residing in cities.
■ Dangs District in South Gujarat is the only district in the
State with no urban population.
Affordable housing constructed under JNNURM in Vadodara Population distribution by district (Census 2011)
Other Districts 41%
Vadodara 8%
Rajkot 9%
Surat 19%
Ahmedabad 23%

7
< 10 %
No urban area
10-25 %
25-50 %
50-75 %
Population Residing in Cities by District (Census Data, 2011)
(The map reflects urban population residing only in cities)
8 Map Book I Water and Sanitation in Urban Gujarat, 2013
9
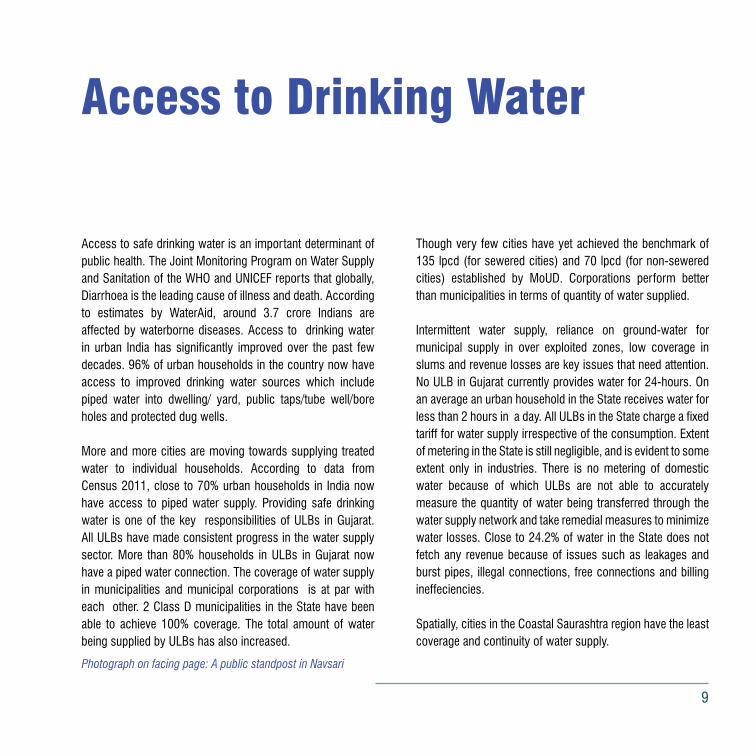
Access to safe drinking water is an important determinant of public health. The Joint Monitoring Program on Water Supply and Sanitation of the WHO and UNICEF reports that globally, Diarrhoea is the leading cause of illness and death. According to estimates by WaterAid, around 3.7 crore Indians are affected by waterborne diseases. Access to drinking water in urban India has significantly improved over the past few decades. 96% of urban households in the country now have access to improved drinking water sources which include piped water into dwelling/ yard, public taps/tube well/bore holes and protected dug wells.
More and more cities are moving towards supplying treated water to individual households. According to data from Census 2011, close to 70% urban households in India now have access to piped water supply. Providing safe drinking water is one of the key responsibilities of ULBs in Gujarat. All ULBs have made consistent progress in the water supply sector. More than 80% households in ULBs in Gujarat now have a piped water connection. The coverage of water supply in municipalities and municipal corporations is at par with each other. 2 Class D municipalities in the State have been able to achieve 100% coverage. The total amount of water being supplied by ULBs has also increased.
Though very few cities have yet achieved the benchmark of 135 lpcd (for sewered cities) and 70 lpcd (for non-sewered cities) established by MoUD. Corporations perform better than municipalities in terms of quantity of water supplied.
Intermittent water supply, reliance on ground-water for municipal supply in over exploited zones, low coverage in slums and revenue losses are key issues that need attention. No ULB in Gujarat currently provides water for 24-hours. On an average an urban household in the State receives water for less than 2 hours in a day. All ULBs in the State charge a fixed tariff for water supply irrespective of the consumption. Extent of metering in the State is still negligible, and is evident to some extent only in industries. There is no metering of domestic water because of which ULBs are not able to accurately measure the quantity of water being transferred through the water supply network and take remedial measures to minimize water losses. Close to 24.2% of water in the State does not fetch any revenue because of issues such as leakages and burst pipes, illegal connections, free connections and billing ineffeciencies.
Spatially, cities in the Coastal Saurashtra region have the least coverage and continuity of water supply.
Access to Drinking Water
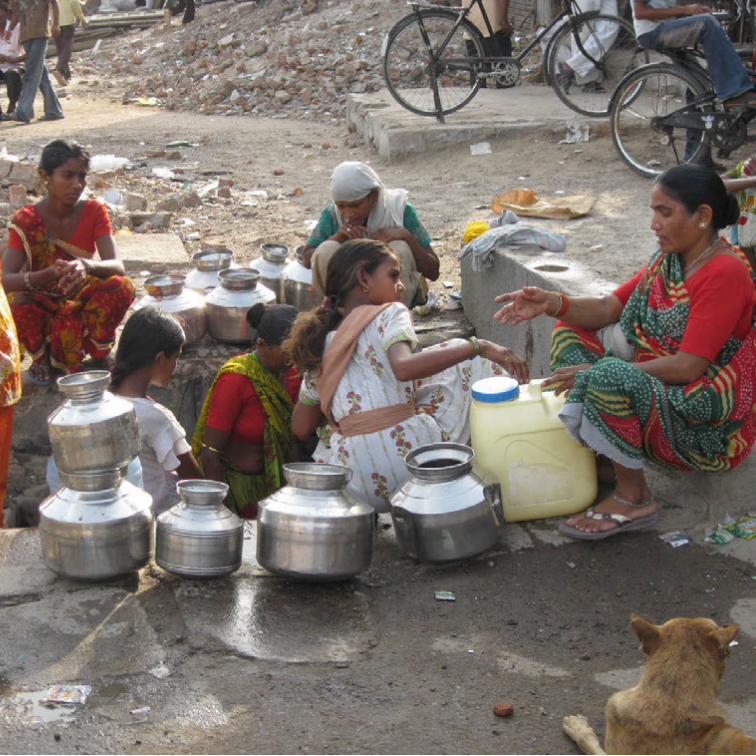
Photograph on facing page: A public standpost in Navsari
10 Map Book I Water and Sanitation in Urban Gujarat, 2013
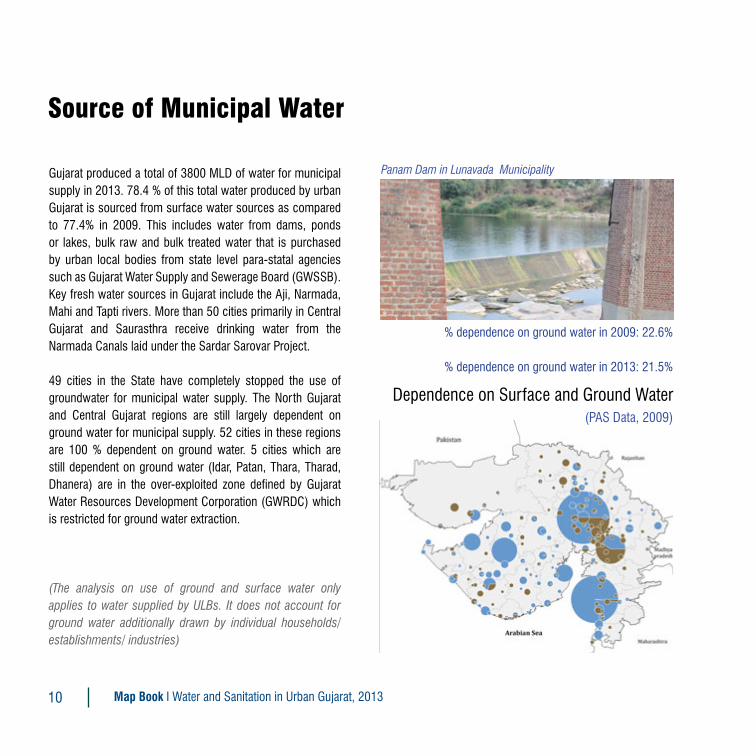
Gujarat produced a total of 3800 MLD of water for municipal supply in 2013. 78.4 % of this total water produced by urban Gujarat is sourced from surface water sources as compared to 77.4% in 2009. This includes water from dams, ponds or lakes, bulk raw and bulk treated water that is purchased by urban local bodies from state level para-statal agencies such as Gujarat Water Supply and Sewerage Board (GWSSB). Key fresh water sources in Gujarat include the Aji, Narmada, Mahi and Tapti rivers. More than 50 cities primarily in Central Gujarat and Saurasthra receive drinking water from the Narmada Canals laid under the Sardar Sarovar Project.
49 cities in the State have completely stopped the use of groundwater for municipal water supply. The North Gujarat and Central Gujarat regions are still largely dependent on ground water for municipal supply. 52 cities in these regions are 100 % dependent on ground water. 5 cities which are still dependent on ground water (Idar, Patan, Thara, Tharad, Dhanera) are in the over-exploited zone defined by Gujarat Water Resources Development Corporation (GWRDC) which is restricted for ground water extraction.
(The analysis on use of ground and surface water only applies to water supplied by ULBs. It does not account for ground water additionally drawn by individual households/ establishments/ industries)
Dependence on Surface and Ground Water(PAS Data, 2009)
Source of Municipal Water
% dependence on ground water in 2009: 22.6%
% dependence on ground water in 2013: 21.5%
Panam Dam in Lunavada Municipality
11
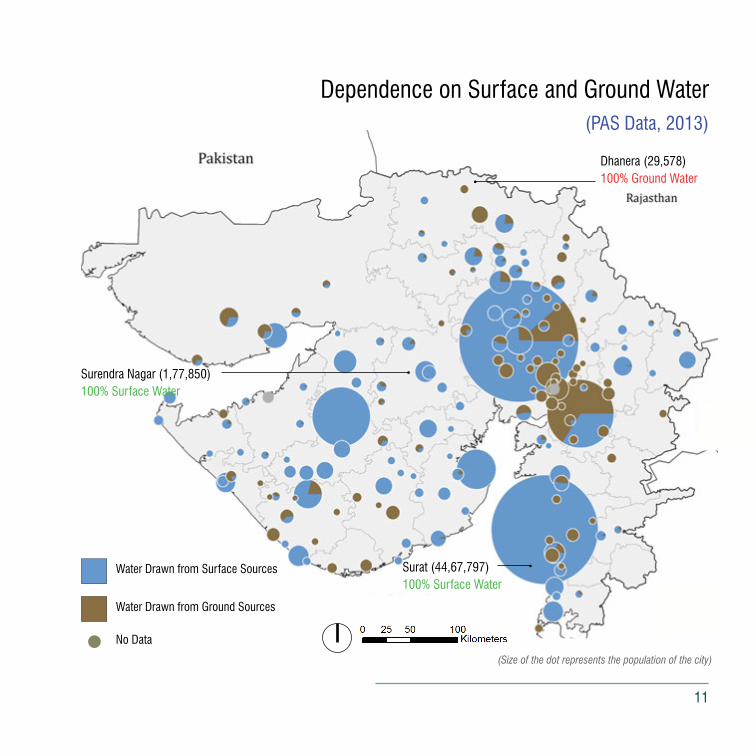
Dhanera (29,578)100% Ground Water
Surat (44,67,797)100% Surface Water
Surendra Nagar (1,77,850)100% Surface Water
Water Drawn from Surface Sources
Water Drawn from Ground Sources
No Data
Dependence on Surface and Ground Water(PAS Data, 2013)
(Size of the dot represents the population of the city)
12 Map Book I Water and Sanitation in Urban Gujarat, 2013
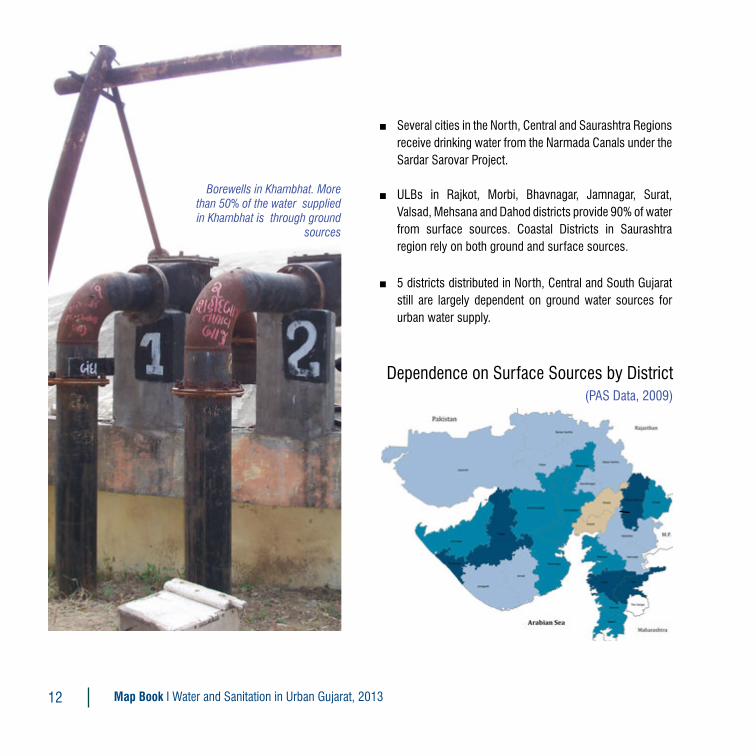
Dependence on Surface Sources by District (PAS Data, 2009)
Borewells in Khambhat. More than 50% of the water supplied in Khambhat is through ground
sources
■ Several cities in the North, Central and Saurashtra Regions receive drinking water from the Narmada Canals under the Sardar Sarovar Project.
■ ULBs in Rajkot, Morbi, Bhavnagar, Jamnagar, Surat, Valsad, Mehsana and Dahod districts provide 90% of water from surface sources. Coastal Districts in Saurashtra region rely on both ground and surface sources.
■ 5 districts distributed in North, Central and South Gujarat still are largely dependent on ground water sources for urban water supply.

13
0-30 %
0 %
No urban area
30-60 %
60-90 %
>90 %
Dependence on Surface Sources for Water Supply by District (PAS Data, 2013)
(The map reflects dependence on surface water in cities only)
14 Map Book I Water and Sanitation in Urban Gujarat, 2013
Coverage of Piped Water Supply
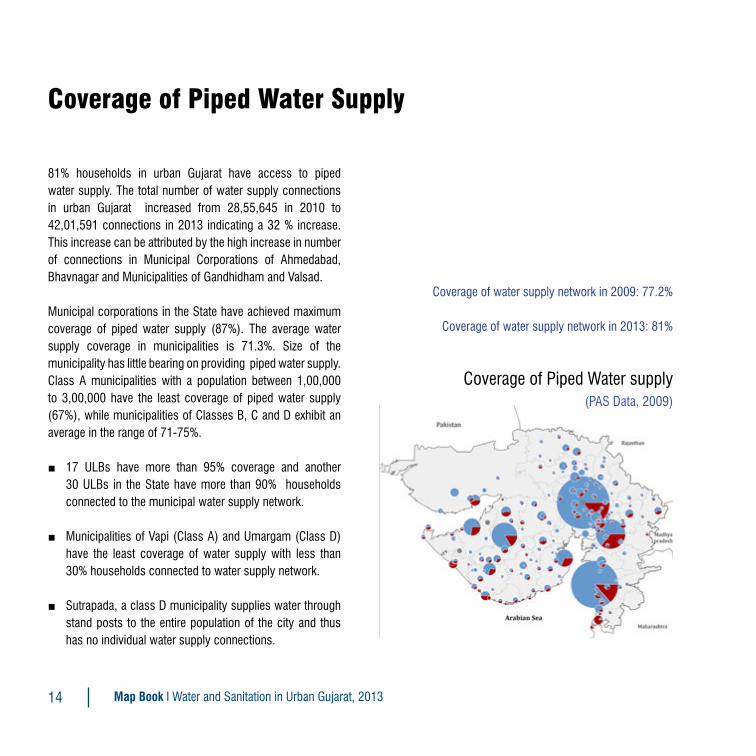
81% households in urban Gujarat have access to piped water supply. The total number of water supply connections in urban Gujarat increased from 28,55,645 in 2010 to 42,01,591 connections in 2013 indicating a 32 % increase. This increase can be attributed by the high increase in number of connections in Municipal Corporations of Ahmedabad, Bhavnagar and Municipalities of Gandhidham and Valsad.
Municipal corporations in the State have achieved maximum coverage of piped water supply (87%). The average water supply coverage in municipalities is 71.3%. Size of the municipality has little bearing on providing piped water supply. Class A municipalities with a population between 1,00,000 to 3,00,000 have the least coverage of piped water supply (67%), while municipalities of Classes B, C and D exhibit an average in the range of 71-75%.
■ 17 ULBs have more than 95% coverage and another 30 ULBs in the State have more than 90% households connected to the municipal water supply network.
■ Municipalities of Vapi (Class A) and Umargam (Class D) have the least coverage of water supply with less than 30% households connected to water supply network.
■ Sutrapada, a class D municipality supplies water through stand posts to the entire population of the city and thus has no individual water supply connections.
Coverage of Piped Water supply(PAS Data, 2009)
Coverage of water supply network in 2009: 77.2%
Coverage of water supply network in 2013: 81%
15
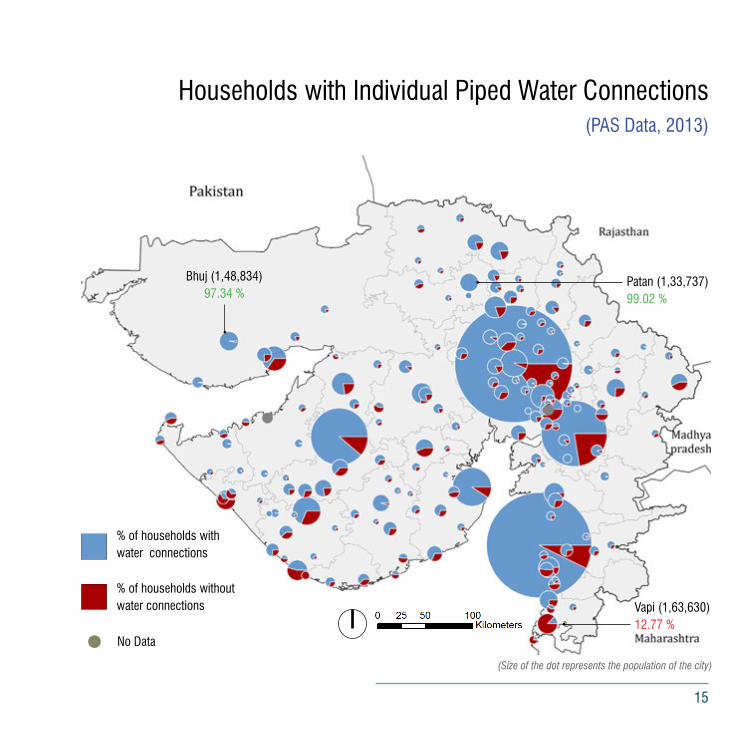
% of households withwater connections
% of households withoutwater connections
No Data
Bhuj (1,48,834)97.34 %
Patan (1,33,737)99.02 %
Vapi (1,63,630)12.77 %
Households with Individual Piped Water Connections(PAS Data, 2013)
(Size of the dot represents the population of the city)
16 Map Book I Water and Sanitation in Urban Gujarat, 2013
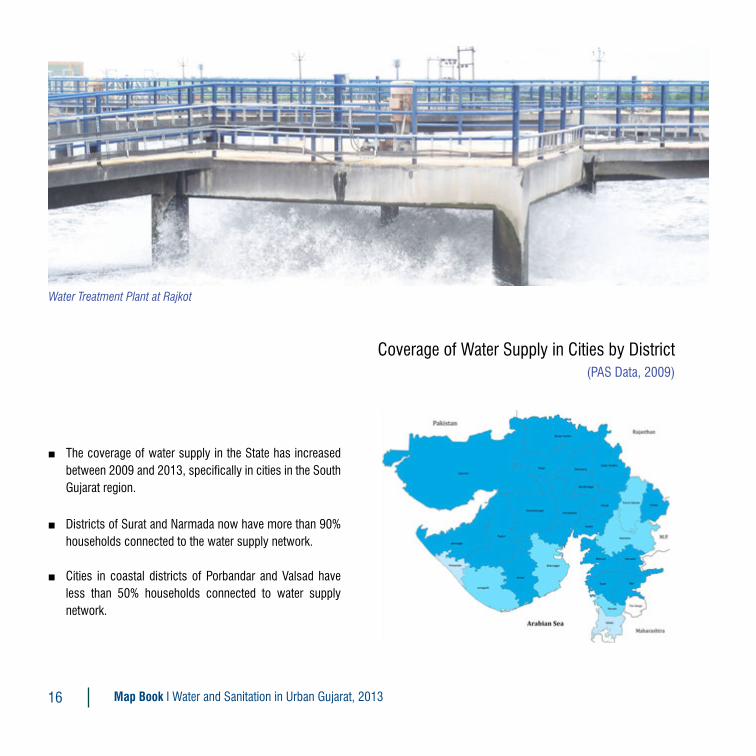
Coverage of Water Supply in Cities by District(PAS Data, 2009)
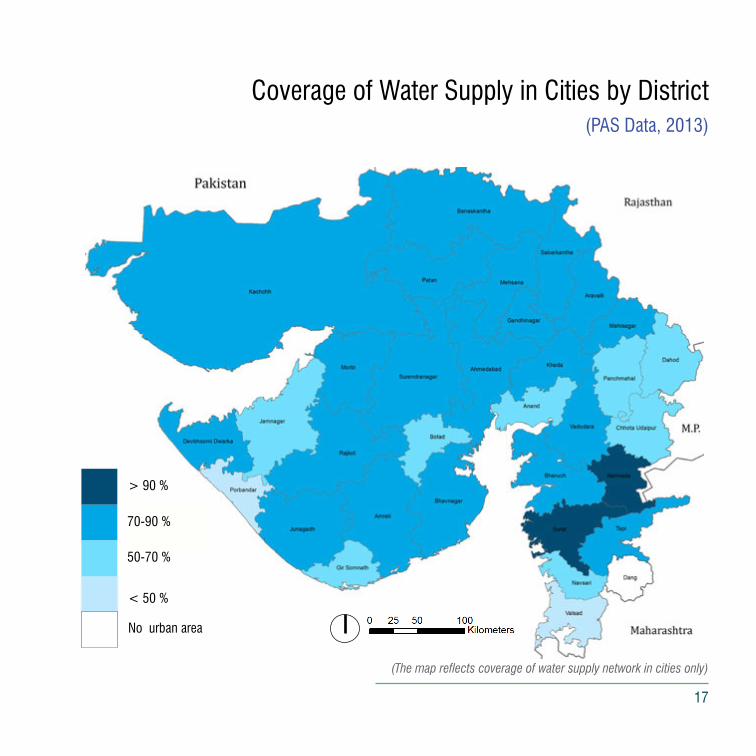
■ The coverage of water supply in the State has increased between 2009 and 2013, specifically in cities in the South Gujarat region.
■ Districts of Surat and Narmada now have more than 90% households connected to the water supply network.
■ Cities in coastal districts of Porbandar and Valsad have less than 50% households connected to water supply network.
Water Treatment Plant at Rajkot
17
< 50 %
No urban area
50-70 %
70-90 %
> 90 %
Coverage of Water Supply in Cities by District(PAS Data, 2013)
(The map reflects coverage of water supply network in cities only)
18 Map Book I Water and Sanitation in Urban Gujarat, 2013
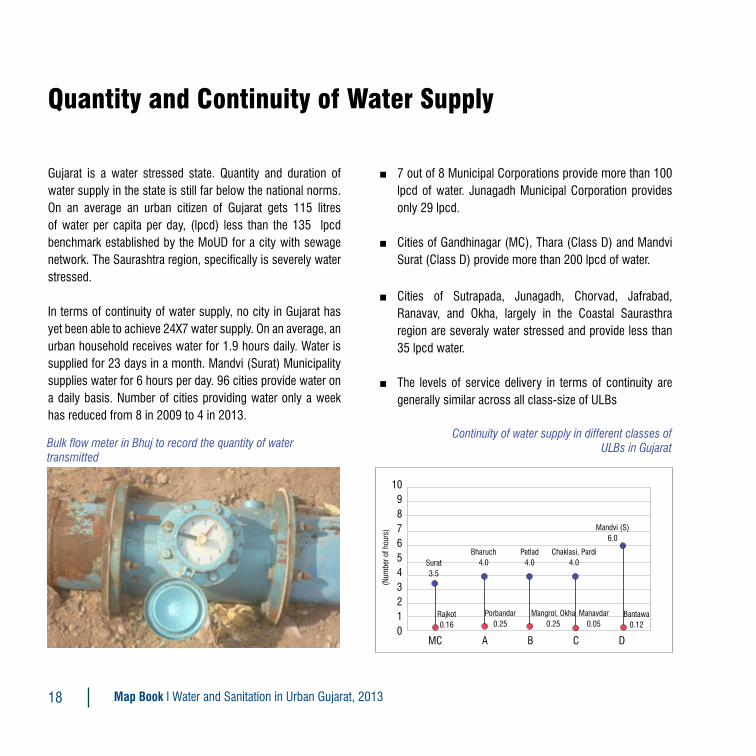
Gujarat is a water stressed state. Quantity and duration of water supply in the state is still far below the national norms. On an average an urban citizen of Gujarat gets 115 litres of water per capita per day, (lpcd) less than the 135 lpcd benchmark established by the MoUD for a city with sewage network. The Saurashtra region, specifically is severely water stressed.
In terms of continuity of water supply, no city in Gujarat has yet been able to achieve 24X7 water supply. On an average, an urban household receives water for 1.9 hours daily. Water is supplied for 23 days in a month. Mandvi (Surat) Municipality supplies water for 6 hours per day. 96 cities provide water on a daily basis. Number of cities providing water only a week has reduced from 8 in 2009 to 4 in 2013.
Quantity and Continuity of Water Supply
■ 7 out of 8 Municipal Corporations provide more than 100 lpcd of water. Junagadh Municipal Corporation provides only 29 lpcd.
■ Cities of Gandhinagar (MC), Thara (Class D) and Mandvi Surat (Class D) provide more than 200 lpcd of water.
■ Cities of Sutrapada, Junagadh, Chorvad, Jafrabad, Ranavav, and Okha, largely in the Coastal Saurasthra region are severaly water stressed and provide less than 35 lpcd water.
■ The levels of service delivery in terms of continuity are generally similar across all class-size of ULBs
Continuity of water supply in different classes of ULBs in GujaratBulk flow meter in Bhuj to record the quantity of water
transmitted
109876543210
MC A B C D
(Num
ber o
f hou
rs)
Surat3.5
Rajkot0.16
Porbandar0.25
Mangrol, Okha0.25
Manavdar0.05
Bantawa0.12
Bharuch4.0
Petlad4.0
Chaklasi, Pardi4.0
Mandvi (S)6.0
19
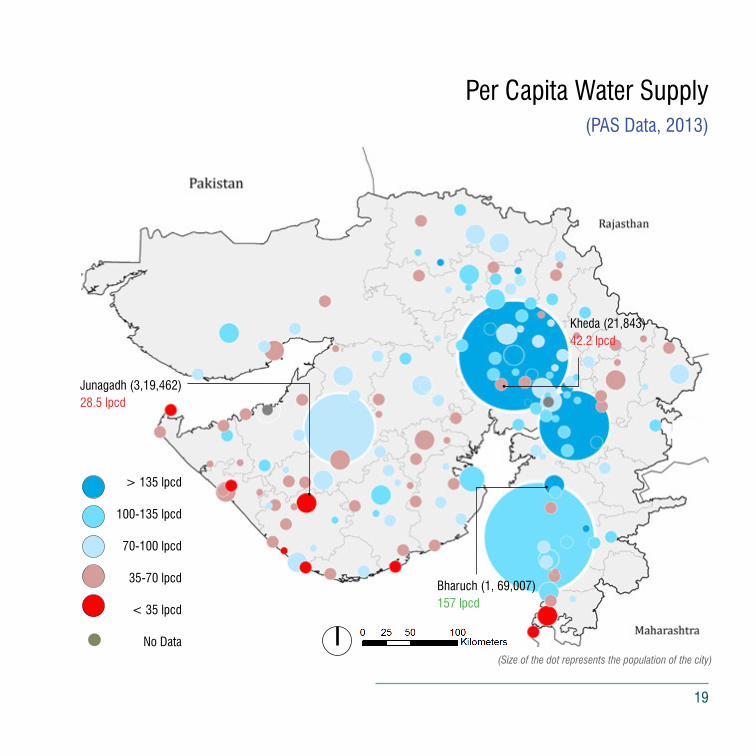
Per Capita Water Supply(PAS Data, 2013)
> 135 lpcd
100-135 lpcd
70-100 lpcd
35-70 lpcd
< 35 lpcd
No Data(Size of the dot represents the population of the city)
Junagadh (3,19,462)28.5 lpcd
Kheda (21,843)42.2 lpcd
Bharuch (1, 69,007)157 lpcd

20 Map Book I Water and Sanitation in Urban Gujarat, 2013
Revenue Losses in Water Supply
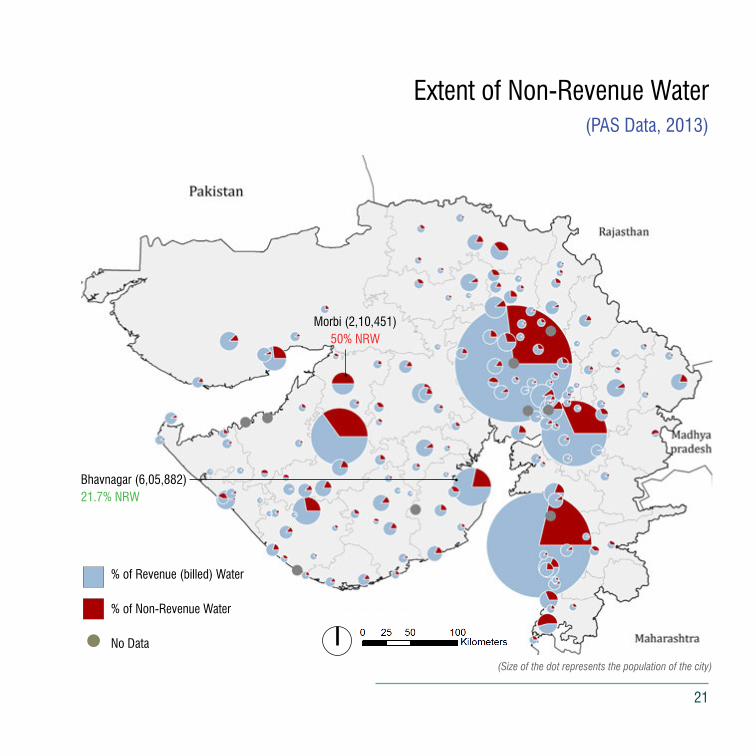
Non-Revenue Water (NRW) is the percentage of total water produced that is does not fetch the ULB any revenues. Such losses may be caused because of leaking and burst pipes, illegal connections, free connections and billing inefficiencies. A decreasing trend in NRW has been observed in Gujarat over the last four to five years , however close to 25% of water produced by cities still does not fetch any revenue. Identifying and regularising illegal connections and proactive leakage detection and management are important steps towards decreasing revenue losses in water supply.
Municipalities such as Gondal, Vijapur have taken initiatives in the past to legalize water connections by organizing door-to-door inspection drives. Minimizing revenue losses in water supply is key to improving cost recovery.
Cost recovery is defined as the total operating revenues expressed as percentage of the total operating expenses incurred. On an average, ULBs in Gujarat were only able to recover 51% of the expenses incurred for water supply in 2013. Corporations reported only 37.3% recovery, municipalities fared much better with a cost recovery of 67.8%.
■ 24.2% of total water produced in the State is Non-Revenue Water
■ 107 cities in the State have reported less than 25% NRW
■ More than 50% of the water produced in the cities of Chhota Udaipur (Class D), Vapi (Class A) and Morbi (Class A) does not fetch any revenue.
Leakages in Main Trunk Line in Dhandhuka Municipality
21
% of Revenue (billed) Water
% of Non-Revenue Water
No Data
Extent of Non-Revenue Water (PAS Data, 2013)
(Size of the dot represents the population of the city)
Morbi (2,10,451)50% NRW
Bhavnagar (6,05,882)21.7% NRW
22 Map Book I Water and Sanitation in Urban Gujarat, 2013
23
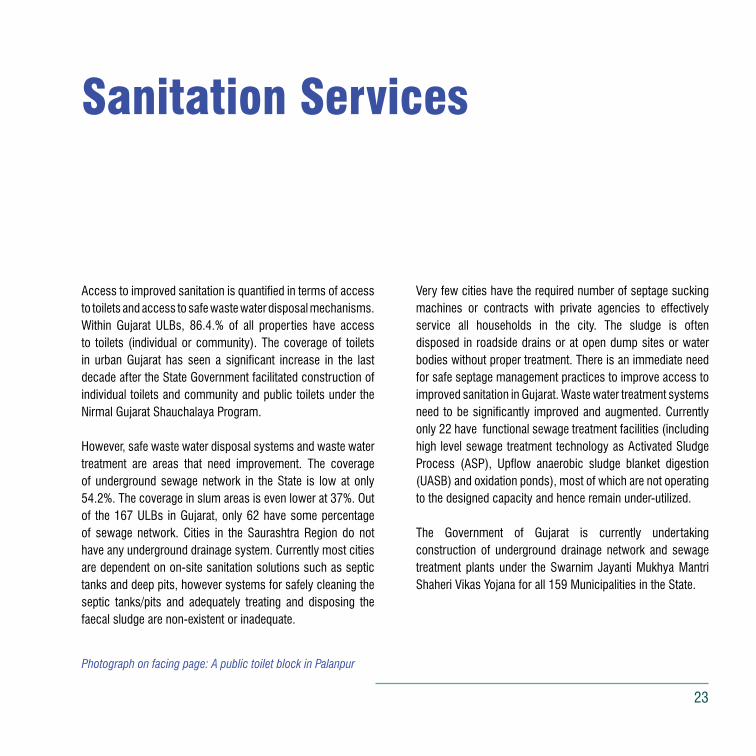
Access to improved sanitation is quantified in terms of access to toilets and access to safe waste water disposal mechanisms. Within Gujarat ULBs, 86.4.% of all properties have access to toilets (individual or community). The coverage of toilets in urban Gujarat has seen a significant increase in the last decade after the State Government facilitated construction of individual toilets and community and public toilets under the Nirmal Gujarat Shauchalaya Program.
However, safe waste water disposal systems and waste water treatment are areas that need improvement. The coverage of underground sewage network in the State is low at only 54.2%. The coverage in slum areas is even lower at 37%. Out of the 167 ULBs in Gujarat, only 62 have some percentage of sewage network. Cities in the Saurashtra Region do not have any underground drainage system. Currently most cities are dependent on on-site sanitation solutions such as septic tanks and deep pits, however systems for safely cleaning the septic tanks/pits and adequately treating and disposing the faecal sludge are non-existent or inadequate.
Very few cities have the required number of septage sucking machines or contracts with private agencies to effectively service all households in the city. The sludge is often disposed in roadside drains or at open dump sites or water bodies without proper treatment. There is an immediate need for safe septage management practices to improve access to improved sanitation in Gujarat. Waste water treatment systems need to be significantly improved and augmented. Currently only 22 have functional sewage treatment facilities (including high level sewage treatment technology as Activated Sludge Process (ASP), Upflow anaerobic sludge blanket digestion (UASB) and oxidation ponds), most of which are not operating to the designed capacity and hence remain under-utilized.
The Government of Gujarat is currently undertaking construction of underground drainage network and sewage treatment plants under the Swarnim Jayanti Mukhya Mantri Shaheri Vikas Yojana for all 159 Municipalities in the State.
Sanitation Services
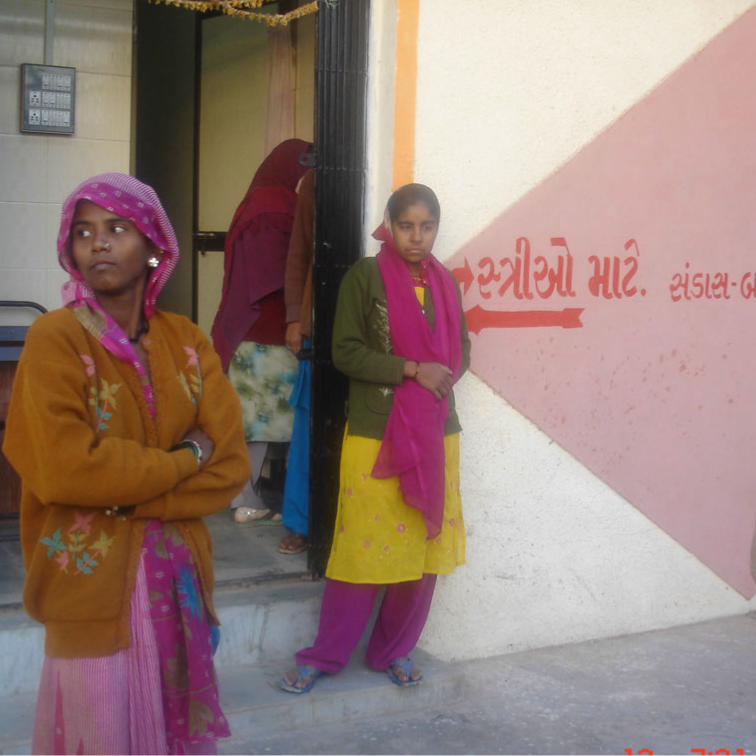
Photograph on facing page: A public toilet block in Palanpur
24 Map Book I Water and Sanitation in Urban Gujarat, 2013
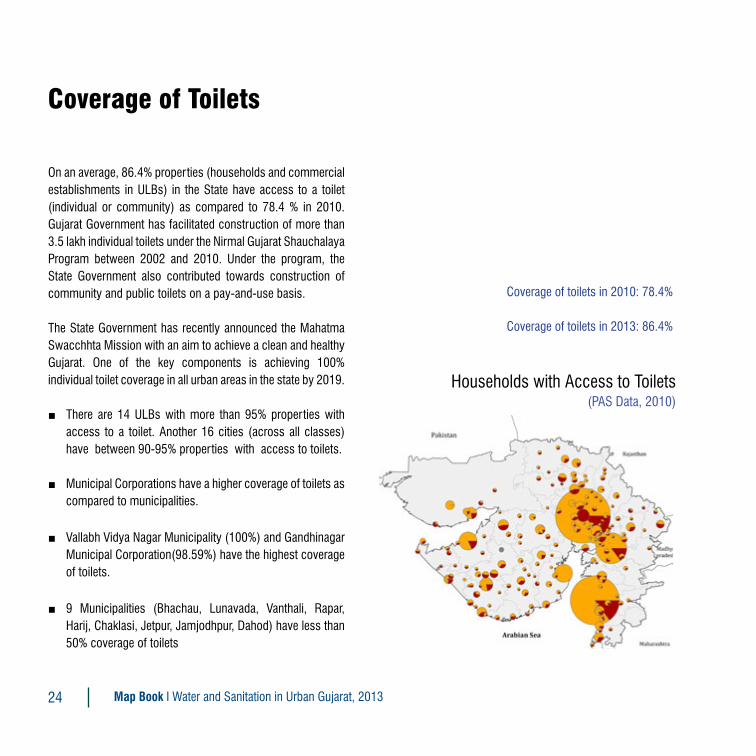
Coverage of Toilets
Households with Access to Toilets(PAS Data, 2010)
Coverage of toilets in 2010: 78.4%
Coverage of toilets in 2013: 86.4%
On an average, 86.4% properties (households and commercial establishments in ULBs) in the State have access to a toilet (individual or community) as compared to 78.4 % in 2010. Gujarat Government has facilitated construction of more than 3.5 lakh individual toilets under the Nirmal Gujarat Shauchalaya Program between 2002 and 2010. Under the program, the State Government also contributed towards construction of community and public toilets on a pay-and-use basis.
The State Government has recently announced the Mahatma Swacchhta Mission with an aim to achieve a clean and healthy Gujarat. One of the key components is achieving 100% individual toilet coverage in all urban areas in the state by 2019.
■ There are 14 ULBs with more than 95% properties with access to a toilet. Another 16 cities (across all classes) have between 90-95% properties with access to toilets.
■ Municipal Corporations have a higher coverage of toilets as compared to municipalities.
■ Vallabh Vidya Nagar Municipality (100%) and Gandhinagar Municipal Corporation(98.59%) have the highest coverage of toilets.
■ 9 Municipalities (Bhachau, Lunavada, Vanthali, Rapar, Harij, Chaklasi, Jetpur, Jamjodhpur, Dahod) have less than 50% coverage of toilets
25
% of properties with accessto toilets
% of properties without access to toilets
No Data
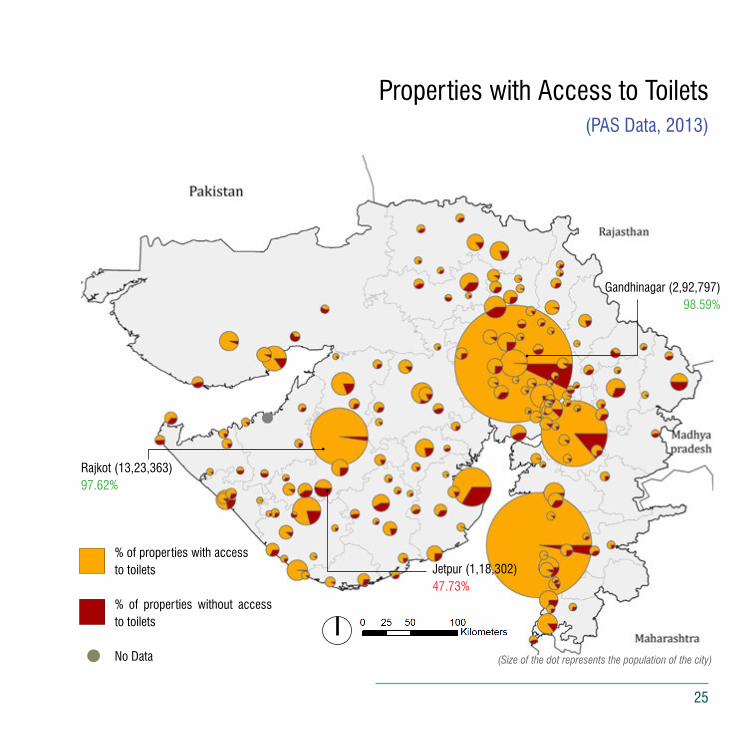
Properties with Access to Toilets (PAS Data, 2013)
Rajkot (13,23,363)97.62%
Gandhinagar (2,92,797)98.59%
Jetpur (1,18,302)47.73%
(Size of the dot represents the population of the city)

26 Map Book I Water and Sanitation in Urban Gujarat, 2013
■ Central and South Gujarat regions have the highest coverage of toilets.
■ Cities in the districts of Surat, Ahmedabad and Gir Somnath are best performing with more than 90% housholds with individual toilets.
■ Cities in the tribal districts of Chota Udaipur, Panchmahal and Dahod are the worst performing with an average of 55% toilet coverage.
Coverage of Toilets in Cities by District(PAS Data, 2010)
An individual toilet in a slum in Patan, constructed under the Nirmal Gujarat Program

27
No urban area
< 70 %
70-80 %
80-90 %
> 90 %
Coverage of Toilets by District (PAS Data, 2013)
(The map reflects coverage of toilets in cities only)
28 Map Book I Water and Sanitation in Urban Gujarat, 2013
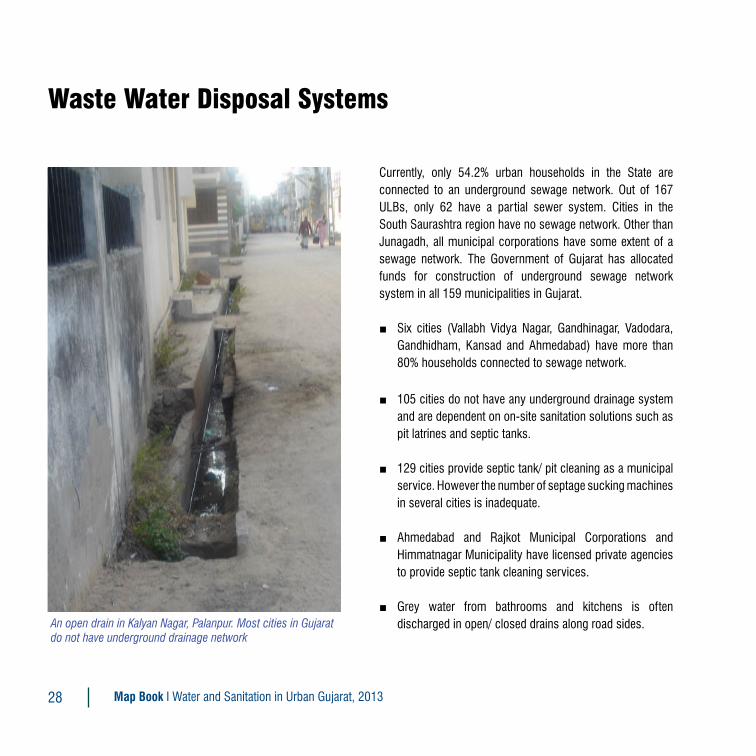
Currently, only 54.2% urban households in the State are connected to an underground sewage network. Out of 167 ULBs, only 62 have a partial sewer system. Cities in the South Saurashtra region have no sewage network. Other than Junagadh, all municipal corporations have some extent of a sewage network. The Government of Gujarat has allocated funds for construction of underground sewage network system in all 159 municipalities in Gujarat.
■ Six cities (Vallabh Vidya Nagar, Gandhinagar, Vadodara, Gandhidham, Kansad and Ahmedabad) have more than 80% households connected to sewage network.
■ 105 cities do not have any underground drainage system and are dependent on on-site sanitation solutions such as pit latrines and septic tanks.
■ 129 cities provide septic tank/ pit cleaning as a municipal service. However the number of septage sucking machines in several cities is inadequate.
■ Ahmedabad and Rajkot Municipal Corporations and Himmatnagar Municipality have licensed private agencies to provide septic tank cleaning services.
■ Grey water from bathrooms and kitchens is often discharged in open/ closed drains along road sides.An open drain in Kalyan Nagar, Palanpur. Most cities in Gujarat
do not have underground drainage network
Waste Water Disposal Systems
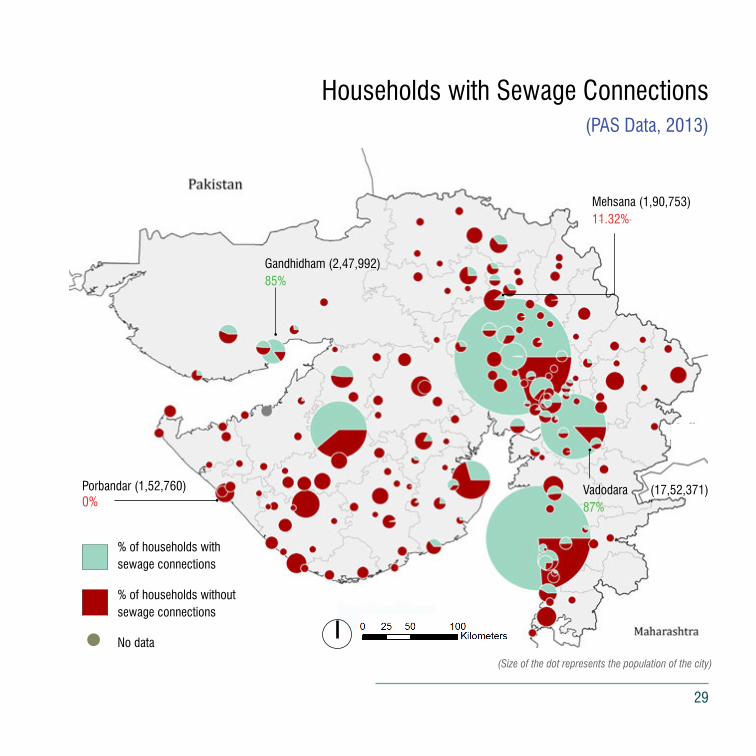
29
% of households withsewage connections
% of households withoutsewage connections
No data
Vadodara (17,52,371)87%
Gandhidham (2,47,992)85%
Porbandar (1,52,760)0%
Households with Sewage Connections (PAS Data, 2013)
(Size of the dot represents the population of the city)
Mehsana (1,90,753)11.32%
30 Map Book I Water and Sanitation in Urban Gujarat, 2013
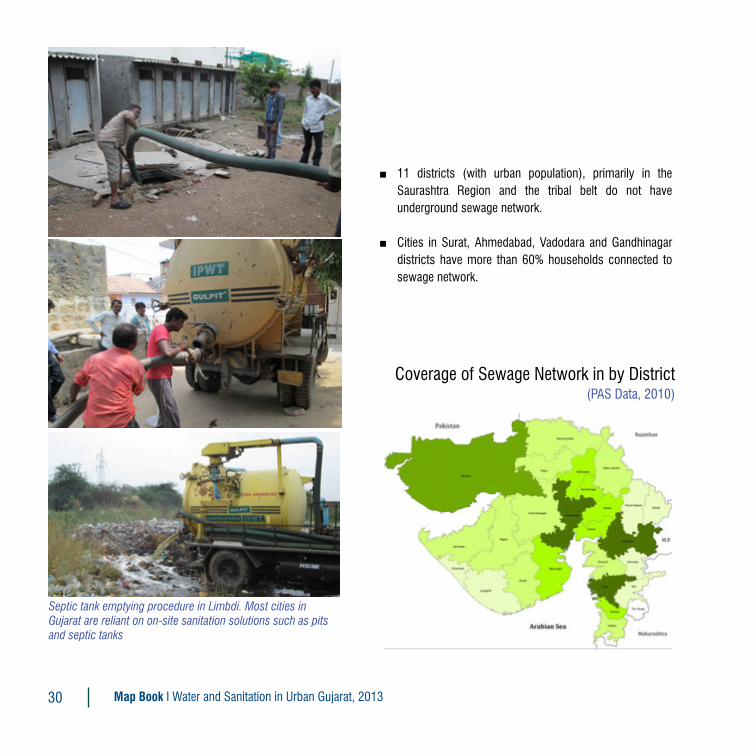
Coverage of Sewage Network in by District(PAS Data, 2010)
Septic tank emptying procedure in Limbdi. Most cities in Gujarat are reliant on on-site sanitation solutions such as pits and septic tanks
■ 11 districts (with urban population), primarily in the Saurashtra Region and the tribal belt do not have underground sewage network.
■ Cities in Surat, Ahmedabad, Vadodara and Gandhinagar districts have more than 60% households connected to sewage network.

31
No urban area
< 20 %
No sewage network
20-40 %
40-60 %
60-85 %
Coverage of Sewage Network in ULBs by District (PAS Data, 2013)
(The map reflects coverage of sewage network in cities only)
32 Map Book I Water and Sanitation in Urban Gujarat, 2013
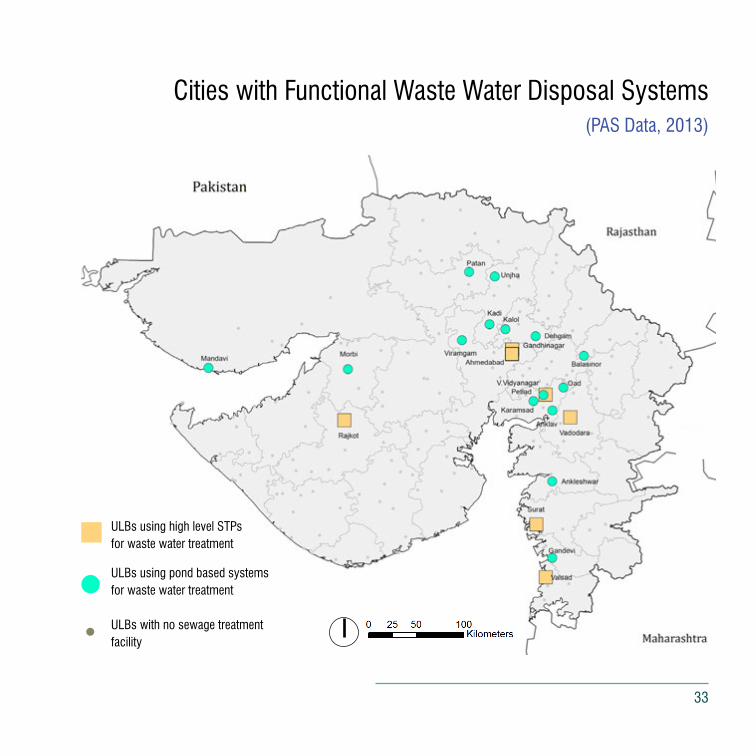
Waste Water Treatment Systems
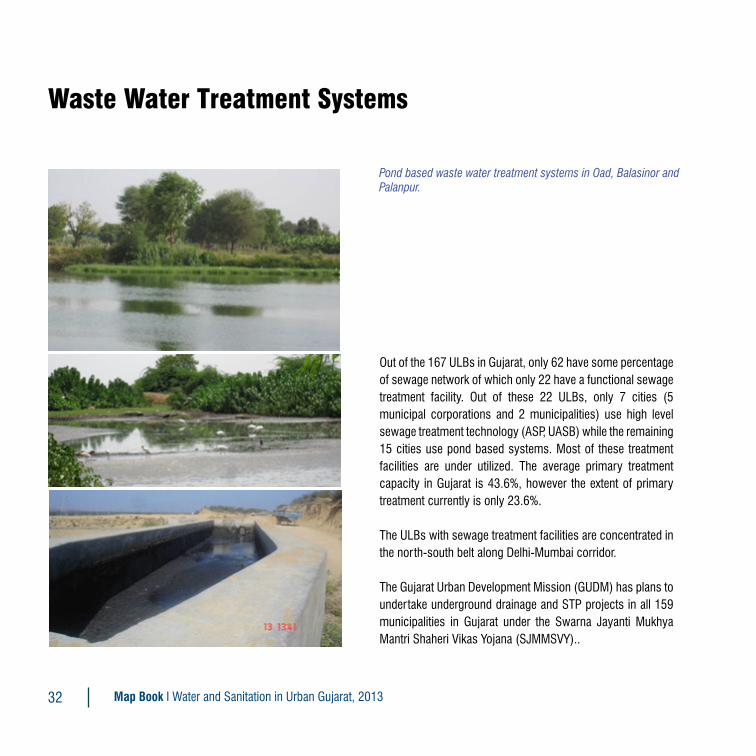
Out of the 167 ULBs in Gujarat, only 62 have some percentage of sewage network of which only 22 have a functional sewage treatment facility. Out of these 22 ULBs, only 7 cities (5 municipal corporations and 2 municipalities) use high level sewage treatment technology (ASP, UASB) while the remaining 15 cities use pond based systems. Most of these treatment facilities are under utilized. The average primary treatment capacity in Gujarat is 43.6%, however the extent of primary treatment currently is only 23.6%.
The ULBs with sewage treatment facilities are concentrated in the north-south belt along Delhi-Mumbai corridor.
The Gujarat Urban Development Mission (GUDM) has plans to undertake underground drainage and STP projects in all 159 municipalities in Gujarat under the Swarna Jayanti Mukhya Mantri Shaheri Vikas Yojana (SJMMSVY)..
Pond based waste water treatment systems in Oad, Balasinor and Palanpur.
33
Cities with Functional Waste Water Disposal Systems (PAS Data, 2013)
ULBs using high level STPsfor waste water treatment
ULBs using pond based systems for waste water treatment
ULBs with no sewage treatment facility
34 Map Book I Water and Sanitation in Urban Gujarat, 2013
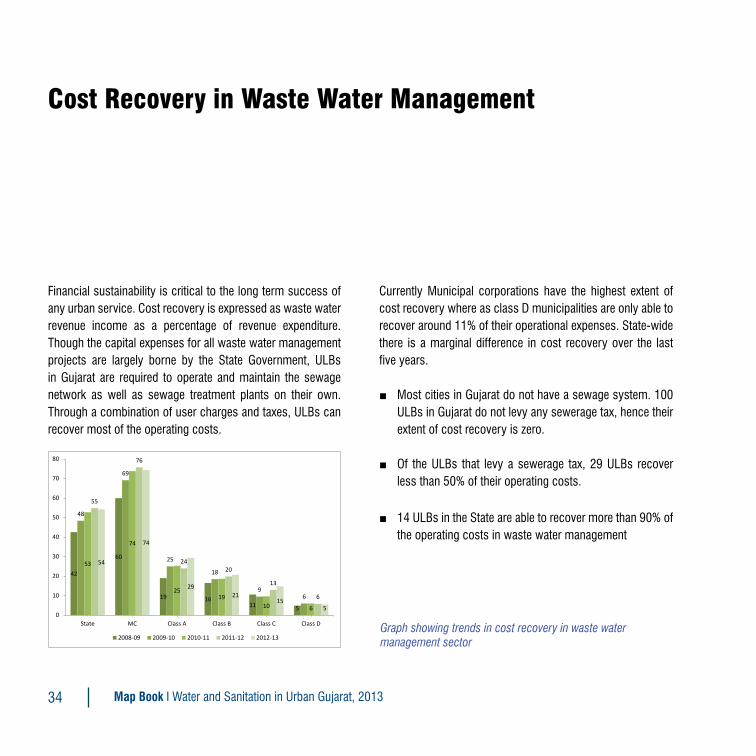
Cost Recovery in Waste Water Management
Financial sustainability is critical to the long term success of any urban service. Cost recovery is expressed as waste water revenue income as a percentage of revenue expenditure. Though the capital expenses for all waste water management projects are largely borne by the State Government, ULBs in Gujarat are required to operate and maintain the sewage network as well as sewage treatment plants on their own. Through a combination of user charges and taxes, ULBs can recover most of the operating costs.
Currently Municipal corporations have the highest extent of cost recovery where as class D municipalities are only able to recover around 11% of their operational expenses. State-wide there is a marginal difference in cost recovery over the last five years.
■ Most cities in Gujarat do not have a sewage system. 100 ULBs in Gujarat do not levy any sewerage tax, hence their extent of cost recovery is zero.
■ Of the ULBs that levy a sewerage tax, 29 ULBs recover less than 50% of their operating costs.
■ 14 ULBs in the State are able to recover more than 90% of the operating costs in waste water management
Graph showing trends in cost recovery in waste water management sector
42
60
19 16 11 5
48
69
25
18
9 6
53
74
25 19
10 6
55
76
24 20
13
6
54
74
29 21
15 5
0
10
20
30
40
50
60
70
80
State MC Class A Class B Class C Class D
2008-09 2009-10 2010-11 2011-12 2012-13
35
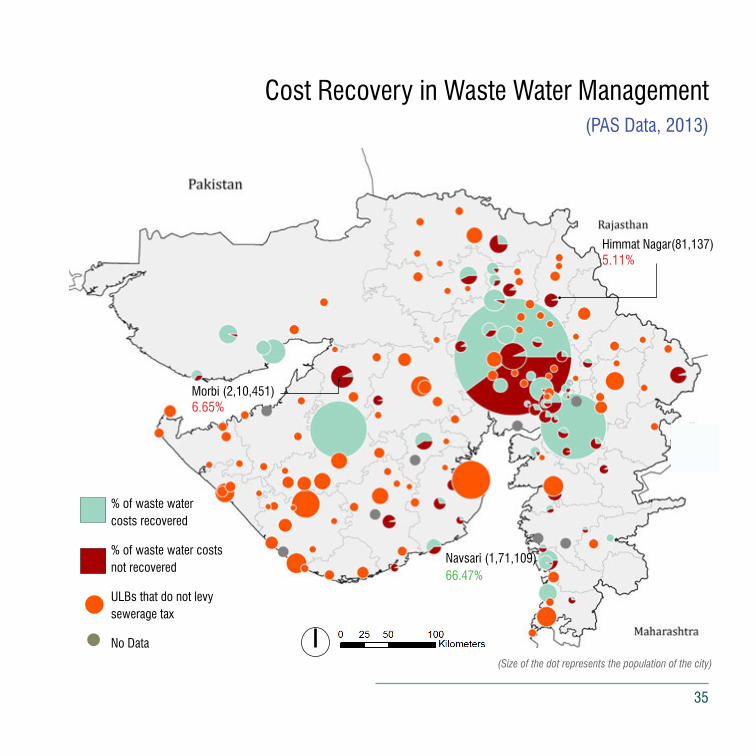
Cost Recovery in Waste Water Management(PAS Data, 2013)
% of waste watercosts recovered
% of waste water costsnot recovered
ULBs that do not levy sewerage tax
No Data
(Size of the dot represents the population of the city)
Himmat Nagar(81,137)5.11%
Morbi (2,10,451)6.65%
Navsari (1,71,109)66.47%
36 Map Book I Water and Sanitation in Urban Gujarat, 2013
37
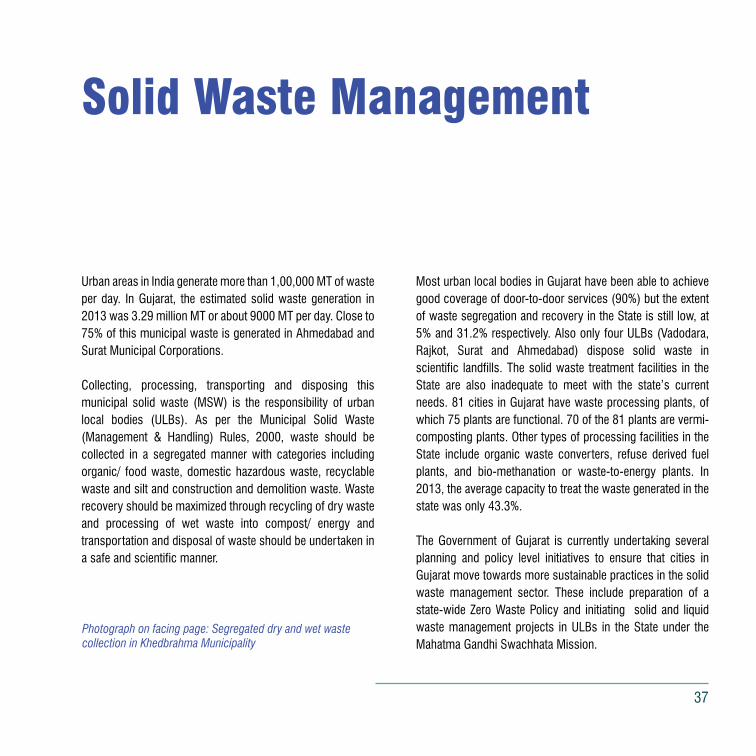
Urban areas in India generate more than 1,00,000 MT of waste per day. In Gujarat, the estimated solid waste generation in 2013 was 3.29 million MT or about 9000 MT per day. Close to 75% of this municipal waste is generated in Ahmedabad and Surat Municipal Corporations.
Collecting, processing, transporting and disposing this municipal solid waste (MSW) is the responsibility of urban local bodies (ULBs). As per the Municipal Solid Waste (Management & Handling) Rules, 2000, waste should be collected in a segregated manner with categories including organic/ food waste, domestic hazardous waste, recyclable waste and silt and construction and demolition waste. Waste recovery should be maximized through recycling of dry waste and processing of wet waste into compost/ energy and transportation and disposal of waste should be undertaken in a safe and scientific manner.
Most urban local bodies in Gujarat have been able to achieve good coverage of door-to-door services (90%) but the extent of waste segregation and recovery in the State is still low, at 5% and 31.2% respectively. Also only four ULBs (Vadodara, Rajkot, Surat and Ahmedabad) dispose solid waste in scientific landfills. The solid waste treatment facilities in the State are also inadequate to meet with the state’s current needs. 81 cities in Gujarat have waste processing plants, of which 75 plants are functional. 70 of the 81 plants are vermi-composting plants. Other types of processing facilities in the State include organic waste converters, refuse derived fuel plants, and bio-methanation or waste-to-energy plants. In 2013, the average capacity to treat the waste generated in the state was only 43.3%.
The Government of Gujarat is currently undertaking several planning and policy level initiatives to ensure that cities in Gujarat move towards more sustainable practices in the solid waste management sector. These include preparation of a state-wide Zero Waste Policy and initiating solid and liquid waste management projects in ULBs in the State under the Mahatma Gandhi Swachhata Mission.
Solid Waste Management
Photograph on facing page: Segregated dry and wet waste collection in Khedbrahma Municipality
38 Map Book I Water and Sanitation in Urban Gujarat, 2013
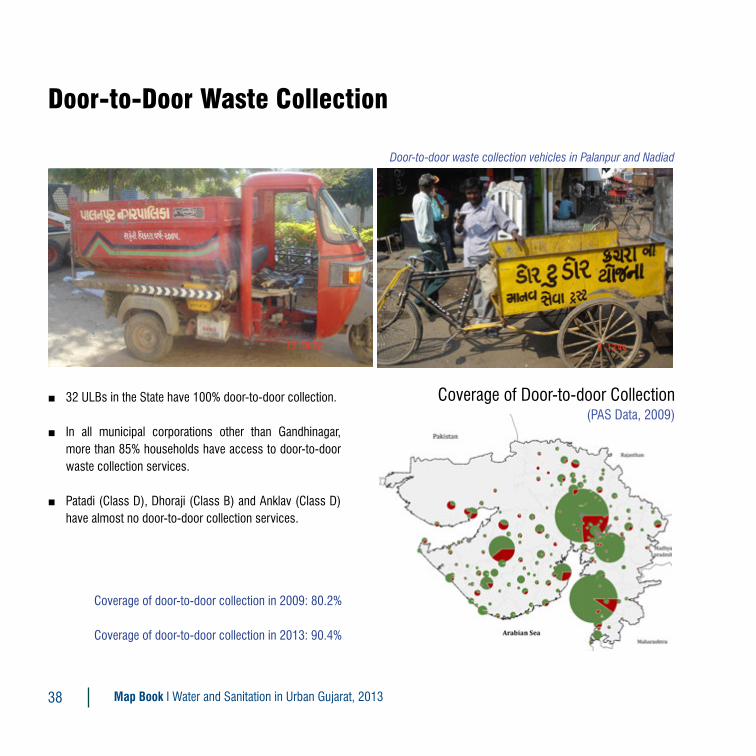
Coverage of Door-to-door Collection(PAS Data, 2009)
Door-to-Door Waste Collection
Coverage of door-to-door collection in 2009: 80.2%
Coverage of door-to-door collection in 2013: 90.4%
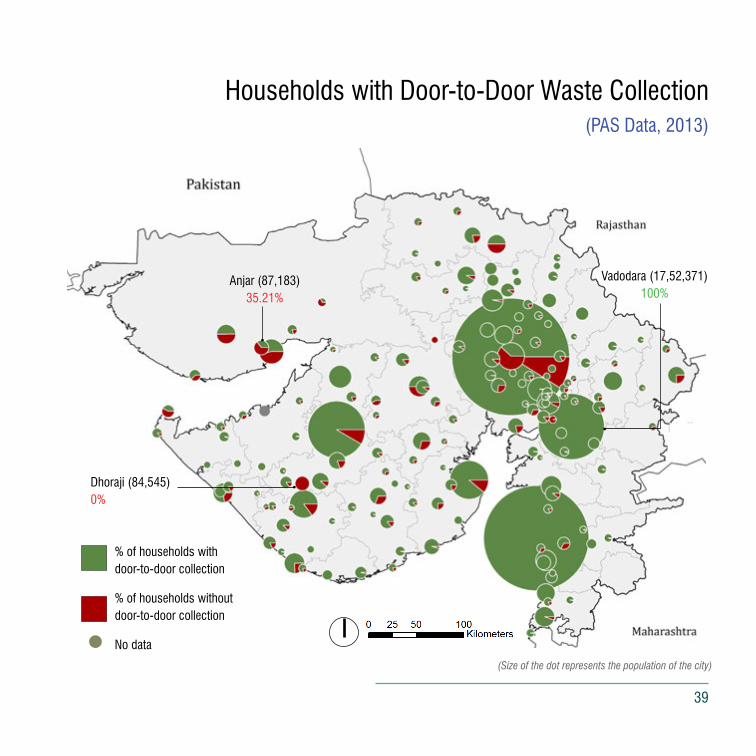
■ 32 ULBs in the State have 100% door-to-door collection.
■ In all municipal corporations other than Gandhinagar, more than 85% households have access to door-to-door waste collection services.
■ Patadi (Class D), Dhoraji (Class B) and Anklav (Class D) have almost no door-to-door collection services.
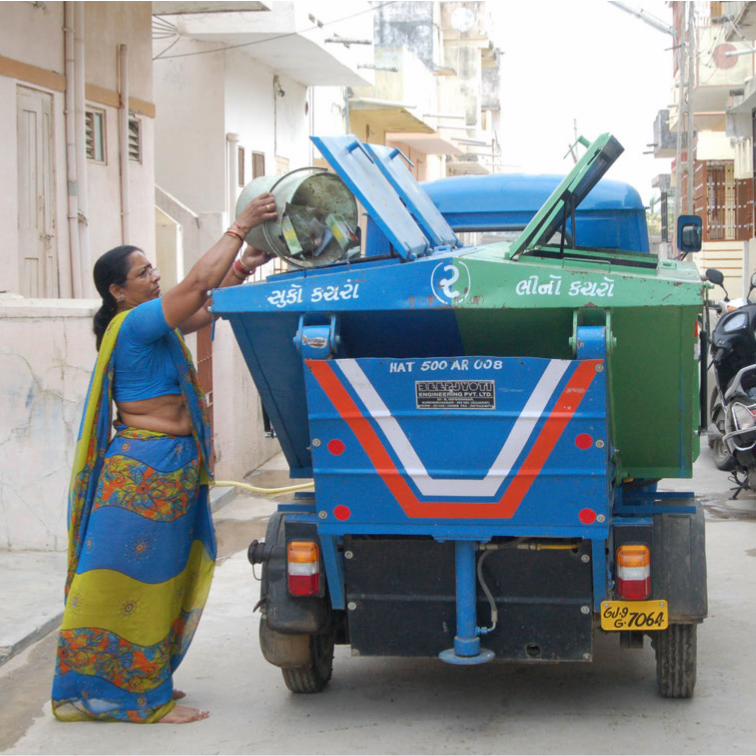
Door-to-door waste collection in Dehgam
Door-to-door waste collection vehicles in Palanpur and Nadiad
39
% of households withdoor-to-door collection
% of households withoutdoor-to-door collection
No data
Vadodara (17,52,371)100%
Anjar (87,183)35.21%
Dhoraji (84,545)0%
Households with Door-to-Door Waste Collection (PAS Data, 2013)
(Size of the dot represents the population of the city)

40 Map Book I Water and Sanitation in Urban Gujarat, 2013
41
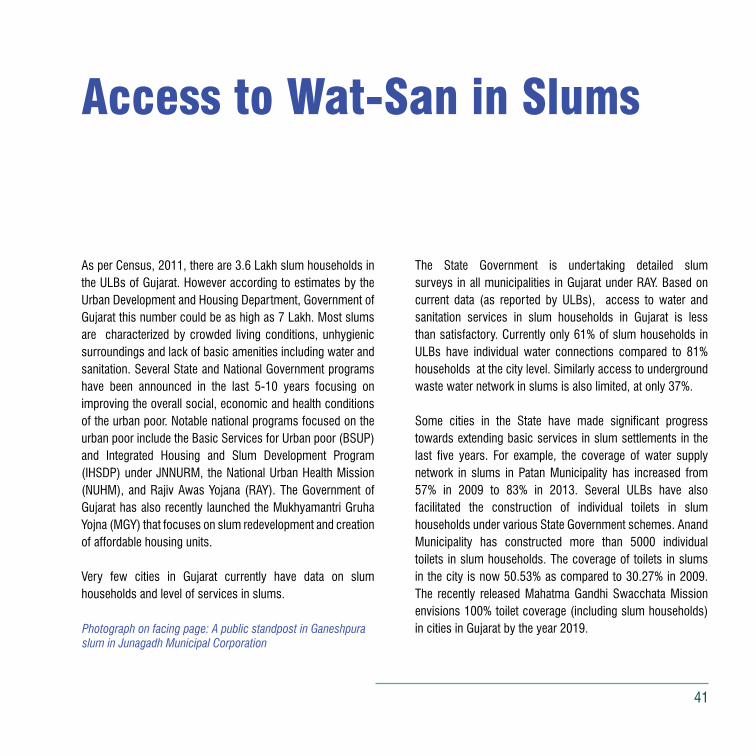
As per Census, 2011, there are 3.6 Lakh slum households in the ULBs of Gujarat. However according to estimates by the Urban Development and Housing Department, Government of Gujarat this number could be as high as 7 Lakh. Most slums are characterized by crowded living conditions, unhygienic surroundings and lack of basic amenities including water and sanitation. Several State and National Government programs have been announced in the last 5-10 years focusing on improving the overall social, economic and health conditions of the urban poor. Notable national programs focused on the urban poor include the Basic Services for Urban poor (BSUP) and Integrated Housing and Slum Development Program (IHSDP) under JNNURM, the National Urban Health Mission (NUHM), and Rajiv Awas Yojana (RAY). The Government of Gujarat has also recently launched the Mukhyamantri Gruha Yojna (MGY) that focuses on slum redevelopment and creation of affordable housing units.
Very few cities in Gujarat currently have data on slum households and level of services in slums.
The State Government is undertaking detailed slum surveys in all municipalities in Gujarat under RAY. Based on current data (as reported by ULBs), access to water and sanitation services in slum households in Gujarat is less than satisfactory. Currently only 61% of slum households in ULBs have individual water connections compared to 81% households at the city level. Similarly access to underground waste water network in slums is also limited, at only 37%.
Some cities in the State have made significant progress towards extending basic services in slum settlements in the last five years. For example, the coverage of water supply network in slums in Patan Municipality has increased from 57% in 2009 to 83% in 2013. Several ULBs have also facilitated the construction of individual toilets in slum households under various State Government schemes. Anand Municipality has constructed more than 5000 individual toilets in slum households. The coverage of toilets in slums in the city is now 50.53% as compared to 30.27% in 2009. The recently released Mahatma Gandhi Swacchata Mission envisions 100% toilet coverage (including slum households) in cities in Gujarat by the year 2019.
Access to Wat-San in Slums
Photograph on facing page: A public standpost in Ganeshpura slum in Junagadh Municipal Corporation

42 Map Book I Water and Sanitation in Urban Gujarat, 2013
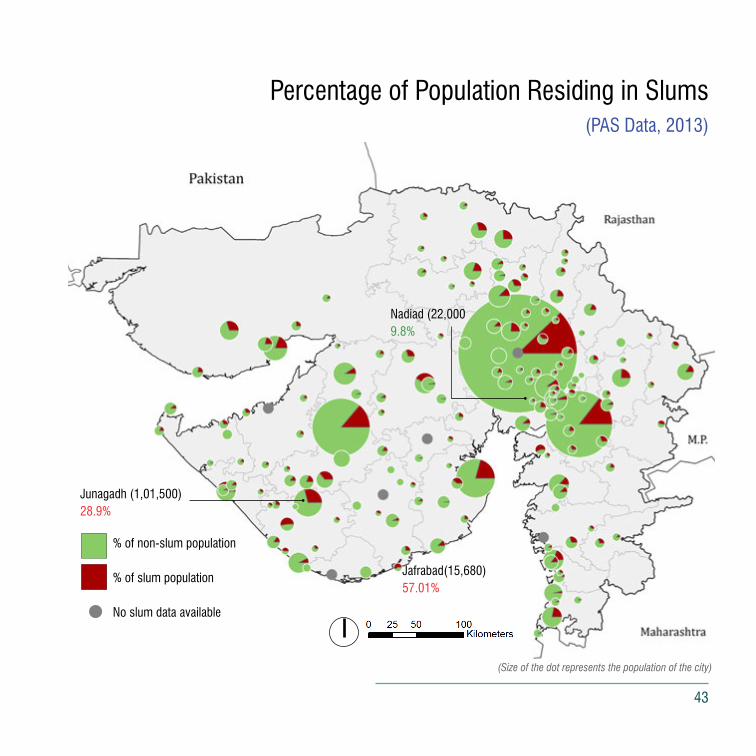
Slum Population in Gujarat
According to data collected under the PAS program for the year 2013, currently there are close to 6.3 lakh slum households in the State. Majority of slum population is concentrated in the larger cities such as Ahmedabad, Surat, Rajkot and Vadodara.
■ About 43 cities in the State have more than 25% population residing in slums.
■ Cities of Jambusar, Jafrabad and Keshod have more than 50% slum population.
■ 15 cities in the State reported no slums.
■ Among the municipal corporations that have reported slum data, Junagadh has the maximum percentage of its population living in slums (28%).
■ Ahmedabad has the highest number of people living in slums (7.2 Lakh).
■ In absolute numbers, 4 cities (Bayad, Limbdi, Gondal, Anklav) have slum population less than 1000.Popatpura slum in Surendra Nagar
43
Percentage of Population Residing in Slums (PAS Data, 2013)
(Size of the dot represents the population of the city)
Junagadh (1,01,500)28.9%
Jafrabad(15,680)57.01%
Nadiad (22,0009.8%
% of non-slum population
% of slum population
No slum data available
44 Map Book I Water and Sanitation in Urban Gujarat, 2013
Coverage of Water Supply in Slums
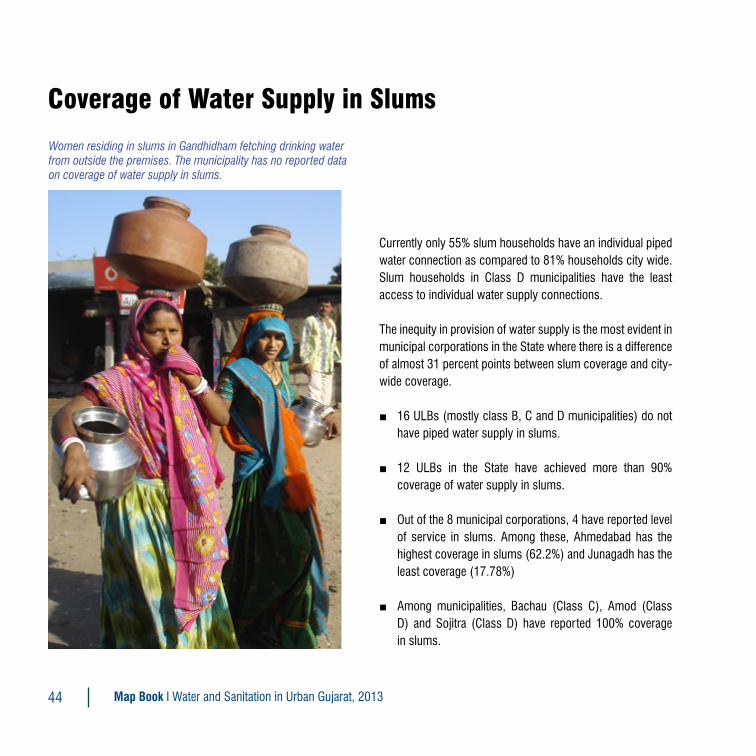
Women residing in slums in Gandhidham fetching drinking water from outside the premises. The municipality has no reported data on coverage of water supply in slums.
Currently only 55% slum households have an individual piped water connection as compared to 81% households city wide. Slum households in Class D municipalities have the least access to individual water supply connections.
The inequity in provision of water supply is the most evident in municipal corporations in the State where there is a difference of almost 31 percent points between slum coverage and city-wide coverage.
■ 16 ULBs (mostly class B, C and D municipalities) do not have piped water supply in slums.
■ 12 ULBs in the State have achieved more than 90% coverage of water supply in slums.
■ Out of the 8 municipal corporations, 4 have reported level of service in slums. Among these, Ahmedabad has the highest coverage in slums (62.2%) and Junagadh has the least coverage (17.78%)
■ Among municipalities, Bachau (Class C), Amod (Class D) and Sojitra (Class D) have reported 100% coverage in slums.
45
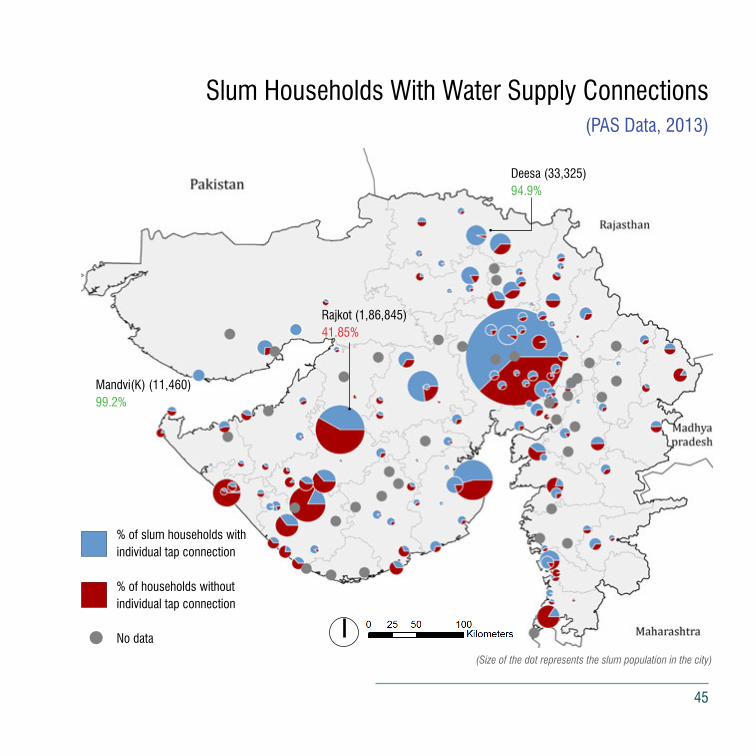
Slum Households With Water Supply Connections (PAS Data, 2013)
(Size of the dot represents the slum population in the city)
% of slum households withindividual tap connection
% of households withoutindividual tap connection
No data
Mandvi(K) (11,460)99.2%
Deesa (33,325)94.9%
Rajkot (1,86,845)41.85%

46 Map Book I Water and Sanitation in Urban Gujarat, 2013
Coverage of Toilets in Slums
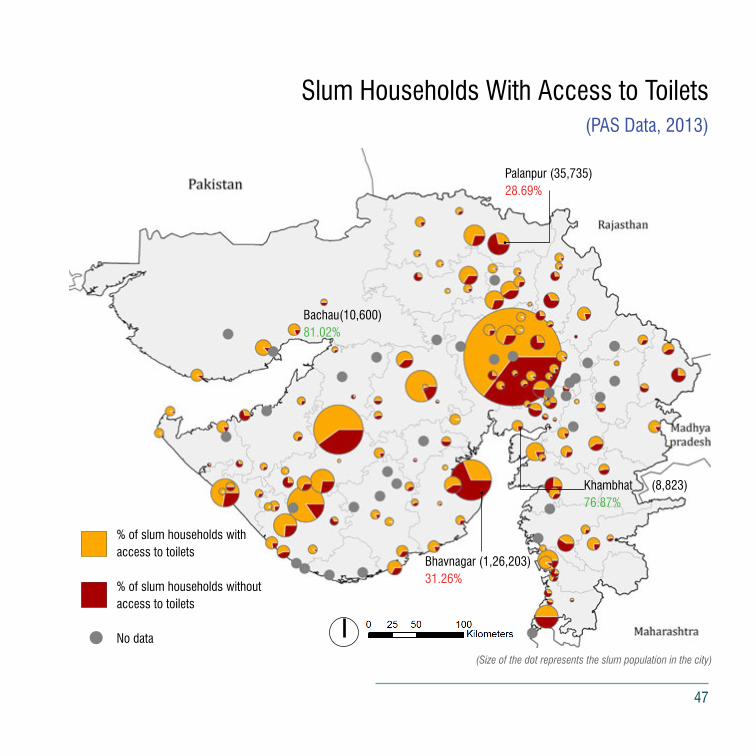
According to Census 2011, 8.7% of Gujarat’s population living in cities defecates in the open. Most of this population is concentrated in slums where access to individual or community toilets is limited. The Govt. of Gujarat has made concerted efforts to facilitate the construction of toilets in slums in cities across Gujarat, and the access to toilets in the State has significantly improved. Currently 60.9% slum households have access to toilets as compared to 86.4% in all (slum and non slum) households.
■ 16 ULBs in the State have more than 90% slum households with access to toilets. The Municipality of Vallabh Vidhya Nagar has reported 100% coverage of toilet in slums.
■ Out of those cities that have reported data on toilet coverage in slums, 7 cities have less than 25% slum households with access to toilets. Out of these, 3 cities (Bharuch, Upleta and Bavla) have more than 90% city-wide coverage.
A Community Toilet Block in Ambedkar Nagar Slum in Junagadh
47
Slum Households With Access to Toilets (PAS Data, 2013)
(Size of the dot represents the slum population in the city)
% of slum households withaccess to toilets
% of slum households withoutaccess to toilets
No data
Khambhat (8,823)76.87%
Bachau(10,600)81.02%
Bhavnagar (1,26,203)31.26%
Palanpur (35,735)28.69%
48 Map Book I Water and Sanitation in Urban Gujarat, 2013
Coverage of Sewage Network in Slums
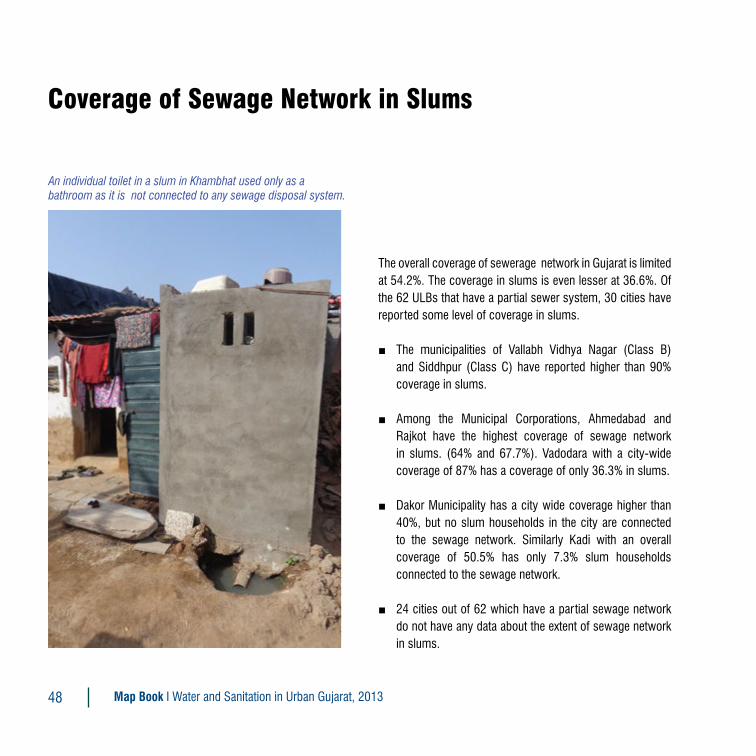
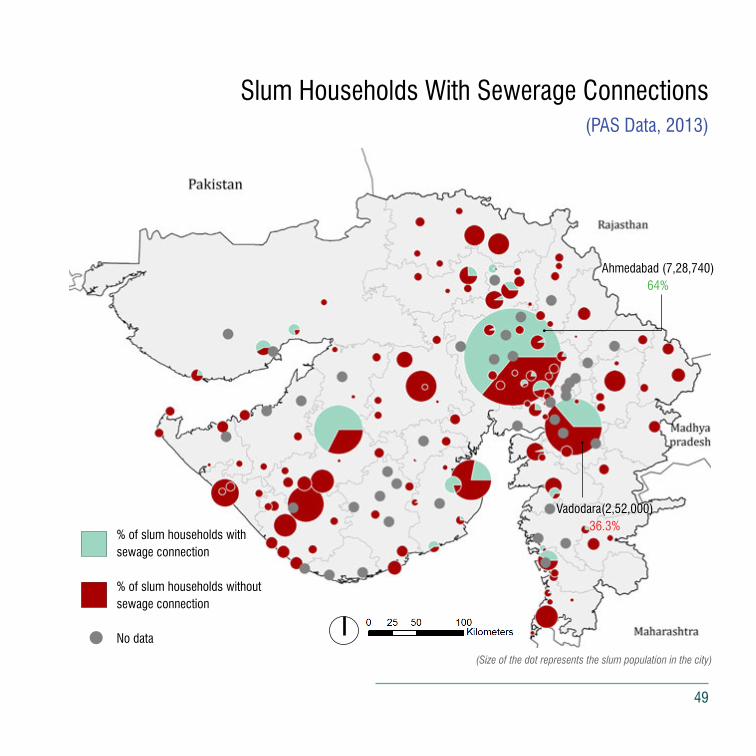
The overall coverage of sewerage network in Gujarat is limited at 54.2%. The coverage in slums is even lesser at 36.6%. Of the 62 ULBs that have a partial sewer system, 30 cities have reported some level of coverage in slums.
■ The municipalities of Vallabh Vidhya Nagar (Class B) and Siddhpur (Class C) have reported higher than 90% coverage in slums.
■ Among the Municipal Corporations, Ahmedabad and Rajkot have the highest coverage of sewage network in slums. (64% and 67.7%). Vadodara with a city-wide coverage of 87% has a coverage of only 36.3% in slums.
■ Dakor Municipality has a city wide coverage higher than 40%, but no slum households in the city are connected to the sewage network. Similarly Kadi with an overall coverage of 50.5% has only 7.3% slum households connected to the sewage network.
■ 24 cities out of 62 which have a partial sewage network do not have any data about the extent of sewage network in slums.
An individual toilet in a slum in Khambhat used only as a bathroom as it is not connected to any sewage disposal system.
49
Slum Households With Sewerage Connections (PAS Data, 2013)
(Size of the dot represents the slum population in the city)
% of slum households withsewage connection
% of slum households withoutsewage connection
No data
Ahmedabad (7,28,740)64%
Vadodara(2,52,000)36.3%

50 Map Book I Water and Sanitation in Urban Gujarat, 2013
Coverage of Door-to-Door Waste Collection in Slums
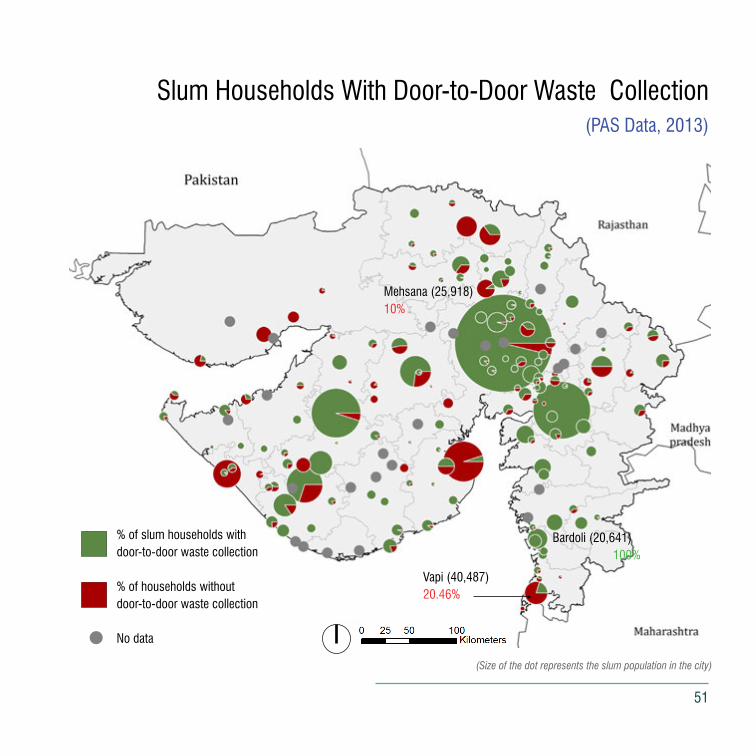
The coverage of door to door waste collection in slums in Gujarat has increased from 56% to 79 % between 2009 and 2013. As compared to other services in slums, access to door to door waste collection is the highest.
■ Out of the 32 ULBs with 100% coverage of door-to-door collection, 24 cities have 100% coverage in slums as well.
■ 25 ULBs do not provide any door-to-door collection waste collection services in slums. However 8 of these cities have more than 90% city wide coverage of door-to-door collection.
■ C and D class municipalities have the least coverage of door-to-door waste collection in slums.
■ Cities in South Gujarat generally have the highest coverage of waste collection services in slums.
Door-to-door collection services are provided in Ramapir-no-Tekro slum in Ahmedabad by involving waste-picker women .
51
Slum Households With Door-to-Door Waste Collection (PAS Data, 2013)
(Size of the dot represents the slum population in the city)
% of slum households withdoor-to-door waste collection
% of households withoutdoor-to-door waste collection
No data
Mehsana (25,918)10%
Vapi (40,487)20.46%
Bardoli (20,641)100%
52 Map Book I Water and Sanitation in Urban Gujarat, 2013
53
Census 2011 Data on Waterand Sanitation in Cities
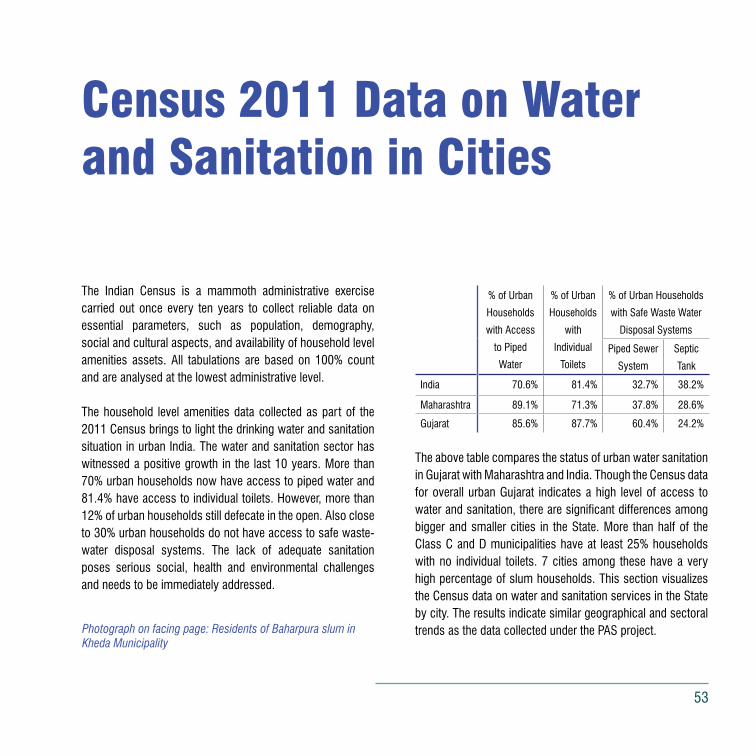
The Indian Census is a mammoth administrative exercise carried out once every ten years to collect reliable data on essential parameters, such as population, demography, social and cultural aspects, and availability of household level amenities assets. All tabulations are based on 100% count and are analysed at the lowest administrative level.
The household level amenities data collected as part of the 2011 Census brings to light the drinking water and sanitation situation in urban India. The water and sanitation sector has witnessed a positive growth in the last 10 years. More than 70% urban households now have access to piped water and 81.4% have access to individual toilets. However, more than 12% of urban households still defecate in the open. Also close to 30% urban households do not have access to safe waste-water disposal systems. The lack of adequate sanitation poses serious social, health and environmental challenges and needs to be immediately addressed.
The above table compares the status of urban water sanitation in Gujarat with Maharashtra and India. Though the Census data for overall urban Gujarat indicates a high level of access to water and sanitation, there are significant differences among bigger and smaller cities in the State. More than half of the Class C and D municipalities have at least 25% households with no individual toilets. 7 cities among these have a very high percentage of slum households. This section visualizes the Census data on water and sanitation services in the State by city. The results indicate similar geographical and sectoral trends as the data collected under the PAS project.
% of Urban
Households
with Access
to Piped
Water
% of Urban
Households
with
Individual
Toilets
% of Urban Households
with Safe Waste Water
Disposal Systems
Piped Sewer
System
Septic
Tank
India 70.6% 81.4% 32.7% 38.2%
Maharashtra 89.1% 71.3% 37.8% 28.6%
Gujarat 85.6% 87.7% 60.4% 24.2%
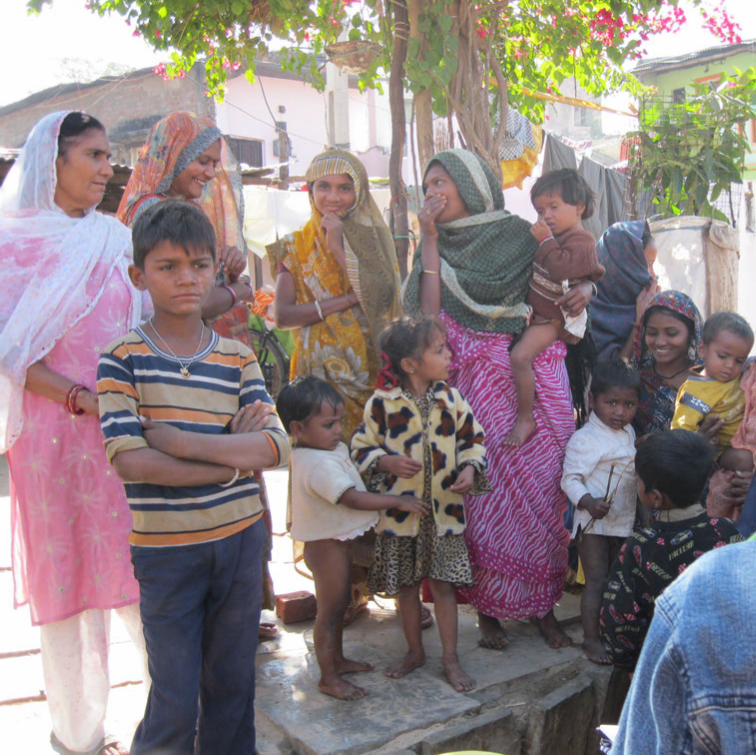
Photograph on facing page: Residents of Baharpura slum in Kheda Municipality
54 Map Book I Water and Sanitation in Urban Gujarat, 2013
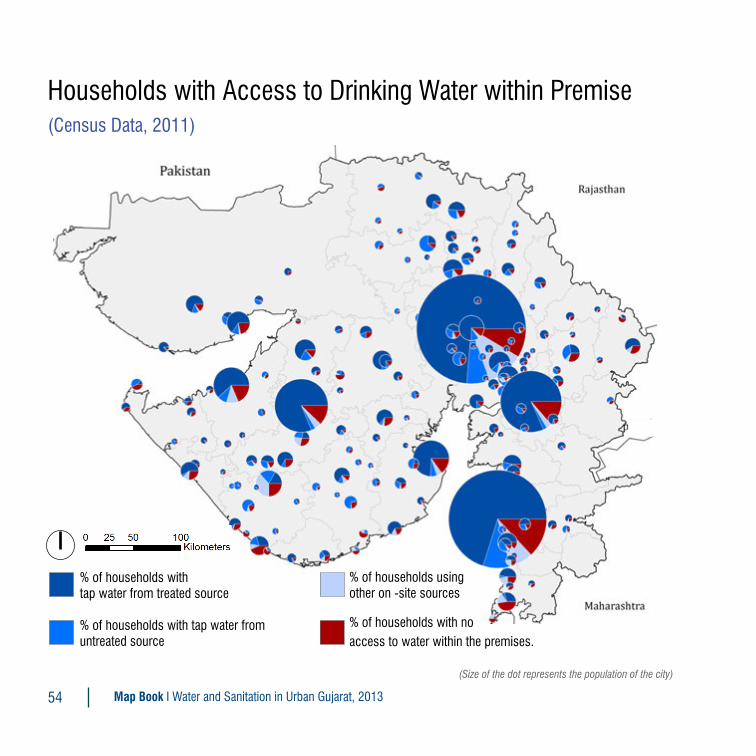
Households with Access to Drinking Water within Premise (Census Data, 2011)
% of households withtap water from treated source
% of households with tap water from untreated source
% of households using other on -site sources
% of households with noaccess to water within the premises.
(Size of the dot represents the population of the city)
55
No urban area
60-70 %
70-80 %
80-85 %
> 85 %
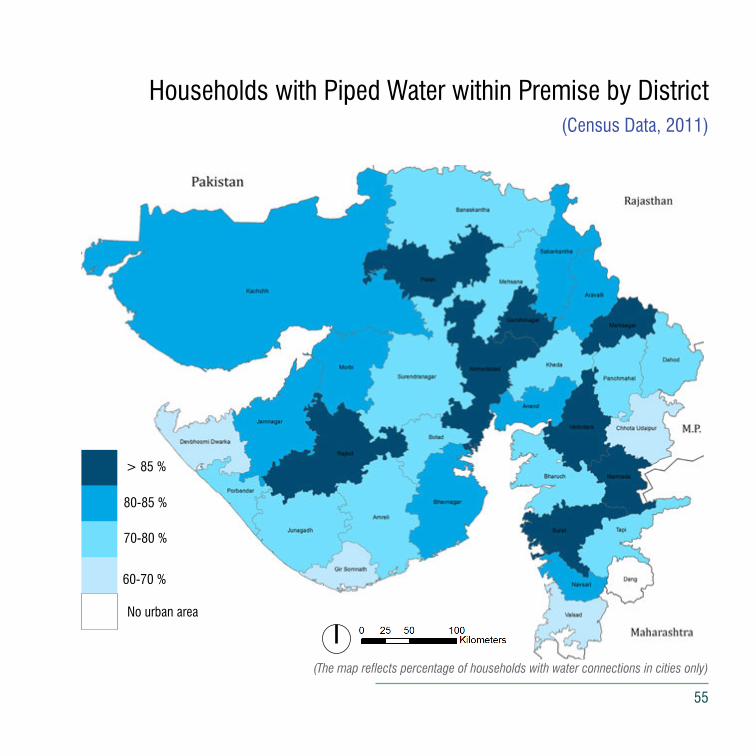
Households with Piped Water within Premise by District (Census Data, 2011)
(The map reflects percentage of households with water connections in cities only)
56 Map Book I Water and Sanitation in Urban Gujarat, 2013
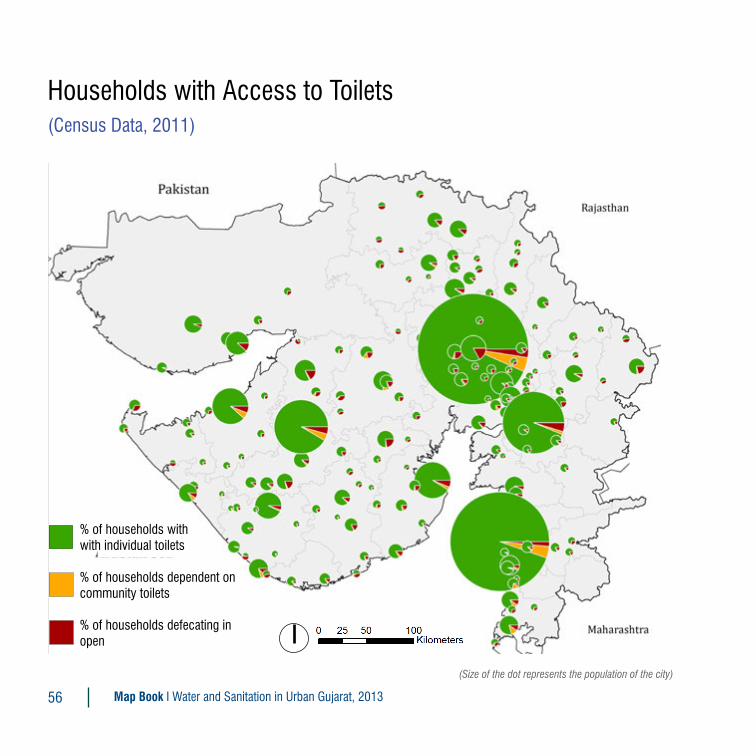
Households with Access to Toilets(Census Data, 2011)
% of households withwith individual toilets
% of households dependent on community toilets
% of households defecating in open
(Size of the dot represents the population of the city)
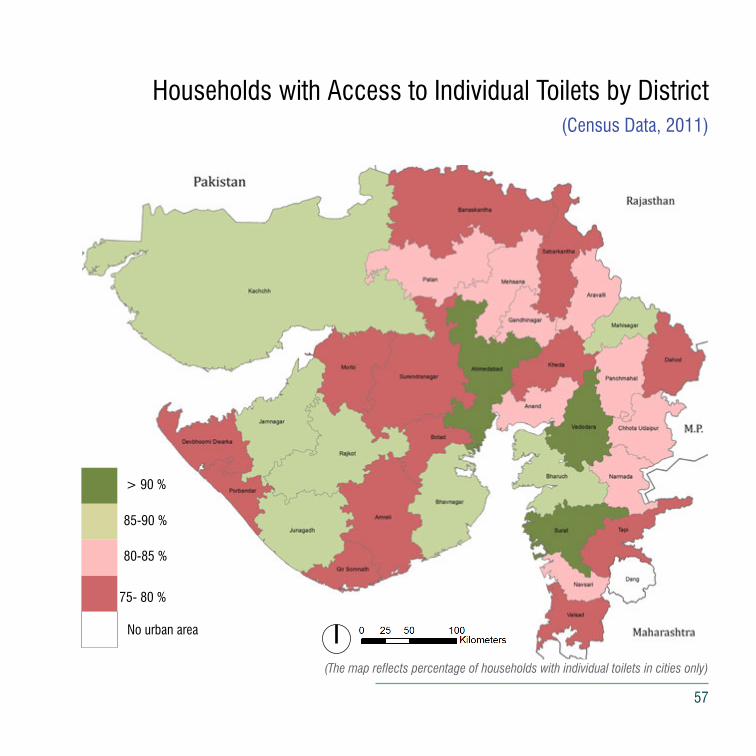
57
No urban area
75- 80 %
80-85 %
85-90 %
> 90 %
Households with Access to Individual Toilets by District (Census Data, 2011)
(The map reflects percentage of households with individual toilets in cities only)

58 Map Book I Water and Sanitation in Urban Gujarat, 2013
Households with Access to Waste Water Disposal System(Census Data, 2011)
% of householdsconnected to piped sewer
% of households connected to on-site sanitation systems
% of households with no toilets
(Size of the dot represents the population of the city)

59
No urban area
< 10 %
25-50 %
10-25 %
50-75 %
> 75 %
Households with Access to Sewage Network by District (Census Data, 2011)
(The map reflects percentage of households connected to sewage network in cities only)

Urban Local Bodies in Gujarat

Reports and Publications by UMC under the
PAS Program
Model Citizens’ Charter for ULBs in Gujarat, 2014
Standard Operating Procedure for Routine Water Quality Surveillance in
ULBs in Gujarat, 2014
Design Guidelines and Standard Operating Procedure (SOP) for Waste
Water Treatment using Oxidation Ponds, 2014
Standard Operating Procedure for Septage Management for Small Cities in
Gujarat, 2014
Information System Improvement Plan for Water, Sewerage and Solid
Waste Management Sector in Vadodara, 2014
Improving Cost Recovery of Water Supply in Patan Municipality, 2013
Financial Viability of Operation and Maintenance of Sewerage System-
Case of Patan Municipality, 2013
Improving Public Grievance Redressal System in Cities of Gujarat, 2013
Analysis of Water and Sanitation in Urban Gujarat (2009-2012), 2013
Assessing Citizens’ Feedback for Water and Sanitation Services in
Mehsana, 2013
What Works in Water & Sanitation: Case studies from Urban Gujarat, 2013
ISBN 978-81-909120-4-4
Diagnosis for Equitable Water Supply in Rajkot, 2012
Diagnostic Study of water supply System of Lathi Municipality, 2012
Recommendations for Improving Information Documentation for Water
Supply in Navsari, 2012
Best Practices Sangrah (in Gujarati), edited and published by UMC under
the PAS program, 2012, ISBN 978-81-909120-2-0
Analysis of Water and Sanitation in Urban Gujarat (2008-2009), 2010
Other Publications by UMC
Training Needs Assessment of City Managers in Urban Transport in
Madhya Pradesh, 2013, ISBN 978-81-909120-3-7
At the Core-Understanding Built Heritage of Surat and Rander, Manvita
Baradi & Meghna Malhotra, 2011, ISBN 978-81-909120-1-3
Afghanistan Urbanscapes, Manvita Baradi and Meghna Malhotra, 2010,
ISBN 978-81-909120-0-6
Mega Cities-Poised for Change: Leading Practices Catalogue,
knowledge management by UMC, published by International City/County
Management Association, 2007
Inclusive Development through Partnership and Reforms in Urban
Management In Gujarat (2001- 2006), Knowledge Management by
UMC, published by Gujarat Urban Development Company Limited,
Government of Gujarat, 2007
For more information, write to us at

UMCURBAN MANAGEMENT CENTRE
in collaboration with ICMA
UMCURBAN MANAGEMENT CENTRE
Urban Management Centrec/o 3rd Floor, AUDA building, UsmanpuraAhmedabad, Gujarat, IndiaTelefax: 91 79 27546403/ 5303Email: [email protected]
Map BookWater & Sanitation in Urban Gujarat, 2013