Map-Based Interaction using Digital Pen, Stylus and Touch ... · Faculty of Science Department of...
90
Faculty of Science Department of Computer Science Map-Based Interaction using Digital Pen, Stylus and Touch Screen: A Comparative Evaluation of Usability and Performance Dissertation for the master degree of Computer Science Szabolcs Becze Promotor: Prof. Dr. B. Signer Advisor: Dr. B. Dumas June 9, 2012
Transcript of Map-Based Interaction using Digital Pen, Stylus and Touch ... · Faculty of Science Department of...

Faculty of ScienceDepartment of Computer Science
Map-Based Interaction using Digital Pen,Stylus and Touch Screen: A ComparativeEvaluation of Usability and Performance
Dissertation for the master degree of Computer Science
Szabolcs Becze
Promotor: Prof. Dr. B. SignerAdvisor: Dr. B. Dumas
June 9, 2012

Contents
1 Abstract 3
2 Acknowledgment 4
3 Introduction 53.1 Research objective . . . . . . . . . . . . . . . . . . . . . . . . . 53.2 Research questions . . . . . . . . . . . . . . . . . . . . . . . . 63.3 Thesis structure . . . . . . . . . . . . . . . . . . . . . . . . . . 6
4 Background (10 pages) 74.1 Digital pen & paper . . . . . . . . . . . . . . . . . . . . . . . . 74.2 Map interactions with digital pen . . . . . . . . . . . . . . . . 124.3 Stylus and touchscreen inputs . . . . . . . . . . . . . . . . . . 15
5 Description of the tool 165.1 Requirements specification . . . . . . . . . . . . . . . . . . . . 16
5.1.1 Functional requirements . . . . . . . . . . . . . . . . 165.1.2 Non-functional requirements . . . . . . . . . . . . . . 16
5.2 System architecture and design . . . . . . . . . . . . . . . . . 175.3 Digital pen & paper development . . . . . . . . . . . . . . . . 18
5.3.1 Livescribe digital pen . . . . . . . . . . . . . . . . . . 185.3.2 Application UI: paper project . . . . . . . . . . . . . . 205.3.3 Application design . . . . . . . . . . . . . . . . . . . . 21
5.4 Smartphone development . . . . . . . . . . . . . . . . . . . . 255.4.1 Android OS and android applications . . . . . . . . . 255.4.2 Application requirements and UI . . . . . . . . . . . . 295.4.3 Application design . . . . . . . . . . . . . . . . . . . . 32
5.5 Server and database . . . . . . . . . . . . . . . . . . . . . . . . 375.6 Related developments . . . . . . . . . . . . . . . . . . . . . . 38
5.6.1 Sharing data between the pen and smartphone . . . 385.6.2 Calculating the accuracy of an annotation . . . . . . 41
5.7 Summary . . . . . . . . . . . . . . . . . . . . . . . . . . . . . . 42
6 User evaluation 446.1 Preparation for the evaluation . . . . . . . . . . . . . . . . . . 44
6.1.1 Goals of the evaluation . . . . . . . . . . . . . . . . . . 446.1.2 Participants . . . . . . . . . . . . . . . . . . . . . . . . 466.1.3 Additional modification in the system . . . . . . . . . 466.1.4 Evaluation run . . . . . . . . . . . . . . . . . . . . . . 50
6.2 Preparation of data . . . . . . . . . . . . . . . . . . . . . . . . 516.3 Analysis . . . . . . . . . . . . . . . . . . . . . . . . . . . . . . 52
6.3.1 Time . . . . . . . . . . . . . . . . . . . . . . . . . . . . 526.3.2 Accuracy . . . . . . . . . . . . . . . . . . . . . . . . . . 55
1

6.3.3 Evaluation forms . . . . . . . . . . . . . . . . . . . . . 596.3.4 Relation between measured results and evaluation
forms . . . . . . . . . . . . . . . . . . . . . . . . . . . . 596.3.5 Mixing paper and digital user interface . . . . . . . . 61
6.4 Biases in the measurement . . . . . . . . . . . . . . . . . . . . 616.5 Summary . . . . . . . . . . . . . . . . . . . . . . . . . . . . . . 62
7 Conclusion and future work 647.1 Project summary . . . . . . . . . . . . . . . . . . . . . . . . . 647.2 Evaluation results . . . . . . . . . . . . . . . . . . . . . . . . . 647.3 Further development . . . . . . . . . . . . . . . . . . . . . . . 65
8 Appendix 66
A executeCommand() and getTextContent() functions 66
B Code samples which handles penlet events 67
C ApplicationModel 71
D Recognizer class 73
E PHP scripts 76
F Evaluation form 79
G Evaluation questionnaire 84
2

1 Abstract
The digital pen has been around for more than one decade, it has beenthe topic for many researches. Usability and performance evaluations doexist, the digital pen was compared with touch inputs and it was integratedwith mapping applications as well. However we found no researches ofevaluating digital pen, stylus and touchscreen inputs. In this thesis wemake a usability and performance evaluation of these three input methods.
The results of the evaluation shows that digital pen was significantlyfaster and more accurate than stylus and touchscreen inputs. We alsofound that those participants who had less experience with computers weresignificantly slower than intermediates and experts and the same appliesto those participants who had no previous experience with smartphones.These were expected results, however not everything what we expectedwas reflected by the measured data. For example we wound no significantdifference between the performance of stylus and touchscreen input.
We concluded that, in certain use-cases when printed maps can be ap-plied, digital pens can greatly enhance the usability of the annotation pro-cess and even those who have less experience with computers can use iteasily end efficiently.
3

2 Acknowledgment
I like to dedicate my thesis to my girlfriend Julia, and to my friends inBrussels, who always encouraged, and cheered me.
I would like to thank also to Bruno, who constantly pushed me towardthe end of this project, and helped me with advices.
4

3 Introduction
The invention of the digital pen & paper technology goes back to 1996when Christer Fåhræus envisioned a digital pen which makes it possible tocapture written data on a special paper[4]. Small dots are printed on thisspecial paper, which are encoding coordinates on a large virtual surface.On the pen a built-in infrared camera can sense these small dots and it isable to decode it with image processing techniques.
Using this digital pen & paper technology many companies developedtheir own digital pens adding a display, a speaker or Bluetooth/WiFi com-munication. Since then many researches have been done on digital pen andpaper, in this thesis we see some of them in more detail.
The touch screen’s history goes back to 1965[9], when E.A. Johnsondescribed his work on capacitive touch screens in a short article. Manydifferent technologies have been used since than: resistive, surface acousticwave, capacitive etc. The touchscreen has two main advantage: it en-ables one to interact directly with what is displayed, rather than using apointer controlled by a mouse or touchpad, and it does not require anyintermediate device that would need to be held in the hand (other than astylus). Touchscreens are popular in the medical field, in heavy industry,museum displays or room automation where rapid and accurate interac-tion is needed and the usage of mouse and keyboard is circumstantial. Itbecame very popular with the spreading of handheld devices such as iPadsand smartphones, also many researches has been done on the usability oftouchscreens.
Stylus is a small writing utensil used to assist in navigation and providesmore precision when using them on touchscreens. It also protects thescreens from the natural oil from one’s hand. It became very popular in thesmartphone industry, for example the new Samsung Galaxy Note supportsboth touch and stylus inputs. There were many researches on the usabilityof styli[30][27], we discuss some of them in a later chapter.
3.1 Research objective
Until now these technologies were not mature enough to perform a com-parative evaluation on each of them. The map interaction with digitalpens is also not well explored, so we imagined a similar application toTripAdvisor[10], where users can annotate places related to their trip, at-taching a comment, image, a rating and a timestamp.
Our research objective is to perform a usability and performance evalu-ation on digital pen, stylus and touchscreen inputs with the TipAdvisor-likeapplication, where the users can annotate places on a digital printed map.
5

The target of this evaluation were two different user groups: users withdifferent level of computer experience, age, gender etc.
3.2 Research questions
With this evaluation we tried to find answers to the following questions:
• Is digital pen significantly faster than touch or stylus input?
• Is digital pen significantly more accurate than touch or stylus inputs?
• Is stylus faster than touch input?
• Is stylus significantly more accurate than touch input?
• Are computer expert users faster than beginner intermediate users?
• Are computer expert users more accurate than beginner intermediateusers?
• Are users with smartphone experience faster than other users?
• Are users with smartphone experience more accurate than other users?
• Are users younger than 30 faster than users older than 30?
• Are users younger than 30 more accurate than users older than 30?
3.3 Thesis structure
In chapter 4 we talk about the state of the art of digital pen, stylus and touchinputs and we will see some of them in more detail.
In chapter 5, we talk about the technical realization of the system, defin-ing first the functional and non-functional requirements then we introducethe system architecture.
In chapter 6, we see how the evaluation has been prepared, executedand how the data was analyzed. Based on the results, we give answers toour research questions.
In chapter 7, we draw some conclusions from the research and we givesome advices for the future work.
6

4 Background (10 pages)
Many articles have been written about the usability of stylus, digital penand touch based inputs, but we found none which compared all three. Wealso noticed that very few articles have been written on the usability ofdigital pen and map interactions. In this chapter we take a closer look atthe state of the art of digital pen & paper, stylus and touch inputs and wealso see some researches on interactions with maps.
4.1 Digital pen & paper
In this section we discuss about different projects realized with digital pen& paper.
Note: we discuss about the technical aspects of the Anoto technologyin a later chapter.
Everything started in 1996, when the Swedish Christer Fåhræus wrotehis doctorate. He envisioned a digital pen which makes it possible tocapture written data with a digital pen. The first prototype of the penwas completed in 1997, using real time image processing. In 2000 theAnoto started to work with more partners, and by 2003 companies likeNokia, Sony Ericsson or Logitech released their own digital pens base onAnoto technology. In 2007 Livescribe released it’s own digital pen (weused at our evaluation a Livescribe pen)[6]. Since then Anoto was growingcontinuously, dominating the digital pen & paper market [3, 4].
Parallel with the growth of the Anoto corporation many researches hasbeen done in various domains with digital pen & paper. Let’s see the mostimportant ones:
Paper Augmented Digital Documents:
The project Paper Augmented Digital Documents(PADD)[18] was amongthe first researches in 2003 with digital pens. They where investigating howdigital documents could be manipulated easily either on a computer screenusing mouse and keyboard or on paper using an digital pen. The usercould make annotations on a paper, the digital pen saved these strokes andsent it to a ”stroke collector”, which saved it into PADD database. On theFig. 1 you can see the two different representations of the same document.We can immediately notice the accuracy of the digital pen when we lookat the stroke input. This accuracy made it well suited for many tasks suchas proofreading, editing, and annotation of large format documents likeblueprints.
PaperBased Mobile Access to Databases:
7

Figure 1: Two representations of the same PADD. Top, we can see thescanned version of the paper document annotated with digital pen. Bottomthe digital equivalent after synchronization.
In 2005 Anoto pens were used at the world largest international artfestival in Edinburgh[13], where they created an interactive brochure, acity map and a bookmark. They defined active areas within the documents,and with an Anoto digital pen they could interact with these, sending queryrequests to an application database. The response to this request was sentback to the visitor in form of a generated speech output. In fact they createdmuch more, they defined the iPaper framework. On the image Fig. 2, youcan see the different components of this framework. The iPaper client whichdefined active components sent requests to the iServer. The iServer linkedthese requests to not only static information but also to dynamic programcode, so the selection of an active component resulted the execution of aprogram code on iServer, for example it could access to an external databaseretrieving some application information.
Print-n-Link: Weaving the Paper Web:
The same iPaper framework was used to enhance the article reviewingprocess, since the actual reading of the articles often takes place on paperand frequently on the move[22]. Let’s look at the Fig. 3. The user pointsto a citation on an interactive paper document with a digital pen, and
8

Figure 2: iPaper framework components
this position is sent to the iPaper Client, which issues and HTTP Requestwith the coordinates to the iServer. The iServer accesses the applicationdatabase and retrieves metadata about the requested item (for exampleabout a citation).
Figure 3: The user sends to the iPaper Client the encoded position, and thedevice sends further HTTP requests to an iServer.
The Digital Voting Pen at the Hamburg Elections:
In 2008, digital pen was used to accelerate the very time consumingelection process for the state parliament[11]. The voting and data collectionprocess is shown in the Fig. 5. The pen was directly connected to a localPC with a USB cable, then the written data was physically transfered to theMain Administration building where the data could be processed through
9

LAN. They needed these static connection due to security reasons. Theyclaimed that by introducing the digital pen saved at least 2-3 million euros.
Figure 4: The process of how a vote is saved and delivered to the datacenter.
Practical Environment for Realizing Augmented Classroom with Wire-less Digital Pens:
Wireless digital pens were also used to augment the work flow inclassroom[21]. The students could interact with a screen using the pen,increasing the interactivity of the participants and the level of attention.
Enhancing UML Sketch Tools with Digital Pens and Paper:
They enhanced the seamless integration of paper-based digital UML-sketching[16] by combining special UML sketchbooks (printed with Anotodot pattern) with tabletops.
Iterative Design and Evaluation of an Event Architecture for Pen-and-Paper Interfaces:
10

Figure 5: Interactive classroom, the student hared a projector, and interactedwith it using a digital pen.
They developed the PaperToolkit, a Java framework to use digital penstogether with PC[31]. Their event based approach let the developers to de-
Figure 6: Control buttons were defined in the bottom of the printed paper.
11

fine active regions which dispatched pen events (like click or stroke created).An event handler caught these events, and run the attached code. The resultthen could be sent back to the developer/user. In the Fig. 7, you can see anexample request/response.
Figure 7: Example how the PaperToolkit handles events.
Designing Pen-and-Paper User Interfaces for Interaction with Documents:
In 2009 there were a study about the usability evaluation of a digitalpen, about how can be gestures and symbols enhance it[26]. They providedan interaction framework, which helped in the interaction and tagging ofboth paper and digital version of documents.
Many other projects could have also been mentioned here in moredetail[14][15][17][19][25][24][28], but our intention was only to indicatewhich direction the development of the digital pen is going.
4.2 Map interactions with digital pen
Since in this master thesis we are implementing also some map interactions,we will present a couple of projects which are related with digital pen andpaper technology and printed maps.
Digital Pen Mobile Mapping:
In 2006 there were a project which investigated how smartphones anddigital pens can be integrated[12]. The maps were printed to an Anoto dotpatterned paper, and a Nokia digital pen were used to interact with it. Thedigital pen communicated through bluetooth with a smartphone, whichaccessed an application server through WiFi.
12

Figure 8: Example gestures of PPUI.
Performance evaluation of digital pen for capturing data in land infor-mation systems:
The accuracy of the digital pen makes it as a perfect choice to annotateon the map, even on very high resolution aerial photos. In 2011 an Anotopen was was evaluated(usability, accuracy, reliability, compatibility andfunctionality) at updating cadastral maps in a Land Information System[23].We would like to highlight this research since our research goal is very
13

Figure 9: Conceptual model of the system.
similar with this one, with only the difference that we would like alsoevaluate stylus and touch inputs.
Figure 10: This image has been taken from the thesis documentation: Com-parison between the drawing(yellow by free hand, green by ruler), theexisting cadastral map (red) and the aerial photo.
Local Ground: A Paper-Based Toolkit for Documenting Local Geo-spatialKnowledge:
Finally there were a study about how digital pen can be used to interact
14

with a map, making annotations on it and how these annotations can besubmitted later on to OpenStreet map[29].
4.3 Stylus and touchscreen inputs
Let’s see some other researches which were evaluating touch and stylusinputs.
There was a research how digital pen and touch inputs can be combinedtogether to enrich the interaction with digital documents[20]. They definednew gestures which were the combination of the two input modalities. Forexample, the user can hold a photo and drag off with the pen to create andplace a copy (see Fig.11). We have to note that here not the Anoto digitalpen and paper technology was used.
Figure 11: The pen and touch interaction: the user drags of the imagecreating a copy of the document.
Digital pens were also compared with mouse and keyboard inputs[30],but again here not the Anoto digital pen and paper technology was used.Finally we have to mention a study which were investigating the usabilityof the stylus input, comparing different types of styli (with five differentpen lengths 7, 9, 11, 13, 15 cm, and three pen-tip widths: 0.5, 1.0 and 1.5mm,and two pen widths: 4 and 7 mm ).
15

5 Description of the tool
In this chapter we discuss in detail how the system was realized, startingwith the functional requirements we propose an architecture. To explainthis architecture we need to speak a little bit about Digital pen & Paperdevelopment, the tools what the Livescribe has provided for us, aboutsmartphone and Android OS architecture, and application development,and how to send data to the phone from the pen.
5.1 Requirements specification
In this section we consider all the functional and non-functional require-ments of the system. From these we propose an architecture of the system.
5.1.1 Functional requirements
We imagined an application similar with TripAdvisor[10] where the userscan annotate places on map, attach a comment, attach an image to and rateit if it’s the case. The users can save these annotations and search amongthem later on. The possibility of the functionalities what we could haveadded is endless, however we decided to stay with only these. All theseannotations should be able to be inputted with with digital pen, stylus andwith touchscreen.
More specifically let’s see the full list of functional requirements:
• The user should be able to annotate a place, a path or an area on themap.
• The user should be able to attach an image to the annotation.
• The user should be able to write a comment and attach to the annota-tion.
• The user should be able to save the annotation.
• The user should be able to search among these annotations.
• The user should be able to input an annotation using a digital pen &paper, stylus or touch-screen.
5.1.2 Non-functional requirements
Since the system will be used at an evaluation the non-functional requirements[7]have specially high importance, because the user should not be constrained(or should be as little as possible) with the usability, understandability, pre-dictability, efficiency, responsiveness etc... Finally we have decided to takecare especially to the following usability requirements:
16

• The system should be usable:
The approach how to annotate on paper and on a touch screen in-put device can be very different. We must ensure that for users iscomfortable and straightforward to to use the tools. We have to takeinto the consideration that some users doesn’t have much experiencewith smartphones or digital pens, and they should be able to makeannotations after a small training.
• The system should be highly understandable:
Since on evaluation we target non-computer experts too we have tobe sure that the users understand the tasks as quickly as possible. Itmeans for example we need large meaningful icons, comments nextto the buttons on the paper, textual and audio feedback on the penetc...
• The system should be responsive:
The system should react quickly on user interactions, give them visualor audio feedback, by using the pen or the phone. The response timefor any user interaction should be less than 500ms.
• The system should be predictable:
The menu should be logically organized in such a way that the com-mon functionalities should be next to each other. The icons mustsuggest the functionalities associated with them etc...
• The system should be extensible and scalable:
In case if somebody would like to continue this project, the systemshould be highly extensible. We can ensure this by using commonprotocols at the communication, by good modular program structureand by documenting well the source codes...
5.2 System architecture and design
By analyzing the system we need for surely a smartphone application whichhandles the annotations, a pen application which collects the annotationson the paper document, a desktop component which accesses to the penapplication data and a server component which saves everything into adatabase.
Let’s have a look on the architectural diagram of the system(Fig. 12). Wecan immediately observe that we have to use 3 devices at the architecture.A digital pen, a smartphone and a local PC which acts as a PHP server, adatabase server and it also gets data from the digital pen. Let’s see all ofthese devices in more detail in the following sections.
17

Figure 12: Architectural diagram of the system
5.3 Digital pen & paper development
In this section we see in more detail how the digital pen is integrated withour system. First we introduce the digital pen used by us, how it’s working,and how can developers write custom application to it.
5.3.1 Livescribe digital pen
We use in an Echo Smart pen from Livescribe[6][5], which is based on theAnoto[3][4] pen and dot pattern technology.
On the image below you can see how this dot pattern is working: Asmall camera mounted at the head of the digital pen is able to detect thedot pattern, which encodes the absolute position on the paper. With thisunique dot patter it’s possible to identify each point in a 60km2 imaginarysurface (which should be enough for all possible applications written to thepen). These dots are so small that they are hardly visible (theirs diameter is0.08mm) so they are not disturbing at all at reading or writing.
On the image below you can see an Echo Smart pen, and it’s functionalities[5].It has a built in speaker what we are using to give audio feedback, it has abuilt in memory storage which can capture the handwritten data and hereare stored our application files too. It also has a small display where we cangive visual feedback about the internal state of the application. Finally thepen can be connected to a computer with a Micro-USB connector. Unfortu-nately this model has only this type of communication, so at this evaluationthe mobility of the pen device is restricted to a cable length. An importantfuture improvement can be introduced here with another type of pen which
18

Figure 13: Anoto dot pattern
support wireless communication, enabling the user to not to be constrainedphysically by a cable connection to a local computer.
The pen can run Java based applications called penlets, which can accessthe pen resources and stroke data. They also provided tools to developPaper Product, where the developer can design and print out user interfaceswith a printer to a Livescribe Dot Paper. Since both the penlets and thedigital representation of the paper product are deployed to the pen, they caninteract with each other. The developer can also specify handler functionfor the different penlet event, and connect it with the paper project. Allthe data can be stored on the pen, and it can be accessed by a desktopapplication written in C#, from a PC, when the pen is docked with a USBcable.
19

Figure 14: Echo smartpen structure
Note: we must note that the Livescribe has discontinued the penlet de-velopment project in 2010, and all the forums and blogs were unpublished.During development our only sources were the documentations and codessamples.
5.3.2 Application UI: paper project
We designed our interface to an A3 paper format (The active area is 42cmx 29.7cm). On the Fig. 16 you can see the UI of our paper project. Wecan immediately see that the UI can be divided to three sections: a map, acontrol panel, and a comment section.
The most important element of the UI is the map, and we tried to leavea space as large as possible. The map is sensitive to many pen interactionevents to be able to correctly distinguish between an annotation, a single
20

tap, double tap, a stroke data, and handwritten data. These events arehandled by the penlet, and they are discussed in more detail in a laterchapter.
At bottom we put the control panel. To the left corner we put our controlbuttons: Delete path, Delete comment, Annotation mode, and Search mode.To improve the usability and learnability of the system we tried to findsimple and meaningful icons, and since we don’t have a hover option todisplay more information in tooltips, instead we printed the tooltips belowthe buttons.
At the right part of the control panel, we have the 5 star rating bar.We also put a different section for the comments, if for the user is more
comfortable to write there instead directly to the map. Here we must notethat the orientation of how the comment must be written is restricted. Thisrestriction is due to the built in handwriting recognition.
In general we tried to give as much freedom to the user as possible,so at an annotation nothing is mandatory and the order of the differentoperations are independent. So it’s perfectly correct and equivalent if theuser first rates the annotation and then marks it on the map or the otherway around.
5.3.3 Application design
Penlet development:
The paper project is the UI of the application, it acts as a view componentin a model-view-controller architecture patten. Penlets are listening and
Figure 15: Relation between the paper product, smartpen and Livescibe dotpattern
21

Figure 16: Paper UI of the project
handling the UI events of the paper project, so it acts as a controller and amodel.
A pen can hold several penlets, but only one penlet can run in a giventime. On the image below you can see the lifecycle of a penlet: initialization,activation, deactivation, destroy.
These lifecycle states has a huge impact on our system architecture,and it determines the way how our penlet communicates with the Desktop
22
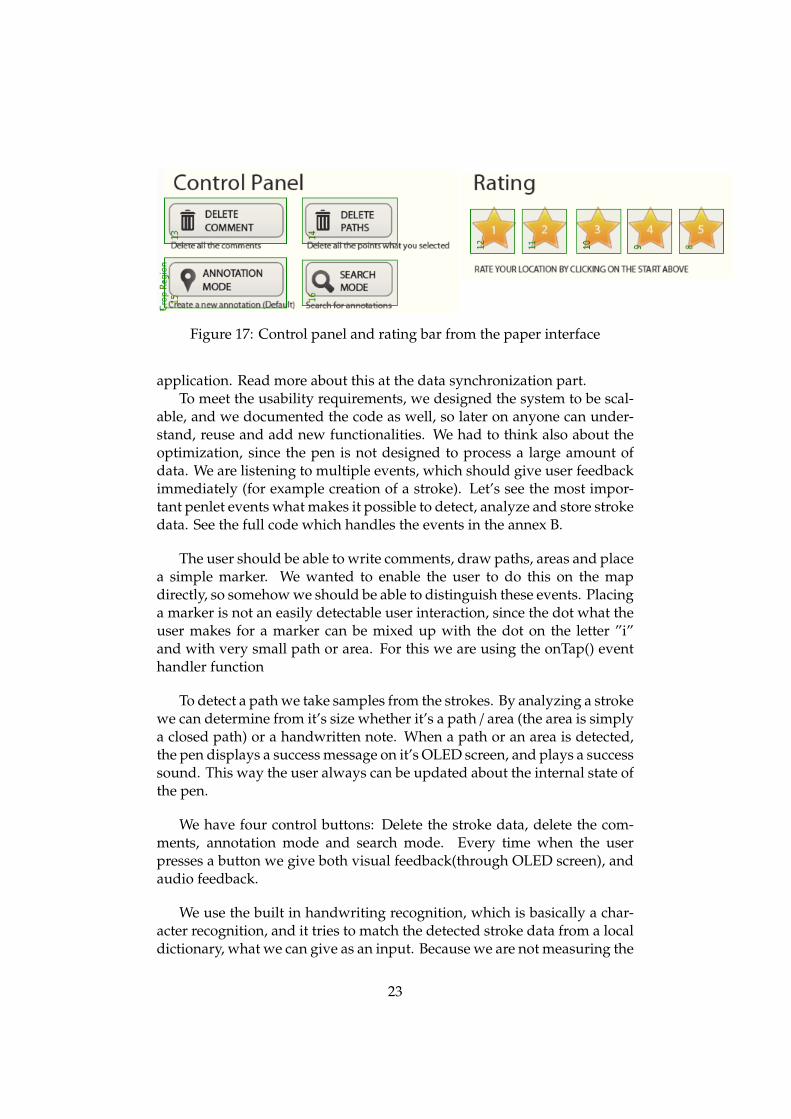
Figure 17: Control panel and rating bar from the paper interface
application. Read more about this at the data synchronization part.To meet the usability requirements, we designed the system to be scal-
able, and we documented the code as well, so later on anyone can under-stand, reuse and add new functionalities. We had to think also about theoptimization, since the pen is not designed to process a large amount ofdata. We are listening to multiple events, which should give user feedbackimmediately (for example creation of a stroke). Let’s see the most impor-tant penlet events what makes it possible to detect, analyze and store strokedata. See the full code which handles the events in the annex B.
The user should be able to write comments, draw paths, areas and placea simple marker. We wanted to enable the user to do this on the mapdirectly, so somehow we should be able to distinguish these events. Placinga marker is not an easily detectable user interaction, since the dot what theuser makes for a marker can be mixed up with the dot on the letter ”i”and with very small path or area. For this we are using the onTap() eventhandler function
To detect a path we take samples from the strokes. By analyzing a strokewe can determine from it’s size whether it’s a path / area (the area is simplya closed path) or a handwritten note. When a path or an area is detected,the pen displays a success message on it’s OLED screen, and plays a successsound. This way the user always can be updated about the internal state ofthe pen.
We have four control buttons: Delete the stroke data, delete the com-ments, annotation mode and search mode. Every time when the userpresses a button we give both visual feedback(through OLED screen), andaudio feedback.
We use the built in handwriting recognition, which is basically a char-acter recognition, and it tries to match the detected stroke data from a localdictionary, what we can give as an input. Because we are not measuring the
23

performance of the handwriting recognition, we haven’t optimized it thispart, and it will not be taken into consideration at evaluation.
When the desktop application accesses the penlet, the penlet is beingdeactivated, so the data need to be present in some ways. Unfortunatelyfor some reasons, the application variables are no longer available in thatmoment, so we need to be sure that the data is present all the time in a file.It means that after each relevant user interaction we should reserialize thedata and save it into a file, which also has some penality in performance.
we have chosen to represent the data in XML format, to represent theannotations, and since we representing stroke data and some custom datatoo we have chosen to integrate with inkML[1]. The Ink Markup Languageis a data format for representing ink entered with an electronic pen orstylus, so it was a perfect choice for us and we increased the scalabilityand extensibility of the project too. Below you can see an example inkMLrepresentation of an annotation generated by the pen.
<ink xmlns=” h t t p : / /www. w3 . org / 2 0 0 3 / InkML”><traceGroup>< t r a c e type=” path ”> 50 .312343 4 .2462496 , . . . , 50 .565458 4 .3634896 < / t r a c e>< t r a c e type=” path ”> 50 .312345 4 .2562546 , . . . , 50 .897899 4 .3653234
< / t r a c e>< t r a c e type=” path ”> 50 .365854 4 .6645356 , . . . , 50 .236844 4 .3641233 < / t r a c e>
<traceGroup><annotationXML type=” annotat ion ”><comment> This was an awesome t r i p < / comment><r a t e> 4 . 5 < / r a t e>
< / annotationXML>< / ink>
Listing 1: An example of annotation in inkML format
An important note here is that the coordinates recognized by the pen arefrom the paper project coordinate system, and we have to transform themto geocoordinate system (latitude and longitude). The pen was so accuratethat we could translate the detected coordinates it with around 3-5 metersin the map.
Desktop application:
The Livescribe also provides a DesktopAPI to access the penlet data(both stroke data and file data). It is written in C#, and runs on a desktopcomputer and it allows us to create applications that do the followings:
• Access strokes stored in AFDs that are installed on one or more Live-scribe smartpens attached to your desktop computer.
24

• Get smartpen status information, such as battery and memory status.
• Get and set smartpen properties.
• Manipulate data in ZIP files on the desktop computer
• Create a paper product programmatically.
Here we just needed to use the data transfer functionality.
To explain how we exactly transfer data from penlet to the desktopapplication, we need to speak some words about the penlet lifecycles. Onthe state digram below the most important states and transitions betweenthe states are listed: initialization, activation, deactivation and destroy of thepenlet instance. One of our requirement is, that on a smartphone request thedesktop application should pull the filedata from the pen, and should makeit available to use by anybody. When it accesses a penlet, first it calls theexecuteCommand() (see in more detail in the annex A), then it deactivatesit. This deactivation had a very important impact to our architecture. Itmeans that on the pen we have to store everything to a permanent storagebecause on deactivation the penlet looses it’s state. This deactivation cancome at any moment so it means that we need to refresh the temporarystorage with the last version of data continuously, and this has an impactto the performance.
We also tried to continuously read data from the pen, but this led toa dead end too due to the continuous deactivation of the penlet (it takesaround 2-3 seconds to activate again the penlet, which is of course makesit unusable in this scenario). We discuss in more detail this process of datasynchronization between smartphone and penlet in a further chapter.
5.4 Smartphone development
To be able to annotate easily on a map we have chosen a smartphone whichhas the largest display. Our choice has been the Samsung Galaxy Note(see the image below) which has a very high resolution (1280x800 pixels).It supports both stylus and a full touch inputs too so we are be able toevaluate both input methods on smartphone. It runs Android OS, so wehad to design an application under Android.
5.4.1 Android OS and android applications
Before we present the application design we need to see some details aboutAndroid OS and Android applications.
Android applications are running on top of an AndroidOS. This Linuxbased OS are designed specifically for mobile devices owned by Google. It
25

Figure 18: The most important state transitions during the life cycle of thepenlet. Image was taken from the Livescribe Penlet documentation
was first introduced in 2005, and in 2007 it become an open-source projectunder Apache Open Source Project license. I think this is why currently thedominant mobile OS on the market. On the image below we can see howthe Android market share has changed over the last couple of years.
Android has a large community of developers writing applications thatextend the functionality of the devices. Developers write primarily in acustomized version of Java. These applications can be downloaded fromthe Android Market for no cost or for a small amount of money. As of
26

Figure 19: Samsung Galaxy note
February 2012 there were more than 450,000 apps available for Android,and the estimated number of applications downloaded from the AndroidMarket as of December 2011 exceeded 10 billion.
Android is a Linux kernel based OS, with middleware, libraries and APIswritten in C and application software running on an application frameworkwhich includes Java-compatible libraries based on Apache Harmony. An-droid uses the Dalvik virtual machine with just-in-time compilation to runDalvik dex-code (Dalvik Executable), which is usually translated from Javabytecode.
Although the version 4.0 is already launched the current most popularversion is 2.3.3 called ”Gingerbread”. On the Figure 3 you can see how thepopularity of the different versions are shared.
27

Figure 20: Smartphone Mobile OS Marketshare
Figure 21: AndroidOS architecture
28

Figure 22: Usage share of the different versions as of 2 April 2012 (imagetaken from Wikipedia)
5.4.2 Application requirements and UI
This phone application should be the center point in editing the annotations,it should receive data from the digital pen, and save the annotation on theserver. It should allow the user to modify the annotation received from thepen, and also should be able to provide enable the users to input both withtouch and stylus inputs. These requirements are well defined in the section3.1. During the evaluation we have to able to distinguish between the users,so we need to have some kind of (very primitive) user management too.
From these requirements and specially from the usability requirementswe could design a user interface(see the images below). Since the touchbased interface doesn’t enable us the ”mouse over” functionality hence wedon’t have tooltips neither, we designed the buttons such that the imagesshould be self explanatory, during the evaluation we ask the participants ifthey find the UI and the system usable, so we get feedback on this too. Onthe images below we can see the most important pages and a descriptionnext to them.
29

Login page:
This is the first page on application start. It takes as an input a userid and an input type. The user id is used to identify the annotationsmade by different users. The user id is a number from 1-21 identifying theparticipants. We kept the user id 1000 for debug purposes(See the loginpage on the Fig. 23).
Note: It uses the login.xml layout
Figure 23: Login page.
Annotation page:
After a successful login the annotation page is started, where the usercan create and save new annotations. We tried to avoid texts and replaceeverything with icons where it’s possible. In this interface the user canmark paths on the interface, set the time of the annotation(the default timeis the current), add comment, rate, attach an image, request data from thepenlet, search, delete and save annotations(see Fig. 24).
Note: It uses the annotation view.xml layout
30

Figure 24: Annotation page.
Search page:
When the user selects the search mode, it will be redirected to this page.Here the user either requests data from the pen or select an area manually.You can see an example of selecting a search area. First the user selects thecenter of the circle, then the radius. By pressing the search button the resultshould be displayed(see Fig. 25).
Note: It uses the search view.xml layout
Search results:
Here we can see some search results marked with red. These annotationswere made during the evaluation, by 8 user. If the user wants to filter amongthe search results not only with area restriction but with comment, than hejust has to type in some keywords and submit a new query(see Fig.26).
Note: It’s enough that only a small fraction is inside the search area, inorder to be displayed.
31

Figure 25: Search interface.
Figure 26: Search area selected.
5.4.3 Application design
At the previous section we described the UI of the application. In thissection we dig in more deeply into the core of the application. Let’s first
32

take a look on the class diagram below and the small description of eachclass
LoginActivity:
Handles the login page, and it uses the login layout. (See the previoussection about this layout). It checks and saves for a valid user id, and a con-dition to the ApplicationModel and starts the AnnotationActivity activity.Later on this user id and condition is saved with the annotation to identifyeach annotation.
AnnotationActivity:
It controls and manages the creation of new annotations and it uses theannotation view layout. Here the user can mark a path or an area on a maptake an image, write a comment, set the annotation time, synchronize thedata from the penlet, delete the current annotation (reset the screen), andsave the annotation. To provide all these functionalities it uses the map,server, time and utils packages described below.
The SearchActivity activity is started from here.
SearchActivity:
It controls the search among the annotations, and it uses the search viewlayout. By get an area from the penlet, or drawing a circle (by specifying it’scenter and radius) we can define the search area. Within this search area wecan display all the annotations, filtered by a comment. We also can deletethe last search result or go back to the AnnotationActivity activity;
MapActivity:
A map activity contols the map( this is provided by the Android SDK,it directly supports interaction with a Google map). Every map controllermust extend this MapActivity, and we have defined our own map controllerto hold our common attributes (see the TripMapActivity).
TripMapActivity:
Both AnnotationActivity and SearchActivity is a TripMapActivity which isa MapActivity. This class defines the most important utility classes what weuse to control a map, so synchronize with a server and a pen, and to parseXML. See about each of these at the end of this list in more detail below.
IMapOverlay:
33

Figure 27: Class diagram of the android application
34

A simple interface which defines the common methods for a MapOver-lay.
MapOverlay:
Is responsible for displaying custom annotation on a Google map. Itdisplay a custom stroke data (See more the Annotation and Stroke classes)and other shapes like lines, points and circles specifying the color, alphaand line width of the annotation.
MapAnnotateOverlay and MapSearchOverlay:
Both classes inherits form MapOverlay. They are the concrete imple-mentation of how to interact and how to display annotations depending onthe scenarios. At map annotation, we define a series of point on the mapconnected with a line, representing an path or an area (on double click itautomatically closes the path and fills it as an area).
On search the user selects a search area withing he/she would like todisplay the search results(annotations). With touch inputs this is done byspecifying a central point of the search and a range too.
ApplicationModel:
So far we have described the view part of the application (see the pre-vious section), the control classes which controls the map, overlays etc... .This class is a singleton class which represents the application model fromthe MVC architectural pattern.
This class stores the userId, condition, annotations, and other utilityvariables. See in more detail in the annex C.
Annotation:
An annotation is a value object which holds a list of strokes, a comment,rating value, and a path to the image file. The annotations can be displayedby the MapAnnnotationOverlay, and the AnnotationActivity. The XMLUtilityclass also can convert an inkML annotation to this value object Annotation.
Stroke:
The stroke class holds a list of GeoPoints (a representation of a pointwith latitude and longitude), and a flag which tells whether it’s a path oran area. A stroke can be serialized(and deserialized) to a String, which isused to store it into the database.
35

MapGeometryUtils:
Contains utility methods to make geometry computations on a map,with GeoPoints.
• Determining if a point is inside the polygon. Here we are using asimplified version of Ray casting algorithm[8].
• Determining if two polygons intersect each other.
• Determining if a polygon intersects a circle
• Determining if a point is inside the circle
• Determining the distance of two points
XMLUtils:
Using DOM parser we can parse the results from the digital pen ininkML format. See the inkML format defined for annotation in the chapter3.3.2.
AnnotationBroker:
Saves and searches for annotation on a server, by making HTTP GETand POST requests.
PenletSynchronizer:
Issues a get request for penlet data to the server. See in more detail howthis is working in the background in the section 5.6.1.
36

5.5 Server and database
We mentioned at the previous sections that we use a PHP server for twopurposes:
1. To get the annotation data from the penlet with the help of the desktopapplication
2. To save and search for annotation using a MySQL database
The smartphone communicates with this server by making simple HTTPrequests. Due to it’s simplicity are not discussing it here but in the annex Eyou can read the actual PHP code which handles these requests.
To store the annotations and later on, store the evaluation form results,and the measured time results we have created 3 database tables. On the Fig.28 you can see the structure of the table where we stored the evaluations.We also stored the time needed to make the annotation in the table below(Fig. 29). The evaluation questionnaire results were also stored in database.On the Fig. 30, you can see the table structure.
Figure 28: Databse table which store the annotations id, stroke, shape,accuracy, comment, rate, the id of the user and the condition used.
37

Figure 29: The time needed to make the different annotations, here specifi-cally we were interested in the 6 specific annotation, so we created separatecolumns for them.
5.6 Related developments
In this section we talk about other technical challenges what we faced withduring development, and evaluation.
5.6.1 Sharing data between the pen and smartphone
In this section we discuss about how the data from the pen is sent to thephone, and what issues and limitation did it have.
We already spoke about how the annotations serialized to inkML rep-resentation is stored into a file on the digital pen. This file can be read bythe desktop application which lies in the localPC.
Before we continue we should discuss a little bit more about this datatransfer. Initially we wanted to stream stroke data continuously to thesmartphone, but all the possibilities to read data from the pen (offered usby Livescribe) first deactivated the application and then read the data. Dueto this deactivation we had to store everything in a temporary file, whichwill be still in the memory after the penlet deactivation. This deactivationhad another very important impact in our architecture, namely it takes2-3 seconds to activate again the application, so we couldn’t mimic thestreaming with a continuous reading in an infinite loop.
38

Figure 30: For each of the questionnaire we store the scores given by eachparticipants to the usability requirements and to each conditions.
39

If we can not stream, than we have to think about something semi-automatic way to transfer data: when the user finished the annotationswith one user interaction the phone should receive the data from the pen.We decided that the phone is requesting for the pen data, so with a simplebutton click we should be able to synchronize with the pen. The problemhere was that we had no way to directly access the pen from the phone, so weneeded to make a small workaround. Namely only the desktop applicationhas access to the penlet, and if we can make a link between the desktopapplication and the PHP server we are ready.(since we can make a requestfrom the phone to the server). Finally our solution was the following:
1. The Desktop application waits for a request to read the penlet data.This runs all the time in the background on the PC, and no userinteraction is needed. What it does in fact is that it checks in eachsecond if a request has been issued by the PHP server or not.
2. The user makes some annotations on the paper with the digital pen,and these annotations are automatically saved in inkML format in afile and on the pen’s memory.
3. The smartphone makes a HTTP GET request to the PHP server for theannotations.
4. The PHP server signalized to the desktop application that a requesthas been made by the user and waits for 5 seconds (checking in eachsecond) for a return value from the desktop application.
5. The desktop application receives the request for penlet data, and readsthe data from the penlet, by deactivating it and copying the contentof the temporary file on the pen, to another file which is reachable bythe PHP server.
6. The PHP server receives the stroke data from the desktop applicationin a file, and sends back as a return data for the GET request made bythe phone.
7. On the smartphone we get the inkML annotations and we can parsethem and display them as Annotations
Everything is automated and what the user sees is that only with onebutton click the annotations are transfered from the pen to the smartphone,and it’s automatically displayed.
40

5.6.2 Calculating the accuracy of an annotation
On evaluation we would like to measure the accuracy of the annotationtoo. For this we needed an algorithm which compares two polygons andscores it very accurately. On possible algorithm was the $1 algorithm[2],which is a very fast symbol recognizer which can be trained easily. It verypowerful because the two symbols can have, different position, differentsize and even the angle can be arbitrary. To be able to do this is males someelementary geometry transformations: forces the number of points to beconstant in the polygon, it shifts the polygon to the 0 coordinates, scales itto fit into a square with edges of unit length, and rotates it until the bestmatch is given.
We know that our polygons are be paths and areas on the map, in a welldefined coordinate system, and we are interested how accurately the pathor are is annotated if the participant has been given a template. It means thatin our case the position, size and angle must be taken into consideration,therefore we had to modify the $1 algorithm in order to take these aspectsinto consideration too.
Another important change in the algorithm that the strokes in $1 areordered, and for us it’s important to recognize the paths / areas even if theyreversed the order. We solved this issue by reversing simply the templatesand running the algorithm on them too.
We had further issues with the areas, since an area is a closed path. Butthe participants most probably will start in different places the annotationof an area. We solved this issue by determining the closest point in thesample to the starting point of the template, and shift the elements in thesample to get the best match with the template.
Let’s see the most important code sample of the recognizer on the Fig. ??,but you can read the full code in the annex D. The first thing what we do isto ”resample” the sample, forcing that the nr. of points in the sample to beexactly the same as in the template stroke. After that we go through all ofthe templates and calculate the average distance between the template andthe sample(between each point of the sample and the template since theyhave the same number of points). Finally we calculate the score, simplyjust by dividing the smallest distance with 100, to bring down the values tofit to the interval [0,10].
public Result Recognize(Vector points)
{
// Forcing the number of point in the sample to be constant
points = Utils.Resample(points, NumPoints);
41

// display the sample
model.helperDisplay.add(points);
// the template id of the best match
int templateId = 0;
// distance between the template and the sample
double distance = Double.MAX_VALUE;
for (int i = 0; i < Templates.size(); i++)
{
Template template = ((Template)Templates.elementAt(i));
double d1 = Utils.rotatedPathDistance(points, template.Points);
double d2 = Utils.rotatedPathDistance(template.Points, points);
// get the min of the two distances
double d = (d1 < d2)? d1:d2;
if (d < distance)
{
distance = d;
templateId = i;
}
}
// we just devide it with 100 to fit into the interval [0-10]
double score = distance / 100;
//display the template
model.helperDisplay.add(
((Template)Templates.elementAt(templateId)).Points);
return new Result(((Template)Templates.elementAt(templateId)).Name,
score, templateId);
};
Listing 2: The modified recognizer function, of the $1 implementation.
On the Fig. 31 we can see the template stroke with red, and an annotationmade by a participant with touchscreen input.
5.7 Summary
In this chapter we defined and described in detail the architecture of thesystem used to evaluate the participants. First we have seen the functionaland non-functional requirements of the system. From these requirementswe designed the system architecture, describing each component and sub-system and the communication of the different devices.
We discussed about how to develop an application to the digital pen
42

Figure 31: With red marker the template while with blue the annotated areawith touchscreen.
(penlets), how to design and print out dot patterned user interfaces andhow to access this data from a desktop application. We have shown indetail how our penlet and the paper project can be connected.
We also discussed about the AndroidOS and about the developmentof Android applications, and in more detail about our application whichhandled the annotations inputted both with digital pen and touch inputs.A separate section were kept to the communication between the penlet andthe Android application. We discussed the issues what we have faced withand our workaround. We also have seen a workflow of this communicationusing an inkML format.
In the last section we have shown the PHP server which handles theannotations and helps us to transfer data from the pen to the phone.
43

6 User evaluation
In the previous chapter we have discussed about the system architecture,design and implementation. In this chapter we will focus on the evaluationof the system. In fact the focal point of the thesis is this evaluation. What wehave done so far is just the preparation of the system to be able to performthe evaluation.
In the followings we will first discuss how we planned and prepared theevaluations (we will see a concrete example too). We will also discuss aboutthe participants, how we grouped them, and how we adapted the systemto be able to evaluate with it (user login, how we measured the accuracyetc.). At the last part we will analyze the gathered data, and we will try dodraw conclusions.
6.1 Preparation for the evaluation
6.1.1 Goals of the evaluation
In this section we will discuss about what we wanted to measure. Sincethe system is quite complex, it allows the users to make annotations on amap with three different conditions, save them, search among them, attachimages etc. We wanted to compare the usability of each conditions, so wehad to restrict our evaluation to only those aspects of the system whichappears at each condition. So for example drawing a path is possible usingeach condition, but saving it although the system supports digital pen input,is happening through smartphone and not using the digital pen.
We were interested mainly in the usability of each condition, how fast,accurate, responsive, precise, easy to understand and to learn, they are com-pared to each other. Although the interaction with the map, an annotationitself can be very complex it can be decomposed to elementary tasks likedrawing a line or an area, or writing a comment, so we are targeting theseelementary tasks to measure.
Since our participants will have different background, age, experience,language etc. we had to make sure that at the time when we measurethem each of them get some kind of training. Therefore we started eachevaluation with training where at the first part we explained them how thesystem was functioning, show them examples (this took up about 5 minutes), and after that we asked them to annotate a path, an area and to write acomment.
Note: It was important to highlight to the participants that it’s not themor their performance what is going to be measured, but how usable thedifferent conditions are.
44

We also wanted to know how the conditions will perform if we increasethe level of difficulty of an elementary task, so we selected three differentpaths with increasing length, and complexity, and three different areas. Atwriting we were only interested in how efficiently the users can write withthe given condition.
So far we have measured the raw performance of the conditions in dif-ferent scenarios, but we were also interested about the participant’s opinion.We asked them to rate each conditions from 1 to 5 (1 strongly disagree and 5strongly agree). We tried to target those non-functional requirements whichwere listed in the section 5.1.2.
The question were the following:
• I found the system usable: Here we were interested in the subjectiveopinion of the user about how usable the system was for him/her froma general point of view.
• I found the system responsive: Did the system give me feedback aboutit’s internal state. Did I know all the time what was going on, andhow can I correct if I made a mistake.
• I found the system precise: What was the precision of the tool when Iwas drawing the paths, areas.
• The system is easily understandable: Was it straightforward how todraw a path, how to delete the annotation if I made a mistake, how tosave it?
• I found the system quick: How easy was the process of annotationwith the given condition. Was it quick to annotate a park or a street?
Since giving a mark to each of these usability requirements are highlysubjective we also wanted to somehow double check them, so in case ofeach usability requirement we asked their opinion again, but this time weasked them to select only one from the three conditions, which they thinkit’s the most usable, responsive precise etc.
We also collected some personal details about the participants, namelytheir age, computer experience level, whether they had experience beforewith digital pen, and whether they are left or right handed(see the fullevaluation form in the annex G).
45

6.1.2 Participants
We evaluated the system with 21 participants, with different computerexperience, smartphone experience, digital pen experience, age and gender.We also asked them whether they are left or right handed, but incidentallyall of them were right handed. On selection of the participants we focusedmore on their computer experience level, and we selected them such thatthree equal groups could be formed: 7 beginners, 7 intermediates and 7experts.
Some of the participants were Hungarian not English speakers whileothers although were from all over the world they spoke English in a levelwhich was enough for testing.
6.1.3 Additional modification in the system
In the previous sections we talked about how we decided what to measure,how we prepared the logical flow of the evaluation and how we selected theparticipants. Now in this section we will talk about how we prepared thepreviously developed and tested system, to be able to use at the evaluation.
User login:
We stored every stroke data in a database, to be able to search amongthem, and later on to be able to analyze their precision. We also wantedto identify each annotation later on, to be able to assign to control groups,and calculate statistics on these groups. We also wanted to identify thecondition which was used at the annotation. Therefore we created a loginpage, where the user can enter it’s unique identifier and the condition used.
Guidelines:
We asked the users to annotate paths with increasing level of difficulty,but somehow we had to mark these paths both on the paper map and onthe digital version of the same map. Therefore we created guidelines whichhelped the users in the annotation process, see on the image below. Withthe areas we had an easier tasks since we selected parks which were alreadymarked on the map with green. On the images below we can see all thesix basic annotation tasks (3 paths and 4 areas) with increasing level ofdifficulty, length and complexity.
Note: These guidelines where used when we calculated the precisionof an annotation.
46

Figure 32: Path with complexity level 1: The most simple path, which canbe annotated with only a simple straight line.
Figure 33: Path with complexity level 2: Still a relatively simple line. Anaddition level of complexity comes from it’s size, forcing the participantsto zoom in/out on the smartphone.
47

Figure 34: Path with complexity level 3: Here we were interested in theprecision of the tool, and of course the time needed to draw, so we selecteda path which high complexity but still we were not forcing the users zoomin/out.
Figure 35: Area with complexity level 1: Simple area, which can be easilyannotated with each condition.
48

Figure 36: Area with complexity level 2: Still an easy are to annotate, butwith an additional level of complexity brought in by the rounded corners.If the Participant wanted to annotate it very accurately than he/she had tozoom in spending more time with the annotation.
Figure 37: Area with complexity level 3: The most complex park, whichhas even a concave shape.
49

Calculating the precision:
We also had to prepare the system to be able to calculate the precision ofan annotation. Initially we were searching for an efficient algorithm whichcan compare two polygons and tell us how similar are they. There were onefamous algorithm called $1, which is used as a symbol recognizer, and givesa score between 0 and 1 (0 means not match has found, 1 perfectly similar) tothe similarity of two polygons. Since it is designed for recognizing symbolsregardless of their size, position, and angle, it has to make some geometricaltransformations both on the sample data and on the templates too. Thesetransformations are not useful for us, since we already know that position,angle and size will and should be the same. Finally we have decided torewrite the algorithm, such as it skips the geometrical transformations andit gives simply a score grater than 0 (in our case 0 means the perfect match),to be able to calculate the smallest differences between the template and theannotation made by the participant. In the table below you can find someexample values of precision.
Accuracy Description0-1 The sample almost perfectly matches. This is
very rare, it appears only at very simple shapesonly
1-2 Very precise.2-3 Precise3-4 Acceptable4-6 Quite inaccurate, but still recognizable6-10 Inaccurate, maybe the annotation contains
some points which were added by accident.10+ Annotation error.
Table 1: Since we have rewritten the $1 algorithm to our needs, we alsochanged the scale on which the accuracy was measured. Here we can seesome examples of the measured accuracy and the meaning of this score.
You can find more details about the modified $1 algorithm in the sec-tion 5.6.2.
6.1.4 Evaluation run
We took care of each participants to get the same information about the sys-tem and the same training, so we prepared the exact steps of an evaluationrun. You can read this document in the annex F.
Note: An evaluation took on average about 45-60 minutes.
50

Figure 38: Red marker indicates the template, while the blue one the anno-tated area with touchpad.
In the previous section we discussed about how we prepared the eval-uation by defining what and how to measure, we also discussed about theselection of participants and how we orgranized them into different controlgroups. We also have discussed about how we prepared the system for theevaluation to be able to analyze the data. Now in this section first we willtalk about how we prepared for the analysis, than later on in a differentsection about the analysis itself, where we will speak about the concreteresults.
6.2 Preparation of data
After finishing the evaluation with every participants, in the database wehad more than 600 annotations saved. This is because during the trainingwe asked the users to save some annotations (path between train stations,an example are etc. see section 6.1.1), and 6 more annotation / user with eachcondition. Clearly in this data we have some annotations which shouldn’t
51

be taken into consideration, and we expect that we will have some outlierswhich will have negative effect on the precision of the measurement. Let’ssee in more details how we manipulated the raw data gathered from theparticipants.
Calculating the precision: As we have seen already we used a modified
version of the $1 algorithm to rate the accuracy of an annotation. We haditerate through all the annotations trying to recognize the path or areadrawn, and give a score to their accuracy. We saved this data to databasenext to the annotations.
Automatic and manual error detection:
We had at the beginning more than 600 annotations, from which only378 valid annotations are expected (3 paths + 3 areas * all the 3 condition *21 participants). We had to delete those annotations which had been doneduring the training, and some annotations which were saved mistakenly.Furthermore we had a couple of annotations which were so inaccuratethat we considered them as outliers (it occured only a few times). Theseannotation had been scored with more than 10.
After filtering out every annotations we made a last manual check (oneby one we displayed them to see if the array of points contained somepoints which shouldn’t be there). After the automatic and manual filteringwe remained with 341 valid annotations.
Delivering everything to database:
During the evaluation we had not just saved the strokes but measuredthe time needed to perform the tasks, and we had an evaluation formcollecting the participant’s subjective experience during the evaluation. Forthis we had created two more database tables.
6.3 Analysis
This section is the focal point of the whole thesis, here we will discuss aboutthe results of the measurements and the evaluation forms. First we willstart to analyze the time needed to perform the tasks, then we will analyzethe accuracy of the strokes, finally we will see the results about the userevaluation.
6.3.1 Time
For each of the conditions we asked the users to draw 6 strokes (3 pathsand 3 areas) with increasing level of difficulty. For each of the strokes we
52

measured the time elapsed between the moment when they started thestroke and when they finished it. For this we used a chronometer with anaccuracy of a hundredth of a second.
Significance:
Before we analyze the different user groups, and draw some conclusions,let’s see if the data is significant or not. On the Fig. 39 we can see the boxplotof the three conditions. By experience we saw that the most complex pathwas a very good indicator to compare the accuracy of each conditions, hencewe will use the level 3 times to remain consistent.
Digital pen Stylus Touchscreen
1020
3040
50
Tim
e ne
eded
to a
nnot
ate
the
path
leve
l 3 in
sec
onds
Figure 39: Boxplot of the level 3 times in terms of each condition
We run a paired t-test to see if there are any significant difference betweenthe samples, and we found as we expected the digital pen and stylus inputsare significantly different (p is 0.01), but the digital pen and touchscreenpair and stylus and touchscreen pairs are not (p is 0.11 and 0.26).
53
User groups:
Let’s see the time results of each conditions in terms of experience withcomputers (see Fig. 40). The first thing what we can observe is that the timeneeded for the different groups relates to our expectations: the beginnerswere slower with each condition than the experts and intermediates. In caseof the digital pen this time difference was not that huge since the digital penhighly resembles to the ordinary pen.
Figure 40: Compare the time needed to perform the tasks, in case of eachcondition in terms of computer experience.
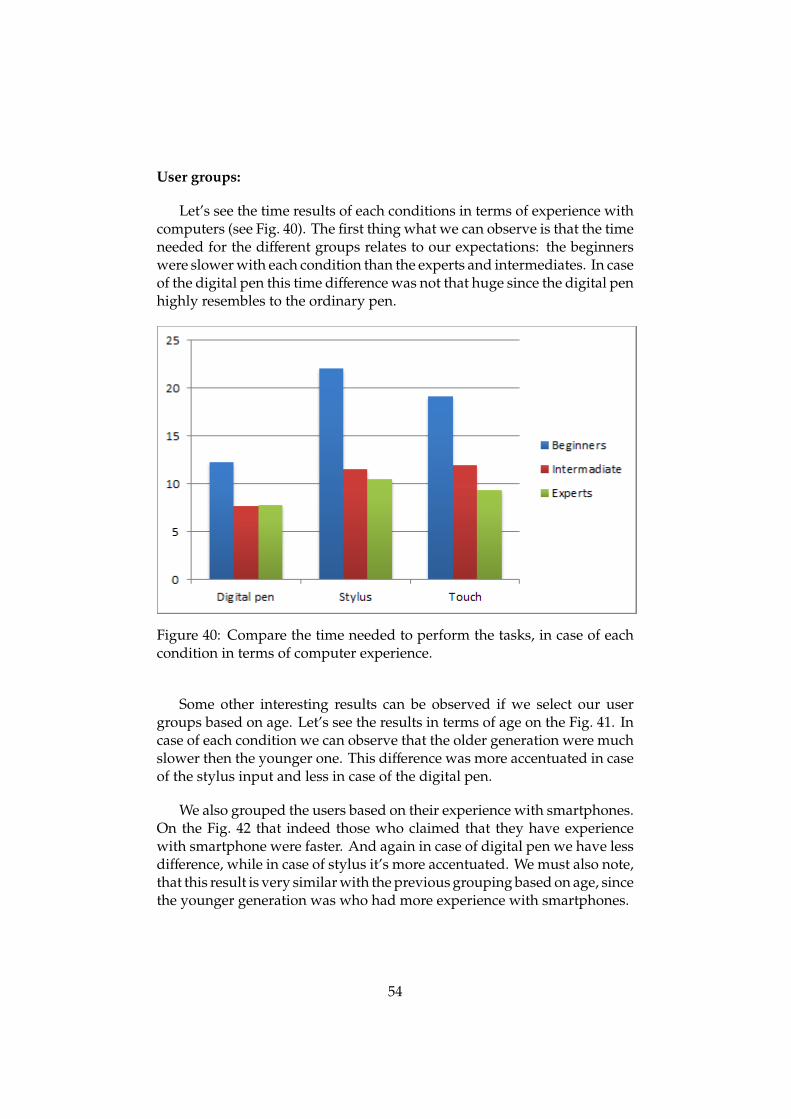
Some other interesting results can be observed if we select our usergroups based on age. Let’s see the results in terms of age on the Fig. 41. Incase of each condition we can observe that the older generation were muchslower then the younger one. This difference was more accentuated in caseof the stylus input and less in case of the digital pen.
We also grouped the users based on their experience with smartphones.On the Fig. 42 that indeed those who claimed that they have experiencewith smartphone were faster. And again in case of digital pen we have lessdifference, while in case of stylus it’s more accentuated. We must also note,that this result is very similar with the previous grouping based on age, sincethe younger generation was who had more experience with smartphones.
54
Figure 41: Compare the time needed to perform the tasks, in case of eachcondition in terms of the user age.
Figure 42: Compare the time needed to perform the tasks, in case of eachcondition in terms of the participants experience with smartphones.
6.3.2 Accuracy
We saw how much time it took the annotation, now let’s see the samestatistics about the accuracy of the annotation.
55

Significance:
First let’s see the accuracy on the boxplot below (Fig. 43). As we canexpect from the boxplot there is a significant difference between the accu-racy of digital pen and stylus (p = 0.0002) and between digital pen andtouchscreen inputs (p = 0.0005).
Digital pen Stylus Touchscreen
23
45
67
8
Acc
urac
y of
the
leve
l 3 p
ath
Figure 43: Boxplot of the level 3 times in terms of each condition
User groups:
Now let’s see the results based on user group experience. On the bar-chart below you can see the accuracy of each conditions in terms of thecomputer experience(Fig. 44). Before we analyze the data we have to notethat based on the average accuracy, although digital pen’s accuracy is ingeneral better than the other two conditions accuracy, in general we found
56

that each conditions accuracy is acceptable. From the diagram we canconclude the same results, what we have accepted from the boxplot. Thedigital pen itself was a much more accurate input device than the othertwo. There is no significant difference between user groups with differentcomputer experience. Although the beginners seem a little bit more accuratewe cannot generalize anything from this, since on one hand they were muchslower than the intermediates and experts, and on the other hand the samplesize was not as large (only 7 beginners were evaluated).
Figure 44: Accuracy of each conditions in terms of the computer experience.
There was no significant difference between stylus and touchscreen in-puts in general, but we experienced in general that the beginner participantswere using the stylus with difficulty. They didn’t know how to keep thestylus properly, and they made more mistakes too.
As we mentioned in the previous measurement, the path level 3 was agood example to measure the accuracy of conditions. Let’s see the meanof each conditions (table 2), and relate with the sample values mentionedin the table 1. We can conclude that the accuracy of the digital pen is verygood, while touchscreen and stylus were still acceptable, but less accurate.
Just as in case of the time, we also analyzed the data in terms of par-ticipants’ age and experience with smartphones (see Fig. 45 and Fig. 46).Surprisingly these values were very close to each other, we cannot observeany significant difference. We expected that the younger generation will be
57

Condition Average accuracyDigital pen 2.35Stylus 4.37Touchscreen 4.14
Table 2: The average accuracy of the conditions in case of the path level 3annotation.
more precise than the older one. It seems that the older generation althoughwas slower but, they had the same accuracy as the younger generation.
Figure 45: Accuracy of each conditions in terms of the participants age.
58
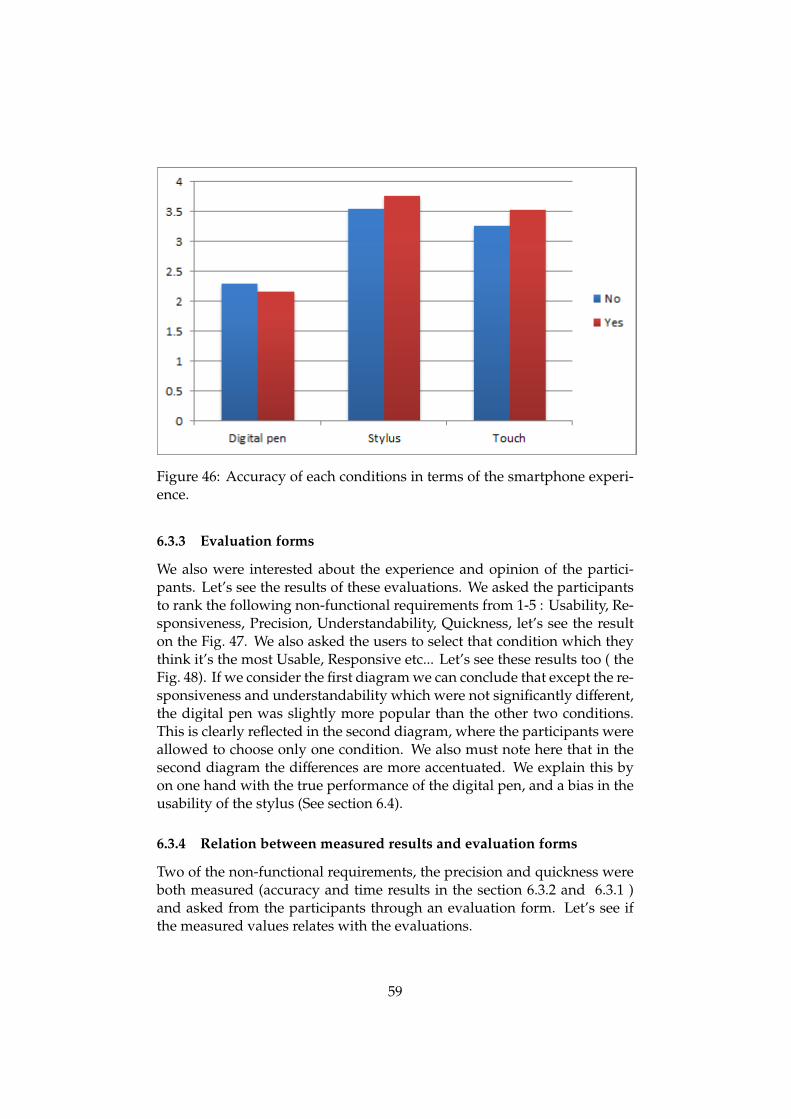
Figure 46: Accuracy of each conditions in terms of the smartphone experi-ence.
6.3.3 Evaluation forms
We also were interested about the experience and opinion of the partici-pants. Let’s see the results of these evaluations. We asked the participantsto rank the following non-functional requirements from 1-5 : Usability, Re-sponsiveness, Precision, Understandability, Quickness, let’s see the resulton the Fig. 47. We also asked the users to select that condition which theythink it’s the most Usable, Responsive etc... Let’s see these results too ( theFig. 48). If we consider the first diagram we can conclude that except the re-sponsiveness and understandability which were not significantly different,the digital pen was slightly more popular than the other two conditions.This is clearly reflected in the second diagram, where the participants wereallowed to choose only one condition. We also must note here that in thesecond diagram the differences are more accentuated. We explain this byon one hand with the true performance of the digital pen, and a bias in theusability of the stylus (See section 6.4).
6.3.4 Relation between measured results and evaluation forms
Two of the non-functional requirements, the precision and quickness wereboth measured (accuracy and time results in the section 6.3.2 and 6.3.1 )and asked from the participants through an evaluation form. Let’s see ifthe measured values relates with the evaluations.
59

We concluded form the measurements that the accuracy of the digitalpen was significantly better than the other two conditions’ accuracy. Basedon the results of the evaluation forms we can conclude the same: 18 par-ticipants were selecting digital pen as the most accurate device, in contrary
Figure 47: The rate from 1-5 to each non-functional requirements.
Figure 48: The rate from 1-5 to each non-functional requirements.
60

with 3 to stylus and nobody voted for touchscreen.
The same observations can be made on quickness of conditions. Againin case of digital pen we have shown that it was significantly quicker thanthe other two. This is also reflected by the evaluation forms results: 17participants voted for the digital pen as the quickest input device for stokedata, while only 4 of them voted for stylus and only two for touchscreen.
6.3.5 Mixing paper and digital user interface
During the evaluation we observed an interesting phenomenon. In case ofmany participants we observed that sometimes they mixed up the paperinterface with the digital one. Sometimes they pushed the paper with finger,trying to rate a path, and sometimes they wanted to push the buttons onthe touchscreen with the digital pen. Since it was not part of the plannedmeasurement we didn’t pay attention to it, just later on we realize theimportance of this phenomenon, and another research can be done on howthe different environments can be combined together.
6.4 Biases in the measurement
Bias introduced by the system:
Although we put huge efforts to make the system as usable as possiblewe still had to make some compromises like for example the saving of anannotation using digital pen. Since the annotation first must have beentransfered to the phone, and then could be saved we had to decide whetherthis should be included or not. Since the way of sending data to the phonefrom digital pen is a clear bias of the system, (maybe in a couple of monthsa new series of digital pen would came which can stream it’s data a witha wireless technology) we decided to not to measure it, and focus themeasurement on the annotation task only (we stopped the chronometerwhen the user finished the drawing).
Another bias what we experienced is that since only one of the par-ticipants had previous experience with the digital pen, it was a very newtechnology what amazed almost everybody, especially the precision of thepen. Our experience was that it influenced their subjective opinion aboutfor example the responsiveness. And although many of them have men-tioned that the digital pen seemed highly usable, and they still would preferusing the stylus or touchscreen (simply because there the map is dynamic,even if these conditions are not that precise), they voted with higher markfor the digital pen.
61

Another bias which also influenced the scores is that, it was not aseasy to learn how to use the stylus of the Galaxy Note. None of the haveused Galaxy note before, and only 2-3 of them has used stylus before, theydidn’t knew in what angle they should keep in their hands, how to doubleclick with them, how to avoid clicking with it using a function button (thestylus has another button which enables the users to access some otherfunctionalities of the phone. In this evaluation we didn’t use any of them),and finally how hard they should press. This also affected heavily not justthe measured values (accuracy, time, nr. of mistakes), but their subjectiveopinion. We experienced that when the participants had to select the mostusable condition, they tended to not to select the stylus.
Learning effect:
So far we have defined the concrete steps of the measurement and whatwe measured exactly at these elementary tasks. Since the tasks were veryeasy a strong learning effect was present. We tried to overcome on this effectby randomizing the order of the conditions of which the participants madethe evaluation. We also had to make sure that the participants are isolatedfrom each other, so no participants could see the tasks, and learn them bywatching other participants. As the coordinators, we also had to be surethat each participants gets the same amount of explanations and time to fortraining.
Language:
The language was a bias also, since some of the participants was Hun-garian, without any English knowledge. We overcome on this bias, byinventing very similar sentences at the writing comment part (”Two trainstations” was translated to ”Ket vonat megallo”, and ”This is my favoritepark” to ”Ez az en kedvenc parkom”)
6.5 Summary
In this section we have analyzed both measured data and the data fromthe evaluation forms. As we expected the digital pen was dominating theother two conditions in terms of accuracy and speed, but in contrary withour expectations we found that the stylus was not that accurate. I fact thetouchscreen seemed a little bit more accurate, which was reflected both themeasured values and the participants’ opinion.
We also expected that there would be a significant difference in accuracyof the touchscreen / stylus and digital pen in terms of the participants’ ex-perience with smartphones or in age, but it turned out that there is no. Thiscan be explained with the significantly higher time needed to accomplish
62

the task with the same level of accuracy, so the user has chosen accuracyover time.
Observations made during the evaluation process:
After the evaluation based on the participants feedback some possibleimprovements can be noted. Fortunatley the system was carefully devel-oped, modularized and the source code was well documented in order toallow further modifications ether by our team, or by a different team.
• Option to delete the last point from the path: the system currentlyhas only one option to delete, but it deletes every point from the map.This option was the most disturbing for most of the participants,since when they made a mistake they had to start everything from thebeginning.
• One source of the inaccuracy of the digital pen and the stylus was thatdifferent participants held the pen and the stylus in different angles.From the evaluation point of view it would be better if before the startof the evaluation there would be a small calibration, where the systemlearns the users preference to hold the stylus.
• Now on the smartphone the areas can be selected if the user double-taps on the screen (the path is automatically closed), but it was manda-tory that the point where the user makes a double-tap must be in theedge of the area. An improvement would be that let the user todouble-tap freely for example inside the area. We also observed thatsome of the participants were slower at double tap, or the second tapwas slightly misplaced. This can be modified too in the future.
• The area selection with digital pen was more obvious for the usersthan with stylus or touchscreen, but sometimes it happened that theypicked up the pen for a short period of time, and the system consideredit as two independent strokes were created. The usability of thesystem would improve if it would consider these strokes as one singlecontinuous stroke.
• The performance of the pen is not that good, here we can think aboutfurther optimizations.
• We run the accuracy after the evaluation. Since the algorithm is veryquick, the annotations can be check in runtime giving a better feedbackto the user.
63

7 Conclusion and future work
7.1 Project summary
We have seen how we documented ourselves about the state of the art, tofind the research area which is not yet explored. We found that althoughmany project has been done with digital pen, and there were a couple ofthem with map interaction none of the compared and evaluated with stylusand touchscreen inputs. We have decide to make this evaluation on a digitaland printed map, allowing the participants to annotate places, paths andareas. They could add comments to it, rate, attach an image, and save themon a server, to allow the searching among them.
After we defined both the functional and non-functional requirementsof the system, we could make the system architecture and system design.In meantime we obtained a Livescribe Exho Smartpen, and a SamsungGalaxy Note, and we started the initial tests, and the learning of the Live-scribe and Android SDKs. During development we faced with many issueswhich could be solved partly (for example the data streaming from digitalpen to smartphone), but finally in two three iterations we could finish theimplementation part. After that we identified those aspects of the projectwhich can be compared with each condition (for example although we im-plemented the option to take an image it was not part of the evaluation),we prepared the evaluation itself, creating a measurement part and askingthe users to fill out an evaluation form too.
We estimated that 21 participants would be enough to evaluate the con-ditions, so we selected 21 persons taking into consideration their computerexperience (7 beginners, 7 intermediates and 7 experts). Finally when wefinished the evaluations we introduced everything to a database, and weimplemented also an algorithm to calculate the accuracy of each strokecreated by the users, preparing the system to analyze the data easily.
7.2 Evaluation results
One part of the results met with our expectations. The digital pen was waymore precise and faster than the other two conditions, and the acceptancefrom the users were very good too. Even the older generation could use itwithout problems (this is reflected by their accuracy too), even though theiraverage annotation time was much higher.
Stylus input however was a surprise for us. We expected that it will bemuch more accurate and faster than the touch input, but this was not thecase. In the section 6.4 we listed those properties of the stylus which wethink that it influenced the users. We also expected that those participants
64

who had previous experience with smartphones will be more accurate thanthe others, but again this was not reflected from the measurements.
7.3 Further development
• We mentioned those technical issues what we faced with during theintergeneration of the Livescibe digital pen with the smartphone. An-other digital pen which has wireless access to other resources, wouldeliminate the need of the static USB connection, and would allow thedata streaming which would eliminate the additional synchronizationstep, what we needed to include.
• We see a good potential in the crowdsourcing aspects of the project.We prepared the system to integrate with other crowdsourced systemby using inkML standard. We look forward to see improvementshere.
• Since we wanted to give the participants a very practical scenario(not just simple annotations on a map), we implemented additionalfunctionalities, which were not evaluated directly, but improved theusability of the system since they found it useful what they would usein their daily life. These functionalities were the possibility to attachan image, to search among the annotations, to attach a timestampand rate the annotation. These were only a small fraction of thosefunctionalities can be integrated with the system.
• The built in hand writing recognition was very poor in both speedand quality. This also should be improved in the future, maybe byselecting another pen, or using another software.
• The user management can also be improved, allowing the users tolimit the search results based on users who made them.
Future improvements in evaluation:
Another improvement can be the evaluation of the system with moreparticipants, maybe involving more complex scenarios with more func-tionalities, and measuring more attributes, like the number of errors madeduring a specific tasks.
65

8 Appendix
A executeCommand() and getTextContent() functions
The executeCommand() is a predefined penlet function which is beingcalled on desktop application request. getTextConten() is an auxiliaryfunction which reads the content of a file (permanent storage). This filecontains the serialized inkML annotations.
/**
* Handles the infromation tranfer from pen to an external application
* Usually a desktop application calls it
*/
public String executeCommand(Command arg0, DataSender arg1) {
// reset last result
String result = getTextContent();
//play click sound
SoundResource sound =
context.getResourceBundle().getSoundResource("SL_Next");
this.player.play(sound);
return result;
}
/**
* Reads the data of the file test.txt, and returns it as
* a String object. This wile contains the inkML representation
* of the annotations.
* @return - inkML representation of the annotations
*/
private String getTextContent()
{
String lastResult = "";
try {
PenletStorage store = this.context.getInternalPenletStorage();
is = new DataInputStream(store.openInputStream("test.txt"));
lastResult = is.readUTF();
is.close();
} catch (IOException e) {
// TODO Auto-generated catch block
e.printStackTrace();
this.logger.debug("xception" + e.toString());
}
return lastResult;
66

}
Listing 3: The modified recognizer function, of the $1 implementation.
B Code samples which handles penlet events
/**
* Called when a new stroke is created on the pen.
* We make a distinction between search mode and annotation mode.
* In search mode only an are is allowed (only one stroke, a cosed path)
* in annotation mode we allow many strokes.
*
* We also have to recognize wether a path or an area was created
* The stroke information is added to the ICRContext
*/
public void strokeCreated(long time, Region regionId , PageInstance page) {
if (MapUtils.isValidStroke(annotationUtils.temporaryStroke))
{
switch (annotationUtils.mode) {
case MapConstants.ANNOTATION_MODE:
if (MapUtils.isPath(annotationUtils.temporaryStroke))
{
this.label.draw("Path added( " +
annotationUtils.temporaryStroke.size() + " points)",true);
this.logger.debug("Path stored");
//play click sound
SoundResource sound = c
ontext.getResourceBundle().getSoundResource("SL_CA");
this.player.play(sound);
}
else
{
this.label.draw("Area added( " +
annotationUtils.temporaryStroke.size() + " points)",true);
this.logger.debug("Area stored");
//play click sound
SoundResource sound =
context.getResourceBundle().getSoundResource("SL_CA");
this.player.play(sound);
}
67

break;
case MapConstants.SEARCH_MODE:
if (MapUtils.isPath(annotationUtils.temporaryStroke))
{
this.label.draw("You must select an area",true);
//play click sound
SoundResource sound =
context.getResourceBundle().getSoundResource("SL_Error");
this.player.play(sound);
}
else
{
//play click sound
SoundResource sound =
context.getResourceBundle().getSoundResource("SL_CA");
this.player.play(sound);
this.label.draw("Search area recorded( " +
annotationUtils.temporaryStroke.size() + " points)",true);
this.logger.debug("Area stored");
// remove all the other strokes
annotationUtils.removeAllPoints();
}
break;
default:
break;
}
// we have most probably an annotation
// so we will add to the annotation list
annotationUtils.applyTemporaryStroke();
reserializeAnnotation("stroke created");
}
else
{
this.logger.debug("Stroke sent to text recognizer");
this.icrContext.addStroke(page, time);
}
strokeCreatedEventDelegator(time, regionId, page);
}
/**
* When the user pauses (pause time specified by the wizard),
* all strokes in the ICRContext are cleared
68

*/
public void hwrUserPause(long time, String result) {
this.icrContext.clearStrokes();
// log the recognized word
this.logger.debug("Text recognized on Pause: " + result);
// the point can be recognized as a single
// tap, so we will not take into consideration
if (!result.equals("i") && !result.equals("I"))
{
//play click sound
SoundResource sound =
context.getResourceBundle().getSoundResource("SL_CA");
this.player.play(sound);
this.logger.debug("");
this.logger.debug("");
this.logger.debug("");
this.logger.debug("Text recognized: " + result);
// append teh word to the model
annotationUtils.appendComment(result);
//display it on the pen
this.label.draw(annotationUtils.getComment(),true);
// reserialize everything
reserializeAnnotation("User pause");
}
}
/**
* A single Tap on the map?
*/
public void singleTap(long time, int x, int y) {
// add the point
this.logger.debug("Single tap: X " + x + " Y: " + y);
// we are sure that a stroke is not created
annotationUtils.flushTempraryCoordinateStorage();
// if the tap is outside of the map area, than we will have to stop it
if (x < MapConstants.PAPER_MAX_Y)
return;
if (y > MapConstants.PAPER_MAX_X)
return;
//play click sound
69

SoundResource sound =
context.getResourceBundle().getSoundResource("SL_Click1");
this.player.play(sound);
annotationUtils.addPoint(new Coordinate(x, y));
this.label.draw("Point added ( " +
annotationUtils.getNrOfPoints() + " )");
reserializeAnnotation("Single tap");
}
/**
* A double tap on the map
*/
public void doubleTap(long time, int x, int y) {
// we are sure that a stroke is not created
annotationUtils.flushTempraryCoordinateStorage();
// remove the last two points because of teh double tap
annotationUtils.removeLastStroke();
annotationUtils.removeLastStroke();
// display the sumary
this.logger.debug(annotationUtils.getSummary());
this.label.draw(annotationUtils.getSummary(), true);
// we have to specially refresh here,
// because the user pause comes before the double tap
reserializeAnnotation("Double tap");
}
/**
* Example pen down event handler on the rate 5 star
* @param time - timestamp when the pen event was generated
* @param region - region id of the rate 5 ergion
* @param page - on which page the event occured
* @return
*/
protected boolean onRate5PenDown(long time, Region region, PageInstance page) {
this.label.draw("Rate: 5");
// set the rate
annotationUtils.setRate(5);
// reserialize the annotation
70

reserializeAnnotation("rate");
//play click sound
SoundResource sound =
context.getResourceBundle().getSoundResource("SL_IncSpeed");
this.player.play(sound);
return true;
}
Listing 4: The modified recognizer function, of the $1 implementation.
C ApplicationModel
/**
* Singleton model implementation for holding the application wide varaibles
* @author Becze
*
*/
public class ApplicationModel {
/***********************
* Attributes
***********************/
// user contants
public int userId;
public String condition;
// tabhost (to control the tabs form the mdoel
public TabHost tabHost;
public int viewMode = 0;
// sample paths
public Annotation samplePaths;
// display a list of paths, here temporary a list of paths are a list of point from the $1 library
// this was done only to test the $1 algorithm , and has no use
public ArrayList <Vector<Point>> helperDisplay;
// new annotation is what the user creates
public Annotation newUserAnnotation;
71

// based on this annotation searches the user
public Annotation searchByAnnotation;
// the last search results are stored here
public ArrayList <Annotation > searchResults;
// we will save the temprary stroke representation of the annotation
public String tmpXML;
/***********************
* Singleton implementation
***********************/
private static ApplicationModel _instance;
/**
* singleton class initialization
* @return
*/
public static ApplicationModel get_instance() {
if(_instance == null)
_instance = new ApplicationModel();
return _instance;
}
/**
* Initialize the model
*/
public ApplicationModel() {
// intiialize the annotations
searchByAnnotation = new Annotation();
newUserAnnotation = new Annotation();
samplePaths = new Annotation();
searchResults = new ArrayList <Annotation >();
helperDisplay = new ArrayList <Vector<Point >>();
// reset the annotation
searchByAnnotation.reset();
newUserAnnotation.reset();
}
72

}
Listing 5: The modified recognizer function, of the $1 implementation.
D Recognizer class
This class is responsible for recognizing and scoring the strokes created bythe participants.
package be.ac.vub.recognizer.interaction.dollar;
import java.util.*;
import be.ac.vub.model.ApplicationModel;
public class Recognizer
{
//
// Recognizer class constants
//
ApplicationModel model = ApplicationModel.get_instance();
int NumTemplates = 16;
public static int NumPoints = 128;
public static double SquareSize = 250.0;
double HalfDiagonal = 0.5 * Math.sqrt(250.0 * 250.0 + 250.0 * 250.0);
double AngleRange = 45.0;
double AnglePrecision = 2.0;
public static double Phi = 0.5 * (-1.0 + Math.sqrt(5.0)); // Golden Ratio
public Point centroid = new Point(0, 0);
public Rectangle boundingBox = new Rectangle(0, 0, 0, 0);
int bounds[] = { 0, 0, 0, 0 };
Vector<Template> Templates = new Vector(NumTemplates);
public static final int GESTURES_DEFAULT = 1;
public static final int GESTURES_SIMPLE = 2;
public static final int GESTURES_CIRCLES = 3;
public Recognizer()
{
this(GESTURES_DEFAULT);
}
73

public Recognizer(int gestureSet)
{
switch(gestureSet)
{
case GESTURES_DEFAULT:
loadTemplatesDefault(); break;
}
}
void loadTemplatesDefault()
{
Templates.addElement(loadTemplate("Path Level 1", TemplateData.p_l1, false));
Templates.addElement(loadTemplate("Path Level 2", TemplateData.p_l2, false));
Templates.addElement(loadTemplate("Path Level 3", TemplateData.p_l3, false));
Templates.addElement(loadTemplate("Path Level 1 r", TemplateData.copyReversed(TemplateData.p_l1), false));
Templates.addElement(loadTemplate("Path Level 2 r", TemplateData.copyReversed(TemplateData.p_l2), false));
Templates.addElement(loadTemplate("Path Level 3 r", TemplateData.copyReversed(TemplateData.p_l3), false));
Templates.addElement(loadTemplate("Area Level 1", TemplateData.a_l1, false));
Templates.addElement(loadTemplate("Area Level 2", TemplateData.a_l2, false));
Templates.addElement(loadTemplate("Area Level 3", TemplateData.a_l3, false));
Templates.addElement(loadTemplate("Area Level 1 r", TemplateData.copyReversed(TemplateData.a_l1), false));
Templates.addElement(loadTemplate("Area Level 2 r", TemplateData.copyReversed(TemplateData.a_l2), false));
Templates.addElement(loadTemplate("Area Level 3 r", TemplateData.copyReversed(TemplateData.a_l3), false));
}
Template loadTemplate(String name, int[] array, boolean display)
{
return new Template(name, loadArray(array, display));
}
Vector loadArray(int[] array, boolean display)
{
Vector v = new Vector(array.length/2);
for (int i = 0; i < array.length; i+= 2)
{
Point p = new Point(array[i], array[i+1]);
v.addElement(p);
}
// System.out.println(v.size() + " " + array.length);
if(display)
model.helperDisplay.add(v);
74

return Utils.Resample(v, NumPoints);
}
public Result Recognize(Vector points)
{
// Forcing the number of point in the sample to be constant
points = Utils.Resample(points, NumPoints);
// display the sample
model.helperDisplay.add(points);
// the template id of the best match
int templateId = 0;
// distance between the template and the sample
double distance = Double.MAX_VALUE;
for (int i = 0; i < Templates.size(); i++)
{
Template template = ((Template)Templates.elementAt(i));
double d1 = Utils.rotatedPathDistance(points, template.Points);
double d2 = Utils.rotatedPathDistance(template.Points, points);
// get the min of the two distances
double d = (d1 < d2)? d1:d2;
if (d < distance)
{
distance = d;
templateId = i;
}
}
// we just devide it with 100 to fit into the interval [0-10]
double score = distance / 100;
//display the template
model.helperDisplay.add(((Template)Templates.elementAt(templateId)).Points);
return new Result(((Template)Templates.elementAt(templateId)).Name, score, templateId);
};
int AddTemplate(String name, Vector points)
{
Templates.addElement(new Template(name, points));
return Templates.size();
75

}
int DeleteUserTemplates()
{
for (int i = Templates.size()-NumTemplates; i > 0; i--)
{
Templates.removeElementAt(Templates.size()-1);
}
return Templates.size();
}
}
Listing 6: The modified recognizer function, of the $1 implementation.
E PHP scripts
synchronizePenlet.php:
<?php
// we will open the synchronization file, and based in it’s content we will
// will return it
$file=fopen("penletData.txt","w+");
// we will initialize the file status
fwrite($file, "Status: dataRequested");
fclose($file);
/*
* Now we will have to wait until the data is written into the file, so
* we will loop for 5 seconds in each 100ms we read the content of the file
* if the status has changed to ready than we will return it to the client
*/
$data = "noData";
// check the file content
for ($i = 0; $i < 50; $i++)
{
usleep(100000);
// we will initialize the file status
$statusLine = file_get_contents("penletData.txt");
76
if(substr_count($statusLine , "</ink>") != 0)
{
$data = $statusLine;
break;
}
}
print(json_encode($data));
?>
Listing 7: The modified recognizer function, of the $1 implementation.
saveannotationHandler.php:
<?php
/*
* We will save the annotation to the database
*/
mysql_connect("127.0.0.1","root","");
mysql_select_db("trip_manager");
$query = ’INSERT INTO annotations (points, comment, rate, user_id, ‘condition ‘) VALUES ("’.$_POST[’points’].’",
"’.$_POST[’comment’].’",
’.$_POST[’rating’].’,
’.$_POST[’user_id’].’,
"’.$_POST[’condition’].’"
)’;
$sql=mysql_query($query);
print $query;
mysql_close();
Listing 8: The modified recognizer function, of the $1 implementation.
getAnnotation.php:
<?php
mysql_connect("127.0.0.1","root","");
mysql_select_db("trip_manager");
try{
77

$query = ’SELECT *
FROM annotations
WHERE id =’. $_GET[’id’];
}
catch (Exception $e)
{
$query = ’SELECT *
FROM annotations’;
}
$sql=mysql_query($query);
while($row=mysql_fetch_assoc($sql))
$output[]=$row;
print(json_encode($output));
mysql_close();
?>
Listing 9: The modified recognizer function, of the $1 implementation.
deleteAnnotation.php:
<?php
/*
* We will save the annotation to the database
*/
mysql_connect("127.0.0.1","root","");
mysql_select_db("trip_manager");
$query = ’UPDATE annotations SET comment="invalidated",accuracy=9999 WHERE id = ’ . $_POST[’id’];
$sql=mysql_query($query);
print $query;
mysql_close();
Listing 10: The modified recognizer function, of the $1 implementation.
saveAnnotationAccuracy.php:
<?php
/*
78
* We will save the annotation to the database
*/
mysql_connect("127.0.0.1","root","");
mysql_select_db("trip_manager");
$query = ’UPDATE annotations SET shape="’. $_POST[’name’] .’",accuracy=’. $_POST[’score’] .’ WHERE id = ’ . $_POST[’id’];
$sql=mysql_query($query);
print $query;
mysql_close();
Listing 11: The modified recognizer function, of the $1 implementation.
F Evaluation form
form.pdf
79

form.pdf
Evaluation proposal
Szabolcs Becze
June 7, 2012
This is a summative(after development), cooperative evaluation to mea-sure the usability of the digital pen and paper, stylus and touch pad inputmethods. Each participant will get a unique identifier and each annotationwill be saved into the database, so we can evaluate them later on.
1 Introduction
Purpose: The introduction of both the paper and smart-phone interfacesto the participant. To show them the basic functionalities of the digitalpen and show them a simple demonstration of the data transfer betweenthe pen and smart-phone. It will also be highlighted that the purpose ofthis evalutation is to measure the usability of the paper and smart-phoneinterfaces and to compare the different input methods, and not to evaluatetheir performance.Description: Three simple scenarios will be shown: A simple annotationa path, an area and simple search scenario.Duration: 3-4 minutes.
2 First part of the evaluation
Purpose: To evaluate the UI and train the participants, by giving themsimple tasks. We are noting whether the task has been accomplished or not,and we are also counting the number of errors they made.Description: The following three scenarios are considered:
1. simple scenario:
− Create a path between two train stations (Station Brussel-Schumanand Station Brussel-Luxemburg) in the city center.
− Attach the following comment: ”Path between two train sta-tions.”
− Save the annotation.
1

form.pdf
2. Complex scenario:
− Annotate the area of the park de Brussels(Warandepark).
− Attach the following comment: ”This is the metro station Merode”.
− Rate it with 5 stars.
− Delete the previous comment and attach a new one: ”This is apark”.
− Save the annotation.
3. Search scenario:
− Select the search mode.
− Select an area which contains the previous two annotations.
− Filter the search such that the search results must contain theword ”park”.
− Submit the search.
Duration: Each participant will do each scenarios from above with allthe three different conditions in a randomized order(digital pen and paper,stylus and touch-pad). The following two tables are filled:
Table 1: Was the scenario accomplished? (Yes-No)
Scenario Digital pen andpaper
Stylus Touch-pad
Simple scenario
Complex scenario
Search scenario
Table 2: How many errors made the participant?
Scenario Digital pen andpaper
Stylus Touch-pad
Simple scenario
Complex scenario
Search scenario
2

form.pdf
3 Second part of the evaluation
Here we would like find out how efficient are the different conditions atmap interactions. We will ask each participant to perform scenarios withincreasing difficulty using each of the input methods, and we will measurethe time needed to perform the task, the number of mistakes what theymade during the task, and using a heuristic function we will calculate arelative accuracy of the drawn shapes.
3

form.pdf
Tas
ks
Dig
ital
pen
and
pap
erS
tylu
sT
ouch
-pad
Tim
eM
ista
kes
Acc
ura
cyT
ime
Mis
take
sA
ccu
racy
Tim
eM
ista
kes
Acc
ura
cyM
arkin
ga
pla
ceon
the
map
Lev
el1
Lev
el2
Lev
el3
Mar
kin
gan
area
onth
em
ap
Lev
el1
Lev
el2
Lev
el3
Wri
tin
ga
com
men
ton
the
map
Tab
le3:
We
are
mea
suri
ng
the
tim
en
eed
edto
per
form
the
task
,th
en
r.of
mis
take
s,an
dth
eac
cura
cyof
the
an
nota
tion
.
4

G Evaluation questionnaire
questionnaire.pdf
84

questionnaire.pdf
Evaluation form of the application 1
Application evaluation form
Participant ID:
With this questionnaire we would like to get feedback about the usability of the application with each of thethree different input methods.
About you
1. Your age:
2. Your gender: 2 Male 2 Female
3. I am: 2 Left handed 2 Right handed
4. My computer experience level is:
2 Beginner
2 Intermediate
2 Expert
5. I have experience with smart-phones (ex. touch, multi-touch): 2 Yes 2 No
6. I have experience with digital pens: 2 Yes 2 No
About the application
7. How would you rate the application from 1-5 (1 - Strongly disagree, 5 - strongly agree).
Digital pen and paperStrongly disagree Strongly agree
1. I found the system usable: 1 2 3 4 5
2. I found the system responsive: 1 2 3 4 5
3. I found the system precise: 1 2 3 4 5
4. I quickly understood the system: 1 2 3 4 5
5. I found the system quick: 1 2 3 4 5
StylusStrongly disagree Strongly agree
1. I found the system usable: 1 2 3 4 5
2. I found the system responsive: 1 2 3 4 5
3. I found the system precise: 1 2 3 4 5
4. I quickly understood the system: 1 2 3 4 5
5. I found the system quick: 1 2 3 4 5
Touch-padStrongly disagree Strongly agree
1. I found the system usable: 1 2 3 4 5
2. I found the system responsive: 1 2 3 4 5
3. I found the system precise: 1 2 3 4 5

questionnaire.pdf
Evaluation form of the application 2
4. I quickly understood the system: 1 2 3 4 5
5. I found the system quick: 1 2 3 4 5
8. Which system was the most easy to use?
2 Digital pen and paper
2 Stylus
2 Touch-pad
9. Which system was the most responsive?
2 Digital pen and paper
2 Stylus
2 Touch-pad
10. Which system was the most precise?
2 Digital pen and paper
2 Stylus
2 Touch-pad
11. Which system was the easiest to understood?
2 Digital pen and paper
2 Stylus
2 Touch-pad
12. Which system was the quickest?
2 Digital pen and paper
2 Stylus
2 Touch-pad
12b. Write here you observations and suggestions:

References
[1] Ink markup language (inkml), w3c recommendation 20 september2011. http://www.w3.org/TR/InkML/, 2011.
[2] $1unistroke recognizer in javascript. http://depts.washington.edu/aimgroup/proj/dollar/, 2012.
[3] Anoto. http://en.wikipedia.org/wiki/Anoto, May 2012.
[4] Anoto official website. http://www.anoto.com, May 2012.
[5] Echo smart pen. http://www.livescribe.com/en-us/smartpen/
echo/, May 2012.
[6] Livescribe official website. http://www.livescribe.com/en-us/,May 2012.
[7] Non-functional requirement. http://en.wikipedia.org/wiki/
Non-functional\_requirement, 2012.
[8] Point in polygon. http://en.wikipedia.org/wiki/Point\_in\
_polygon, 2012.
[9] Touchscreen. http://en.wikipedia.org/wiki/Touchscreen, 2012.
[10] Tripadvisor’s official website. http://www.tripadvisor.nl/, 2012.
[11] Joerg Arzt-Mergemeier, Willi Beiss, and Thomas Steffens. The digitalvoting pen at the hamburg elections 2008: electronic voting closestto conventional voting. In Proceedings of the 1st international conferenceon E-voting and identity, VOTE-ID’07, pages 88–98, Berlin, Heidelberg,2007. Springer-Verlag.
[12] Naser Avesta. Performance evaluation of digital pen for capturingdata in land information systems. 2011.
[13] Michael Grossniklaus Rudi Belotti Corsin Decurtins Beat Signer, MoiraC. Norrie and Nadir Weibel. Paperbased mobile access to databases.2005.
[14] Chih-Kai Chang. Augmenting wiki system for collaborative efl read-ing by digital pen annotations. In Proceedings of the 2009 InternationalSymposium on Ubiquitous Virtual Reality, ISUVR ’09, pages 43–46, Wash-ington, DC, USA, 2009. IEEE Computer Society.
[15] Chia-Hao Chuang, Po-Yao Chao, Hsiao-Kuang Wu, and Gwo-DongChen. Integrated textbook: Augmenting paper textbooks with digitallearning support using digital pens. In Proceedings of the Sixth IEEE
87

International Conference on Advanced Learning Technologies, ICALT ’06,pages 613–617, Washington, DC, USA, 2006. IEEE Computer Society.
[16] Raimund Dachselt, Mathias Frisch, and Eike Decker. Enhancing umlsketch tools with digital pens and paper. In Proceedings of the 4th ACMsymposium on Software visualization, SoftVis ’08, pages 203–204, NewYork, NY, USA, 2008. ACM.
[17] Florian Geyer, Daniel Klinkhammer, and Harald Reiterer. Supportingcreativity workshops with interactive tabletops and digital pen and pa-per. In ACM International Conference on Interactive Tabletops and Surfaces,ITS ’10, pages 261–262, New York, NY, USA, 2010. ACM.
[18] Francois Guimbretiere. Paper augmented digital documents. In Pro-ceedings of the 16th annual ACM symposium on User interface software andtechnology, UIST ’03, pages 51–60, New York, NY, USA, 2003. ACM.
[19] Jan Hess, Lin Wan, Volkmar Pipek, and Guy Kuestermann. Usingpaper and pen to control home-it: lessons learned by hands-on ex-perience. In Proceddings of the 9th international interactive conference onInteractive television, EuroITV ’11, pages 203–212, New York, NY, USA,2011. ACM.
[20] Ken Hinckley, Koji Yatani, Michel Pahud, Nicole Coddington, JennyRodenhouse, Andy Wilson, Hrvoje Benko, and Bill Buxton. Pen +touch = new tools. In Proceedings of the 23nd annual ACM symposium onUser interface software and technology, UIST ’10, pages 27–36, New York,NY, USA, 2010. ACM.
[21] Motoki Miura, Susumu Kunifuji, and Yasuyuki Sakamoto2. Practicalenvironment for realizing augmented classroom with wireless digitalpens. In Proceedings of the 11th international conference, KES 2007 andXVII Italian workshop on neural networks conference on Knowledge-basedintelligent information and engineering systems: Part III, KES’07/WIRN’07,pages 777–785, Berlin, Heidelberg, 2007. Springer-Verlag.
[22] Moira C. Norrie, Beat Signer, and Nadir Weibel. Print-n-link: weavingthe paper web. In Proceedings of the 2006 ACM symposium on Documentengineering, DocEng ’06, pages 34–43, New York, NY, USA, 2006. ACM.
[23] Hendro Prastowo. ”digital pen mobile mapping”, mobile mappingusing digital pen & paper technology meets tradition. 2006.
[24] Beat Signer. Interactive paper: Past, present and future. 2008.
[25] Beat Signer, Michael Grossniklaus, and Moira C. Norrie. Interactivepaper as a mobile client for a multi-channel web information system.World Wide Web, 10(4):529–556, December 2007.
88

[26] Jurgen Steimle. Designing pen-and-paper user interfaces for interac-tion with documents. In Proceedings of the 3rd International Conferenceon Tangible and Embedded Interaction, TEI ’09, pages 197–204, New York,NY, USA, 2009. ACM.
[27] Yu Suzuki, Kazuo Misue, and Jiro Tanaka. Stylus enhancement toenrich interaction with computers. In Proceedings of the 12th interna-tional conference on Human-computer interaction: interaction platforms andtechniques, HCI’07, pages 133–142, Berlin, Heidelberg, 2007. Springer-Verlag.
[28] Brecht Van Laethem. Paper-digital maps. 2011.
[29] Sarah Van Wart, K. Joyce Tsai, and Tapan Parikh. Local ground: apaper-based toolkit for documenting local geo-spatial knowledge. InProceedings of the First ACM Symposium on Computing for Development,ACM DEV ’10, pages 11:1–11:10, New York, NY, USA, 2010. ACM.
[30] Brett Wilkinson and Paul Calder. Investigating touch interactions foran augmented world. In Proceedings of the 20th Australasian Confer-ence on Computer-Human Interaction: Designing for Habitus and Habitat,OZCHI ’08, pages 25–32, New York, NY, USA, 2008. ACM.
[31] Ron B. Yeh, Andreas Paepcke, and Scott R. Klemmer. Iterative designand evaluation of an event architecture for pen-and-paper interfaces. InProceedings of the 21st annual ACM symposium on User interface softwareand technology, UIST ’08, pages 111–120, New York, NY, USA, 2008.ACM.
89