Manufacturing Strategy in Context: Environment, Competitive
37
Manufacturing Strategy in Context: Environment, Competitive Strategy and Manufacturing Strategy 1 Peter T. Ward Max M. Fisher College of Business Ohio State University Columbus, OH 43210 [email protected] 614-292-5294 Rebecca Duray College of Business and Administration University of Colorado at Colorado Springs Colorado Springs, CO 80933-7150 [email protected] 719-262-3673 This paper will appear in Journal of Operations Management in Winter 2000. Keywords: Operations strategy; Empirical research 1 We thank Ohio State University's Center for Excellence in Manufacturing Management for financial support. Errors remain the responsibility of the authors.
Transcript of Manufacturing Strategy in Context: Environment, Competitive

Manufacturing Strategy in Context:Environment, Competitive Strategy and Manufacturing Strategy1
Peter T. WardMax M. Fisher College of Business
Ohio State UniversityColumbus, OH 43210
Rebecca DurayCollege of Business and Administration
University of Colorado at Colorado SpringsColorado Springs, CO 80933-7150
This paper will appear in Journal of Operations Management in Winter 2000.
Keywords: Operations strategy; Empirical research
1 We thank Ohio State University's Center for Excellence in Manufacturing Managementfor financial support. Errors remain the responsibility of the authors.
1
Manufacturing Strategy in Context:Environment, Competitive Strategy and Manufacturing Strategy
Abstract
Considering manufacturing strategy in its larger strategic context has been thematic
in conceptual literature in operations but relatively neglected in empirical studies, thus
leaving predominant conceptual models of manufacturing strategy largely untested. This
research develops a conceptual model of manufacturing strategy from the literature and tests
the model using data from a sample of manufacturers in three industries in the United States.
This research contributes to manufacturing strategy literature in four ways. First, it supports
empirically a model of manufacturing strategy that is predominant in the conceptual
literature. Second, it demonstrates that the strategic linkages in manufacturing businesses
are clearer among good performers than poor performers. Third, this research suggests that
competitive strategy acts as a mediator between an organization's environment and its
manufacturing strategy. Fourth, the findings suggest that the relationship between
competitive strategy and performance is mediated by manufacturing strategy. These last two
findings have important implications for approaching research in manufacturing strategy in
the future.
1. Introduction
Research in operations management has been characterized in recent years by an
increasing effort devoted to the study of manufacturing strategy using empirical methods. A
review of the literature reveals that much of this empirical research effort has focused on the
internal consistency of manufacturing strategy (e.g., priorities and programs) and assessing
the performance consequences of such consistency. Surprisingly little empirical research has
addressed the alignment among manufacturing strategy, business-level competitive strategy,
and the competitive enviroment faced by the firm, although much of the conceptual literature
in manufacturing strategy has focused on this issue of alignment (Swink and Way, 1995).

2
Thus the predominant conceptual model of manufacturing strategy that considers
manufacturing in the larger strategic context of the firm has remained largely unsubstantiated
because it has not been adequately tested.
We approach this relatively neglected area by testing empirically an accepted
conceptual model of manufacturing strategy in the context of a sample of firms' competitive
strategies and environments. In essence, we address three issues. First, we ask whether data
collected from a sample of manufacturers are consistent with the model supported by much
of the conceptual literature. We describe that conceptual model in the following section.
Second, we address whether or not manufacturing strategy appears to matter in the larger
context of the firm's environment and competitive strategy. In other words, we test whether
there is a relationship between manufacturing strategy and business performance when the
effects of environment and business-level competitive strategy are also considered. Third,
we address the form of the relationship between competive environment and manufacturing
strategy. Specifically, we analyze the extent to which competive strategy mediates the
effects of environmental dynamism on manufacturing strategy.
Environmental dynamism refers to the degree of turbulance in products,
technologies, and demand for products in a market (Dess & Beard, 1984; Miller & Friesen,
1983). By competitive strategy we refer to the broad dimensions that a business uses as a
basis of advantage, e.g., price versus differentiation (Porter, 1980). Manufacturing strategy
may be thought of as the manufacturing-oriented dimensions that win orders (Hill, 1994).
Although the possible mediating effects of competitive strategy on the relationship between
environmental dynamism and manufacturing strategy have not been tested previously, the
environment has long been identified as as an important contingency in conceptual and

3
empirical studies of both competitive and manufacturing strategy (e.g., Hofer, 1975; Van
Dierdonck and Miller, 1980; Skinner, 1969).
To address these issues, we employ data from a sample 101 U.S. manufacturers
across three industries to estimate a path model using covariance structure analysis. We
contrast the behavior of high and low performers by splitting the sample on the basis of
business performance. We utilize self-reported performance measures to achieve the
performance split and to analyze performance effects, although we acknowledge the
shortcomings inherent in such data.
2. Manufacturing strategy model
A review of the literature in the area reveals that the conceptual model presented in
Figure 1 is a representative view of manufacturing strategy in its context. The model
suggests that environmental dynamism affects both competitive strategy and manufacturing
strategy. Competitive strategy is cast in a mediating relationship because it intervenes
between environmental dynamism and manufacturing strategy (Venkatraman, 1989). The
model also implies that competitive strategy directly influences manufacturing strategy.
Further, the model suggests that the relationship of environment, competitive strategy, and
manufacturing strategy is linked to performance. The model also implies that direct links
exist between strategies and performance. The numbering of the arrows on Figure 1 refers
to hypotheses developed below.
_________________
FIGURE 1ABOUT HERE
__________________
2.1 Conceptual basis
The model in Figure 1 is familiar to students of manufacturing strategy. The model’s
origin can be traced to Skinner's (1969) seminal paper on manufacturing strategy that
4
prescribed in detail the links among environment, competitive strategy, and manufacturing
strategy to achieve good business performance. In their reviews of the operations strategy
literature, Anderson, Cleveland, and Schroeder (1989) and Leong, Snyder, and Ward (1990)
find broad support for the conceptual model introduced by Skinner, although relatively little
empirical evidence. A contemporary review reveals that this finding still holds. For
example, Hill (1994) incorporates environment (especially markets), competitive strategy
and manufacturing strategy in his conceptual model, but the model is not tested empirically.
A review of the literature also reveals no instance where the connections among
environment, competitive and manufacturing strategy and performance implications are
considered simultaneously using empirical evidence.
Although no empirical study incorporates all the dimensions represented in Figure 1,
pieces of the conceptual model have been tested. For example, the links among competitive
strategy, manufacturing strategy, and performance are addressed by Vickery, Droge, and
Markland (1994), who find covariance between competitive strategy and production
competence with business performance. Another example of empirical research on the
connection between competitive and manufacturing strategies is Miller and Roth's (1994)
numerical taxonomy of manufacturing strategy types, which are found to be related to
competitive strategies, in some instances. In their study of firms in the textile industry,
Williams, D'Souza, Rosenfeldt, and Kassaee (1995) find a relationship between competitive
strategy and manufacturing strategy and also between manufacturing strategy and
performance. Gupta and Lonial (1998) use a path model to test linkages among business
strategy, manufacturing strategy, and organizational performance. None of these studies
address the effects of environment on strategy choice nor are the relationships considered
simultaneously.
The linkages among environmental dynamism, manufacturing strategy and
performance are explored empirically by Swamidass and Newell (1987) and Ward, Duray,
Leong, and Sum (1995). Both papers show that environmental dynamism is positively
5
related to manufacturing flexibility. The latter paper also finds positive links between
environmental dynamism and quality and delivery capabilities among high performers. Both
of these studies use path models to establish that environmental factors affect manufacturing
strategy and performance, but neither includes competitive strategy in the model.
In contrast with manufacturing strategy research, many empirical studies in
competitive strategy have found relationships among environment, competitive strategy, and
performance. Keats and Hitt (1988) use a covariance structure model to describe the
relationship among several environmental dimensions, competitive strategy, and
performance. Miller (1988) supports earlier conceptual work on the types of environmental
and strategic configurations that lead to good performance. Kim and Lim (1988) also
provide evidence for the model linking environment, competitive strategy, and performance.
In general, environmental dynamism is shown to be positively linked with differentiation (as
opposed to cost-based) competitive strategies.
2.2 Hypotheses
Our literature review reveals that despite conceptual support for a model linking
environment, competitive strategy, manufacturing strategy and performace, simultaneous
empirical consideration of all of these aspects has been lacking. We address this deficiency
in the literature by considering first the sequential relationships in Figure 1; those paths
directly linking environmental dynamism with competitive strategy (path 1a), competititve
strategy with manufacturing strategy (path 1b), and manufacturing strategy with performance
(path 1c). Simultaneously testing the existence of these three paths implicitly tests the
essence of the conceptual model predominant in the operations strategy literature and
addresses the question of whether the model is supported by the data. We also test whether
significant links exist between environment and manufacturing strategy (path 2) and between
competitive strategy and performance (path 3). In addition, we test whether businesses that
are high performers are more apt to conform to the conceptual model than lower performers.

6
2.2.1 Fit of the conceptual model
Because of the broad support in the literature, we expect that the model will fit for
firms that exhibit relatively high business performance. We distinguish between relatively
high and low performers because the literature suggests that low performers are less likely to
adhere to the model. For example, Skinner (1969) argues that manufacturing’s task has to fit
the competitive strategy or failure is almost inevitable. Similarly, Hill (1994) prescribes a
strategic process aimed at avoiding misalignments between marketing goals and
manufacturing capabilities because such misalignments are frequently causes of poor
business performance. Therefore, we expect high performers to adhere to the model and the
behavior of low performers to fit the model poorly.
More specifically, we expect to find statistical support for a good fit for a path model
directly linking environment, competitive strategy, manufacturing strategy among high
performers. This model is depicted in paths 1a, 1b, and 1c of Figure 1. The absence of
significant linkages or good model fit among good performers would indicate that the data
do not support this conceptual model.
Hypothesis 1: High performers conform to the conceptual model to agreater extent than low performers.
Environmental dynamism and competitive strategy
In addition to overall model fit, we test the relationships suggested by each of the
paths shown in Figure 1. In each instance, the literature provides some evidence for the
existence of a relationship. For example, the literature is replete with empirical evidence
that environment influences strategy. In the previous section we note several such studies
that report a significant relationship between environmental dynamism and competitive
strategy. In general these studies show that more dynamic environments support competitive
strategies that are based on differentiation. We expect similar findings from our analysis.

7
Hypothesis 1a: Environmental dynamism influences competitive strategychoice.
Competitive strategy and manufacturing strategy
Although Swink and Way (1995) point out that they are relatively few in number,
extant studies do provide empirical evidence of the existence of the predicted linkage
between competitive strategy and manufacturing strategy, i.e., that manufacturing strategy
supports competitive strategy in high performing businesses. For example, this relationship
is borne out by Vickery, et al. (1994). It is important to note that a major tenet in the
development of manufacturing strategy has been that poor business performance results
when manufacturing strategy is not linked with competitive strategy. We test the following
hypothesis, expecting to identify a systematic relationship between competitive strategy and
manufacturing strategy.
Hypothesis 1b: Competitive strategy influences manufacturing strategy.
Manufacturing strategy and performance
The existence of a relationship between manufacturing strategy and business
performance has long been supported by the manufacturing strategy literature. For example,
Swamidass & Newell (1987) showed that performance was positively related to a particular
manufacturing strategy, flexibility. A number of studies have shown that quality is linked
with good performance. For example, Ferdows and DeMeyer (1990) and Noble (1995) have
argued that effective manufacturing strategies generally begin with quality as a base. Several
studies describing world class manufacturers suggest that the best competitors compete on
the basis of a variety of manufacturing capabilities (e.g., Collins, Cordon, & Julien, 1998;
Flynn, Sakakibara, & Schroeder, 1995; Ward, Bickford, & Leong, 1996). We test the
following hypothesis expecting a positive relationship between emphasis on manufacturing
capabilities and business performance among high performance manufacturers.

8
Hypothesis 1c: Manufacturing strategy influences business performance.
2.2.2 Environment and manufacturing strategy
The literature also contains evidence of a direct relationship between environmental
factors, in particular environmental dynamism, and manufacturing strategy. We earlier cited
Swamidass and Newell (1987) and Ward et al. (1995) as examples. In both instances, the
researchers also linked business performance to the relationship, suggesting that the high
performing firms choose manufacturing strategies consistent with their environments.
Because of this evidence, we also test for the existence of a direct relationship between
environmental dynamism and manufacturing strategy in the presence of competitive strategy
(Figure 1, path 2). The absence of a significant coefficient for such a path would imply that
competitive strategy mediates the effects of environmental dynamism on manufacturing
strategy with no significant independent effect.
Hypothesis 2: Environmental dynamism has a direct influence onmanufacturing strategy.
2 2.3 Competitive strategy and performance
The principle of equifinality suggests that a number of different, equally effective
strategies can be used to achieve good performance (Doty, Glick, & Huber, 1993; Van de
Ven & Drazin, 1985). Strategy implementation is the key link between competitive strategy
and success measured by business performance. A number of authors have argued that
functional strategy, in general, or manufacturing strategy, in particular, describes such
implementation by providing a more detailed picture of how a competitive strategy is
pursued (e.g., Hatten, Schendel, & Cooper, 1978; Miller, 1987). We test the significance of
the path from competitive strategy to performance to test the importance of the intervention
of manufacturing strategy in defining that relationship between competitive strategy and
perfromance (Figure 1, path 3). The absence of significance for such a link would imply that

9
manufacturing strategy mediates the relationship between competititive strategy and
performance rather than having an independent effect.
Hypothesis 3: Competitive strategy has a direct influence on businessperformance.
3. Data and Methods
3.1 Data
Data for the study are from an survey of U.S. manufacturing firms. The sample
consists of businesses whose primary product is in one of three sectors: fabricated metal
products; electrical devices; and electronic controls. The sample is restricted to businesses
reporting 150 or more employees at the location. Each firm in the sample was contacted by
telephone to identify the top manager resident at that location (for example, general
manager) and verify address and line of business. Thus identified, general managers were
called and asked to participate in the study. Those who agreed to participate were asked to
provide names and addresses for their: (i) plant manager, (ii) marketing manager, and (iii)
manufacturing engineering manager. Distinct survey forms were then mailed to each of the
four managers so that two independent responses could be elicited for each question from
each responding firm These methods yielded 101 usable responses, a response rate of 37
percent.
Analysis of the variables used in this research indicates no significant pattern of
responses by industry and, thus, no identifiable industry effects. A check for non-respondent
bias was carried out by comparing non-respondents with respondents in the same industry on
the basis of reported sales volume and number of employees. This check revealed no pattern
of differences between the two groups. In telephone interviews with refusing firms, non-
respondents' lack of time and reluctance to reveal confidential information were most
commonly cited as reasons for not participating.

10
Each perceptual question is asked of two different managers at the same firm to
allow a check on whether each informant's perception is shared by others in the firm.
Correlations between the two respondents for each of the scales are all significant at less
than 0.01, indicating a high degree of inter-rater agreement and lending support to the
validity of the scales.
3.2 Operational definitions
The constructs in the research are made operational using multi-item scales intended
to capture the underlying theoretical dimensions. For each construct, we describe briefly
both the antecedents or conceptual underpinnings and mechanics used in measurement. The
values for each scale are represented as standardized scores. Specific scales are shown in the
appendix.
3.2.1 Environmental dynamism
The environmental dynamism items are adapted from Miller and Friesen (1983).
Respondents are asked to indicate the rate of change, from slow to rapid, at which products
and services become obsolete, the rate of innovation in product/service and in process, and
the rate of change in customers' tastes and preferences. High numeric scores indicate higher
rates of dynamism.
3.2.2 Competitive strategy
Porter (1980) develops the idea that all competitive strategies are variants of generic
strategies involving a choice between differentiation and delivered cost (price), with degree
of focus, i.e., serving niche or broad markets, providing a second competitive dimension.
Although many authors have since embellished or modified Porter's generic strategies, they
remain useful anchors for classifying strategies (e.g., Hill, 1988). Dess and Davis (1984)
provide an instrument to make Porter's generic strategic types operational which has been
used frequently in strategy research and is validated by Kotha and Vadlamani (1993). We
adapt Dess and Davis' (1984) instrument and findings to measure the price and
differentiation aspects of competitive strategy. Specifically, for cost measures we consider

11
the importance to the business unit of operating efficiency, competitive pricing, procurement
of raw materials, minimizing outside financing, decreased number of product features, and
reducing product costs. For differentiation, we use the importance to the business unit of
new product development, brand identification, innovation in marketing techniques and
methods, innovation in products and services, advertising, reputation within the industry,
and forecasting market growth. For both cost and differentiation, higher numeric scores
indicate greater emphasis.
3.2.3 Operations strategy and competitive priorities
A common theme in operations strategy research has been describing manufacturers'
choices of emphasis among key capabilities or competitive priorities. As noted above, the
manufacturing strategy literature suggest four competitive priorities: low cost, quality,
delivery, and flexibility (Hayes and Wheelwright, 1984; Van Dierdonck and Miller, 1980;
Wheelwright, 1984). More recently Youndt, Snell, Dean, and Lepak (1996) use these
dimensions to operationalize manufacturing strategy. It should be noted that other priorities
could be included, notably innovation (Hayes, Wheelwright, and Clark, 1988).
Quality. Garvin (1987) points out that quality is multidimensional and that each of
its dimensions can be used strategically to gain competitive advantage. The quality scale
that we use includes items related to the important quality aspect of process control and
process management (Flynn, Schroeder, and Sakakabara, 1994). Specifically,the scale
measures organizational emphasis on statistical process control, real time process control
systems, updating process equipment, and developing new processes for new and old
products.
Flexibility. The flexibility scale is intended to capture the importance of reducing
costs associated with changing products or mix. Specifically, the scale measures the
relative emphasis placed on lead-time reductions, set-up time reductions, the ability to
12
change priority of jobs on the shop floor, and the ability to change machine assignments on
the shop floor (Gerwin, 1993).
Delivery. This measure includes emphasis on customer service as indicated by either
delivery reliability or delivery speed.
Low Cost. The instrument captures the competitive priority of low cost by
measuring the emphasis placed on reducing production costs, reducing inventory, increasing
equipment utilization, and increasing capacity utilization.
3.2.4 Performance
Business performance is operationalized as a composite of two measures, market
share and sales growth, relating to the business unit's perceived position in relation to
competitors. Hambrick (1984) suggests dividing the sample into separate high and low
performance sub-samples in this manner as a practical analytical technique for strategy
research. The scores for the performance measures of market share and sales growth are
combined and used to identify 51 high performers and 50 low performers. The questions that
measure these items use a Likert scale ranging from 1 to 7 (Appendix). The scores for the
performance measures of market share and sales growth are added to create a scale that
ranges from a low of 2 to a high of 14. Based on this composite score, companies are
separated into two groups: low performers having performance values of nine or less and
high performers having performance values of 10 or more.
In addition to the perceptual performance measures discussed above, we also asked
participating firms for objective performance data on earnings growth, although fewer than
half of the firms in the sample responded to this questions because the objective data are
more sensitive for managers concerned about revealing confidential data. Using a method
described by Vickery, Droge, and Markland (1993), the correlation between perceptual and
objective measures is used to help validate subjective measures. The objective measure of
earnings growth correlates strongly (significant at less than 0.001) with the categorical

13
variable constructed on the basis of composite perceptual performance, thus buttressing the
perceptual measures.
3.3 Reliability
Inter-item analysis is used to check environment, competitive strategy, and
manufacturing strategy scales for internal consistency or reliability (Nunnally and Bernstein,
1994). Specifically, Cronbach's coefficient alpha is calculated for each scale, as
recommended by Flynn et al. (1990). Cronbach's coefficient alphas, reported in the Table 1,
are all acceptable for organizational research according to the criteria established by Van de
Ven and Ferry (1979:78-81). Table 1 also contains a correlation matrix for the scales
described above.
Insert Table 1
4. Path Analytic Methods
Causal models have been used in both competitive and manufacturing strategy to link
environmental constructs to strategy and performance. Swamidass and Newell (1987)
showed environment as a precursor to choice of manufacturing strategy in their path model
linking perceived environment, operations strategy process, operations strategy content, and
firm performance. Ward et. al. (1995) upheld the contention that environment is causally
linked to operations strategy choice for high performing firms. Gupta and Lonial (1998) use
a path model to link business and manufacturing strategies. We use a path model to link
environment, competitive strategy, manufacturing strategy and performance.
Although the relationships among environment, competitive strategy and
manufacturing strategy are often viewed as reciprocal, this study focuses on a single time

14
period in which competitive strategy can be seen as a predecessor of manufacturing strategy
and environment is a predecessor to both. These causal relationships were captured by
employing path models estimated using covariance structure modeling. We recognize the
limitations of using a static model for inferring precedence.
Preliminary path models were first specified to identify the significant relationships
and estimate path coefficients. Separate models were estimated for both high and low
performance groups. Those covariance paths that were not significant at greater than 0.10
were eliminated to better estimate the model and provide closer fit. Model fit statistics were
used to test Hypothesis 1, which requires assessing model fit for high and low performers.
Significance tests on coefficients for these same models were used to evaluate hypotheses 1a
through 1c, which concern the existence of relationships between environmental dynamism
and competitive strategy, between competitive strategy and manufacturing strategy, and
between manufacturing strategy and performance, respectively. Covariance of error terms
were specified for all manifest variables to account for covariance among factors. Initial
path coefficients achieved for the high performer sample are shown in Table 2.
Insert Table 2
As described in the findings, below, good model fit was achieved for high performers
but not for low performers. Therefore, only the high performance sample was retained for
subsequent analysis required to test hypotheses 2 and 3. To test hypothesis 2, that
environmental dynamism directly influences manufacturing strategy, an additional model
was estimated that provides each manufacturing strategy (competitive priority) with both a
direct link to environment and an indirect link through competitive strategy. The
significance of these path coefficients were used to test the existence of the causal linkages.

15
Similarly, to test hypothesis 3, that competitive strategy directly influences business
performance strategy, an additional model was estimated that provides a path from each
competitive strategy both directly to performance and indirectly through manufacturing
strategy. Again, the significance of these path coefficients were used to test the existence of
the causal linkages.
5. Findings
Figure 2 shows the significance of paths and path coefficients that result from
estimating the initial model and reducing the model to only paths significant at 0.10 for high
performers. Because no single measure of fit adequately describes covariance structure
models (Bollen and Long 1993), Figure 2 includes three model fit statistics; Root Mean
Square Error of Approximation (RMSEA); Bentler-Bonnet normed fit index; and a non-
normed fit index. RMSEA estimates the model's fit to the true population parameters taking
the number of parameters into consideration. Probabilities are calculated that the RMSEA
produces a close fit, i.e., the population discrepancy value approaches zero with significance
at .05, and the probability of a perfect fit at .01. Both the Bentler-Bonnet normed fit index
and the non-normed fit index, which adjusts for degrees of freedom, reflect a comparison
with fit indices achieved using a restrictive, baseline model (Bollen, 1989). We specify a
baseline model representing covariance among the competitive strategy variables and
between the competitive priorities but without paths. For both Bentler-Bonnet and the non-
normed fit indices, values close to 1 indicate good fit.
Insert
Figure 2

16
The initial model shows the probability of a perfect fit of .947 and a close fit at .969,
a normed fit index of .892 and a non-normed index of 1.27. All fit indices indicate a good
fit of the model for high performers. This indication of a good fit substantiates the overall
model of the relationship of environment, competitive strategy and manufacturing strategy
for high performing firms.
The same model was specified for low performers with dramatically different results.
The fit statistics do not indicate a good fit of the model when data from low performers is
used. The low performer model shows the probability of a perfect fit of .169 and a close fit
at .275, a normed fit index of .673. and a non-normed index of .859. The indication of a
good fit for the high performer model and poor fit for the low performing model supports
hypothesis 1, that the predominant manufacturing strategy model fits high performers and
not poor performers. Because the low performer model fits poorly, subsequent discussion is
restricted to the high performance subsample.
The existence of significant paths from environment to differentiation and from
competitive strategy variables to manufacturing strategy variables provides evidence of a
causal relationship existing between environment and competitive strategy and between
competitive strategy and manufacturing strategy. Similarly, a significant path between one
of the manufacturing strategy dimensions (quality) and performance also indicates the
predicted relationship between manufacturing strategy and performance. These findings
support hypothesis 1a, that environmental dynamism affects competitive strategy choice;
hypothesis 1b, that competitive strategy influences the selection of an appropriate
manufacturing strategy; and hypothesis 1c, that manufacturing strategy is related to
performance.
Hypothesis 1a requires that at least one significant path exists between environment
and competitive strategy. The path from environmental dynamism to differentiation is
significant at the .05 level. Similarly, hypothesis 1b requires that at least one significant path
exists between competitive strategy and manufacturing strategy. The competitive strategy of

17
differentiation is positively linked to the quality and flexibility dimensions of manufacturing
strategy at the .05 significance level (with the other paths significant at .10). Hypothesis 1c
requires that a significant path exist between manufacturing strategy and performance. The
path from the manufacturing strategy dimension of quality to business performance is
significant at the .05 level.
To test hypothesis 2, that a direct relationship exists between environmental
dynamism and manufacturing strategy, the initial high performer model was re-estimated
with the addition of paths from the environment to manufacturing strategy constructs.
Support for hypothesis 2 requires that at least one of these new paths be significant. This
model and results are summarized in Figure 3.
Insert
Figure 3
Figure 3 shows that the four paths from environment to manufacturing competitive
priorities are not significant at 0.10. Thus, hypothesis 2, that environmental factors directly
influence manufacturing strategy among high performance manufactures, is NOT supported.
Because these paths are not significant, there is no compelling evidence of a direct
relationship between environment and manufacturing strategy when competitive strategy is
also considered.
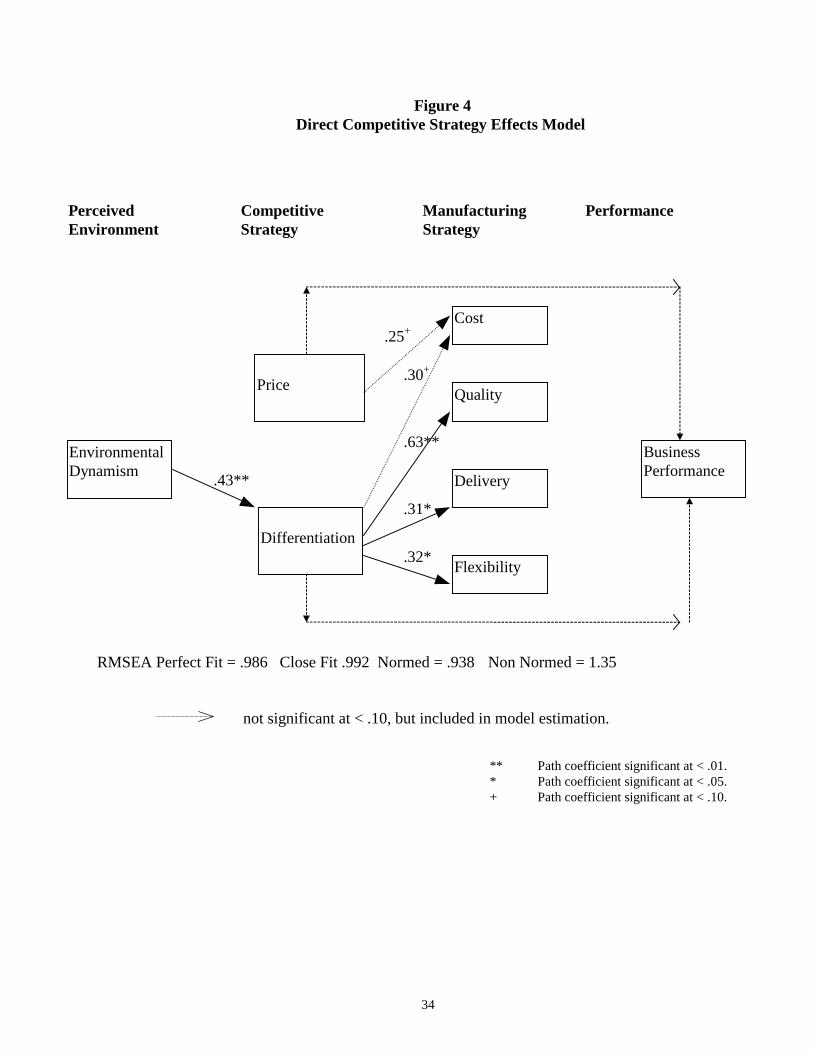
Finally, hypothesis 3 requires a significant path between either of the competitive
strategy variates and business performance. Figure 4 shows the high performer model
respecified to include direct paths from each of the competitive strategy dimensions, price
and differentiation, to business performance. Because neither of these paths are significant

18
at 0.10, the data do not provide evidence of a direct competitive strategy-business
performance relationship.
Insert
Figure 4
In summary, the data support hypotheses 1, 1a, 1b, and 1c and thus the conceptual
model of manufacturing strategy that has been predominant in the literature. However, the
data do not support hypotheses 2 and 3. The implications of these findings are discussed
below.
6. Discussion
In essence this research suggests four notable findings. First, long-standing
conceptual arguments linking environment, competitive strategy, manufacturing strategy,
and performance are upheld empirically among high performance firms. Second, the model
does not fit firms that report relatively poor business performance. Third, we find no direct
link between environmental dynamism and manufacturing strategy; rather we find that this
relationship is mediated by competitive strategy. Fourth, the data do not support a direct
relationship between competitive startegy and business performance. The data suggest that
the relationship between competitive strategy and performance is mediated by manufacturing
strategy. We elaborate on each of these findings in turn.
6.1 Empirical support for the conceptual model
The tests of the causal model shown in Figure 2 confirm widely held beliefs about
the role of manufacturing strategy in context. Although this finding only confirms what

19
many scholars already hold to be true, it is worth highlighting because such confirmation has
not been reported in the literature previously. Although a number of empirical studies have
addressed pairs of constructs in the environment-competitive strategy-manufacturing
strategy nexus, a review of the literature has not revealed an instance where all three appear
in a model simultaneously. In addition, we address the performance implications suggested
by the model.
The data analysis also reveals information about the specific nature of the
relationships that exist in our sample of high performance manufacturing firms. Recall that
we use two predominant competitive strategy dimensions, differentiation and price. Theory
and empirical evidence in competitive strategy suggests that differentiation strategies are
more effective in dynamic environments (Bourgeois and Eisenhardt, 1988; Miller, 1986;
1988). Our own findings confirm this position, the path between environmental dynamism
and a differentiation strategy is significant and positive while the path between
environmental dynamism and a low price competitive strategy is not significant (see Figure
2).
From the perspective of operations management, the paths between each of the
competitive strategies and the manufacturing strategy dimensions are of great interest. A
competitive strategy of differentiation is linked with each of the manufacturing strategy
variables. The coefficient of the paths between differentiation and quality and between
differentiation and flexibility are each significant at less than 0.05. Links between
differentiation and the other two manufacturing strategy dimensions, low cost and delivery,
are significant at 0.10. This finding suggests that successful differentiators pursue a
portfolio of manufacturing capabilities to make their offering distinctive in the marketplace.
The fact that quality shows the strongest link with differentiation is consistent with the
literature (e.g., Garvin,1997; Williams et al, 1995). As expected, the model reflects a
relationship between a low price competitive strategy and a low cost manufacturing strategy,

20
a finding suggested by conceptual literature (e.g., Ward et al, 1996) and common sense. The
price-low cost path is significant at 0.10.
The strong link between quality and business performance is also notable. This
finding is consistent with both the vast body of TQM research that suggests that a quality
emphasis is primary. It is also consistent with a number of empirical studies that suggest a
positive relationship between quality and various measures of business performance (e.g.,
Buzzell and Gale, 1987; Flynn, et al, 1995, Williams et al, 1995). . Findings reported by
Narasimhan and Jayram (1998) suggest programs that are antecedents to making progress in
achieving competitive priorities, including quality.
The importance of the close coupling between competitive and manufacturing
strategies among high performance manufacturers raises interesting questions about how
such coupling can be accomplished Hill (1994) provides one methodology for achieving
such a coupling and also points out many potentional pitfalls in the process. Adam and
Swamidass (1989) and others point out that manufacturing strategy process research has
been neglected relative to content research. The (content research) findings reported here
underline the importance of process research for developing an understanding how firms
establish close linkages between competitive and operations strategy without adopting
bureaucratic strictures that impede responsiveness.
6.1.1 Poor fit for poor performers
A number of authors have suggested the consequences of not adhering to a
manufacturing strategy model that ties business and manufacturing strategy: poor
performance (e.g., Hill, 1994; Skinner, 1969). Our findings of poor model fit for poor
performers are consistent with the admonitions of these and other influential thinkers in our
field. Our findings also suggest the practical advice for empirical researchers in our field,
separate consideration of high and low performers. Hambrick (1984) specifically
recommends splitting a sample based on performance to capture the different behaviors in
strategy research using a configurational approach. Other approaches suggest different

21
means for achieving separation but the idea that poor performers behavior may be
fundamentally different from good performers is worthwhile.
6.2 Environmental dynamism and manufacturing strategy
At first glance, the finding of no direct relationship between environmental
dynamism and manufacturing strategy appears at variance with the empirical findings
reported by Swamidass and Newell (1987), Van Dierdonck and Miller (1980), and Ward et
al. (1995). The apparent inconsistency is easily explained, however, by the fact that none of
the studies noted above considered environment and competitive strategy simultaneously.
Our findings indicate that competitive strategy mediates the effects of environmental
dynamism on manufacturing strategy in high performance firms.
Testing for mediation is usually done in a path analytic framework similar to the one
used in this research. The significant paths between environmental dynamism and
competitive strategy and between competitive strategy and manufacturing strategy cast
competitive strategy as a mediator (Venkatramen, 1989). The fact that there is not a direct
path between environmnetal dynamism and manufacturing strategy provides stronger
evidence of mediation (i.e., evidence of complete mediation, Blalock, 1969; Venkatramen,
1989). The mediating effect of competitive strategy suggests that environmental dynamism
has an important influence on manufacturing strategy but that influence is articulated
through and modified by competitive strategy.
The research implication of competitive strategy mediating the effects of
environment on manufacturing strategy is clear. A model of manufacturing strategy must
include both environmental and competitive strategy variables to capture the context of
manufacturing strategy accurately. Previous empirical research in manufacturing strategy
generally excludes from consideration either environment or competitive strategy. Our
results suggest that overlooking either environment or competitive strategy may miscast the
true relationships. Therefore, it is important to assess manufacturing strategy in the context
of both environment and competitive strategy. In short, the data suggest that for high

22
performance manufacturers, reactions to environmental conditions are effected through
competitive strategy. This only underscores the importance of a close coupling of
competitive and manufacturing strategies and, again, implies that learning how to make
effective links between competitive and manufacturing strategy is critical.
6.3 Competitive strategy and performance
Our analysis suggests that the relationship between competitive strategy and business
performance is mediated by manufacturing strategy. More specifically, the quality dimension
of manufacturing strategy appears to mediate the differentiation strategy-business performance
connection. This finding implies that a differentiation strategy works when it is supported by
manufacturing capability, i.e., quality. This implication is important because it suggests that
performance improvements resulting from competitive strategy initiatives are manifested in
their implementation via manufacturing capabilities, specifically quality. By using more
precise instruments to measure competitive strategy, future research may discern that other
dimensions of manufacturing strategy also serve to define the performance effects of
competitive strategy.
The emerging paradigm of manufacturing strategy that appears in the literature
suggests tight constellations of environmental factors and strategies which lead to superior
capabilities and performance (e.g., Hayes and Pisano, 1996; Miller and Roth, 1994). Our
study supports this view of manufacturing strategy. In addition, we test and support a model
of manufacturing strategy that is predominant in the conceptual literature for high performers
but show that this model does not fit for low performers. This research also shows that
competitive strategy is a mediator between environment and manufacturing strategy for high
performing firms. Perhaps most notably, the findings provide empirical evidence that
manufacturing and competitive strategies are inextricably linked in high performance firms.
This suggests that research into the processes that companies use to achieve those links is of
great importance for moving forward our knowledge of manufacturing strategy.

23

24
References
Adam, E. E. Jr., Swamidass P. M., 1989. Assessing operations management from a strategicperspective. Journal of Management 15 (2), 181-203.
Anderson, J.C., Cleveland, G., & Schroeder, R.G. 1989. Operations strategy: A literaturereview. Journal of Operations Management, 8 (2), 133-158.
Bollen, K. A., 1989. Structural Equations with Latent Variables. John Wiley & Sons, NewYork.
Bollen, K. A., Long, J. S. (eds.), 1993. Testing Structural Equation Models, Sage, NewburyPark.
Bourgeois, L. J., Eisenhardt, K. M., 1988. Strategic Decision Processes in High VelocityEnvironments: Four Cases in the Microcomputer Industry. Management Sciences 34 (7),816-834.
Buzzell, R. D., Gale, B. T., 1987. The PIMS principles, The Free Press, New York, NY.
Collins, R. S., Cordon, C., Julien, D., 1998. An empirical test of the rigid flexibility model.Journal of Operations Management 16, 133-146.
De Meyer, A., Nakane, J., Miller, J., Ferdows, K., 1989. Flexibility: The next competitivebattle. Strategic Management Journal 10 (2), 135-144.
Dess, G. G., Davis, P. S., 1984. Porter's (1980) generic strategies as determinants ofstrategic group membership and organizational performance. Academy of ManagementJournal 27 (3), 467-488.
Doty, D. H., Glick, W. H., Huber, G. P., 1993. Multidimensional fit, equifinality, andorganizational effectiveness: A test of two configurational theories. Academy ofManagement Journal 36 (6), 1196-1250.
Ferdows, K., DeMeyer, A., 1990. Lasting improvements in manufacturing performance: Insearch of a new theory. Journal of Operations Management 9 (2), 168-184.
Flynn, B. B., Sakakibara, S., Schroeder, R., Bates, K., Flynn, J., 1990. Empirical researchmethods in operations management. Journal of Operations Management 9 (2), 250-284.
Flynn, B. B., Sakakibara, S., Schroeder, R., 1995. Relationship between JIT and TQM:Practices and performance. Academy of Management Journal 38 (5), 1325-1360.
Flynn, B. B., Schroeder, R., Sakakibara, S., 1994. A framework for quality management andan associated measurement instrument. Journal of Operations Management 11, 339-366.
25
Flynn, B. B., Schroeder, R., Sakakibara, S., 1995. The impact of quality managementpractices on performance and competitive advantage Decision Sciences 26 (5), 659-691.
Garvin, D. A, 1987. Competing on the eight dimensions of quality. Harvard BusinessReview 65 (6), 101-109.
Gerwin, D., 1993. Manufacturing flexibility: A strategic perspective. Management Science39, 395-410.
Gupta, Y. P., Lonial, S. C., 1998. Exploring linkages between manufacturing strategy,business strategy, and organizational strategy. Production and Operations Management 7(3), 243-264.
Hambrick, D. C., 1984. Taxonomic approaches to studying strategy. Journal ofManagement 10, 27-41.
Hatten, K., Schendel, D., Cooper, A., 1978. A strategic model of the U.S. brewing industry:1952-1971. Academy of Management Journal 21, 592-610.
Hayes, R. H., Pisano, G. P., 1996. Manufacturing strategy: At the intersection of twoparadigm shifts. Production and Operations Management 5 (1), 25-41.
Hayes, R. H., Wheelwright, S. C., 1984. Restoring our Competitive Edge: CompetingThrough Manufacturing. Wiley, New York.
Hayes, R.H., Wheelwright, S.C., & Clark, K. Dynamic manufacturing. New York: TheFree Press, 1988.
Hofer, C. W., 1975. Toward a contingency theory of business strategy. Academy ofManagement Journal 18, 784-810.
Keats, B. W., Hitt, M. A., 1988. A causal model of linkages among environmentaldimensions, macro-organizational characteristics and performance. Academy ofManagement Journal 31 (3), 570-598.
Kim, L., Lim, Y., 1988. Environment, generic strategies, and performance in a rapidlydeveloping location: A taxonomic approach. Academy of Management Journal 31 (4),802-827.
Kim, Y., Lee, J., 1993. Manufacturing strategy and production systems: An integratedframework. Journal of Operations Management 11, 3-15.

26
Kotha, S., Vadlamani, B. L., 1995. Assessing generic strategies: An empirical investigationof two competing typologies in discrete manufacturing industries. StrategicManagement Journal, Summer 16, 75-83
Leong, G. K., Snyder, D., Ward, P. T., 1990. Research in the process and content ofmanufacturing strategy. OMEGA 18 (2), 109-122.
Miller, D., 1986. Configurations of strategy and structure: Towards a synthesis. StrategicManagement Journal 7 (3), 233-249.
Miller, D., 1987. The structural and environmental correlates of business strategy. StrategicManagement Journal 8 (1), 55-76.
Miller, D., 1988. Relating Porter’s business strategies to environment and structure: Analysisand performance implications. Academy of Management Journal 31 (2), 280-308.
Miller, D., Friesen, P. H., 1983. Strategy-making and environment: The third link. StrategicManagement Journal 4 (3), 221-235.
Miller, J. G., De Meyer, A., Nakane, J., 1992. Benchmarking Global Manufacturing:Understanding International Suppliers, Customers, and Competitors. Homewood, IL:Business One Irwin.
Miller, J. G., Roth, A. V., 1994. A taxonomy of manufacturing strategies. ManagementScience 40 (3), 285-304.
Narasimhan, R., Jayaram, J., 1998. An empirical investigation of the antecedents andconsequences of manufacturing goal achievement in North American, European, and PanPacific firms. Journal of Operations Management 16, 159-176.
Nemetz, P. L., 1990. Bridging the strategic outcome measurement gap in manufacturingorganizations. Proceedings of the joint industry university conference on manufacturingstrategy, Kluwer Academic Publishers, Amsterdam.
Noble, M. A., 1995. Manufacturing strategy: Testing the cumulative model in a multiplecountry context, Decision Sciences 26 (5), 693-720.
Nunnally, J. C., Bernstein, I. H., 1994. Psychometric Theory, 3rd edition, McGraw-Hill,New York.
Porter, M. E., 1980. Competitive Strategy. New York: The Free Press.
Rho, B., Whybark, D. C., 1990. Comparing manufacturing and control practices in Europeand Korea. International Journal of Production Research 28, 2393-2404.

27
Skinner, W., 1969. Manufacturing - missing link in corporate strategy. Harvard BusinessReview 47 (3), 136-145.
Stobaugh, R., Telesio, P., 1983. Match manufacturing policies and product strategies.Harvard Business Review 61 (2), March-April, 113-120.
Swamidass, P. M., Newell, W. T., 1987. Manufacturing strategy, environmental uncertaintyand performance: A path analytic model. Management Science 33 (4), 509-524.
Swink, M., Way, M.H., 1995. Manufacturing strategy: Propositions, current research,renewed directions. International Journal of Operations and Production Management 15(7), 4-26.
Van de Ven, A. H., Drazin, R., 1985. The concept of fit in contingency theory. In L.Cummins & B. M. Staw (Eds.), Research in Organizational Behavior 7, 333-365.Greenwich, CT: JAI Press.
Van de Ven, A. H., Ferry, D., 1978. Measurement and assessment of organizations. NewYork: Wiley.
Van Dierdonck, R., Miller J. G., 1980. Designing production planning and control systems.Journal of Operations Management 1 (1), 37-46.
Venkatraman, N., 1989. The concept of fit in strategy research: Towards verbal andstatistical correspondence. Academy of Management Journal 14 (3), 423-444.
Vickery, S. K., Droge, C., Markland, R. R., 1993. Production competence and businessstrategy: Do they affect business performance. Decision Sciences 24 (4), 435-456.
Ward, P. T., Bickford, D. J., Leong, G. K., 1996. Configurations of manufacturing strategy,business strategy, environment, and structure. Journal of Management 22, 597-626.
Ward, P. T., Duray, R., Leong, G. K., Sum, C., 1995. Business environment, operationsstrategy, and performance: An empirical study of Singapore manufacturers. Journal ofOperations Management 13 (2), 99-115.
Wheelwright, S. C., 1984. Manufacturing strategy: Defining the missing link. StrategicManagement Journal 5 (1), 77-87.
Whybark, D. C., Vastag, G. (eds.), 1993. Global Manufacturing Practices: A WorldwideSurvey of Practices in Planning and Control. Elsevier, Amsterdam.
Williams, F. P., D'Souza, D. E., Rosenfeldt, M. E., Kassaee, M., 1995. Manufacturingstrategy, business strategy and firm performance in a mature industry. Journal ofOperations Management 13, 19-33.

28
Youndt, M. A., Snell, S. A., Dean, Jr., J. W., Lepak, D. P., 1996. Human resourcemanagement, manufacturing strategy and firm performance. Academy of ManagementJournal, 39, 836-866.

29
Table 1
Correlation Matrix for Full Sample(Cronbach's Coefficient Alphas on the Diagonal)
Scale
#1 #2 #3 #4 #5 #6 #7
Environment1. Environmental dynamism .86
Competitive strategy2. Marketing Differentiation .54** .873. Price Differentiation -.09 -.04 .82
Manufacturing strategy
4. Low cost priority .08 .24* .29** .67
5. Quality priority .21* .20+ .02 .44** .72
6. Delivery priority .10 .30** .13 .34** .18+ .78
7. Flexibility priority .21* .31** .06 .46** .43** .30** 73
** Significant at < .01.* Significant at < .05.+ Significant at < .10.

30
Table 2
Path Coefficients and Significance Levels for the Initial Model
Path PathCoefficient
t value
Environmental Dynamism to
Marketing Differentiation .44 3.56*Price -.08 -0.56
Marketing Differentiation to
Low Cost .25 1.78+Quality .67 4.16**Delivery .30 2.16+Flexibility .30 2.13+
Price to
Low Cost .24 1.59Quality -.20 -1.13Delivery -.02 -.13Flexibility -.04 -.29
to Performance
Low Cost -.04 -.25Quality .30 1.60Delivery .14 .82Flexibility -.03 -.13
** Path coefficient significant at < .01.* Path coefficient significant at < .05.+ Path coefficient significant at < .10.

31
Figure 1Conceptual model of manufacturing strategy in its context.
ManufacturingStrategy
CompetitiveStrategy
Environment
Performance
1a
1b
1c
2
3

32
Figure 2High Performer Model
PerceivedEnvironment
CompetitiveStrategy
ManufacturingStrategy
Performance
RMSEA Perfect Fit = .947 Close Fit .969 Normed =.892 Non Normed = 1.27
Price
EnvironmentalDynamism
Cost
Quality
Flexibility
Delivery
Differentiation
.71**
.44**
.27+
.29+
.31*
BusinessPerformance
.32*
** Path coefficient significant at < .01.* Path coefficient significant at < .05.+ Path coefficient significant at < .10.
.26+

33
Figure 3Direct Environmental Effects Model
not significant at < .10, but included in model estimation.
Price
EnvironmentalDynamism
Cost
Quality
Flexibility
Delivery
Differentiation
.40*
BusinessPerformance
.68*
PerceivedEnvironment
CompetitiveStrategy
ManufacturingStrategy
Performance
.32*
RMSEA Perfect Fit = .861 Close Fit .903 Normed = .912 Non Normed = 1.24
** Path coefficient significant at < .01.* Path coefficient significant at < .05.+ Path coefficient significant at < .10.
.27+
34
Figure 4Direct Competitive Strategy Effects Model
not significant at < .10, but included in model estimation.
PerceivedEnvironment
CompetitiveStrategy
ManufacturingStrategy
Performance
RMSEA Perfect Fit = .986 Close Fit .992 Normed = .938 Non Normed = 1.35
Price
EnvironmentalDynamism
Cost
Quality
Flexibility
Delivery
Differentiation
.43**
BusinessPerformance
.63**
.30+
.31*
.32*
** Path coefficient significant at < .01.* Path coefficient significant at < .05.+ Path coefficient significant at < .10.
.25+

35
Appendix. Items used for developing scalesENVIRONMENTAL DYNAMISMIndicate the rate of change for the following
SLOW RAPID N/O
•The rate at which products and services become outdated .......... 1 2 3 4 5 6 7 9•The rate of innovation of new products or services ................. 1 2 3 4 5 6 7 9•The rate of innovation of new operating processes ................ 1 2 3 4 5 6 7 9•The tastes and preferences of customers in your industry .......... 1 2 3 4 5 6 7 9
COMPETITIVE STRATEGYRate the following competitive methods on how important they are in meeting your business strategy.
NO VERY ABSOLUTELYIMPORTANCE IMPORTANT CRITICAL N/O
PRICE•Operating efficiency ........................................ 1 2 3 4 5 6 7 9•Competitive pricing ....................................................... 1 2 3 4 5 6 7 9•Procurement of raw materials ................................................... 1 2 3 4 5 6 7 9•Reducing product coste .......................................... 1 2 3 4 5 6 7 9•Minimize outside financing .......................................... 1 2 3 4 5 6 7 9•Decreasing the number of product features ........................... 1 2 3 4 5 6 7 9
DIFFERENTIATION•New product development ................................................. 1 2 3 4 5 6 7 9•Brand identification ........................................................ 1 2 3 4 5 6 7 9•Innovation in marketing techniques and methods .................... 1 2 3 4 5 6 7 9•Control of distribution channels ........................................ 1 2 3 4 5 6 7 9•Advertising ....................................................... 1 2 3 4 5 6 7 9
MANUFACTURING STRATEGY
Indicate the degree of emphasis which your manufacturing plant places on the following activities.NO MODERATE EXTREME
EMPHASIS EMPHASIS EMPHASIS N/OFLEXIBILITY
•Lead-time reduction ........................................................ 1 2 3 4 5 6 7 9•Setup time reduction ....................................................... 1 2 3 4 5 6 7 9•Ability to change priorities of jobs on the shop floor .............. 1 2 3 4 5 6 7 9•Ability to change machine assignments of jobs on the shop floor .................................................................. 1 2 3 4 5 6 7 9
QUALITY
•Statistical Process Control ........................................................ 1 2 3 4 5 6 7 9•Real-time process control systems................................................... 1 2 3 4 5 6 7 9•Updating process equipment........................................................... 1 2 3 4 5 6 7 9•Developing new processes for new products................................... 1 2 3 4 5 6 7 9•Developing new processes for old products..................................... 1 2 3 4 5 6 7 9
DELIVERY• provide fast deliveries ...................................................... 1 2 3 4 5 6 7 9• meet delivery promises ..................................................... 1 2 3 4 5 6 7 9
COST• reduce inventory ............................................................. 1 2 3 4 5 6 7 9• increase capacity utilization ............................................... 1 2 3 4 5 6 7 9• increase equipment utilization ............................................ 1 2 3 4 5 6 7 9• reduce production costs ................................................... 1 2 3 4 5 6 7 9

36
PERFORMANCECompared to your competitors, indicate your position on the following dimensions.
SIGNIFICANTLY SIGNIFICANTLYLOWER EQUAL HIGHER N/O
•Market share ................................................................. 1 2 3 4 5 6 7 9•Sales growth ................................................................. 1 2 3 4 5 6 7 9