Manufacturing Cost Analysis of Fuel Cell Plug-in …austinpowereng.com/Fuel cell/2012 FCS- Fuel Cell...
27
Manufacturing Cost Analysis of Fuel Cell Plug-in Hybrid Electric Vehicle and Full Battery Electric Vehicle Yong Yang 2012 Fuel Cell Seminar Austin Power Engineering LLC 2310 W 9 th ST Unit 1 Austin, TX 78703 USA www.AUSTINPOWERENG.com [email protected] © 2012 Austin Power Engineering LLC Yong Yang November, 2012
Transcript of Manufacturing Cost Analysis of Fuel Cell Plug-in …austinpowereng.com/Fuel cell/2012 FCS- Fuel Cell...
Manufacturing Cost Analysis of Fuel Cell Plug-in Hybrid Electric Vehicle and Full Battery Electric Vehicle
Yong Yang
2012 Fuel Cell Seminar
Austin Power Engineering LLC2310 W 9th ST Unit 1
Austin, TX 78703USA
© 2012 Austin Power Engineering LLC
Yong Yang
November, 2012
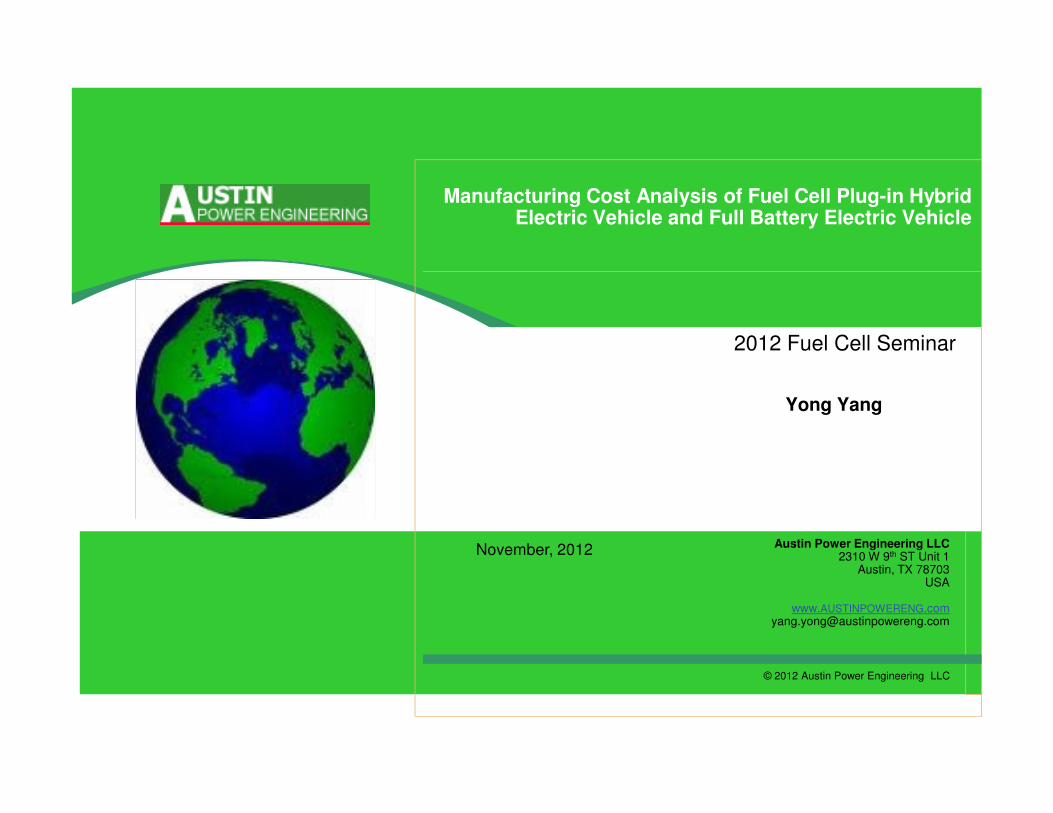
The objective was to assess the cost implications of PEM fuel cell plug-in hybrid and full battery electric middle-size passenger vehicles using current technology at mass production volume (500,000 vehicles per year).
Objective
Project ObjectiveProject Objective ContentsContents ResultsResults
PEM fuel cell /Lithium-ionbattery hybrid power chain cost analysis
• 65kWe PEM fuel cell system
• 5.6kg usable compressed H2 tank
• 16kWh lithium-ion battery pack
• Cost of fuel cell, on-board
hydrogen storage, and
lithium-ion battery
• Total cost of ownership of
fuel cell plug-in hybrid and Full electric /lithium-ion
11
Total costs of ownership for mid-size passenger vehicles using PEM fuel cell hybrid and full electric power chains were evaluated.
fuel cell plug-in hybrid and
full battery electric vehicles
• Identification of factors
with significant impact on
power chain costs
• Identification of areas
where more research could
lead to significant reductions
in power chain cost
Full electric /lithium-ion battery power chain cost analysis
•78kWh lithium-ion battery pack
Total cost of ownership (TCO) analysis of fuel cell hybrid and full electric vehicles
• Fuel cell hybrid vehicle TCO
• Full electric vehicle TCO
• 3-year, 5-year, 10-year, and 15-year TCO
2012 YY
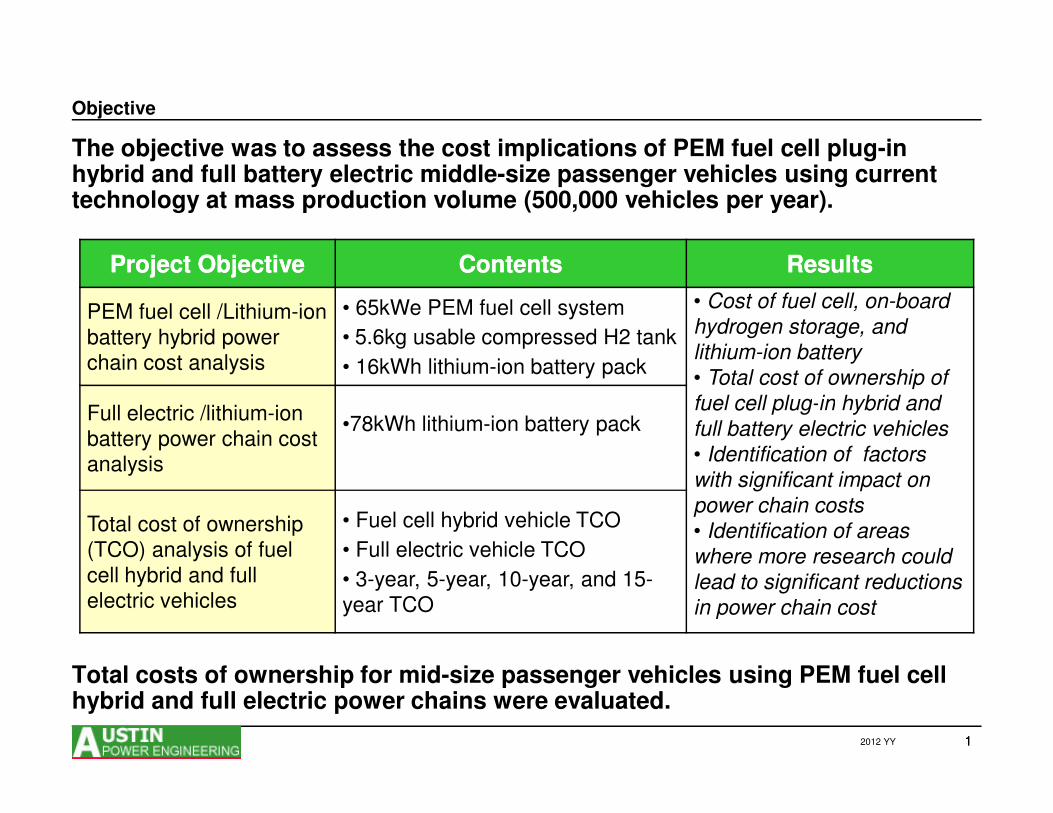
A technical cost model can be applied to the product’s entire life cycle.
Introduction Technical Cost Model Overview
Market Research
Product R & D
NPIMass
Production
Product R & D
• Evaluate impact of process choices by comparing
New Product Introduction
• Know key product cost drivers
• Identify cost reduction opportunities
Mass Production
2
• Evaluate competitive product costs
• Establish target costs for product concepts
Market Research
• Evaluate cost and manufacturing feasibility of concept designs
• Develop product cost estimates for detailed designs and the manufacturing plan
• Develop capital expenditure budgets for design and production scenarios
Product R & D choices by comparing process scenarios and process simulation
• Economies of scale analysis will help estimate product costs at different production volumes
Pro
du
cti
on
Vo
lum
e
Evolution
2012 YY

Introduction Typical Cost Model Structure
Combining performance and cost models will easily generate cost results, even when varying the design inputs.
Model Inputs Model Data Processing Model Outputs
Purchased
Components
Purchased
Component
DatabaseSensitivity
Analysis
Scenario
Management
Performance
Design Changes
Production Volume
Manufacturing Assumptions
…
3
System
Configurations
Cost
Outputs
Bill of Material
(BOM)
Value
Chain
Design
Fabricated
Components
Material
Selection
Process
Plan
Material
Database
Process
DatabaseProduction
Database
Equipment & Tooling Database
Cost
Calculation
Economies of Scale Analysis
Scenario
Analysis
Life Cycle Cost
Analysis
System
Optimization
Performance
Data
Performance
Model
System
Design
2012 YY

Approach Manufacturing Cost Modeling Methodology
This approach has been used successfully for estimating the cost of various technologies for commercial clients and the DOE.
Technology Assessment
Manufacturing Cost Model
Scenario Analyses
Verification & Validation
• Literature research
• Definition of system and
component diagrams
• Size components
• Develop bill-of-
materials (BOM)
• Define system value
chain
• Quote off-shelve parts
and materials
• Select materials
• Develop processes
• Technology scenarios
• Sensitivity analysis
• Economies of Scale
• Supply chain &
manufacturing system
optimization
• Cost model internal
verification reviews
• Discussion with
technical developers
• Presentations to project
and industrial partners
4
materials (BOM) • Develop processes
• Assembly bottom-up
cost model
•Develop baseline costs
optimization
• Life cycle cost analysis
and industrial partners
• Audition by
independent reviewers
Membrane8.0%
Stack Conditioning
2.7%
Seal8.4%
Balance of Stack2.4%
Bipolar Plate26.1%
GDL5.1%
Electrode41.0%
Stack Assembly6.3%
2012 YY
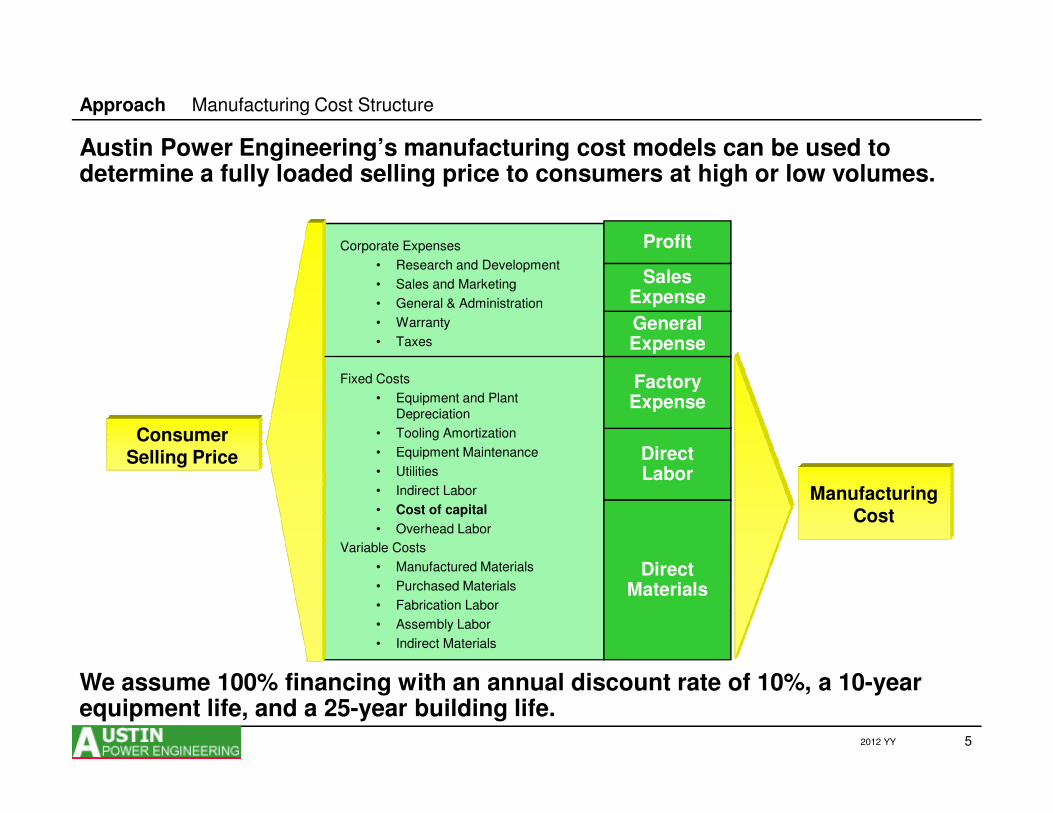
Austin Power Engineering’s manufacturing cost models can be used to determine a fully loaded selling price to consumers at high or low volumes.
FactoryExpense
GeneralExpense
SalesExpense
Profit
Fixed Costs
• Equipment and Plant Depreciation
Corporate Expenses
• Research and Development
• Sales and Marketing
• General & Administration
• Warranty
• Taxes
Approach Manufacturing Cost Structure
5
DirectLabor
DirectMaterials
Expense
Consumer Selling Price
Depreciation
• Tooling Amortization
• Equipment Maintenance
• Utilities
• Indirect Labor
• Cost of capital
• Overhead Labor
Variable Costs
• Manufactured Materials
• Purchased Materials
• Fabrication Labor
• Assembly Labor
• Indirect Materials
Manufacturing Cost
We assume 100% financing with an annual discount rate of 10%, a 10-year equipment life, and a 25-year building life.
2012 YY
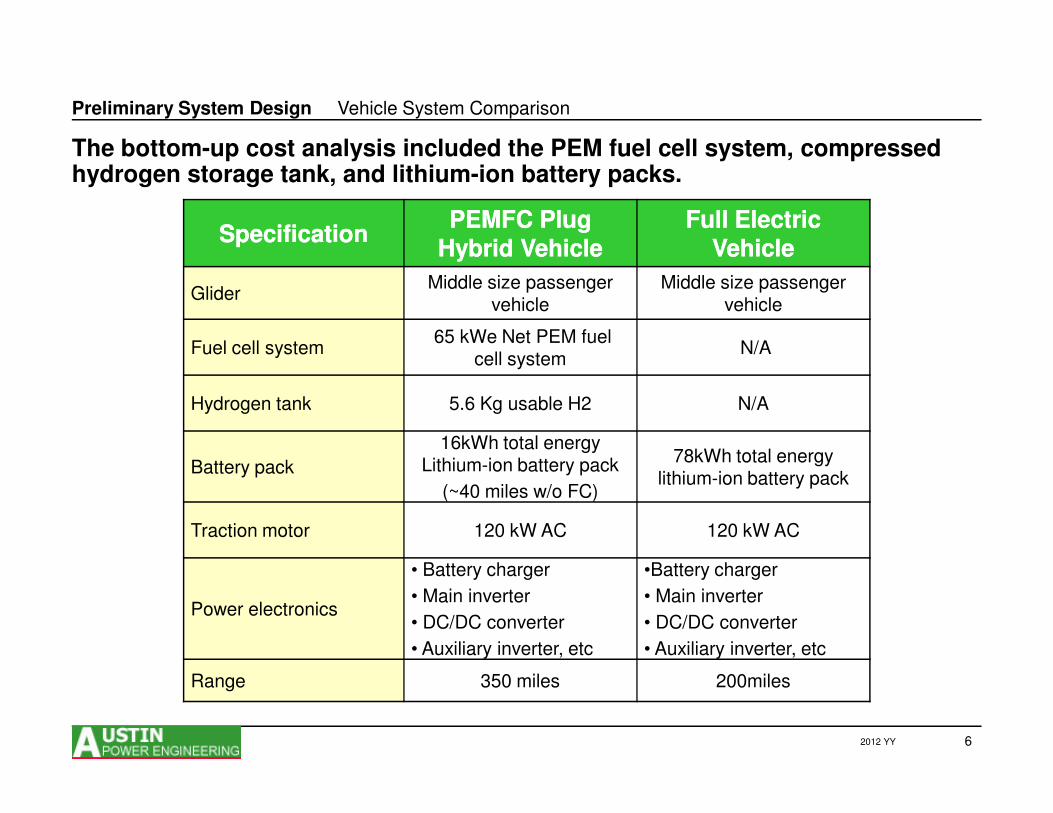
The bottom-up cost analysis included the PEM fuel cell system, compressed hydrogen storage tank, and lithium-ion battery packs.
Preliminary System Design Vehicle System Comparison
SpecificationSpecificationPEMFC Plug PEMFC Plug
Hybrid VehicleHybrid VehicleFull Electric Full Electric
VehicleVehicle
GliderMiddle size passenger
vehicleMiddle size passenger
vehicle
Fuel cell system65 kWe Net PEM fuel
cell systemN/A
Hydrogen tank 5.6 Kg usable H2 N/A
6
Hydrogen tank 5.6 Kg usable H2 N/A
Battery pack
16kWh total energy Lithium-ion battery pack
(~40 miles w/o FC)
78kWh total energy lithium-ion battery pack
Traction motor 120 kW AC 120 kW AC
Power electronics
• Battery charger
• Main inverter
• DC/DC converter
• Auxiliary inverter, etc
•Battery charger
• Main inverter
• DC/DC converter
• Auxiliary inverter, etc
Range 350 miles 200miles
2012 YY
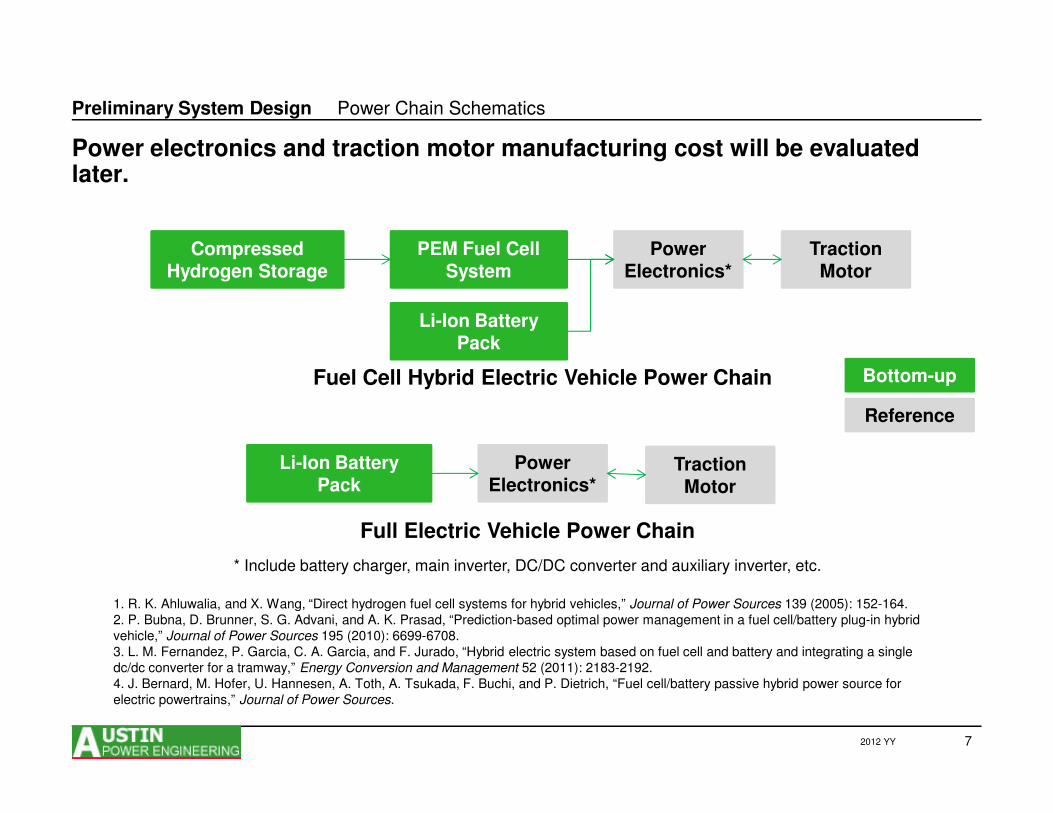
Power electronics and traction motor manufacturing cost will be evaluated later.
Preliminary System Design Power Chain Schematics
Compressed Hydrogen Storage
PEM Fuel Cell System
Li-Ion Battery Pack
Power Electronics*
Traction Motor
Bottom-up
Reference
Fuel Cell Hybrid Electric Vehicle Power Chain
7
Li-Ion Battery Pack
Power Electronics*
Traction Motor
Reference
* Include battery charger, main inverter, DC/DC converter and auxiliary inverter, etc.
Full Electric Vehicle Power Chain
1. R. K. Ahluwalia, and X. Wang, “Direct hydrogen fuel cell systems for hybrid vehicles,” Journal of Power Sources 139 (2005): 152-164.2. P. Bubna, D. Brunner, S. G. Advani, and A. K. Prasad, “Prediction-based optimal power management in a fuel cell/battery plug-in hybrid vehicle,” Journal of Power Sources 195 (2010): 6699-6708.3. L. M. Fernandez, P. Garcia, C. A. Garcia, and F. Jurado, “Hybrid electric system based on fuel cell and battery and integrating a single dc/dc converter for a tramway,” Energy Conversion and Management 52 (2011): 2183-2192.4. J. Bernard, M. Hofer, U. Hannesen, A. Toth, A. Tsukada, F. Buchi, and P. Dietrich, “Fuel cell/battery passive hybrid power source for electric powertrains,” Journal of Power Sources.
2012 YY
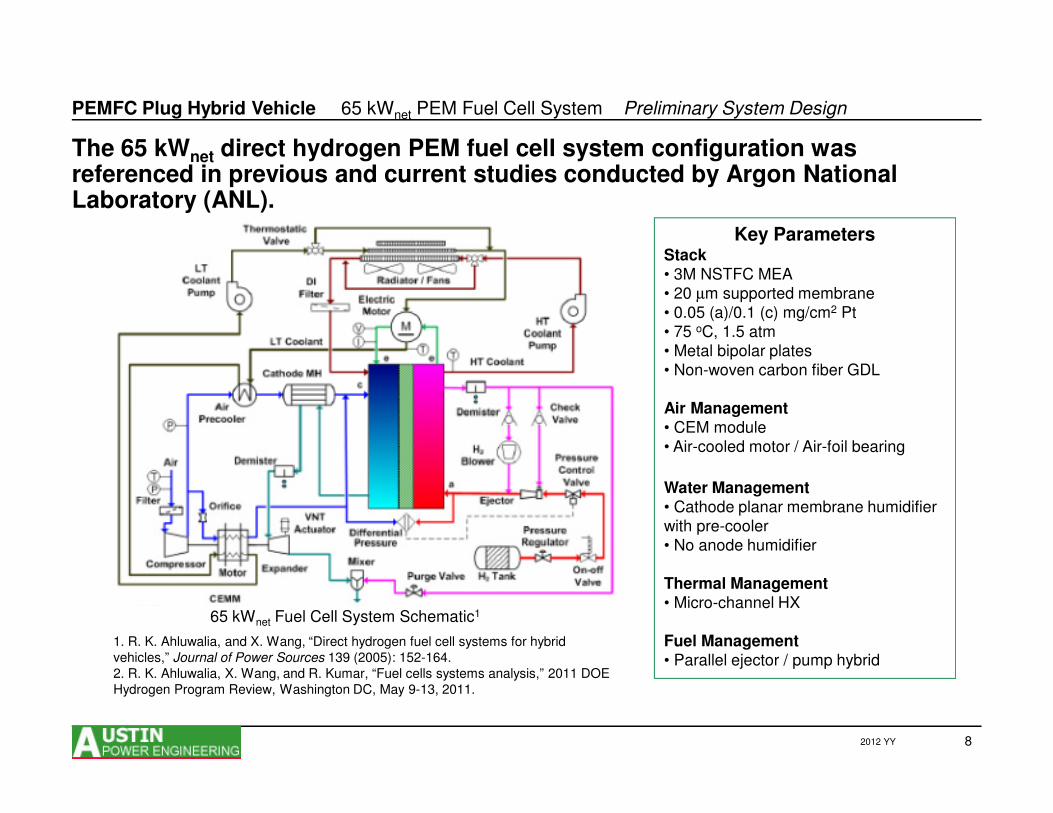
The 65 kWnet direct hydrogen PEM fuel cell system configuration was referenced in previous and current studies conducted by Argon National Laboratory (ANL).
PEMFC Plug Hybrid Vehicle 65 kWnet PEM Fuel Cell System Preliminary System Design
Key ParametersStack• 3M NSTFC MEA• 20 µm supported membrane• 0.05 (a)/0.1 (c) mg/cm2 Pt• 75 oC, 1.5 atm• Metal bipolar plates• Non-woven carbon fiber GDL
Air Management
8
1. R. K. Ahluwalia, and X. Wang, “Direct hydrogen fuel cell systems for hybrid vehicles,” Journal of Power Sources 139 (2005): 152-164.2. R. K. Ahluwalia, X. Wang, and R. Kumar, “Fuel cells systems analysis,” 2011 DOE Hydrogen Program Review, Washington DC, May 9-13, 2011.
25 W DMFC system configuration1, 2
65 kWnet Fuel Cell System Schematic1
Air Management• CEM module• Air-cooled motor / Air-foil bearing
Water Management• Cathode planar membrane humidifier with pre-cooler• No anode humidifier
Thermal Management• Micro-channel HX
Fuel Management• Parallel ejector / pump hybrid
2012 YY

Based on ANL’s stack performance analysis, we made the following system and material assumptions for the cost estimation.
PEMFC Plug Hybrid Vehicle 65 kWnet PEM Fuel Cell System Preliminary System Design
Stack ComponentsStack Components UnitUnit Current SystemCurrent System CommentsComments
Production volume systems/year 500,000 High volumeStacks’ net power kW 65Stacks’ gross power kW 72Stacks’ gross power density mW/cm2 930Max. stack temp. Degree C 90Platinum price $/tr.oz. $1,475 This year averagePt loading mg/cm2 0.15Membrane type Reinforced Nafion®
Membrane thickness micro meter 20
9
Membrane thickness micro meter 20
GDL layerNone-woven carbon
paperGDL thickness micro meter 185 @50 kPa pressureMPL layer thickness micro meter 40
Bipolar plate type76Fe-20Cr-4V with nitridation surface
treatmentBipolar plate base material Thickness
micro meter 100
Seal material Viton®
Pt price was $1,475/tr.oz. for the baseline, which was the average Pt price this year.
2012 YY
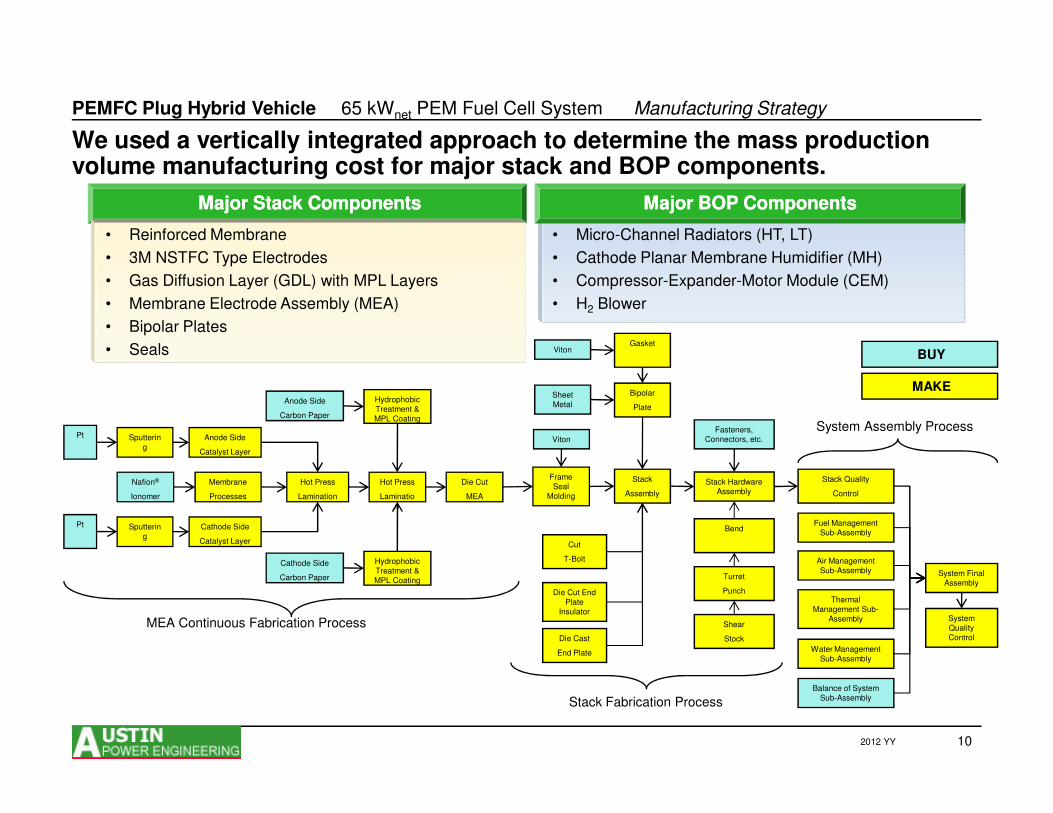
PEMFC Plug Hybrid Vehicle 65 kWnet PEM Fuel Cell System Manufacturing Strategy
We used a vertically integrated approach to determine the mass production volume manufacturing cost for major stack and BOP components.
• Micro-Channel Radiators (HT, LT)
• Cathode Planar Membrane Humidifier (MH)
• Compressor-Expander-Motor Module (CEM)
• H2 Blower
Major Stack Major Stack ComponentsComponents Major BOP Major BOP ComponentsComponents
• Reinforced Membrane
• 3M NSTFC Type Electrodes
• Gas Diffusion Layer (GDL) with MPL Layers
• Membrane Electrode Assembly (MEA)
• Bipolar Plates
• Seals BUY
MAKEAnode Side Hydrophobic
Treatment &
Bipolar
Plate
GasketViton
Sheet Metal
10
Sputtering
Anode Side
Catalyst Layer
Membrane
Processes
Cathode Side
Catalyst Layer
Sputtering
Hot Press
Lamination
Hot Press
Lamination
Carbon Paper
Die Cut
MEA
MEA Continuous Fabrication Process
Treatment & MPL Coating
Cathode Side
Carbon Paper
Hydrophobic Treatment & MPL Coating
Pt
Pt
Nafion®
Ionomer
System Quality Control
Fuel Management Sub-Assembly
System Final Assembly
Thermal Management Sub-
Assembly
Water Management Sub-Assembly
Air Management Sub-Assembly
Balance of System Sub-Assembly
Stack Hardware Assembly
Stack Quality
Control
Stack
Assembly
Plate
Shear
Stock
Turret
Punch
Bend
Die Cut End Plate
Insulator
Die Cast
End Plate
Cut
T-Bolt
Fasteners, Connectors, etc.
Stack Fabrication Process
System Assembly Process
Frame Seal
Molding
Viton
Metal
2012 YY

A 65 kWnet PEM fuel cell stack cost $26/kW. Electrodes, bipolar plates, and membranes were the top three cost drivers.
PEMFC Plug Hybrid Vehicle 65 kWnet PEM Fuel Cell Stack Preliminary Cost Results
65 kW65 kWnet net PEM Fuel Cell Stack Cost PEM Fuel Cell Stack Cost ($25.7/kW($25.7/kWnetnet))
Stack Stack ComponentsComponents
2012 Stack 2012 Stack Manufacturing Manufacturing
Cost ($/kW)Cost ($/kW)CommentsComments
Membrane 2.14 PFSA ionomer ($80/lb)
Electrodes 10.77 3M NSTFC
GDL 1.23 No-Woven carbon paper
Seals 2.10 Viton
Membrane8.3%
Stack Conditioning
2.5%
Seal8.2%
Balance of Stack2.5%
Stack Assembly6.1%
11
Seals 2.10 Viton
Bipolar plates 6.63 Nitrided metallic plates
Balance of stack 0.64Manifold, end plates,
current collectors, insulators, tie bolts, etc.
Stack assembly1 1.58 Robotic assembly
Stack conditioning 0.65 2 hours
Total stack2 25.7
1. Stack assembly cost category included MEA assembly and stack QC; QC included visual inspection, and leak tests for fuel, air, and coolant loops.2. Results may not appear to calculate due to rounding of the component cost results.
Bipolar Plate25.8%
GDL4.8%
Electrode41.9%
2012 YY

PEMFC Plug Hybrid Vehicle 65 kWnet PEM Fuel Cell System Preliminary Cost Results
65 kW65 kWnet net PEM Fuel Cell System Cost PEM Fuel Cell System Cost ($4,030/system)($4,030/system)
A 65 kWnet PEM fuel cell system cost $62/kW. Stack, air management, and thermal management were the top three cost drivers.
System System ComponentsComponents
2012 System 2012 System Manufacturing Manufacturing
Cost ($/kW)Cost ($/kW)CommentsComments
Stack 25.7
Water management 1.8Cathode side humidifier,
etc.Thermalmanagement
6.5 HX, coolant pump, etc.
Stack41.6%
Fuel Management9.4%
Balance of System7.7%
System Assembly7.5%
12
management6.5 HX, coolant pump, etc.
Fuel management 5.8 H2 pump, etc.
Air management 12.7 CEM, etc.
Balance of system 4.8Sensors, controls, wire
harness, piping, etc.
System assembly 4.6
Total system1, 2 62.0
Water Management
3.0%Thermal Management
10.5%
Air Management20.5%
1. Assumed 15% markup to the automotive OEM for BOP components2. Results may not appear to calculate due to rounding of the component cost results.
2012 YY
The 65 kWnet direct hydrogen PEM fuel cell system cost $4,030 at the mass production volume.
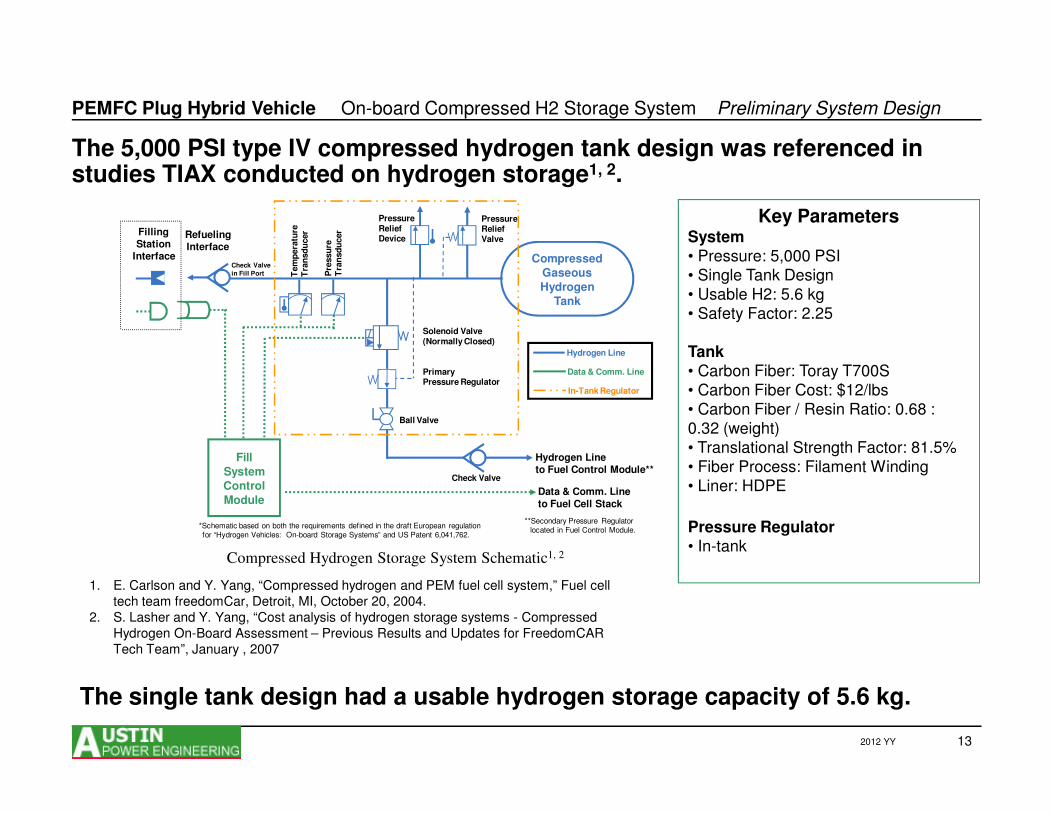
The 5,000 PSI type IV compressed hydrogen tank design was referenced in studies TIAX conducted on hydrogen storage1, 2.
PEMFC Plug Hybrid Vehicle On-board Compressed H2 Storage System Preliminary System Design
Key ParametersSystem• Pressure: 5,000 PSI• Single Tank Design• Usable H2: 5.6 kg• Safety Factor: 2.25
Tank• Carbon Fiber: Toray T700S• Carbon Fiber Cost: $12/lbs• Carbon Fiber / Resin Ratio: 0.68 :
CompressedGaseousHydrogen
Tank
RefuelingInterface
Hydrogen Line
Data & Comm. Line
FillingStation
Interface
Solenoid Valve (Normally Closed)
PrimaryPressure Regulator
PressureReliefDevice
Pre
ssu
reT
ran
sd
ucer
Tem
pera
ture
Tra
nsd
ucer
PressureReliefValve
Check Valve
in Fill Port
In-Tank Regulator
13
1. E. Carlson and Y. Yang, “Compressed hydrogen and PEM fuel cell system,” Fuel cell tech team freedomCar, Detroit, MI, October 20, 2004.
2. S. Lasher and Y. Yang, “Cost analysis of hydrogen storage systems - Compressed Hydrogen On-Board Assessment – Previous Results and Updates for FreedomCARTech Team”, January , 2007
Compressed Hydrogen Storage System Schematic1, 2
The single tank design had a usable hydrogen storage capacity of 5.6 kg.
• Carbon Fiber / Resin Ratio: 0.68 : 0.32 (weight)• Translational Strength Factor: 81.5%• Fiber Process: Filament Winding• Liner: HDPE
Pressure Regulator• In-tank
*Schematic based on both the requirements defined in the draft European regulationfor “Hydrogen Vehicles: On-board Storage Systems” and US Patent 6,041,762.
**Secondary Pressure Regulatorlocated in Fuel Control Module.
FillSystemControlModule
Hydrogen Line to Fuel Control Module**
Data & Comm. Line to Fuel Cell Stack
Ball Valve
Check Valve
2012 YY

Assumptions for the hydrogen storage tank design were based on the literature review and third-party discussions.
PEMFC Plug Hybrid Vehicle On-board Compressed H2 Storage System Preliminary System Design
Stack ComponentsStack Components UnitUnit Current SystemCurrent System CommentsComments
Production volume systems/year 500,000 High VolumeUsable hydrogen Kg 5.6Recoverable H2 in the tank IV With HDPE linerTank type IV With HDPE linerTank pressure PSI 5,000# of tanks Per System 1Safety factor 2.25Tank length/diameter ratio 3:1Carbon fiber type Toray T700S
14
Carbon fiber type Toray T700SCarbon fiber cost $/lbs 12Carbon fiber vs. resin ratio 0.68:0.32 Weight Carbon fiber translationalStrength factor
81.5%
Damage resistant outer layer material
S-GlassCould be replaced by cheaper E-glass
S-Glass cost $/lbs 7
Impact resistant end domematerial
Rigid Foam
Rigid foam cost $/kg 3Liner material HDPELiner thickness Inch 1/4In tank regulator cost $/unit 150
2012 YY
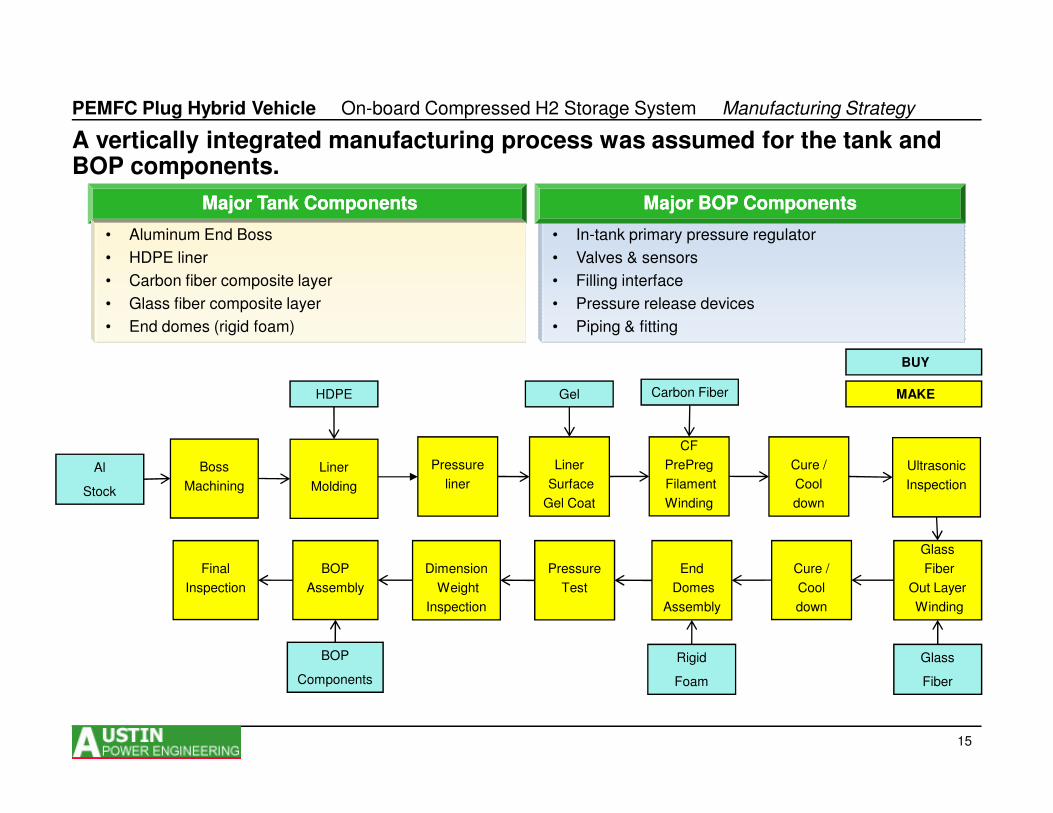
A vertically integrated manufacturing process was assumed for the tank and BOP components.
PEMFC Plug Hybrid Vehicle On-board Compressed H2 Storage System Manufacturing Strategy
HDPE Carbon Fiber
BUY
MAKEGel
• In-tank primary pressure regulator
• Valves & sensors
• Filling interface
• Pressure release devices
• Piping & fitting
Major Tank Major Tank ComponentsComponents Major BOP Major BOP ComponentsComponents
• Aluminum End Boss
• HDPE liner
• Carbon fiber composite layer
• Glass fiber composite layer
• End domes (rigid foam)
15
Liner
Molding
Pressure
liner
Liner
Surface
Gel Coat
CF
PrePreg
Filament
Winding
Cure /
Cool
down
Ultrasonic
Inspection
Glass
Fiber
Out Layer
Winding
End
Domes
Assembly
Pressure
Test
Dimension
Weight
Inspection
Cure /
Cool
down
BOP
Assembly
Boss
Machining
Final
Inspection
Al
Stock
Glass
Fiber
Rigid
Foam
BOP
Components
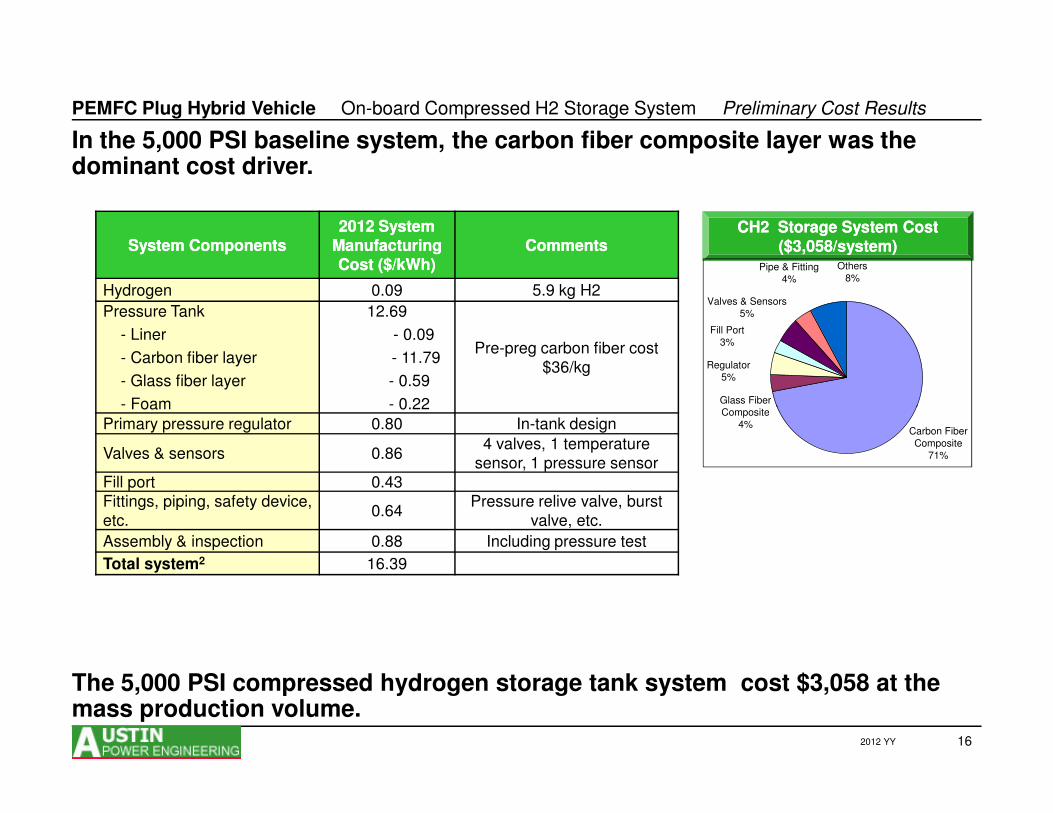
PEMFC Plug Hybrid Vehicle On-board Compressed H2 Storage System Preliminary Cost Results
CH2 Storage System Cost CH2 Storage System Cost ($3,058/system)($3,058/system)
In the 5,000 PSI baseline system, the carbon fiber composite layer was the dominant cost driver.
System ComponentsSystem Components2012 System 2012 System
Manufacturing Manufacturing Cost ($/kWh)Cost ($/kWh)
CommentsComments
Hydrogen 0.09 5.9 kg H2
Pressure Tank
- Liner
- Carbon fiber layer
- Glass fiber layer
- Foam
12.69
- 0.09
- 11.79
- 0.59
- 0.22
Pre-preg carbon fiber cost $36/kg Regulator
5%
Valves & Sensors5%
Fill Port3%
Pipe & Fitting4%
Others8%
Glass Fiber Composite
16
- Foam - 0.22
Primary pressure regulator 0.80 In-tank design
Valves & sensors 0.864 valves, 1 temperature
sensor, 1 pressure sensorFill port 0.43Fittings, piping, safety device, etc.
0.64Pressure relive valve, burst
valve, etc.
Assembly & inspection 0.88 Including pressure test
Total system2 16.39
Carbon Fiber Composite
71%
Composite4%
2012 YY
The 5,000 PSI compressed hydrogen storage tank system cost $3,058 at the mass production volume.

A lithium-ion battery pack was designed to drive a middle-sized vehicle approximately 40 miles without using the fuel cell.
PEMFC Plug Hybrid Vehicle Lithium-Ion Battery Pack Preliminary System Design
Low Voltage
Ba
ttery
Ma
na
ge
me
nt S
ys
tem
s
Key ParametersSystem• Energy storage capacity: 10 kWh usable • Total energy capacity: 16kWh• Percent SOC: 80%• Fade: 20%
Cell
Th
erm
al M
an
ag
em
en
t Sys
tem
Lithium-ion Battery Pack
Battery Modules
17
Voltage Monitorin
g
High Voltage System
Ba
ttery
Ma
na
ge
me
nt S
ys
tem
s
(BM
S)
BOP
Cell• Cell format: Pouch cell• Cathode active Material: manganese spinel•Anode active material: graphite
Th
erm
al M
an
ag
em
en
t Sys
tem
Battery Cells2
1. US patent 201002479992. US patent 20090169990Battery
Cells2
2012 YY
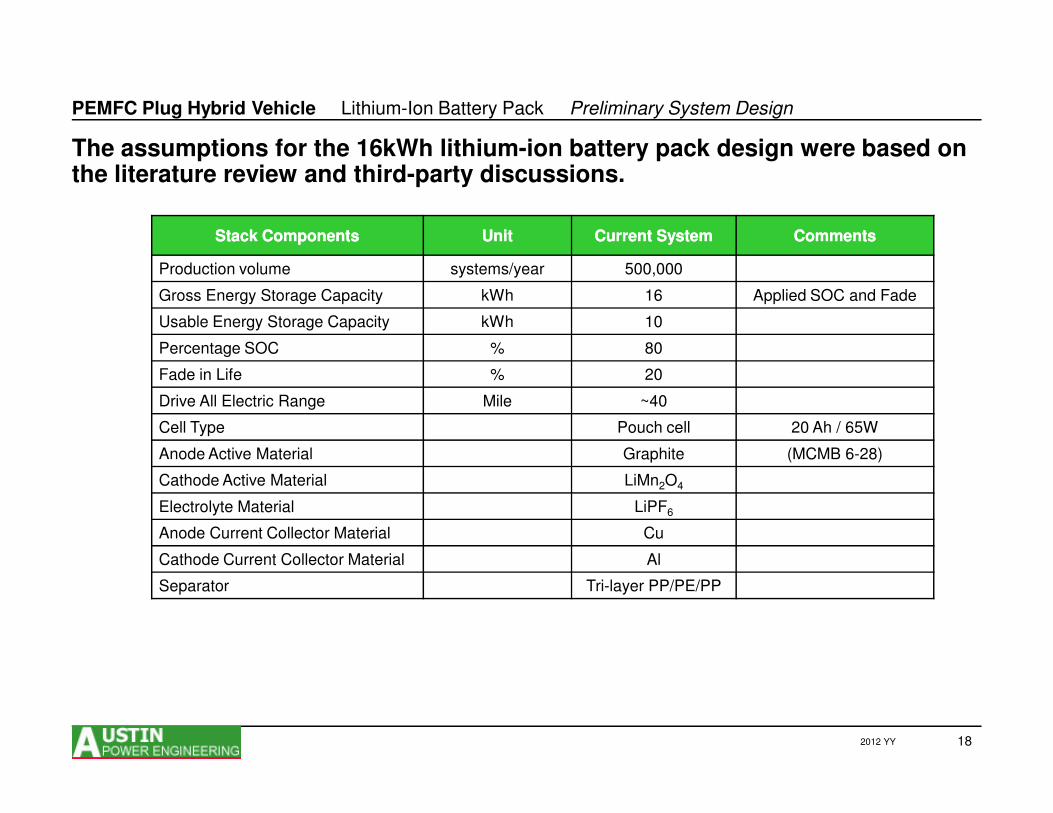
The assumptions for the 16kWh lithium-ion battery pack design were based on the literature review and third-party discussions.
PEMFC Plug Hybrid Vehicle Lithium-Ion Battery Pack Preliminary System Design
Stack ComponentsStack Components UnitUnit Current SystemCurrent System CommentsComments
Production volume systems/year 500,000
Gross Energy Storage Capacity kWh 16 Applied SOC and Fade
Usable Energy Storage Capacity kWh 10
Percentage SOC % 80
Fade in Life % 20
Drive All Electric Range Mile ~40
18
Drive All Electric Range Mile ~40
Cell Type Pouch cell 20 Ah / 65W
Anode Active Material Graphite (MCMB 6-28)
Cathode Active Material LiMn2O4
Electrolyte Material LiPF6
Anode Current Collector Material Cu
Cathode Current Collector Material Al
Separator Tri-layer PP/PE/PP
2012 YY

A vertically integrated manufacturing process was assumed for the four-level battery pack fabrication: electrode, cell, module, and pack.
PEMFC Plug Hybrid Vehicle Lithium-Ion Battery Pack Manufacturing Strategy
Electrodes Cells
19
Modules
Packs
2012 YY

The lithium-ion battery system cost $439 /kWh. Of that, the material costs were approximately 60% and the process costs were approximately 40%.
PEMFC Plug Hybrid Vehicle Lithium-Ion Battery Pack Preliminary Cost Results
Battery System Cost ($439 /kWh)Battery System Cost ($439 /kWh)Cost CategoryCost Category
Cell Cost Cell Cost ($/cell)($/cell)
Module Cost Module Cost ($/module)($/module)
Pack Cost Pack Cost ($/pack)($/pack)
Material 6.44 277.36 2,699
Labor 1.51 77.25 724
Equipment & tooling
0.79 25.96 210
building0.9%
Capex8.0%
Utility4.7%
Maintenance3.9%
Capital6.4%
20
The 16 kWh lithium-ion battery system cost $4,497 per pack at the mass production volume.
Utility 0.65 21.74 176
Maintenance 1.33 44.68 361
Capital cost 1.12 35.95 288
Building 0.14 4.84 40
Total 11.98 487.79 4,497
Total ($/kWh)* 288 366 439
* Based on usable energy (16 kWh x 0.8 x0.8 = 10 /kWh )
Material60.0%Labor
16.1%
8.0%
2012 YY
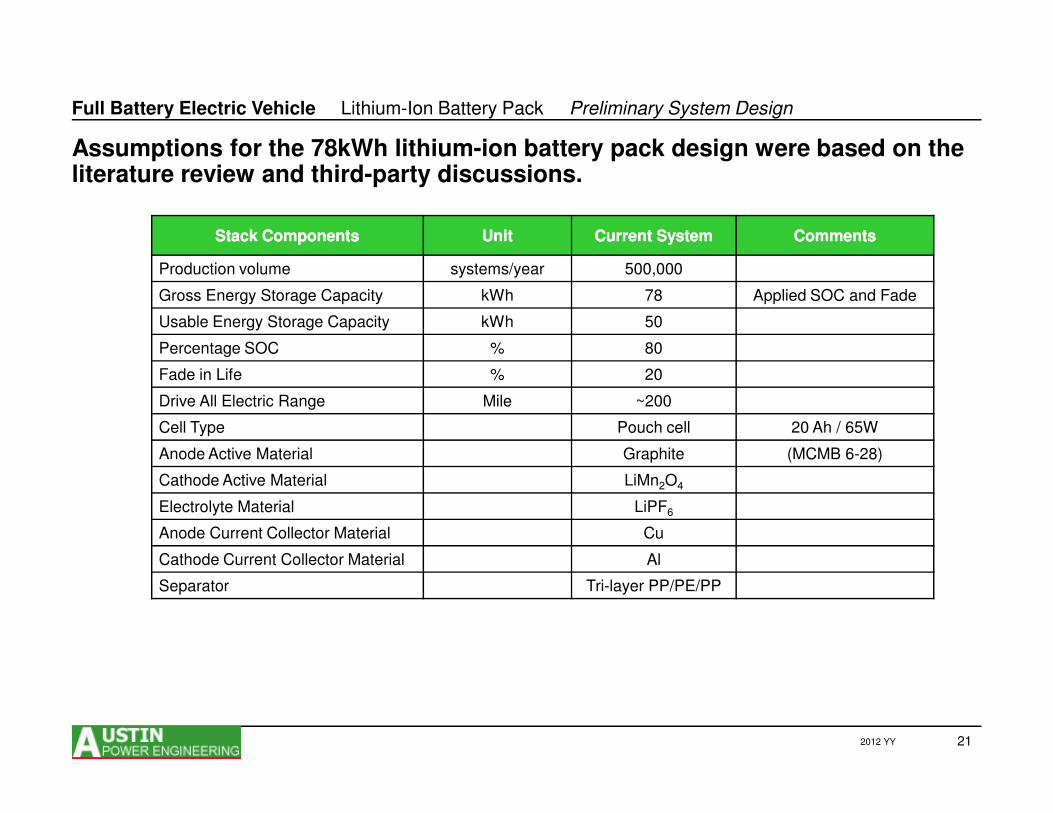
Assumptions for the 78kWh lithium-ion battery pack design were based on the literature review and third-party discussions.
Full Battery Electric Vehicle Lithium-Ion Battery Pack Preliminary System Design
Stack ComponentsStack Components UnitUnit Current SystemCurrent System CommentsComments
Production volume systems/year 500,000
Gross Energy Storage Capacity kWh 78 Applied SOC and Fade
Usable Energy Storage Capacity kWh 50
Percentage SOC % 80
Fade in Life % 20
Drive All Electric Range Mile ~200
21
Drive All Electric Range Mile ~200
Cell Type Pouch cell 20 Ah / 65W
Anode Active Material Graphite (MCMB 6-28)
Cathode Active Material LiMn2O4
Electrolyte Material LiPF6
Anode Current Collector Material Cu
Cathode Current Collector Material Al
Separator Tri-layer PP/PE/PP
2012 YY

The lithium-ion battery system cost $390 /kWh. Of that, the material costs were approximately 56% and the process costs were approximately 44%.
Full Battery Electric Vehicle Lithium-Ion Battery Pack Preliminary Cost Results
Battery System Cost ($390 /kWh)Battery System Cost ($390 /kWh)Cost CategoryCost Category
Cell Cost Cell Cost ($/cell)($/cell)
Module Cost Module Cost ($/module)($/module)
Pack Cost Pack Cost ($/pack)($/pack)
Material 5.79 250.25 10,958
Labor 1.48 76.09 3,375
Equipment & tooling
0.79 25.90 1,017
building1.0%
Capex
Utility5.2%
Maintenance4.3%
Capital7.0%
22
The 78 kWh lithium-ion battery system cost $19,470 per pack at the mass production volume.
Utility 0.63 21.39 841
Maintenance 1.30 43.90 1,722
Capital cost 1.10 35.06 1367
Building 0.14 4.79 190
Total 11.23 457.38 19,470
Total ($/kWh)* 270 344 390
* Based on usable energy (78 kWh x 0.8 x0.8 = 50 /kWh )
2012 YY
Material56.3%
Labor17.3%
Capex8.8%

PEM fuel cell plug-in hybrid vehicle purchase price was $30,113 and full battery electric vehicle purchase price was $41,625 at the mass production volume.
Vehicle Costs Preliminary Cost Results
Component CategoryComponent CategoryPEMFC PEMFC
Plug Hybrid Plug Hybrid ($/unit)($/unit)
Full Battery Full Battery Electric Electric ($/unit)($/unit)
CommentsComments
Glider Glider 7,000 7,000 Mid-size passenger vehicle
PEMFC 4,030 N/A Bottom-up costing
H2 storage 3,058 N/A Bottom-up costing
Battery system 4,497 19,470 Bottom-up costing
23
Power ChainTraction motor1 1,200 1,200 Motor + controller + transmission
Power electric1 840 840Battery charger, main inverter, DC/DC converter, auxiliary inverter, etc
Power chain sub-
total13,625 22,760
Total vehicle manufacturing cost 20,625 28,510
Markup2 46% 46%Corporation cost & profit, dealer cost,
shipping cost, tax
Purchase price for consumer 30,113 41,625
1. The DOE advanced power electronics & electric motors (APEEM) team reported the power electronics cost $7/kW and the motor cost $10/kW in 2012.1. Automobile Industry Retail Price Equivalent and Indirect Cost Multipliers, EPA, 2009
2012 YY
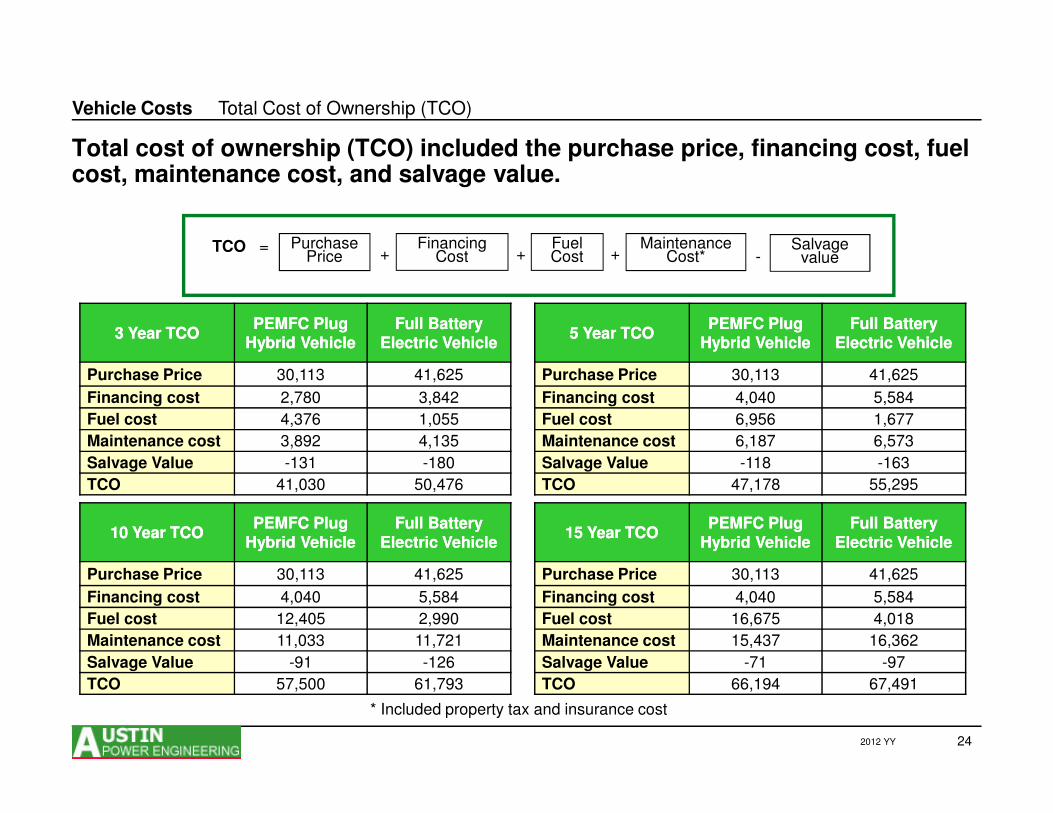
Total cost of ownership (TCO) included the purchase price, financing cost, fuel cost, maintenance cost, and salvage value.
Vehicle Costs Total Cost of Ownership (TCO)
TCO = Purchase Price +
Financing Cost +
Fuel Cost +
Maintenance Cost* -
Salvage value
3 Year TCO3 Year TCOPEMFC Plug PEMFC Plug
Hybrid VehicleHybrid VehicleFull Battery Full Battery
Electric VehicleElectric Vehicle
Purchase Price 30,113 41,625
Financing cost 2,780 3,842
5 Year TCO5 Year TCOPEMFC Plug PEMFC Plug
Hybrid VehicleHybrid VehicleFull Battery Full Battery
Electric VehicleElectric Vehicle
Purchase Price 30,113 41,625
Financing cost 4,040 5,584
24
Fuel cost 4,376 1,055
Maintenance cost 3,892 4,135
Salvage Value -131 -180
TCO 41,030 50,476
Fuel cost 6,956 1,677
Maintenance cost 6,187 6,573
Salvage Value -118 -163
TCO 47,178 55,295
10 Year TCO10 Year TCOPEMFC Plug PEMFC Plug
Hybrid VehicleHybrid VehicleFull Battery Full Battery
Electric VehicleElectric Vehicle
Purchase Price 30,113 41,625
Financing cost 4,040 5,584
Fuel cost 12,405 2,990
Maintenance cost 11,033 11,721
Salvage Value -91 -126
TCO 57,500 61,793
15 Year TCO15 Year TCOPEMFC Plug PEMFC Plug
Hybrid VehicleHybrid VehicleFull Battery Full Battery
Electric VehicleElectric Vehicle
Purchase Price 30,113 41,625
Financing cost 4,040 5,584
Fuel cost 16,675 4,018
Maintenance cost 15,437 16,362
Salvage Value -71 -97
TCO 66,194 67,491
* Included property tax and insurance cost
2012 YY

PEMFC plug-in hybrid vehicle had a TCO advantage compared to a full battery electric vehicle, especially in the first 3~5 years.
Vehicle Costs Total Cost of Ownership (TCO)
40,000
50,000
60,000
70,000
80,000T
ota
l C
os
t o
f O
we
rsh
ip (
$)
PEMFC Plug Hybrid Vehicle
Full Battery Electric Vehicle
25
* Polymer Fuel Cells – Cost reduction and market potential, Carbon Trust, Austin Power Engineering, et al. 2012
Consumers like to consider annual costs in a limited time when they make a purchase decision which is most likely in 3~5 years instead of 10~15 years*.
2012 YY
0
10,000
20,000
30,000
40,000
3-Year TCO 5-Year TCO 10-Year TCO 15-Year TCO
To
tal C
os
t o
f O
we
rsh
ip (
$)

Conclusions and Next Steps
The due diligence was preliminary. The following actions are needed to improve the current work:
• More analysis items, such as power electronics, the traction motor, system modeling, and sensitivity
• Feedback from system integrators
• Communication with component suppliers and equipment suppliers
• Possible funding opportunities for the extended work
26
Thank You!
2012 YY