Manufacturing and Assembly with Value Engineering to ... · The Use of Design for Manufacturing and...
21
The Use of Design for Manufacturing and Assembly with Value Engineering to Optimize Customer Value Presented to the CSVA Conference Program (20 Years of VA in Canada) Montreal, Canada – November 25, 2013 by Jim Bolton, PE, CVS-Life, PVM, FSAVE
Transcript of Manufacturing and Assembly with Value Engineering to ... · The Use of Design for Manufacturing and...

The Use of Design for Manufacturing and
Assembly with Value Engineering to Optimize
Customer Value Presented to the CSVA Conference Program (20 Years of VA in Canada)Montreal, Canada – November 25, 2013
by Jim Bolton, PE, CVS-Life, PVM, FSAVE
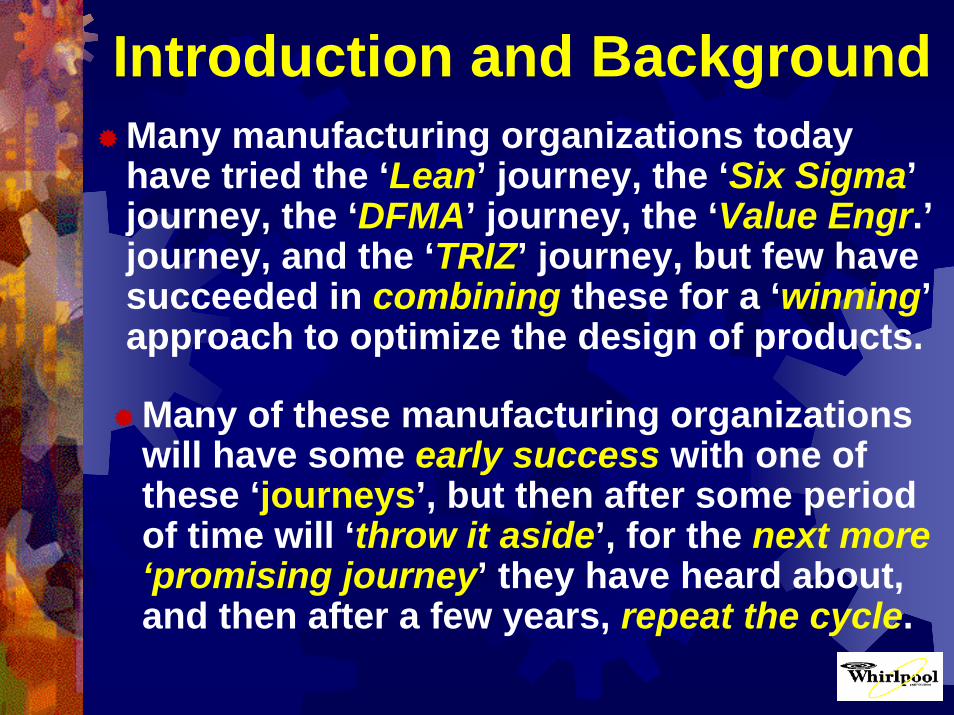
Introduction and BackgroundMany manufacturing organizations today have tried the ‘Lean’ journey, the ‘Six Sigma’journey, the ‘DFMA’ journey, the ‘Value Engr.’journey, and the ‘TRIZ’ journey, but few have succeeded in combining these for a ‘winning’approach to optimize the design of products.
Many of these manufacturing organizations will have some early success with one of these ‘journeys’, but then after some period of time will ‘throw it aside’, for the next more ‘promising journey’ they have heard about, and then after a few years, repeat the cycle.

Understanding What Customers WantCustomers of manufactured products expectthe very best value for their hard earned money.
True value may be measured in terms of a formula as illustrated below:
where a required function is any ‘work’ or ‘sell’function (as described on the next slide) and where cost is the ‘overall cost’ or the ‘life cycle cost’ of that manufactured product.
Performance of Required FuntionValue = Cost to Acquire Function
What are Functions
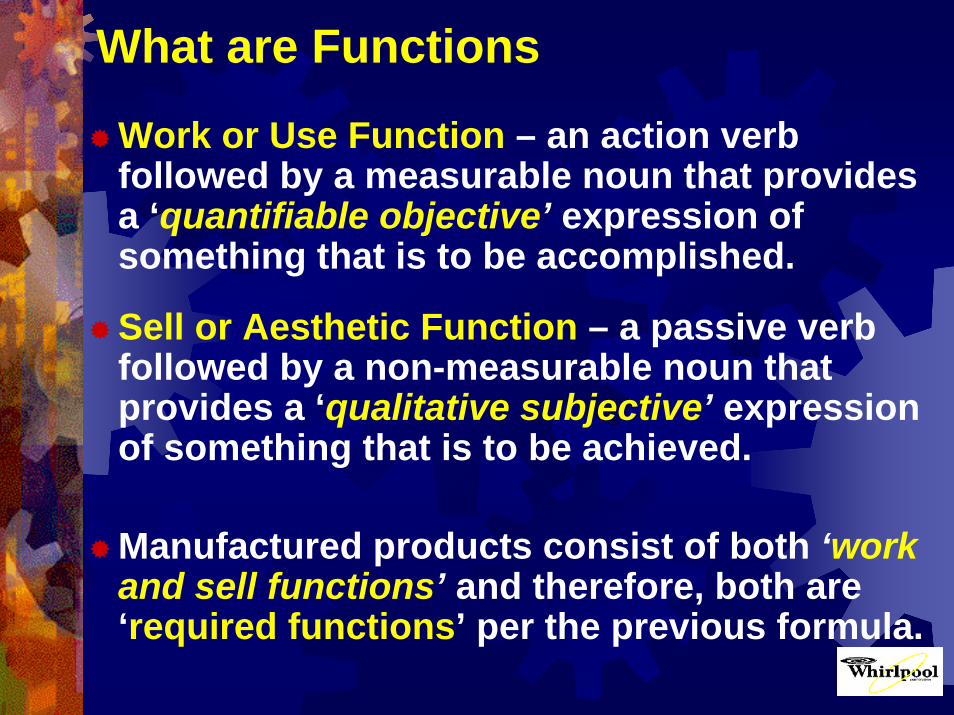
Work or Use Function – an action verb followed by a measurable noun that provides a ‘quantifiable objective’ expression of something that is to be accomplished.
Sell or Aesthetic Function – a passive verb followed by a non-measurable noun that provides a ‘qualitative subjective’ expressionof something that is to be achieved.
Manufactured products consist of both ‘work and sell functions’ and therefore, both are ‘required functions’ per the previous formula.

For Manufactured ProductsLife Cycle Cost – consists of initial costs andpost-production costs as follows:Initial Cost includes such items as:
All required direct and indirect materialsDevelopment and engineering costs including design, prototypes, validation, trail runs, etc.Packaging, inventory, handling (logistics/transport) Duty, taxes, finance costs (borrowed money), etc.Maintenance, plant related overhead and expenseSupplier and/or internal tooling and/or re-toolingEquipment capital (either new or refurbished)
Post-Production Cost includes such items as:Warranty claims, shipment damage, energy, trade agreements, service calls, recalls, etc.
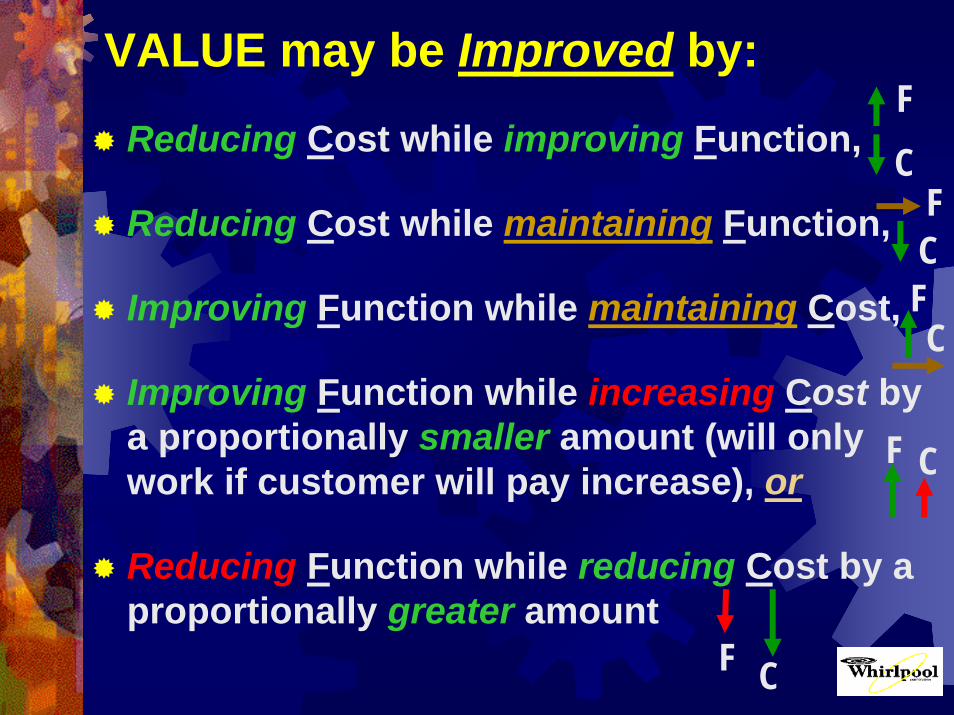
VALUE may be Improved by:
Reducing Cost while improving Function,
Reducing Cost while maintaining Function,
Improving Function while maintaining Cost,
Improving Function while increasing Cost by a proportionally smaller amount (will only work if customer will pay increase), or
Reducing Function while reducing Cost by a proportionally greater amount
FC
CF
FC
F C
F C
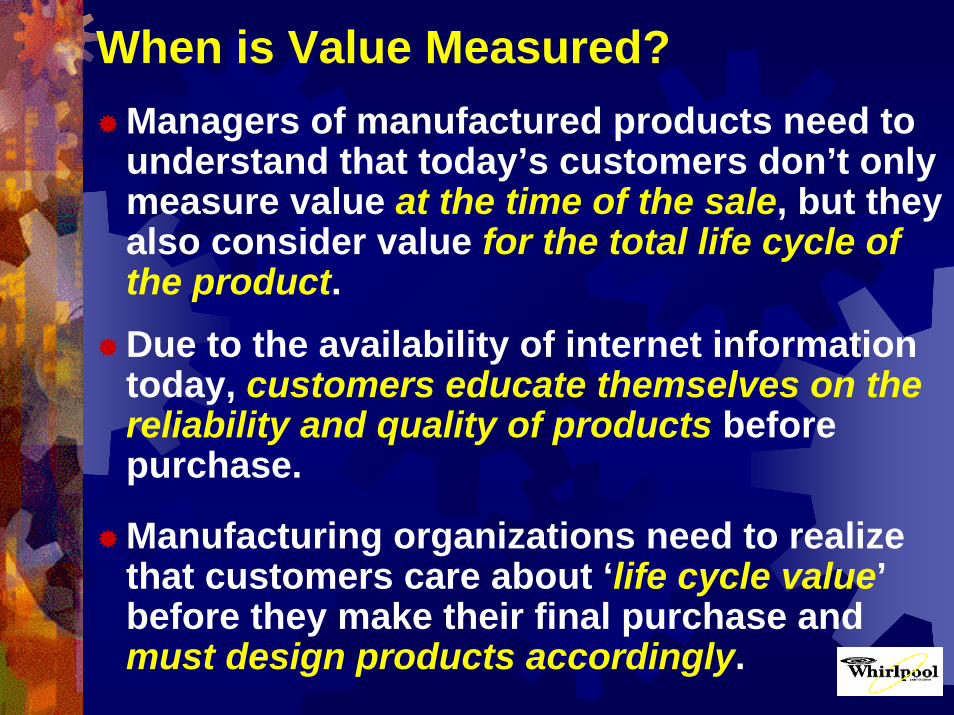
When is Value Measured?Managers of manufactured products need to understand that today’s customers don’t only measure value at the time of the sale, but they also consider value for the total life cycle of the product. Due to the availability of internet information today, customers educate themselves on the reliability and quality of products before purchase.
Manufacturing organizations need to realize that customers care about ‘life cycle value’before they make their final purchase and must design products accordingly.

Integrating DFMA with Value Methodology
DFMA can be used to develop the value of the competitor’s products which can help design teams to improve their own products.
Many times the customer requirements and functions are the same for competitor’s and your own manufactured products.
By utilizing the Value Engineering tools of the FAST Diagram and the Cost Function Worksheet of the competitor’s vs. your own products helps to identify value opportunities. See Figures 1and 2 on the following slides.

PROJECT: Date: 29JN09HOW? WHY?
"DESIGN CRITERIA" "ALL THE TIME"
VIEW FOOD
MAINTAIN DURABILITY
ACCESS FOOD
PROTECT PRODUCT
PREVENT INJURY
SERVICE PRODUCT
ADJUST TEMPERATURE
MINIMIZE ENERGY
INFORM USER
ENHANCE APPEARANCE
Basic Function Critical Path
IMPROVE TASTE
TOAST FOOD
TRANSFER RADIATION
GENERATE HEAT
CONVERT ENERGY
CONNECT CIRCUITS
APPLY FORCE
WHEN BASIC FUNCTION SECONDARY FUNCTIONS
FIGURE 1
SCOPE OF PROJECT
FAST Diagram
Higher Order
Function
Lower Order
Function
TOASTER OVEN
CAUSED BY OR AT THE SAME
TIME AS
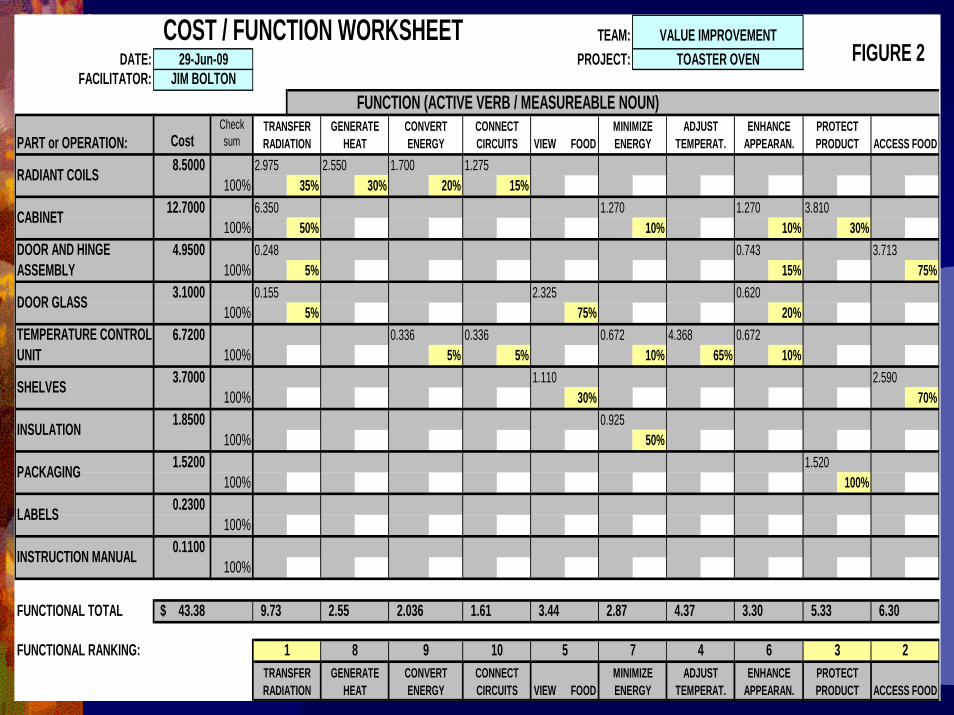
COST / FUNCTION WORKSHEETDATE:
FACILITATOR:FUNCTION (ACTIVE VERB / MEASUREABLE NOUN)
PART or OPERATION: CostCheck sum
8.5000 2.975 2.550 1.700 1.275100% 35% 30% 20% 15%
12.7000 6.350 1.270 1.270 3.810100% 50% 10% 10% 30%
4.9500 0.248 0.743 3.713100% 5% 15% 75%
3.1000 0.155 2.325 0.620100% 5% 75% 20%
6.7200 0.336 0.336 0.672 4.368 0.672100% 5% 5% 10% 65% 10%
3.7000 1.110 2.590100% 30% 70%
1.8500 0.925100% 50%
1.5200 1.520100% 100%
0.2300 100%
0.1100 100%
FUNCTIONAL TOTAL 43.38$ 9.73 2.55 2.036 1.61 3.44 2.87 4.37 3.30 5.33 6.30
FUNCTIONAL RANKING:PROTECT PRODUCT ACCESS FOODVIEW FOOD
MINIMIZE ENERGY
ADJUST TEMPERAT.
ENHANCE APPEARAN.
TRANSFER RADIATION
GENERATE HEAT
CONVERT ENERGY
CONNECT CIRCUITS
ACCESS FOOD
3 2
TRANSFER RADIATION
GENERATE HEAT
CONVERT ENERGY
CONNECT CIRCUITS VIEW FOOD
MINIMIZE ENERGY
PROTECT PRODUCT
ADJUST TEMPERAT.
ENHANCE APPEARAN.
1 8 9 10 5 7 4 6
RADIANT COILS
CABINET
DOOR AND HINGE ASSEMBLY
DOOR GLASS
TEMPERATURE CONTROL UNIT
SHELVES
INSULATION
PACKAGING
LABELS
INSTRUCTION MANUAL
29-Jun-09JIM BOLTON
FIGURE 2VALUE IMPROVEMENT
TOASTER OVENTEAM:
PROJECT:
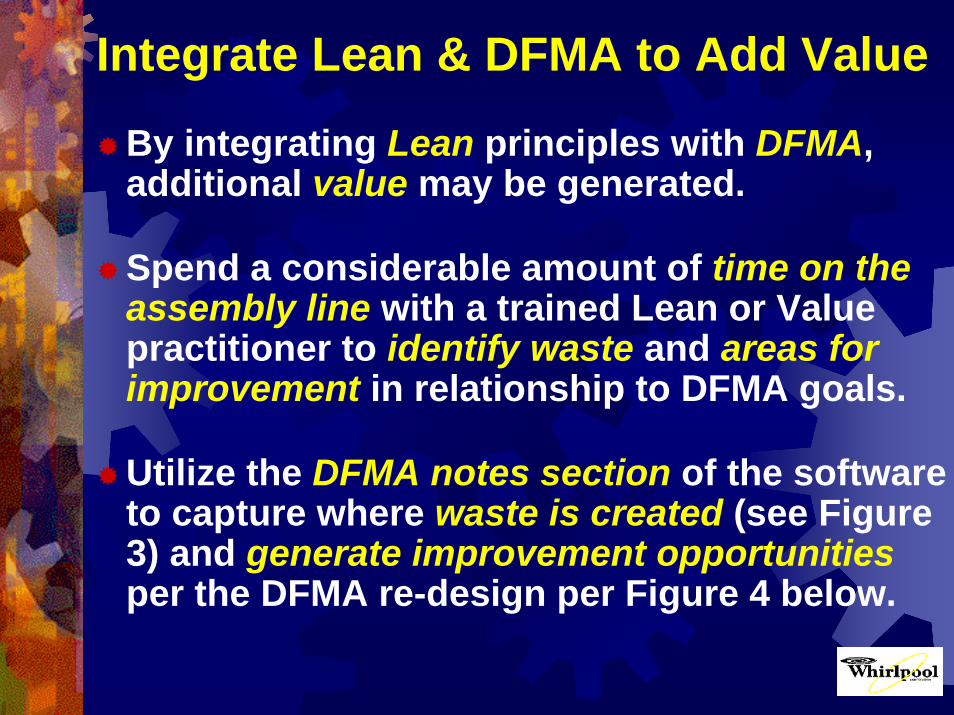
Integrate Lean & DFMA to Add Value
By integrating Lean principles with DFMA, additional value may be generated.
Spend a considerable amount of time on the assembly line with a trained Lean or Value practitioner to identify waste and areas for improvement in relationship to DFMA goals.
Utilize the DFMA notes section of the software to capture where waste is created (see Figure 3) and generate improvement opportunitiesper the DFMA re-design per Figure 4 below.
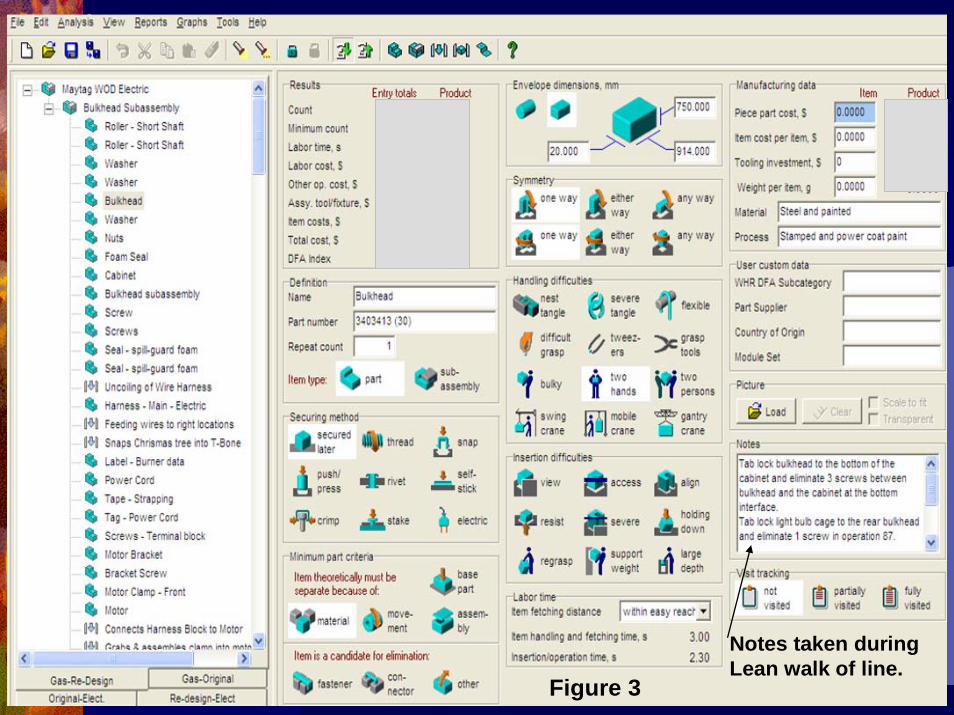
Figure 3
Notes taken during Lean walk of line.

Value enhancement opportunities by team from Lean Line Walk:
-Re-design opportunities-Labor savings ideas-Lean opportunities-Procurement ideas-Logistic ideas-Returnable packaging ideas
This is just one page of the 14 pages of notes taken by the team during the actual workshop.
Figure 4
DFA & DFMA Executive Summaries
Review the notes and suggestions for re-design generated by the DFMA software (Fig. 5), a new optimized designed is developed.
The DFA Executive Summary (Fig. 6) shows labor improvement and design optimization.
The DFMA Executive Summary shows the Design Efficiency (DFA) Index and the totalproduct cost improvement (Figure 7).
Finally, if traditional brainstorming doesn’t generate breakthrough results, TRIZ can help.

These ideas are generated by the software after loading in the original design
This is just 1 page of a 12 page reportThe DFA software will not redesign the product but just give ideas to think about on how to redesign the product along with the labor time and percentage reduction if that item can be eliminated.
Figure 5
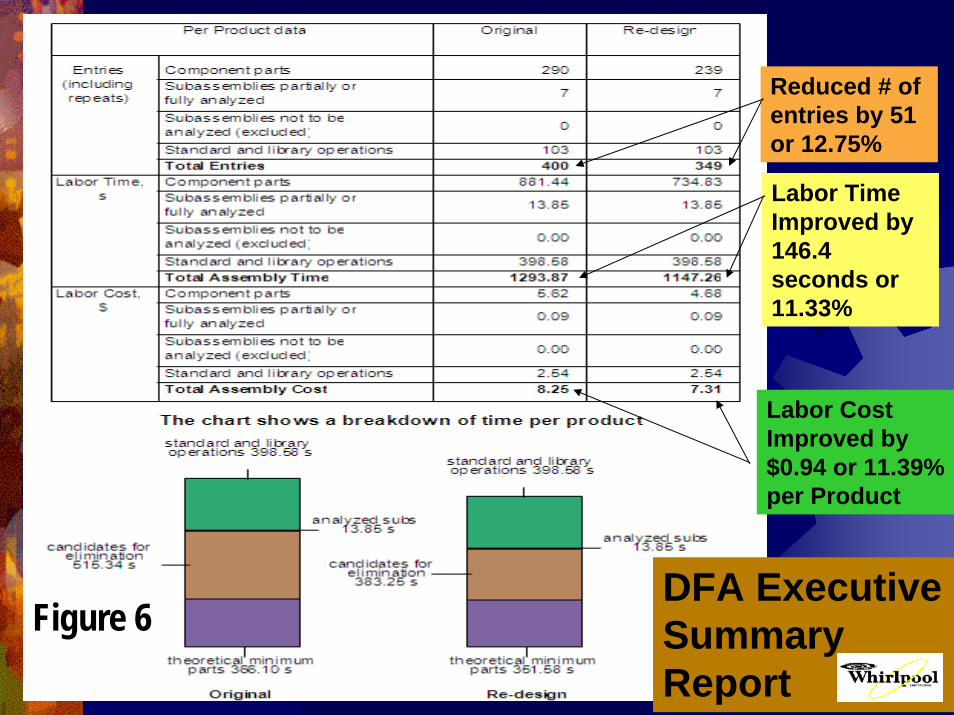
Reduced # of entries by 51 or 12.75%
Labor Time Improved by 146.4 seconds or 11.33%
Labor Cost Improved by $0.94 or 11.39% per Product
DFA Executive Summary Report
Figure 6

Reduced PNC by 20 items or 9.1%
DFA Index Improved by 2 or 8.4%
Improved Cost of 2.25% or $5.43 per unit
Potential Annual Saving Opportunity = $3.75M
DFMA Executive Summary ReportFigure 7

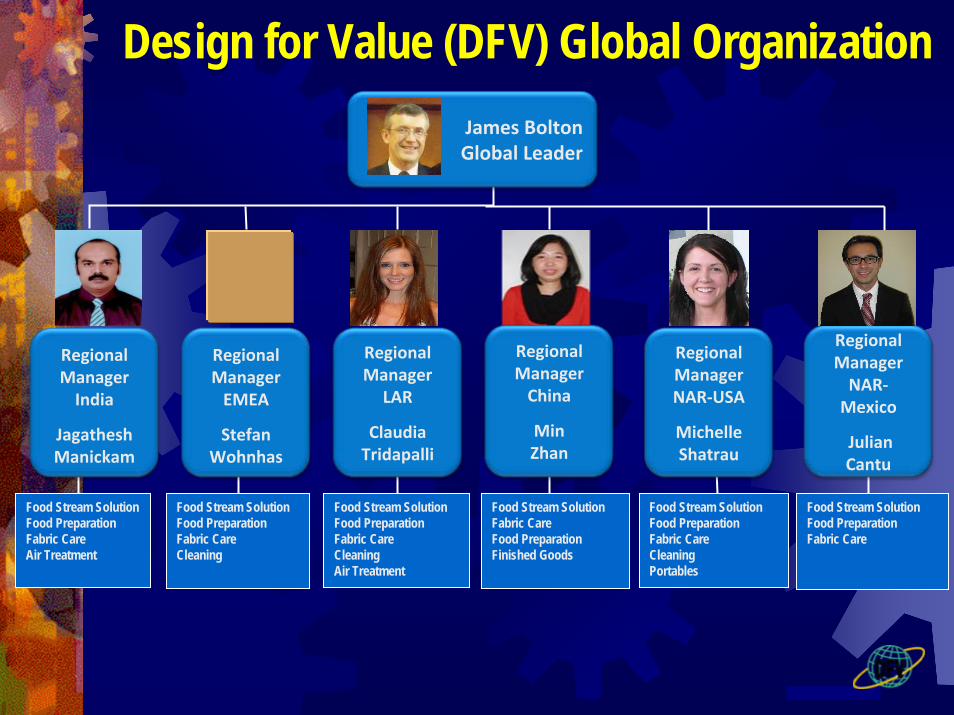
How Whirlpool Uses DFMA with VE Whirlpool combines Value Engineering with Lean, DFMA, and TRIZ to optimize the designs of their products to remain competitive by applying these tools:
In New Product Introductions (NPI) projectsIn Existing Products Improvements (EPI)
projects.
Whirlpool has established an internal global Design for Value team to apply these various Value Enhancement tools five years ago in all regions where Whirlpool operates per the following page.
James BoltonGlobal Leader
Regional Manager
LAR
Claudia Tridapalli
Regional ManagerChina
Min Zhan
Regional ManagerNAR‐USA
Michelle Shatrau
Regional ManagerNAR‐Mexico
Julian Cantu
Regional ManagerEMEA
Stefan Wohnhas
Regional ManagerIndia
Jagathesh Manickam
Design for Value (DFV) Global Organization
Food Stream SolutionFood PreparationFabric CareAir Treatment
Food Stream SolutionFood PreparationFabric CareCleaning
Food Stream SolutionFood PreparationFabric CareCleaningAir Treatment
Food Stream SolutionFabric CareFood PreparationFinished Goods
Food Stream SolutionFood PreparationFabric CareCleaningPortables
Food Stream SolutionFood PreparationFabric Care

2012 Projects TOTAL Business Cases ‐ Risk Wt./Ranked ideas
Annual Saving (USD)
2012 Tracked, Business Cases ‐ Risk Wt./Ranked ideas
Annual Saving (USD)
Actual Annual Savings (USD)
Implemented from Projects started in
2012
Actual Annual Savings (USD) Implemented from Projects Started prior to
2012
% of 2012 BC Annual Savings
Tracked in ISC/PDTS
% of Annual Savings
Implemented from Projects started in 2012
Continous Improvement Support 85,041,181$ 60,600,319$ 10,417,234$ 35,662,442$ 71.3% 17.2%
Mega Project Support 13,912,610$ 13,912,610$ n/a n/a n/a n/a
Supplier Workshop Support 14,173,343$ 561,365$ -$ 4.0% 0.0%
DFV 2012 Summary 113,127,134$ 75,074,294$ 10,417,234$ 35,662,442$
Continous Improvement (EPI) TC Mega Project
Supplier Workshops TOTAL
Asia 6,031,855$ -$ -$ 6,031,855$ EMEA 11,552,046$ 3,953,606$ -$ 15,505,652$
LAR 19,697,787$ 442,564$ 1,160,135$ 21,300,486$ NAR-USA 37,604,273$ 9,516,440$ 8,435,643$ 55,556,356$
NAR-MX 10,155,220$ -$ 4,577,565$ 14,732,785$ 85,041,181$ 13,912,610$ 14,173,343$ 113,127,134$ 75.2% 12.5%
% of 2012 BC Risk Weighted Annual Savings
from EPI Projects
% of 2012 BC Risk Weighted Annual Savings from Supplier Workshops
2012 DFV Project Tracking Status
Total Implementated Saving46,079,675$
2012 DFV Deliverables-BC Risk Weighted Annual Savings Opportunities by Region and Workshop Type
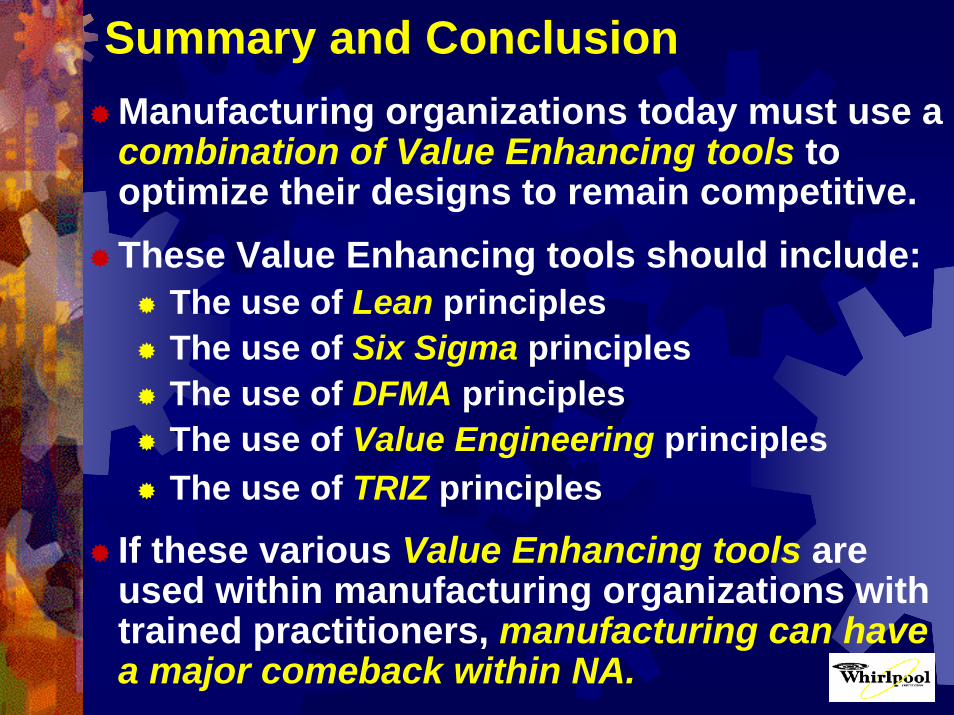
Summary and Conclusion Manufacturing organizations today must use a combination of Value Enhancing tools to optimize their designs to remain competitive. These Value Enhancing tools should include:
The use of Lean principlesThe use of Six Sigma principlesThe use of DFMA principlesThe use of Value Engineering principlesThe use of TRIZ principles
If these various Value Enhancing tools are used within manufacturing organizations with trained practitioners, manufacturing can have a major comeback within NA.