
manual security operation center 2 - Securepoint...
94
Security Operation Center Version 2.0
Transcript of manual security operation center 2 - Securepoint...

Security Operation Center
Version 2.0

Security Operation Center Version 2.0
Securepoint
Security Solutions 2
Contents
1 Installation Notes............................................................................................................ 7
1.1 Log Center Version ................................................................................................. 8
1.2 Installation on Linux Systems .................................................................................. 9
2 Login to the Security Operation Center..........................................................................11
3 Message Board .............................................................................................................12
4 Monitoring .....................................................................................................................14
4.1 Monitoring Filter .....................................................................................................15
4.2 Monitoring Settings.................................................................................................16
5 Dashboard.....................................................................................................................17
5.1 Details ....................................................................................................................18
5.2 Display Filter of the Dashboard ..............................................................................22
6 Extras............................................................................................................................23
6.1 Tasks .....................................................................................................................24
6.1.1 Edit Task.............................................................................................................24
6.1.2 Create Tasks ......................................................................................................25
6.1.3 Create Macros ....................................................................................................26
6.2 Tasklog ..................................................................................................................28
6.3 Group Management ...............................................................................................29
6.4 Builds .....................................................................................................................30
6.5 Log.........................................................................................................................30
6.5.1 Adjust the Log View ............................................................................................31
6.5.2 Log Settings........................................................................................................31
6.6 UTM/VPN Gateways ..............................................................................................32
6.6.1 Adjust the Gateway List ......................................................................................33
6.7 Users and User Groups..........................................................................................34

Security Operation Center Version 2.0
Securepoint
Security Solutions 3
6.7.1 Create a New User Account................................................................................35
6.7.2 Edit User Data ....................................................................................................36
6.7.3 Send Messages to User......................................................................................37
6.8 Image.....................................................................................................................38
6.8.1 Tab Images.........................................................................................................39
6.8.2 Tab Configurations .............................................................................................40
6.8.3 Tab Backups.......................................................................................................41
6.8.4 Tab DP Images...................................................................................................43
6.8.5 Create a New Configuration................................................................................44
7 Operation Center...........................................................................................................49
7.1 Service State..........................................................................................................50
7.2 Who is Online.........................................................................................................51
7.2.1 Online Chat.........................................................................................................52
7.3 Operation Center Settings ......................................................................................53
7.3.1 General Tab........................................................................................................53
7.3.2 Path Tab.............................................................................................................54
7.3.3 View Tab.............................................................................................................54
7.4 Backup Settings .....................................................................................................55
7.5 Data Provider .........................................................................................................56
7.5.1 Enter Data Provider at Startup ............................................................................57
7.5.2 Change the Source of the Data Provider ............................................................58
8 Service Center ..............................................................................................................59
8.1 Allow / Reject Service.............................................................................................60
9 Link Center....................................................................................................................61
9.1 Add URL ................................................................................................................63
9.2 Add Remote Maintenance Connection ...................................................................64
10 Log Center.................................................................................................................65
10.1 Log Center Settings................................................................................................66

Security Operation Center Version 2.0
Securepoint
Security Solutions 4
10.2 Tab General ...........................................................................................................66
10.3 Tab E-Mail..............................................................................................................68
10.4 Tab Gateways ........................................................................................................69
10.5 Context Menu of a Log Center................................................................................71
10.6 Set Email Recipients ..............................................................................................72
10.7 Define Log Center Events ......................................................................................73
11 UTM/VPN Gateways..................................................................................................74
11.1 CLI Log ..................................................................................................................74
11.2 Context Menu.........................................................................................................75
11.3 Query Interface ......................................................................................................75
11.4 Adding a Gateway..................................................................................................76
11.5 Context Menu Entry Log Center .............................................................................77
11.6 Plot.........................................................................................................................78
11.7 Backup...................................................................................................................79
11.8 Permissions............................................................................................................80
12 Sidebar Menu ............................................................................................................81
12.1 Quick Connect........................................................................................................82
13 Securepoint Log Center Client ...................................................................................83
13.1 Log Client Icon List.................................................................................................85
13.2 Database Filter and Live-Log Filter.........................................................................86
13.3 Reports of the Log Client........................................................................................87
13.4 Report Settings ......................................................................................................89
13.5 Report List..............................................................................................................90
13.6 Webreport ..............................................................................................................92
14 Hotkeys......................................................................................................................94

Security Operation Center Version 2.0
Securepoint
Security Solutions 5
Introduction
The Security Operation Center (SOC) is the new managing software for Securepoint
appliances. The concept of the Operation Center is adopted from the administration web
interface of Securepoint 10.
The Operation Center offers essential administrative functions like monitoring and backup.
As known from the Securepoint Security Manager, you can connect directly to the appliances
via SSH and configure the firewall with the administrative web interface.
The Security Operation Center is installed on the computer locally. Several services and
databases will be installed with the Operation Center, which provide and manage data for the
program. All services can be installed on the same computer or can be stored centrally on a
server, to offer the services to several users or from various places and enable access to the
data from external locations.
The Operation Center uses the service Securepoint Data Provider to access the databases
in which the data of the SOC are stored.
The service Securepoint Backup creates backups of the managed appliances.
The service Securepoint Monitor retrieves monitoring data of the managed appliances and
places it at the SOC disposal.
Defined tasks are stored and executed by the service Securepoint Task .
The service Securepoint Logserver Service retrieves log data of the managed appliances,
writes it into the database and provides it for the logserver client of the Operation Center.
The Operation Center offers five categories Monitoring Center , Extras , Operation Center ,
Services , Link Center, Service Center, Log Center and UMT/VPN Gateways Center on
the left side. The right side of the program window shows actual load data of the managed
firewalls or the administration web interface.
If the SOC is connected to a firewall, the administration of the respective firewall is displayed
in the right area of the window. Only four connections at the same time are possible.

Security Operation Center Version 2.0
Securepoint
Security Solutions 6
fig. 1 monitoring screen of the Security Operation Center
The opened views and connections are managed in tabs whose heads are shown at the
bottom of the screen. Up to nine tabs could be opened at the same time. The order of the
tabs can be changes by drag and drop for your needs.
If you work on one appliance when connections to more than one firewall are active, the
other connections will be blocked. Otherwise multiple SSH connections could come into
conflict with each other.
Following views will be opened in tabs:
Number of tabs View one for each view SOC
news monitoring dashboard list of firewalls
up to four tabs appliance connections several tabs external links

Security Operation Center Version 2.0
Securepoint
Security Solutions 7
1 Installation Notes
The Security Operation Center is available for Microsoft Windows and various Linux
distributions. The Service Securepoint Data Provider , which is the interface to the
encrypted database, can only be installed on a Windows system.
The software package for Windows is an executable EXE file, which starts an installation
assistant. For Linux distributions a compressed TAR archive is offered.
The Security Operation Center installation packet for Windows consists of several
components.
The main components are the application software for the client computer, the Microsoft C++
Redistributable Package and the service Data Provider. The additional services Monitoring,
Backup, Tasks, Logserver and the service Data Provider can be installed either on the
client computer or central on another system like a server.
fig. 2 installation wizard
The Security Operation Center and the Data provider must be run on the same version for all
functions to run error free. If you update the Data Provider, all users, which use this Data
Provider, have to update their Security Operation Center version.

Security Operation Center Version 2.0
Securepoint
Security Solutions 8
1.1 Log Center Version
The log center logs connection data of each computer in the network. The IP addresses and
usernames will be recorded too. With these data the internet usage of each user can be
analyzed. This information is visible for the administrator.
To protect these personal data against unauthorized access, the data in web reports and
historical logs can be made anonymous. This means that IP addresses and usernames are
not shown to unauthorized users. For this reason a user without administration rights cannot
access the log center. The button is not visible to him/her.
In the installation routine you have to select the log center version you want to use.
The 2 eyes principle and the 4 eyes principle are available.
When you use the 2 eyes principle, the personal data are visible for the administrator without
additional authentication.
The 4 eyes principle uses anonymized data. The data will be shown to the administrator of
the SOC if he/she logs in to the log center with another administrator account.
If the administrator opens the logs center by using an account without administrator right or if
he/she leaves the entry field blank, the personal data will be masked.
When using the same account data for the SOC login and the log center login, the access to
the log center will be denied because the 4 eyes principle is not fulfilled.
You have to use one administration account for the SOC and a second one for the log
center. Only with this configuration you will get access to the clear data (not anonymized).
fig. 3 select logserver version

Security Operation Center Version 2.0
Securepoint
Security Solutions 9
1.2 Installation on Linux Systems
You also can install the Security Operation Center on Linux systems. Only the graphical user
interface is installed. It needs to connect to a data provider, which is installed on a Windows
system.
The following installation manual is tested for the operating system Ubuntu. The installation
on other Linux systems should be similar or even identical.
� The Operation Center is offered as TAR archive, which is compressed with gzip.
� Download the actual SOC version from the Securepoint website (http://download.securepoint.de/?d=spopcenter).
� Extract the archive either with an archive manager or use the corresponding commands on a terminal.
� Open the context menu by clicking with the right mouse button on the archive and select the entry Open with Archive Manager .
� In the archive manager select the archive content SpOpCenter and click on the button Extract . The archive will be decompressed, extracted and saved on the same directory level.
fig. 4context menu of the archive
fig. 5 extract the archive

Security Operation Center Version 2.0
Securepoint
Security Solutions 10
� Open the directory SpOpCenter and double click on file install.sh to start the
installation.
� Ubuntu opens a dialog, which asks how you want to execute the file. Select Run in terminal .
fig. 6 content of SpOpCenter
fig. 7 question of execution mode
� A terminal window appears. The terms of a license of the application and the used modules are shown.
� If you accept these terms enter a Y at the question Accept and press the enter key .
� The SOC will be installed. When the installation is finished the terminal window will be closed. On the Desktop the new icon starter.sh is shown.
� Open the context menu with a right click on this icon and select the entry Properties .
� In the appearing dialog switch to the tab Permissions and activate the option Allow executing file as program .
� Click Close . The icon of the file is been replaced with the SOC icon .
fig. 8 change execute typ

Security Operation Center Version 2.0
Securepoint
Security Solutions 11
2 Login to the Security Operation Center
When you start the SOC the login dialog appears, where you have to log in to the system.
At the first start use the default registration data:
Username: admin
Password: insecure
These data are predefined and should be changed after the first login. You will be asked to
change the password for the user admin after the first login automatically.
fig. 9 login dialog
The SOC queries the data provider at the local computer (IP address 127.0.0.1) by default. If
the service isn’t detected at this IP, you have to enter an IP address of a computer the
service is installed on. The dialog will be extended when the connection attempt fails.
� Enter the IP address and the port (default is 6178) of the computer the service is
running on.
� Click Test to check the connection. Save the settings if the connection can be established.
� Log in with the Username and the Password .
fig. 10 enter another data provider
fig. 11 save settings

Security Operation Center Version 2.0
Securepoint
Security Solutions 12
3 Message Board
The Message Board shows topical Securepoint news, change logs, messages and executed
tasks in the right window. The view can be switched between News , Changelog , Tasklog
and Messages by using the upper menu bar.
You can set this view as the start-up page of the Security Operation Center. For this choose
the entry Overview for the Start Screen in the Operation Center settings.
The Securepoint News provides press reports and current events of the Securepoint GmbH.
This data is loaded from the Securepoint internet site and can only be shown if the system
has access to the internet.
fig. 12 news dialog of the message board
The Changelog lists the changes between two firewall software versions. You can select a
version in a dropdown field at the end of the list.
These data are also loaded form the internet.
fig. 13 changelog dialog of the message board

Security Operation Center Version 2.0
Securepoint
Security Solutions 13
The Tasklog lists all executed tasks. The entries contain the task name, the execution date
and the received status message. You can remove a task by using the button at the right
side of the list. The suppression will be saved automatically and applies to all users.
fig. 14 tasklog dialog of the message board
Users can write messages to each other. These are shown on the message board. Users
can only see messages which are targeted to them. If a new notification exists when the user
logs in, the start screen switches to the in-box.
Read messages are moved automatically to the tab Read Messages .
fig. 15 message dialog of the message board

Security Operation Center Version 2.0
Securepoint
Security Solutions 14
4 Monitoring
The Monitoring is one of the central functions of the Security Operation Center. This control
function displays the system utilization of all managed appliances. The processor- and
memory-load is shown graphically. The number of TCP- and UDP-connections and the
online/offline status is presented in graphs, too.
Beneath this, the system components, license and software properties are listed.
Lists of running and stopped applications as well as IPSec connections could be displayed if
needed.
graphical component load information about processor type, license and software version opened service list left side: running services list of created IPSec connections
fig. 16 monitoring view of an appliance
with activated service and connection list
numbers of TCP and UDP connections and graphical online state information of numbers of interfaces and update status of the virus database opened service list right side: closed services
Security Operation Center Version 2.0
Securepoint
Security Solutions 15
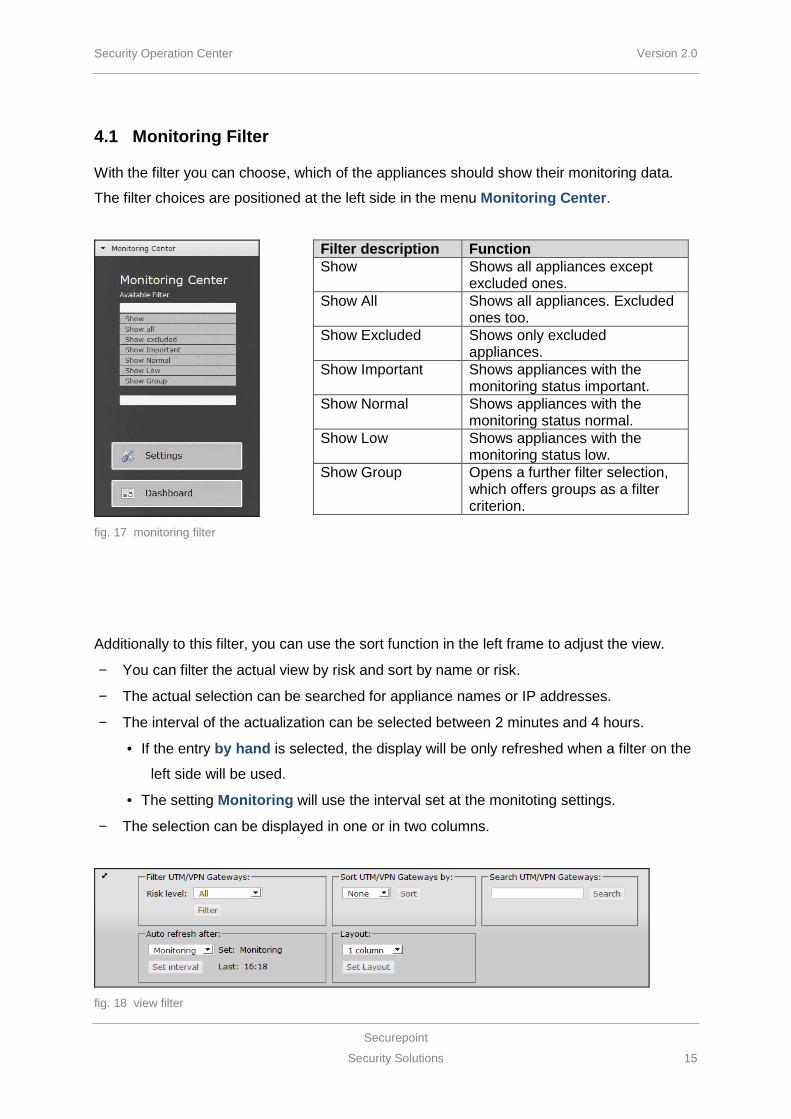
4.1 Monitoring Filter
With the filter you can choose, which of the appliances should show their monitoring data.
The filter choices are positioned at the left side in the menu Monitoring Center .
fig. 17 monitoring filter
Filter description Function Show Shows all appliances except
excluded ones. Show All Shows all appliances. Excluded
ones too. Show Excluded Shows only excluded
appliances. Show Important Shows appliances with the
monitoring status important. Show Normal Shows appliances with the
monitoring status normal. Show Low Shows appliances with the
monitoring status low. Show Group Opens a further filter selection,
which offers groups as a filter criterion.
Additionally to this filter, you can use the sort function in the left frame to adjust the view.
− You can filter the actual view by risk and sort by name or risk.
− The actual selection can be searched for appliance names or IP addresses.
− The interval of the actualization can be selected between 2 minutes and 4 hours.
• If the entry by hand is selected, the display will be only refreshed when a filter on the
left side will be used.
• The setting Monitoring will use the interval set at the monitoting settings.
− The selection can be displayed in one or in two columns.
fig. 18 view filter

Security Operation Center Version 2.0
Securepoint
Security Solutions 16
4.2 Monitoring Settings
The appliances don’t send the monitoring data to the SOC continuously. The data is queried
in so called runs. In this run the monitoring data of the appliance is queried one hundred
times.
The run interval is the time between the end of the previous run and the beginning of the new
run. The default setting is one minute. Because only one appliance at once and one
appliance after another is queried, the elapsed time between the runs could be greater than
the defined interval.
fig. 19 monitoring settings
The queries could be assigned to specific appliances.
The selections are: All appliances
Appliances with a defined status
Appliances of a specified user
Appliances of a specified group
You can also decide to query excluded machines too. Excluded machines are appliances
which are exempted from the monitoring.
If a queried appliance is offline, you can let it move into a defined group.

Security Operation Center Version 2.0
Securepoint
Security Solutions 17
5 Dashboard
You can also show the main monitoring data in a dashboard view. The dashboard shows a
graphical overview of all recorded firewalls. The capacity utilization of the CPU, memory,
swap partition and the validity time of the license is shown for every firewall. Furthermore the
numbers of TCP and UDP connections and the used version is displayed.
The dashboard can be shown as boxes or as a list.
The colored background of the firewall name or the table row quickly shows critical systems.
A red background signalizes that the risk of the system is evaluated as high. This appears if
the system isn’t reachable respectively, not powered on, or the license is invalid, or the
license is less than 30 days valid and an old version is used.
An orange indication is shown, if an old version is used.
If the firewall is marked green, the system is uncritical.
The status bars for the present utilization change from green over orange to red, if the values
reach a critical situation.
fig. 20 dashboard in box view
fig. 21 dashboard in list view

Security Operation Center Version 2.0
Securepoint
Security Solutions 18
The icons at the lower border of the box or at the end of the table row show the connection
status, more details or connect the firewall directly.
Icon Description
The firewall is not reachable, not powered on or
not connected at the time of the monitoring.
Connection to the firewall is established.
Connect the firewall via the administration web
interface.
Shows details of the firewall.
5.1 Details
To show more information of a system, click the gear symbol.
The tab General shows information about hardware, license, software version, and virus
database status.
fig. 22 details - tab General

Security Operation Center Version 2.0
Securepoint
Security Solutions 19
The tab Services lists all running and stopped applications.
fig. 23 details - tab Services
The tab IPSec shows all established IPSec connections which are stored on the appliance.
The status of the connection is shown by a dot in the first column. If the connection is active
the dot is green, otherwise the dot is gray.
fig. 24 detail - tab IPSec

Security Operation Center Version 2.0
Securepoint
Security Solutions 20
The tab Graphs shows the hardware utilization, the numbers of TCP- and UDP-connections
and the online status in diagrams.
fig. 25 details - tab Graphs
On the tab All Runs the date and time of the last 100 status-record-runs are listed. For
information of a run, click on the button at the end of the according line.
fig. 26 details - tab All Runs

Security Operation Center Version 2.0
Securepoint
Security Solutions 21
The tab Backup shows detailed information of the last backups.
fig. 27 details - tab Backup
The tab Average Values shows the arithmetic average of the hardware utilization, the
numbers of TCP- and UDP-connections and the online status.
fig. 28 details - tab Average Values

Security Operation Center Version 2.0
Securepoint
Security Solutions 22
5.2 Display Filter of the Dashboard
The dashboard view can be customized by a filter.
To start the filtering or sorting you have to click the according button after setting the wanted
filter. The selected settings can be saved.
Function Description
Filter UTM/VPN Gateways
Filters the firewall by risk. A distinction is drawn between no, middle and high risk. To reset the filter use the value All .
Sort UTM/VPN Gateways by
You can sort the display by risk and name. You can select between ascending and descending sorting.
Search UTM/VPN Gateway
You can search a firewall by name or IP-address. If the searching is successful, the found firewall is displayed.
View Switches the view between gallery and list view.
Auto refresh after Sets the update interval of the display. If the entry Manual is selected, the display will only be updated, when a filter on the left side is changed. When the entry Monitoring is selected, the interval of the monitoring will be assumed, which is set in the left window.
Save settings Saves the current setting for the used client computer.
fig. 29 dashboard filter

Security Operation Center Version 2.0
Securepoint
Security Solutions 23
6 Extras
In this area you can manage firewall groups, user and user groups. Furthermore you can
retrieve a list of available firewall software versions and managed firewalls. You also reach
the items tasks task log and the Securepoint Image Management.
fig. 30 menu Extras

Security Operation Center Version 2.0
Securepoint
Security Solutions 24
6.1 Tasks
BY choosing the point Tasks you can create CLI (Command Line Interface) commands
which will be executed at a predefined time.
Click on Tasks to reach the window Manage Tasks where all created tasks are listed with
name and execute time. Commands which have already been executed are listed too. These
tasks can be used as patterns for periodical tasks.
Tasks are only shown to the user who has created them. The user admin sees all tasks.
6.1.1 Edit Task
� Click on the entry Tasks in the Extras menu. A list with all defined tasks appears.
� To execute the commands at another time or another firewall, use the wrench symbol . The window Edit Task appears.
� Change the entries in the fields Run date and Run time .
� Change the firewalls for which the task should be executed. For this use the button Add in the box Assigned gateways . Select a firewall out of the appearing list. You can remove firewalls from the list Assigned gateways by using the minus symbol button .
� Click Save.
� You can delete tasks from the list by using the trashcan symbol button .
fig. 31 task list
fig. 32 edit task

Security Operation Center Version 2.0
Securepoint
Security Solutions 25
6.1.2 Create Tasks
� To create a task click the button Add in the Manage Tasks view. The window Add Task appears.
� Enter a name for the new task into the field Title .
� Type CLI commands into the field Commands (see the CLI commands reference at the Securepoint internet page). The commands to update or register the firewall are predefined and could be activated by a checkbox.
� Click into the field Run date . A calendar appears, on which you can select the desired run date.
� At the field Run time select the hours in the first dropdown field and the minutes in the second dropdown field.
� In addition to the predefined commands Update gateway and Register gateway you can select the options Reboot and Rollback . The option Rollback on error should be activated, to reset failed CLI commands.
� Click Save. The window Task Gateways appears. All available firewalls are listed by name and IP address.
� Select the firewalls the task should run on. For this use the button with the plus symbol beneath the desired firewalls.
� When you have selected the firewalls click on Back .
fig. 33 setup task
fig. 34 select firewalls

Security Operation Center Version 2.0
Securepoint
Security Solutions 26
6.1.3 Create Macros
You can record CLI commands directly when you configure a firewall via the administration
web interface. This functionality is useful if you want to execute the same actions on several
firewalls or if you want to automate periodical tasks.
When you connect a gateway you can record commands by activating the context menu
entry start macro .
When the recording is started, all commands which are send in the administration web
interface will be logged. This function only affects commands, which change data, update,
restart, and stop services. When the recording is stopped, you can save the logged
commands as a task. You can set an execution date for the new task during saving.
6.1.3.1 Record Macro
� Establish a connection to a gateway to record a macro.
� Open the context menu in the connection window by clicking the right mouse button .
� To start the recording, click the entry start macro . All CLI commands which are executed in the administration web interface will be logged. The number of logged commands will be shown in the macro window.
� Click the entry stop macro to exit the recording.
fig. 35 macro context menu

Security Operation Center Version 2.0
Securepoint
Security Solutions 27
6.1.3.2 Save macro
� When you stop the macro recording the entry save macro will be activated. Use it to open the record window. All logged commands are listed in this window. You can edit the commands by clicking into the window and use the keyboard for typing the changes.
� Enter a name for the macro into the field Title .
� Select a date from the dropdown field Run date/time and enter the desired time.
� You can activate the functions Reboot after executed and Rollback on error .
� Click Save to store the macro.
� The macro is shown in the task management.
fig. 36 save macro as task

Security Operation Center Version 2.0
Securepoint
Security Solutions 28
6.2 Tasklog
The Tasklog offers a logging of all executed tasks. You can check, whether the tasks are
executed correctly or an error occurred.
Log entries will be shown as long as they are tagged as read. An entry will be deleted, when
the status is set to read by clicking the minus symbol button .
The entries are listed with the task name and are sorted ascending by executing time. The
third column shows the feedback of the system. The fourth column provides the deletion
button.
fig. 37 status messages of executed tasks

Security Operation Center Version 2.0
Securepoint
Security Solutions 29
6.3 Group Management
Under this item you can manage firewall groups. With groups you can arrange all firewalls
into logical units. Groups are also used as a filter selection during the Monitoring and in the
area UTM/VPN Gateway Center .
You can create main groups and sub groups. A finer division is not provided.
With the buttons in the rows you can edit or delete the respective group.
fig. 38 group list
At the bottom of this menu you can create new groups.
You have to decide, if the group is a main or a sub group and if
it’s a sub group, in which main group it should be created.
� Enter a title for the group into the field Name.
� Select a main group in which the new group should be created. If the new group is a main group, select the entry No parent.
� Click Add .
Click the button with the wrench symbol beneath the group to
edit it. You can edit the name and if it’s a sub group you can
change the parent group or convert it to a main group. Main
groups which contain sub groups cannot become a sub group.
You can delete a group by using the button with the trashcan
symbol. The containing firewalls will persist.
If you delete a sub group, the contained firewalls will be moved
to the parent group. If you delete a main group, all sub groups
will be deleted too and the firewalls will not be assigned to a
group.

Security Operation Center Version 2.0
Securepoint
Security Solutions 30
6.4 Builds
Under this point all available versions of the firewall software are listed.
If you establish a connection to a firewall, which uses an old version, a message informs you
about the new version. The information box also offers the possibility to download the new
version.
6.5 Log
Under the point Log protocol, records are shown which are generated automatically by the
service Data Provider. All operations a user makes at the Security Operation Center are
recorded. Additionally, all actions like creation of backups and monitoring runs are logged.
We can track, which actions are made by the user and by the system at which time.
The log is only visible for users with administration rights.
Actions in the list are marked as Permit or Denial . If a user with limited rights has tried to
make privileged actions, this is shown as Denial . The according row is colored.
fig. 39 Operation Center log

Security Operation Center Version 2.0
Securepoint
Security Solutions 31
6.5.1 Adjust the Log View
A filter is integrated in the header of the dialog Log . With this filter you can adjust the view of
the dialog. After you have set a filter, click on Filter Entries to refresh the list.
The following filters are offered:
− All Shows all log entries.
− Operation Center Show entries of the Operation Center.
These are actions which are made in the
Operation Center by the users.
− Monitoring Service Entries of monitoring runs made.
− Backup Service Entries of configuration backups made.
With the buttons in the middle of the header, you can navigate through the log pages.
The number of entries per page is set to 20 by default. You can adjust the number with the
dropdown field at the right side of the header.
The button with the two green arrows is intended for refreshing the entries.
fig. 40 filter options in the header
6.5.2 Log Settings
This point is located under the menu point Operation Center .
You can define how many days the log entries are stored. Log data which are older than the
given time will be deleted.
You can store the data up to 30 days. The number of entries is irrelevant.
fig. 41 storage duration in days

Security Operation Center Version 2.0
Securepoint
Security Solutions 32
6.6 UTM/VPN Gateways
The entry UTM/VPN Gateways in the menu Extras lists all managed gateways.
The table shows the name, the IP address or hostname of the gateway. The gateway type,
location and owner are also listed. Users and user groups and their rights are shown if
existing.
fig. 42 list of managed firewalls

Security Operation Center Version 2.0
Securepoint
Security Solutions 33
6.6.1 Adjust the Gateway List
A filter is integrated in the header of the table. With this, you can filter a specific gateway.
The header also offers a function to define the number of entries per page and a function to
refresh the data.
The following filters are available. Some of them need patterns. If no pattern is set, all
firewalls are shown.
Category Description Pattern Show all Shows all available gateways. not needed Name Searches for gateways whose name matches
the pattern (gateway names, not hostnames) The pattern doesn’t have to be complete.
The pattern can be the exact name or a part of the name.
IP Searches for gateways whose IP address matches the pattern. The pattern doesn’t have to be complete. The search supports hostnames too.
The pattern can be the exact IP address or hostname or a part of it. For example: 192.168.
User Searches for gateways whose user (not owner) matches the pattern. The pattern doesn’t have to be complete.
The pattern can be the exact user name or a part of the name.
User group Searches for gateways whose user groups match the pattern. The pattern doesn’t have to be complete.
The pattern can be the exact name of the user group or a part of the name.
Patterns are always interpreted as a part of a text string. It also isn’t case sensitive.
For example: The pattern office matches the entries office, Office, home-office,
office-max, officer, policeofficer etc.
fig. 43 firewall filter

Security Operation Center Version 2.0
Securepoint
Security Solutions 34
6.7 Users and User Groups
You can create users for the Security Operation Center, which you can organize in user
groups. Users could have limited user rights or administrator rights. Only users with
administrator rights can use all functions of the Operation Center. The administrator can
grant or deny read- or read- and write access to several appliances. This can be managed in
the menu UTM/VPN Gateways Center .
Accounts for users could be created and edited under the point User . User groups are
created and managed under the point User Groups .
Access rights of a user group and its members could be different. In that case the rights of
the user are preferential.
For example: The group staff has read access. The user A is member of the user group
staff. He has read and write access. So he can access the appliance with
read and write rights.
Note: A newly created user account isn’t member in a group and the access right
to all appliances is denied.
fig. 44 user list
fig. 45 add user
fig. 46 user group list

Security Operation Center Version 2.0
Securepoint
Security Solutions 35
6.7.1 Create a New User Account
� Use the Button Add in the window User , to create a new user account. The window Add User appears.
� Enter a name into the field Login , which is used by the user for log on.
� Enter the users email address into the field E-mail . Automatically generated reports and messages about events and alarms can be sent to this address.
� Type the name of the user into the field Name.
� Enter the password into the field Password .
� You can choose the following user rights :
• Administrator : Grants the user all rights.
• Manage parent groups : The user is allowed to manage the main groups of the gateway groups.
• Manage sub groups : The user is allowed to manage the sub groups of the gateway groups.
• Connect to firewall : The user can connect gateways via SSH which are visible to him/her.
• Manage Backups : The user is allowed to export and import backups of the gateway.
• Show Protocol : The user can open the protocol of the Operation Center.
� Click the button Save to store the settings.
fig. 47 add a new user

Security Operation Center Version 2.0
Securepoint
Security Solutions 36
6.7.2 Edit User Data
The icon with the wrench symbol in the user list opens the editing dialog. This dialog offers
more settings as the Add User Dialog.
You can edit the email address, the name and the user
rights.
The button Reset in the Reset Password area opens a
dialog to set a new password.
In the area Groups you can check the group
membership. You can also add new group memberships
and delete existing ones.
The area UTM/VPN Gateways shows which firewalls are
assigned to the user by a group membership or directly
and if the user is the owner of a firewall. You must have
reading rights for the belonging firewalls to see these
settings. The area is only for checking, not for editing.
fig. 48 edit user settings

Security Operation Center Version 2.0
Securepoint
Security Solutions 37
6.7.3 Send Messages to User
You can write messages to all registered users, which are listed in the user management. At
the end of every row in the user list an envelope symbol is placed.
Only this symbol is shown to users with restricted rights. Users with administrative rights also
see an edit and a delete symbol.
Use the button Send message to all at the end of the list, to send the same message to all
listed users.
� Click the envelope button to open the Send Message view.
� Enter a subject into the field Title .
� Type your message into the textbox Message .
� Click Send to transmit the message.
� The message is shown in the overview under the tab Messages for the receiving user. When the user logs into the system a notification is shown that a new message is received.
fig. 49 user list
fig. 50 write message

Security Operation Center Version 2.0
Securepoint
Security Solutions 38
6.8 Image
The button Images at the menu Extras opens the Securepoint Image Management. The
Management offers the possibility to download Securepoint appliances images from the
Securepoint download server. The images will be stored on the system the data provider is
installed on.
You can create installation images for Securepoint systems or Terra systems from these
downloaded images. With the integrated Securepoint Imaging Tool you can transfer these
images directly onto an USB flash disk.
Furthermore it is possible to create configurations and apply it to images. So you can store
an installation image and a start configuration onto the USB flash drive. These configurations
can also be created from a backup of managed appliances.
When you start the Securepoint Image Management it will connect the data provider
automatically. If this doesn’t work, you have to connect the data provider manually.
fig. 51 Connection to the data provider will be established automatically.

Security Operation Center Version 2.0
Securepoint
Security Solutions 39
6.8.1 Tab Images
When the Securepoint Image Management starts the tab Images is displayed. On this tab all
images are listed which are bound to a configuration. These configurations could come from
a backup or are created separately.
The actions Delete and Create as … are offered. By clicking the button Create as … you
can select if you want to create a Securepoint system image or a Terra system image.
� Click on the button Create as … . A dropdown menu appears which includes the entries Securepoint and Terra .
� Select for which system you want to create an image by clicking on the according entry.
� The Securepoint Image Tool appears. Here you can copy the image directly onto an USB flash drive.
fig. 52 Tab Images

Security Operation Center Version 2.0
Securepoint
Security Solutions 40
6.8.2 Tab Configurations
On this tab configurations are listed which are created by the Image Management.
The action Apply offers the possibility to bind the configuration to an available image. The
created combination of configuration and image will be listed on the Images tab.
� Click the button Apply . A new dialog appears which shows all available images.
� Type a title for the combination into the field Name. You can optionally enter a description in the same named field.
� Select the wanted version and click Apply .
fig. 53 tab configurations
fig. 54 dialog for version selection

Security Operation Center Version 2.0
Securepoint
Security Solutions 41
6.8.3 Tab Backups
This tab shows all available backups which are created by the SOC. These backups can be
used as configurations. So the backups could be bound to an image. This combination of
backup and image will be listed on the tab Images .
� Select the wanted backup and click Apply . A new dialog appears which shows all available images.
� Type a title for the combination into the field Name. You can optionally enter a description in the same named field.
� Select the wanted version and click Apply . The management program creates an images.
fig. 55 tab backups

Security Operation Center Version 2.0
Securepoint
Security Solutions 42
fig. 56 dialog for version selection

Security Operation Center Version 2.0
Securepoint
Security Solutions 43
6.8.4 Tab DP Images
DP Images stands for data provider images. This means all images that are stored on the
system the data provider runs on. The images listed on this tab are available for the
Securepoint Image Management.
� If you want to download further versions from the Securepoint download server, click on the button Add new image which is placed above the tab bar.
� A dialog lists all appliances operating systems which are available on the Securepoint download server. Select the wanted version and click on Download at the relating row. The version will be stored on the data provider system.
The dialog offers the actions Delete and Create as … . The button Create as … provides
the creation as Securepoint image or as Terra image.
� A click on the button Creat as … opens a dropdown menu which includes the entries Securepoint and Terra .
� Select the system by clicking the relating entry.
� The Securepoint Imaging Tool appears. It offers the possibility to copy the chosen imgae onto an USB flash drive.
fig. 57 DP images tab
fig. 58 versions on the
download server

Security Operation Center Version 2.0
Securepoint
Security Solutions 44
6.8.5 Create a New Configuration
The Securepoint Image Management offers a wizard which guides you through the
configuration creation. The new configuration will be stored on the data provider system. The
configurations will be listed in the image management at the tab Configurations .
� Select the point Actions in the menu bar and click the entry Open wizard on the dropdowm menu.
fig. 59 menu Actions
� In the first step oft he started assistant enter a name for the new configuration in the same named field.
� You can optionally enter a description into the intended field.
� Click Next .
fig. 60 step 1 - enter name

Security Operation Center Version 2.0
Securepoint
Security Solutions 45
� The second screen shows the license agreement . Read it carefully. If you agree on
the terms of the license, click Next .
� Click Cancel if you disagree on the terms. The wizard will be closed.
fig. 61 step 2 - license agreement
� Enter the internal IP address of your appliance. This is the address the appliance is administrated from and the gateway address for the internal network.
� Select the fitting network mask from the dropdown menu. The subnet mask divides the IP address into network prefix and host part. In simple terms: It defines the number of available IP addresses in the subnet.
� Click Next .
fig. 62 step 3 - set IP-address and network mask

Security Operation Center Version 2.0
Securepoint
Security Solutions 46
The next step request the connection type of the external interface.
� Choose between DSL-PPPoE, Ethernet with static IP address or Cable modem with DHCP client .
� Click Next .
fig. 63 step 4 - select connection type
The next dialog varies according to the connection type. If the external interface is connected
by DSL –PPPoE, the username and password for the internet service provider is needed.
� Select your DSL provider from the dropdown menu.
� The fields vary according to the provider. Enter the required information.
� Click Next .
fig. 64 step 5a - select provider

Security Operation Center Version 2.0
Securepoint
Security Solutions 47
� If the appliance is connected in an Ethernet network with static IP address, type the
IP address of the external interface into the field External firewall IP address .
� Select the fitting mask from the field Network mask .
� Enter the IP address of the gateway into the field Gateway .
� Click Next .
fig. 65 step 5b - enter static IP address
� If you want to setup a DMZ (demilitarized zone), enter the IP address of the third interface in the field DMZ IP address .
� Select the fitting mask from the dropdown menu Network mask .
� Click Next .
� If you don’t want to setup a DMZ, click Next without any entries.
fig. 66 step 6 - enter DMZ IP address

Security Operation Center Version 2.0
Securepoint
Security Solutions 48
� Change the password for the default administrator. The username is not editable.
� Enter the new password into the field New password .
� Retype it into the filed Password confirm .
� If you activate the checkbox Show passwords , the password will not be hid by asterisks.
� If you activate the checkbox Create root user with this password , a superuser with the username root will be created. This user uses the same password like the default administrator.
� Click Next .
fig. 67 step 7 - change password
� The last step shows a summary about the given data.
� Confirm the data and click Finish .
� The created configuration will be shown on the tab configurations .
fig. 68 step 8 – summary

Security Operation Center Version 2.0
Securepoint
Security Solutions 49
7 Operation Center
Under this menu you will find functions and settings which regard the Operation Center.
fig. 69 menu Operation Center
Button Description Service state A table shows at which time the services
Backup, Monitor and Task have last queried the databases. It also shows details of the services. For example: CPU utilization and RAM usage.
Who is online Shows a list of users that use the Security Operation Center and are connected to the same DataProvider.
Toggle Fullscreen
Set the Security Operation Center into fullscreen mode. To switch back to window mode click the button again. You can also use F11.
Settings Opens an area where the basic settings of the Security Center could be set.
Log Settings Set the time of the log data storage. Backup Settings
Opens the setting area of the backup service.
Data Source The SOC always uses the Data Provider to access the data base, whether it is a local data base or a remote one. The service Data Provider checks the access rights of the requested data when it accesses the data base.
Monitoring Opens the monitoring settings (see chapter 4.2).
Exit Application
Closes the Security Operation Center.

Security Operation Center Version 2.0
Securepoint
Security Solutions 50
7.1 Service State
This dialog shows, at which point of time the services access the
database. This ensures the correct execution of the services. The
button Refresh reloads the table.
The second list shows the IP address of the machine the service is
running on.
When you click the icon extend , a new view appears which
shows details of the service.
The area General shows the average CPU and memory utilization.
The area CPU utilization shows the load of the processor which is
caused by the service. The time is plotted on the x axis.
The area RAM/KB in use shows the memory utilization. The time is
plotted on the x axis. Private shows the load caused by the service.
The Working value includes the load of the service, used applications and required DLLs.
Field Description Runs Numbers of executed runs. 400 runs are
record maximally, older runs will be overwritten.
Avg. CPU Average CPU utilization. Avg. working mem.
Average memory utilization. Encloses the memory used by required DLLs and applications.
Avg. private mem.
Average memory utilization by the service.
Peak CPU Maximal CPU utilization. Peak working mem.
Maximal memory utilization including used DLLs and applications.
Peak private mem.
Maximal memory utilization of the service.
Last action Last action of the service at point call up the details.
Last update Last update of the details.
fig. 70 last access of the
database
fig. 71 service caused
hardware utilization

Security Operation Center Version 2.0
Securepoint
Security Solutions 51
7.2 Who is Online
Under the menu entry Who is online you are shown which users are logged in at the
DataProvider at this moment.
The list of the logged in users contains the username and the IP-addresses of the client
computers. Furthermore the time of the last search run is displayed.
The button at the end of every row opens a chat dialog to the respective user.
The button Send to all at the end of the list transmits a chat message to all logged in users
at the same time.
fig. 72 logged in users

Security Operation Center Version 2.0
Securepoint
Security Solutions 52
7.2.1 Online Chat
� To start a chat session, use the button with envelope symbol . The chat dialog appears.
� Type your message into the text field. Press Enter to transmit the message.
� Your text will be displayed in the upper text field of the dialog. On the computer of your chat partner a chat dialog will be opened in the foreground. When the other user sends a message back, it will be displayed in the upper text box of the dialog. To distinguish the messages your text will be tagged with your username and the send time in blue font . Messages from other users will be tagged with their username and the receiver time in red font .
fig. 73 chat dialog

Security Operation Center Version 2.0
Securepoint
Security Solutions 53
7.3 Operation Center Settings
A multitude of basic settings for the operation center could be defined in this area. These
settings contain for example store location, view/layout and proxy settings.
7.3.1 General Tab
fig. 74 Tab General
Setting Description
Language Define the language of the SOC. You have to restart the SOC for change to take effect. Use F5 for a quick logout.
Passwords Change the password of the current user.
Secure Lock The window of the SOC can be logged, if no activity occurs in a defined interval. To disable the lock, you have to enter your password.
Exit Application Define if a confirmation prompt appears when you close the SOC.

Security Operation Center Version 2.0
Securepoint
Security Solutions 54
7.3.2 Path Tab
fig. 75 Tab Path
Setting Description
Changelog The chancelog shows the changes from version to version of the firewall software. Enter the URL and the filename of the changelog. These settings are required to use the function in the web interface.
Build Define the directory where the versions shall be stored.
Proxy Settings for using a proxy.
7.3.3 View Tab
fig. 76 Tab View
Setting Description Sort Gateways Predefined sorting of the severalgateway
categoried at start of the gateway center. Start Screen Select the content of the right frame of
the window which is shown at start. Selectable options: Overview Message board Blank page show nothing Dashboard Monitoring in box view
Menu Change the view to the sidebar menu. The change takes effect after a new login. Use F5 for a quick logout.
Show Update In Webinterface
Is this option selected, a message is shown when the SOC connects to an appliance with an old firewall software.

Security Operation Center Version 2.0
Securepoint
Security Solutions 55
7.4 Backup Settings
The service Backup offers to store a copy of the configuration of all managed appliances.
These copies will be saved in a database. Ten backups are stored for every appliance. When
the eleventh copy is created the oldest backup will be deleted.
The saved configuration can be reinstalled in the menu Firewalls .
fig. 77 backup settings
Setting Description General Define the period of the backup runs.
You can choose between daily, weekly and monthly. The option weekly requires the day of the week and the option monthly the day.
Time Define the time for the backup run. Run Turn on this option to activate the backup
service. Force Run This button creates a backup of all
appliances immediately.

Security Operation Center Version 2.0
Securepoint
Security Solutions 56
7.5 Data Provider
Under this menu point you have to enter the IP address of the Data Provider.
The Data Provider is a service which connects to the database where all monitoring data,
backups, tasks and log data are stored. The connection to the database is necessary to load
data to the Operation Center and to store new settings and configurations. Furthermore the
Data Provider logs all actions of the user. This logging only affects operations on the SOC
and not settings at the appliances made via a SSH connection. So you can track, which
actions the users made in the Operation Center.
The Operation Center only starts if a connection to a Data Provider exists. Therefore the
Operation Center checks the connection to a Data Provider when starting the program.
The service can be placed on the local computer or centrally on a server. If the Data Provider
is installed centrally, several machines can access the database.
During the installation routine you can select, which components should be installed. The
Data Provider service is called Securepoint Data Provider. By default it is installed and
started at system start. The service uses the port 6178.
If the Data Provider is installed on a central server which operates night and day, the
monitoring data, backups and log data will be created and stored continuously even if the
local computer is turned off. Furthermore actions of other Security Operation Centers will be
logged. Another advantage is that all computers can access these data if they have installed
the SOC and are authorized to access the server. This applies not only to local computers
but also to external staffs. It doesn’t matter if the server is accessible from the internet or the
external staff connects to the server via a VPN connection.
The granting of read and write permission stored on a central server assures that the user
can only access data on appliances he is allowed to use.
Excluded appliances are only accessible for users with administrator rights.

Security Operation Center Version 2.0
Securepoint
Security Solutions 57
7.5.1 Enter Data Provider at Startup
� The Security Operation Center tries to connect to the local Data Provider service (IP address 127.0.0.1) at startup. If the service is not activated or not installed the SOC asks for an IP address of a computer that provides the service. Type it into the field IP address . Use the default port 6178.
� Click on Test to connect and check the service.
� If the test is successful, the button Save will be activated. Use it to save the IP address.
� Now you can login to the SOC. Enter your username and your password into the relating fields and click login . Default username is admin and password is insecure.
fig. 78 enter new IP
fig. 79 save connection and login

Security Operation Center Version 2.0
Securepoint
Security Solutions 58
7.5.2 Change the Source of the Data Provider
You can change the IP address of the Data Provider when the SOC is actuated. The
monitoring data and the configuration backups will be stored in the database of the new
address.
� In the area Operation Center click the button Data Source .
� The Window Data Source appears. It shows the IP address of the computer where the used Data Provider service is running.
� Enter the IP address of the computer, whose Data Provider service you want to use into the field IP.
� Change the port number in the field Port if required. By default the port 6178 is used.
� Click on the button Test Connection . If the test is successful, a result message appears beneath the button. Now you can store the connection data with Save.
� If the test fails, check the IP address and the port number. Make sure that the service on the target host is running and available.
fig. 80 change data source

Security Operation Center Version 2.0
Securepoint
Security Solutions 59
8 Service Center
The menu Service Center lists services which access the defined data provider. If the data
provider is installed centrally on a server, multiple remote services want to access the data
provider. Every connection querying service is listed with the IP address of the executing
host.
fig. 81 accessing services
In this menu you can regulate the access from remote computers. You can define which
service from which computer is allowed to access the data provider and which user account
the service has to use.
If the access is denied, the service will be stopped on the remote computer. If the user
restarts the service, it will be stopped again as long as it is listed as Rejected service. When
the service is deleted from the list, the access authorization can be decided newly.
Icon Description
The service waits for allowance to access the data provider.
It is neither allowed nor denied.
The service is allowed to access the data provider.
The service is denied to access the data provider and it is stopped on the remote
host.

Security Operation Center Version 2.0
Securepoint
Security Solutions 60
To redirect services to other data provider than the local one, you have to edit the file
settings.dat . The file is stored in the directory Security Operation Center .
for example: ../Program Files/Security Operation Center/bin/settings.dat
� Open the file with an editor and edit the row : data-ip=127.0.0.1
� Enter the IP address of the host the data provider is running on. for example: data-ip=192.168.175.10
8.1 Allow / Reject Service
� Click the right mouse button on the IP address of the service, which you want to edit. Select the entry Properties out of the context menu. The dialog Service Settings appears.
� Click the button Reject to refuse the service. Confirm the security notice.
� Or click on Allow to accept the access. A further detail view appears. Select here which user account the service has to use to connect to the data provider.
� Click on Save to return back to the menu Services .
fig. 82 context menu
fig. 83 allow or deny access
fig. 84 select user account

Security Operation Center Version 2.0
Securepoint
Security Solutions 61
9 Link Center
The menu Link Center offers to save internet addresses of several web pages to display
them in the SOC. This is intended for an external monitoring service (like MRTG), which is
queried via a web interface. This function is not designed as a replacement for a browser.
Furthermore you can save remote maintenance connections and execute these in the SOC.
The protocol RDP (remote desktop protocol) and the software VNC (virtual network
computing) are supported.
If you use an HTTP proxy in your network, you have to define the proxy settings in the menu
Operation Center in the submenu Settings .
Note: NTLM authentication will not be supported.
fig. 85 opened external link
The context menu offers basic web browser command
like back and forward navigation. It also shows a Print
command, which will open a window with print settings
and a print preview.
fig. 86 context menu

Security Operation Center Version 2.0
Securepoint
Security Solutions 62
The links are listed in alphabetical order of the entered
names. For a better overview the list is divided into
sections, which show the entries by categories of initial
letters.
With the button Refresh , members of a user group can
check, if other users have added new addresses to the list
in the meantime.
fig. 87 menu external links
The tabs RDP and VNC for remote maintenance show the same structure.
fig. 88 stored RDP connections
fig. 89 stored VNC connections

Security Operation Center Version 2.0
Securepoint
Security Solutions 63
9.1 Add URL
� To add a new internet address, click the entry Add in the menu Links Center . The mask Add URL appears.
� Enter a title for the new address into the field Name.
� Enter the complete address into the field URL. If no protocol is given, the address will be interpreted as an HTTP address. If you want to use a SSL connection, you have to enter the right protocol (https:// ).
� You can assign the address to an existing Usergroup of the Operation Center.
� The field Useragent offers different browser plugins. The browser Webkit is used by default. Some internet pages request a specific browser. You can select it from the dropdown box.
� If the page has restrictive access, enter your username and your password into the fields User and Password .
� Click on Save to store the URL.
fig. 90 add external address

Security Operation Center Version 2.0
Securepoint
Security Solutions 64
9.2 Add Remote Maintenance Connection
The tabs RDP and VNC show the remote maintenance connections.
� Click in the menu Link Center in the tab RDP or VNC on the button Add to store a new remote connection. The input mask Add Remote RDP or Add Remote VNC appears.
� Enter a name for the new connection into the field Name.
� Enter the complete internet address into the field URL. If you don’t specify the protocol an http:// will be added. If you want to use a SSL connection you have to name the protocol (https:// ). You can enter an IP address or a host name.
� You can restrict the access to a connection by enter a user group into the field Usergroup .
� Select the size of the window the remote system will be shown in from the field Widget size . The size is given in pixel.
� Click on Save.
fig. 91 remote desktop protocol connection
fig. 92 virtual network computing connection

Security Operation Center Version 2.0
Securepoint
Security Solutions 65
10 Log Center
The new service Securepoint Logserver Service offers a connection from the SOC to the
Securepoint Log Center.
If the firewall has stored the log center IP address in the Syslog tab of the server settings ,
the log center records syslog protocol data of the gateway.
The log center logs the protocol data and archives these in defined intervals. Archived data
will be stored for a preset period and will be deleted after this.
The log center sends daily report emails, alarm emails and event emails of defined events if
desired.
The menu Log Center lists all available log centers. Only the local log center is shown by
default.
� If you want to connect an additional log center from other computers and servers to the local service, you have to edit the file logserver.ini of the remote log center.
� By default the file is placed under this path: C:/ProgramFiles/Security Operation Center/bin/logserver.ini
� Open the file with a text editor and adjust the values of useLocal and ip.
� Set the value of useLocal to 0 and enter the IP address of the computer which shall manage the logserver into the line ip. [DataProvider] useLocal=0 ip=192.168.175.175 port=6178
� The log center will be shown in the Log Center menu after the Operation Center is rebooted.
fig. 93 available log centers

Security Operation Center Version 2.0
Securepoint
Security Solutions 66
10.1 Log Center Settings
The settings of the Log Center are split thematically into three tabs.
10.2 Tab General
Name Description
General Settings
Port Port number, which is used by the logserver. default: 9999
Last archived Date and time of last archiving.
Run archiving Period between the archiving runs.
Archive folder
Folder, where the archive data is saved. Default folder: C:\Program files\SecurityOperationCenter\bin\lc
If the log center runs on a remote host, the folder must be stored on the remote host.
Last cleaned Date of the last deletion of old archive data.
Day limit
Period, how long the archive data are stored. The value 0 days means no data will be stored.
Log size Maximal size of the database. Is the maximum size reached, the oldest data will be archived or deleted.
DB path
Enter the full path to the database with file name. Default folder: C:\Program files\SecurityOperationCenter\bin\lc
If the log center runs on a remote host, the database must be stored on the remote host.
Debug mode Creates a text file which contains the actions of the log center.
DB log quantity
Maximum numbers of log entries. If the selected number is exceeded, the oldest entries will be archived or deleted.
Syslog Settings
IP IP address of the syslog server.
Port Port of the syslog server.

Security Operation Center Version 2.0
Securepoint
Security Solutions 67
fig. 94 general settings for the
Log Center

Security Operation Center Version 2.0
Securepoint
Security Solutions 68
10.3 Tab E-Mail
On the tab E-Mail is defined from which mails server and with which sender address emails
are sent for events, alerts and reports.
Furthermore you can lodge the user credentials for the SMTP authentication if this is
required by the mail server.
Name Description
Eventmail
From email address of the sender
Server IP address or host name of the mail server
Alertmail
From email address of the sender
Server IP address or host name of the mail server
Reportmail
From email address of the sender
Server IP address or host name of the mail server
Time Time at which the report should be generated and the email should be sent.
SMTP Authentication
Enable Activates the saving of the credentials.
Login User name for the mail server
Password password for the mail server
fig. 95 email settings for the
Log Center

Security Operation Center Version 2.0
Securepoint
Security Solutions 69
10.4 Tab Gateways
In the tab Gateways the appliances are listed which send their protocol data to the log
server.
If you click on the button Add a list of all stored appliances is shown. Form this list you can
select the systems, which shall send the log data to the log server.
fig. 96 list of assigned systems
If you click on the wrench symbol beneath an
appliance in the list the section Report Settings
appears. This section contains the tabs Generate
and E-Mail .
On the tab Generate can be selected for which log
data of the system the log server shall generate
reports. The interval between the creations can also
be selected.
The intervals daily, weekly, monthly and yearly are
offered. The intervals can be combined.
The buttons on top of the list activate or deactivate
all checkboxes on the list.

Security Operation Center Version 2.0
Securepoint
Security Solutions 70
On the tab E-Mail you can decide which reports shall be
sent. The buttons on top of the list activate or deactivate
all checkboxes on the list.
This depends on generation of the reports. Daily reports
can only be sent if reports are created daily.
fig. 97 send options for reports
Settings described on the previous page are available over the context menu of the
log center in the menu Log Center .
In the Log Center menu is also the entry default . Settings stored for this entry will be set for
every new log center which is managed by this system. You can reach these settings also
over the context menu.

Security Operation Center Version 2.0
Securepoint
Security Solutions 71
10.5 Context Menu of a Log Center
Through the context menu of the log center you reach further settings for the respected
log center.
Name Description Connect Opens the log client and connects to the
log center. Properties Edit settings of the log center. Email Recipients
Set email recipients for email messages of the log center.
Event Settings Opens a dialog for event definition. Delete Removes the log center from the list.
fig. 98 context menu of a
logserver

Security Operation Center Version 2.0
Securepoint
Security Solutions 72
10.6 Set Email Recipients
You can set a list of email recipient for the offered logserver messages. Requirement for
adding a person to the recipient list is that the person is a user of the Security Operation
Center and an email address is stored in the user management.
� Switch to the menu Logserver and open the context menu of the logserver you want to set the recipient for by using the right mouse button.
� Click in the context menu on the entry Email Recipients . The Dialog Email Recipients appears. It contains the tabs Alert , Event and Report .
� Switch to the respected tab for the desired message. Click on the button Add . The dialog Add Recipient appears.
� Click on the icon with the plus symbol to add a user to the recipient list.
� If you have selected all desired users, click the button Back to reach the previous dialog.
� Repeat the described actions for other email messages if wanted.
fig. 99 registered recipients
fig. 100 choose recipients

Security Operation Center Version 2.0
Securepoint
Security Solutions 73
10.7 Define Log Center Events
The log Center can send an email, if a defined event occurs. These events are defined by
youself.
� Switch to the menu Log Center . Open the context menu of the log center you want to create an event for (right mouse click).
� Select the menu entry Event Settings . The dialog Log Center Events appears, which shows already created events.
� To create a new event, click on Add . The dialog Log Center Event appears.
� Enter an identifier for the event into the field Name.
� Select the service from the dropdown box Service the event should apply to.
� Enter a Regular Expression into the field Regex . The message of the log center will be searched for this phrase.
� Activate the checkbox Active .
� Type a text into the field Message . This text will be integrated in the email message.
� Click Save to store the event.
fig. 101 registered events
fig. 102 create event

Security Operation Center Version 2.0
Securepoint
Security Solutions 74
11 UTM/VPN Gateways
In this menu all managed appliances are listed. The gateways can be sorted by several
criteria for example name, type, group membership etc.
fig. 103 firewalls sorted by groups
fig. 104 sorting options
11.1 CLI Log
If the Operation Center is connected with a gateway, the CLI Log (Command Line Interface)
can record the in- and output of the communication between Operation Center and
appliance. With this log you can control and analyze the communication.
It corresponds to the function which is offered in the administration web interface under the
menu point Extras . This log isn’t limited to 100 records.
The consecutive logging always shows the newest entry. To analyze the log, it can be useful
to stop the logging.
fig. 105 CLI log window

Security Operation Center Version 2.0
Securepoint
Security Solutions 75
11.2 Context Menu
The context menu of every gateway offers several options to edit the gateway. To access the
context menu click with the right mouse button on the gateway wanted.
fig. 106 firewall context menu
Name Function Connect Connects to the gateway by using the
stored access data. Logout Disconnects from the gateway. LiveLog Opens a new window, which shows the Live
Log of the gateway. Comment Description or notes to the gateway. Properties Opens a dialog to edit the properties of the
gateway. Log Center Shows and adds servers which log Syslog
data of the appliance. Monitoring Shows a list of the stored monitoring runs. Plot Opens plots about CPU load, memory- and
SWAP-utilization. Advanced Plot Opens plots about TCP- and UDP-
connections and the online status. Backup Shows stored backups. Permissions Shows permissions of groups and users. Delete Deletes the gateway from the list. Reboot Restarts the gateway. Halt Turns the gateway off.
11.3 Query Interface
At the bottom of this area a search function is positioned. You can search for name or IP
addresses. If the query is successful, the gateway found will be highlighted in the list.
Furthermore two buttons are placed here for quick opening and closing of all groups in the
list.
fig. 107 search mask

Security Operation Center Version 2.0
Securepoint
Security Solutions 76
11.4 Adding a Gateway
Use the button Add to add a new firewall to the list.
fig. 108 add firewall
Name Description Name Name of the new appliance IP and IP 2 IP addresses of the appliance (for example
internal and external IP addresses) Port SSH port to use (default 22) S/N Serial number of the appliance Type Appliance type selection City Position of the appliance Country Position of the appliance Group Group membership selection Owner Owner of the appliance
Username Username for SSH connection
SSH Credentials
Password Password for the SSH connection
Always Appliance will be controlled always.
Exclude Appliance will be excluded from controlling.
Monitoring
Monitoring State
Defining the monitoring state (low, normal, important).
Always Configuration backups will be made always.
Backup
Exclude Appliance will be excluded from the backup.

Security Operation Center Version 2.0
Securepoint
Security Solutions 77
11.5 Context Menu Entry Log Center
In this section you can apply servers, which host the service Securepoint Logserver
Service . The service accepts all log data from the appliance and writes it into a database.
You can view recorded log data with the integrated log client. It also shows a real time log.
� To add a log center to the settings, select the entry Log Center from the context menu of an appliance.
� The dialog Firewall Log Center appears. It shows all log centers which are applied to the appliance. If no log center is applied yet, the list is empty.
� To add a log center click on the button Add . The dialog Add Log Center appears.
� Select a log center from the list of available log centers and click on the icon with the plus symbol . Repeat this to add more log centers.
� Click Back .
� You can send the IP addresses of the added log centers to the appliance. For this click the button Transfer . The IP addresses will be stored on the gateway in the section server settings. This function only adds new entries, it doesn’t synchronize this list and the settings on the gateway. Already set log centers on the gateway will not be overwritten.
� Click Back .
fig. 109 list of applied log centers
fig. 110 select available log center

Security Operation Center Version 2.0
Securepoint
Security Solutions 78
11.6 Plot
The entries Plot and Advanced Plot in the context menu are showing load and connection
statistics in graphical style. The last hundred values of the monitoring will be displayed if
available.
The point Plot shows the processor load, the memory utilization and the swap file utilization.
The point Advanced Plot shows the numbers of TCP and UDP connections and the online
state of the appliance.
fig. 111 load plots
fig. 112 connections plots

Security Operation Center Version 2.0
Securepoint
Security Solutions 79
11.7 Backup
This point will list the created backups (beginning with the newest). For every appliance only
ten backups are stored.
fig. 113 list of created backups
Beneath the name of the configuration the date and the time
of the backup is shown.
You can export the data with the Button Export or play
it back to the appliance with the button Upload . You
can select a new name for the play back or adopt the old
name. After this you have to decide, if the configuration
should be set as start configuration and if the appliance
should be rebooted.
You can edit the backup by clicking the wrench symbol. The
saved configuration will be opened in the web interface. Here
you can make settings in offline mode. This means that you
don’t edit the current running configuration.
Some functions like configuration management and live log
are not available because these backups are handled in
offline processing.
The edited stored configurations can be uploaded to the
appliance.

Security Operation Center Version 2.0
Securepoint
Security Solutions 80
11.8 Permissions
With the entry Permissions in the context menu you can define the access rights for the
appliance.
The following permissions are available:
− Deny The view to the appliance is refused for the group or the user.
− Read The group or the user has only read access to the appliance.
− Read / Write The group or the user is allowed to read and edit the settings of
the appliance.
The access rights of the user take priority over the permissions of the group.
For example: The group staff has read access. The user A is member of the user group
staff. He has read and write access. So he can access the appliance with
read and write rights.
fig. 114 group and user permissions

Security Operation Center Version 2.0
Securepoint
Security Solutions 81
12 Sidebar Menu
The Sidebar menu is an alternative menu view. This view can be useful, if you use a small
monitor or a low resolution. The sidebar menu has the advantage that the most dialogs do
not need scrollbars, by reason that no stacked menus are used.
fig. 115 Sidebar menu
In the sidebar menu view, the menu GatewayCenter offers two additional buttons: Quick
Connect and Refresh . These buttons are not available in the other view.
Use the button Refresh to update the firewall list.

Security Operation Center Version 2.0
Securepoint
Security Solutions 82
12.1 Quick Connect
You can use the function Quick Connect to establish a connection to a gateway that should
not be added to the gateway list permanently.
The button Quick Connect opens a dialog where you have to enter the connection data for
the temporary connection.
fig. 116 Qick Connect dialog

Security Operation Center Version 2.0
Securepoint
Security Solutions 83
13 Securepoint Log Center Client
Since SOC version 2.0.0 a log client is integrated which not only shows the real time log but
also the historical log data.
By the integration of the log center into the SOC, log data from several appliances can be
recorded and can be displayed with the log client. The client offers several filters for the real
time log and the historical log. Furthermore graphical and tabular analyses are offered.
� You can reach the log client via the context menu of a log center with the point Connect . You can also open the log client by double clicking a log center.
� The window Securepoint Log Center Client will be opened.
� A login dialog appears. Here you have to insert your username and password for the log center. Normally these data are transferred by the SOC. Only users with administrator rights are allowed to log in.
If the connection cannot be established, check your login data.
Ensure that you use the right data provider service .
Check if the Securepoint Logserver Service is running. Check entries in the logserver.ini
file if the log center is bound to the right data provider (see chapter 10).
fig. 117 log center connection data
Notice: The connection data have to be adjusted to the used Log Center Version. Read
the chapter 1.1 Log Center Version for further information.

Security Operation Center Version 2.0
Securepoint
Security Solutions 84
In the window of the log center client you can switch between Logging and Reports by
using the vertical tabs on the left side. The logging tab lists log entries. The reports tab offers
a menu with various analyses in graphical and tabular form.
The status bar at the bottom of the window shows the IP address of the connected log
center, contingently set filter and the number of shown entries.
fig. 118 log client window

Security Operation Center Version 2.0
Securepoint
Security Solutions 85
13.1 Log Client Icon List
fig. 119 icon bar - left half
fig. 120 icon bar - right half
Name Description Connect Establishing the connection with a log center. Login dialog appears to
enter IP address, port and user data. Disconnect Disconnecting the actual connection. Historical data Loading recorded log data from the database. First page Shows the first page of loaded data. Previous page Shows the previous page in relation to the actual page. Next page Shows the next page in relation to the actual page. Go to page Enter the desired page number in the box left beneath the icon. Use
the icon to show the selected page. LiveLog The client shows the actual log date consecutively. Live Log Stop Ends the actual log data view. Database filter Setting a filter for log data loaded from the database. The filter is the
set for all next loads. The data can be reloaded instantly. Filter options: period, appliance, service, message, inverse filter
Reset Resets the filter of the database. Local filter Sets a filter for the loaded log data.
Filter options: date, period, appliance, service, message, inverse filter Reset Resets the filter for loaded data. All loaded entries will be show again.
Scroll to bottom
The actually entries will be shown at the live log.
Fetch data on reset
Data will be reloaded if the filter is reset. Applies to the database filter.
Clear view Deletes all data in the window.
Actions
Historical log rows
Limits the number of loaded data. Increments of thousand to 5000, 10000 and 15000
Enable data compression
If this function is activated, the log data will be compressed by the log server before it is sent to the log client.
Fast Fast but light compression Normal Medium speed and medium compression
Transfer
Maximum Slow but high compression About Shows version number and contact data. Fullscreen Switches from window to full screen view and back. Exit Ends the log client.

Security Operation Center Version 2.0
Securepoint
Security Solutions 86
13.2 Database Filter and Live-Log Filter
The implemented filters are useful tools to analyze the log data systematically. You have to
differentiate between database filter and live-log filter (local filter).
By using the database filter the log data will be selected by set factors when they are loaded
from the database.
The local filter restricts the already loaded log data.
The button Set and Fetch in the Fetch Filter dialog reloads the log data with the set criteria.
The button Set Filter sets the filter for the next loading. The navigation commands Next
page , Previous page , First page and the button Historical log will load log data with the
set criteria.
The Set Filter button in the Local Filter dialog will execute the filter function directly.
If the checkbox Invert is activated, only data which don’t match the set criteria will be shown.
fig. 121 database filter
fig. 122 local filter

Security Operation Center Version 2.0
Securepoint
Security Solutions 87
13.3 Reports of the Log Client
The log client creates reports for every registered appliance out of the log data. The reports
are shown in tabular, graphical or mixed form. Data are shown for the last 24 hours, the last
week and the last month.
You also access older reports in the section Report Archive .
� Click on the tab Reports at the left window border to reach the report section.
fig. 123 view reports
� If you click with the right mouse button on an opened report, you can select more options from the context menu .
• Print : Opens the print preview.
• Save: Opens the save dialog.
• Zoom : Opens a submenu which contains the options Zoom in (enlarge), Zoom out (reduce) and Reset to normal view.

Security Operation Center Version 2.0
Securepoint
Security Solutions 88
fig. 124 context menu of the report view

Security Operation Center Version 2.0
Securepoint
Security Solutions 89
13.4 Report Settings
The menu Settings offers adjustments for view, print options and save location.
Name Description Print background images
Backgrounds of plots and table heads can be deactivated for printing.
Temp report directory
When a report is shown all other reports in the same tree level are saved in a directory as zip-archive. This setting locates the directory.
Page margins Here you can set the margins for all reports. You can select between the units millimeters and points (px).
Use diagram in start
The overview report for all appliances, which is called by the Start entry, shows the log data in graphical form. Select between pie chart and bar chart.
Double click on appliance report opens
A double click on a report name shows the report for several time periods. Select between last 24 hours, last week, last month or last year.
Double click on appliance report opens tab
Reports are opened in tabs. The tab names are listed at the bottom margin of the window. New Reports are opened always in the first tab. The existing report will be overwritten. First A new tab will be opened in front of the tab list. Active Reports will be opened in the active tab. The active tab will be overwritten.
fig. 125 report settings
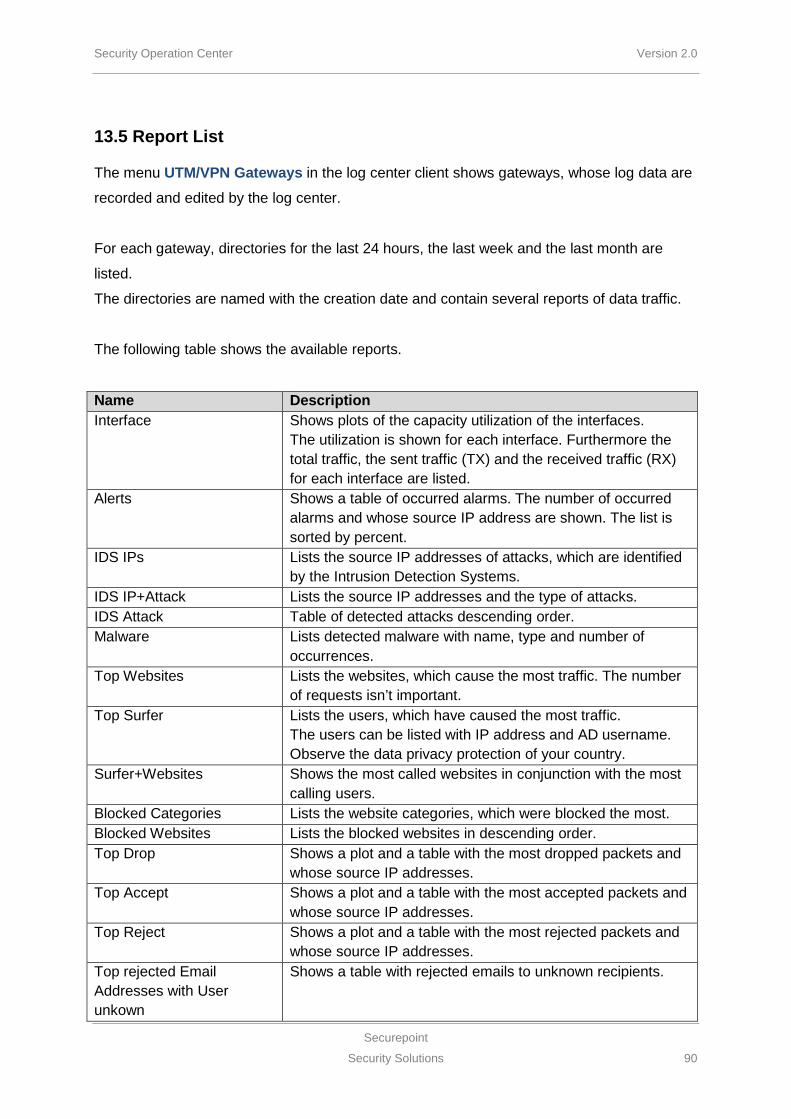
Security Operation Center Version 2.0
Securepoint
Security Solutions 90
13.5 Report List
The menu UTM/VPN Gateways in the log center client shows gateways, whose log data are
recorded and edited by the log center.
For each gateway, directories for the last 24 hours, the last week and the last month are
listed.
The directories are named with the creation date and contain several reports of data traffic.
The following table shows the available reports.
Name Description Interface Shows plots of the capacity utilization of the interfaces.
The utilization is shown for each interface. Furthermore the total traffic, the sent traffic (TX) and the received traffic (RX) for each interface are listed.
Alerts Shows a table of occurred alarms. The number of occurred alarms and whose source IP address are shown. The list is sorted by percent.
IDS IPs Lists the source IP addresses of attacks, which are identified by the Intrusion Detection Systems.
IDS IP+Attack Lists the source IP addresses and the type of attacks. IDS Attack Table of detected attacks descending order. Malware Lists detected malware with name, type and number of
occurrences. Top Websites Lists the websites, which cause the most traffic. The number
of requests isn’t important. Top Surfer Lists the users, which have caused the most traffic.
The users can be listed with IP address and AD username. Observe the data privacy protection of your country.
Surfer+Websites Shows the most called websites in conjunction with the most calling users.
Blocked Categories Lists the website categories, which were blocked the most. Blocked Websites Lists the blocked websites in descending order. Top Drop Shows a plot and a table with the most dropped packets and
whose source IP addresses. Top Accept Shows a plot and a table with the most accepted packets and
whose source IP addresses. Top Reject Shows a plot and a table with the most rejected packets and
whose source IP addresses. Top rejected Email Addresses with User unkown
Shows a table with rejected emails to unknown recipients.

Security Operation Center Version 2.0
Securepoint
Security Solutions 91
Name Description Top recipients Email Addresses (accepted)
Shows a table with accepted emails in relation to the recipients.
Top sender Email Addresses (accepted and rejected)
Shows a table of most accepted and rejected emails in relation to the sender.
Top accepted Mailservers Shows a list of mail servers from which the most accepted emails come from.
Top rejected Mailservers Shows a list of mail servers from which the most rejected emails come from.
Top Server in Greylisting whitelisted
Shows a list of servers which are whitelisted in the Greylisting.
Top Server in Greylisting rejected
Shows a list of servers whose emails were rejected from the Greylisting.
Possible SMTP Attack Shows servers where SMTP attacks maybe started from.

Security Operation Center Version 2.0
Securepoint
Security Solutions 92
13.6 Webreport
The webreport is a detailed report about a defined user or a defined IP address. This report
will be created immediately. It shows the total traffic caused by the user in the defined time
interval. A table shows the percentage segmentation of the data traffic to the called websites.
To every listed website the number of calls and the traffic will be shown.
� Click on the tab Reports at the left side of the window.
� At the menu UTM/VPN Gateways open the directory tree of the gateway you want a webreport from. The entry Webreport is placed in the first layer.
� Use a double click or the entry View in the context menu to open the webreport.
� Enter the IP address or the AD name of the user into the field IP/User .
� Select the timespan for the webreport between previous day, last 7 days, last 30 days, last year or custom settings. If timespan option custom is selected, set the time period for the webreport in the fields Start date and End date . Custom timespan can only be created for the last 7 days. Presetting: last 24 hours
� Click View . The webreport appears in the window on the right.
� To get print and save options make a right click on the webreport.
Abb. 1 define webreport settings

Security Operation Center Version 2.0
Securepoint
Security Solutions 93
fig. 126 webreport example

Security Operation Center Version 2.0
Securepoint
Security Solutions 94
14 Hotkeys
A few functions are stored to the keyboard function keys for fast access.
These are also named as hotkeys or short cuts.
Key Function
F2 Opens the tree view in menu firewalls.
F4 Close the connection to a firewall.
F5 Logout from the SOC. Does not close the SOC. Not available when a connection to a firewall is established.
F11 Switch to full screen mode and back.
F12 Takes a screenshot and opens a save dialog.


![Reza Beheshti Khaldoun Zreik - EUROPIAeuropia.org/IJDST/Vol18/IJDSTV18N2-Paper Eight [2011].pdfSeveral digital design software, enable the design-ers to manage an interactive architectural](https://static.fdocuments.us/doc/165x107/5adb17a47f8b9a6d7e8d8c27/reza-beheshti-khaldoun-zreik-eight-2011pdfseveral-digital-design-software.jpg)


