Manual for the Multiple Filter Automatic Splitting Technique (MFAST)
38
MFAST Manual V2.0 Page 1 Manual for the Multiple Filter Automatic Splitting Technique (MFAST) processing codes, Version 2.0 By Andreas Wessel 1 , Martha Savage 1 and Nick Teanby 2 . Some codes were modified from versions written originally by Alex Gerst, Natalie Balfour and Sonja Greve. This program replaces earlier versions of the codes, some of which were previously called ―doass‖, and others were versions 1.0 through 1.5 of mfast. Copyright 2010, 2013 All rights reserved. These codes may be used free of charge for educational purposes if the following papers are referenced in any resulting publications: Savage, M. K., A. Wessel, N. Teanby and T. Hurst, Automatic measurement of shear wave splitting and applications to time varying anisotropy at Mt. Ruapehu volcano, New Zealand, Journal of Geophysical Research, submitted 2010. J. Geophys. Res., 115, B12321, doi:10.1029/2010JB007722, 2010. And Teanby, J.-M. Kendall, and M. van der Baan. Automation of shear-wave splitting measurements using cluster analysis. Bulletin of the Seismological Society of America, 94(2):453–463, 2004. Wessel, Andreas. Automatic shear wave splitting measurements at Mt. Ruapehu volcano, New Zealand. Master‘s thesis, Victoria University of Wellington, New Zealand, 2010.
Transcript of Manual for the Multiple Filter Automatic Splitting Technique (MFAST)

MFAST Manual V2.0 Page 1
Manual for the Multiple Filter Automatic Splitting
Technique (MFAST) processing codes, Version 2.0
By Andreas Wessel1, Martha Savage
1 and Nick Teanby
2. Some codes were modified from versions
written originally by Alex Gerst, Natalie Balfour and Sonja Greve. This program replaces earlier
versions of the codes, some of which were previously called ―doass‖, and others were versions 1.0
through 1.5 of mfast.
Copyright 2010, 2013 All rights reserved. These codes may be used free of charge for educational
purposes if the following papers are referenced in any resulting publications:
Savage, M. K., A. Wessel, N. Teanby and T. Hurst, Automatic measurement of shear wave splitting
and applications to time varying anisotropy at Mt. Ruapehu volcano, New Zealand, Journal of
Geophysical Research, submitted 2010. J. Geophys. Res., 115, B12321, doi:10.1029/2010JB007722,
2010.
And
Teanby, J.-M. Kendall, and M. van der Baan. Automation of shear-wave splitting measurements
using cluster analysis. Bulletin of the Seismological Society of America, 94(2):453–463, 2004.
Wessel, Andreas. Automatic shear wave splitting measurements at Mt. Ruapehu volcano, New
Zealand. Master‘s thesis, Victoria University of Wellington, New Zealand, 2010.

MFAST Manual V2.0 Page 2
Contents
Introduction ............................................................................................................................................ 4
Differences between this and previous versions 4
1. Basic knowledge of geophysical terms .............................................................................................. 4
2. Description of the method .............................................................................................................. 5
2.1 Filtering ........................................................................................................................................ 6
2.2 Signal to noise ratio calculation ................................................................................................... 7
2.3 Basic measurement technique ...................................................................................................... 8
2.4 Grading criteria .......................................................................................................................... 15
2.5 Averages ..................................................................................................................................... 16
2.6 Use of multiple filters ................................................................................................................. 17
2.7 System Requirements ................................................................................................................. 18
3 Prerequisites to use the programs ..................................................................................................... 18
3.1 Customize paths and variables ................................................................................................... 18
3.2 Programming style and syntax ................................................................................................... 19
4. Download and convert data ............................................................................................................. 19
4.1 Prepare data for splitting measurement (I) ................................................................................. 19
5. Processing of data for splitting measurement .................................................................................. 20
5.1 Prepare data for splitting measurements (II) .............................................................................. 21
5.2 Set the picks up in the proper headers and check inconsistencies .......................................... 22
5.3 Find best filter............................................................................................................................. 23
5.4 Calculate signal-to-noise ratio .................................................................................................... 23
5.5 Create configuration file and measure shear wave splitting ....................................................... 24
5.6 Display results ............................................................................................................................ 28
Further ways to select measurements: ................................................................................................. 30
6 Automatic measurement and monitoring tool................................................................................... 31
7. Utilities .......................................................................................................................................... 32
8. Third party software used for this study .......................................................................................... 33
9. Cheatsheet ........................................................................................................................................ 35

MFAST Manual V2.0 Page 3
Quick command guide: ................................................................................................................. 35
10. Trouble Shooting ........................................................................................................................... 36
References ............................................................................................................................................ 37

MFAST Manual V2.0 Page 4
Introduction
To process large amounts of seismograms it is essential to automate the work flow as much as
possible. Several shell scripts, GMT (Wessel and Smith, 1998) scripts and SAC (Goldstein and
Snoke, 2005) macro files have been developed to automate processes, especially when the tasks were
recurrent. When writing these scripts, the UNIX philosophy was followed, so several small tools
were used in combination to deal with complicated tasks. For shear wave splitting measurements,
events have to be selected and processed, and measurements have to be evaluated and displayed. A
description and manual of the developed programs is given here, and there is more information in the
comments at the beginning of most of the scripts. Many programs can most conveniently be invoked
by the main program mfast_mfm and its options, but it is also possible to do the processing step by
step (mfm stands for ―multiple filter method‖). To get a quick overview of what to do, see the cheat
sheet (Section 9) or the script do_station_mfm in directory sample_data. Shell commands, i.e.
commands that have to be entered in a terminal, are indicated by formatted text and/or a prepended
$-sign, e.g. $ whoami means that you are supposed to type whoami in a terminal to execute this
command. (The command whoami prints the username to the screen and is only used here as an
example. Note that $string without a space between the dollar sign and the string denotes a shell
variable.) Script and macro names are in bold, variable names are in italics and directories and
filenames are both italics and bold.
Differences between this and previous versions:
Please see the 00README file in the main mfast_package directory to find recent changes. The
differences between MFAST 1.0 and 2.0 are summarized here.
The main differences up until version 2.0 were in bug fixes in various parts of the codes and scripts,
and in some enhancements for the utilities. But for version 2.0 we also implement a new version of
the Silver and Chan degrees of freedom calculation. Extensive re-deriving of the equations in the
Silver and Chan (1991) paper led us to find a bug in the calculation of the covariance matrix (fixed in
version 1.4 and above) but also to find that coefficients in the appendix of Silver and Chan for
calculating the degrees of freedom were wrong. These are now corrected for version 2.0 and
above, and a paper has been submitted to JGR to explain the variation [Walsh, E., R. Arnold and M.
K. Savage (2013) "Silver and Chan Revisited), submitted to JGR June 2013].
1. Basic knowledge of geophysical terms
The programs described in this manual are used to measure shear wave splitting to retrieve
information about the anisotropy of a medium. The method is described and compared with manual
measurements in Andreas Wessel‘s MSc thesis (Wessel, 2010) and a publication (Savage et al.,
2010). In addition, the shear wave splitting tutorial of Savage (1999) and the original publications
on the shear wave splitting measurement algorithm (Silver and Chan, 1991) (SC91) and the cluster
analysis method (Teanby et al., 2004) (SPLIT) are recommended for further reading.

MFAST Manual V2.0 Page 5
2. Description of the method
Here we present a detailed description of the method, as it was first submitted to JGR. The revised
JGR version has had the details cut so as to keep it more in line with JGR style. The method is
based on the SC91 algorithm and the SPLIT cluster analysis method. An overview of the processing
steps is illustrated in Figure 1. The SC91 analysis is carried out on multiple measurement windows
and cluster analysis determines the best window. The cluster that has the minimum variance is
chosen as the best cluster, and a final SC91 measurement is made based on the window that gives the
minimum error bars on the splitting parameters within the cluster. The main advance presented here
is in automatically choosing the range of the measurement windows to use for the cluster analysis
based on the period of the event. As part of this advance, we use multiple filters to find the frequency
bands with the best signals as measured by the product of the signal to noise ratio (SNR) and the
filter bandwidth. Furthermore, automatic grading is carried out to determine the best events.
These extensions to the SC91 and SPLIT techniques greatly simplify the processing of large datasets,
with the only manual step being in picking the S arrival time.

MFAST Manual V2.0 Page 6
Figure 1 Flowchart of data processing steps. Dashed lines are optional steps.
2.1 Filtering
Since local broadband seismic data are often contaminated by noise, raw data can rarely be
processed. The application of a bandpass filter is important for shear wave splitting measurements,
because a sufficiently high SNR is necessary for a high quality measurement (Figure 2). However,

MFAST Manual V2.0 Page 7
narrow band filters should be avoided because they can lead to cycle skipping (Section 2.4).
Therefore we favor broader band filters when possible. Instead of applying a broad filter to all data
or manually selecting a filter for each measurement, a bandpass filter is determined for each event on
the basis of a SNR criterion and the width of the filter, as discussed below.
A predefined set of 14 bandpass filters (Table 1), with typical corner frequencies from previous
studies (Gerst, 2003) is tested for each event and the best filter is selected. Using different filters
(in SAC macro findfilt_prod.m) would make this method applicable to broad classes of data beyond
the application to local S waves described herein. For example, the SPLIT codes can be used on
teleseismic data to study mantle anisotropy (Greve et al., 2008) and straightforward modifications of
the codes described herein could be used to create automatic SKS measurements. If short period
data are used, the long period filters should be modified since they will effectively be cut off at
shorter periods than expected, and some of the resulting filters will give nearly identical responses.
For particular datasets, different sets of filters may be more appropriate, although those listed in
Table 1 provide reasonable starting values for most microseismic studies.
Table 1. Filters tested. All filters are two-pole Butterworth filters (in file findfilt_prod.m in macro directory)
Filter number Low freq (Hz) High
freq
(Hz)
Bandwidth
(octave)
1 0.4 4 5
2 0.5 5 5
3 0.2 3 7.5
4 0.3 3 5
5 0.5 4 4
6 0.6 3 2.5
7 0.8 6 3.75
8 1 3 1.5
9 1 5 2.5
10 1 8 4
11 2 3 0.75
12 2 6 1.5
13 3 8 1.3
14 4 10 1.25
2.2 Signal to noise ratio calculation
The measurements require several parameters, which could be checked and modified in other studies
(Table 2). A new SNR for the filtered data is calculated from the same window length (t_win_snr)
for both noise and signal, where the noise window precedes the S arrival (in this section, defined as
time 0 s) and ranges from (-t_win_snr - t_err to –t_err) where the offset t_err is chosen to account
for inaccuracies in the S arrivals (here we use t_err =0.05 s so the window is -3.05 to -0.05 s). The

MFAST Manual V2.0 Page 8
signal window follows the S arrival as (t_err to t_err + t_win_snr) (0.05 to 3.05 s). The noise
window is chosen to precede the S arrival directly to include the signal-generated noise of the P
coda, because such signal-generated noise will affect the S wave analysis.
The ratio of the rms amplitude of the signals in the east and north components are averaged to
calculate the SNR. No measurements with SNR < SNRmax (3 here) are considered for
interpretation. In the applications discussed herein, the waveforms filtered with the three filters
giving the highest value of the product of the filter bandwidth in octaves and the SNR (if there are
three or more filters fitting the SNR criterion) are analyzed. This allows us to examine the
frequency dependence of the results, and in
averaging the parameters, it ensures that
the measurements that are most stable with
frequency contribute most to the final
measurement. Earlier versions of the
code (called doass) used only the SNR
itself rather than the SNR-bandwidth
product, and were more prone to cycle
skipping, relying more heavily on later
grading to weed out poor measurements
(Johnson et al., 2010; Savage. et al., 2010).
2.3 Basic measurement technique
The shear wave splitting parameters of fast
polarization () and delay time (dt) are
measured by applying an inverse splitting
operator, which is determined by a grid
search over possible values (Silver and
Chan, 1991). The more a certain operator
removes the splitting of the investigated
waveform, the smaller the eigenvalue 2 of
the covariance matrix of particle motion
c(, dt) becomes. This is equivalent to
maximizing the linearity of the particle
motion (Silver and Chan, 1991). The
inverse operator that removes the shear
wave splitting best gives the resultant shear
wave splitting parameters. Contours of 2
for all the operators considered give a
measure of the confidence region by using
an F-test (SC91) (Figure 3, 4 f). This part
of the code has been updated based on
Walsh et al. (2013) with new coefficients
to calculate the number of degrees of
freedom, in general increasing the error
bars in version 2.0 and above compared to
earlier versions. Here we search the
parameter space in units of 1º and a time
Figure 2 application of different bandpass filters. Although
a change in frequency content is visible on the top trace
(raw data), the S-wave is masked by long period noise.
The application of a bandpass filter (BP) emphasizes the
signal, but the narrow 2-3 Hz filter appears “ringy” and is
susceptible to cycle skipping. (a) small event (M=3.8)
recorded at station LHOR. The best filters as measured
by the maximum of the product of the SNR and the
bandwidth (fb1 through fb3) are at high frequencies, but
the best frequency still has a narrow 1-Hz bandwidth. (b)
larger event (M=4.2) , which has better response at long
periods.

MFAST Manual V2.0 Page 9
unit depending on the scale of the problem for all fast directions and for delay times from 0.0 to
tlagmax (Table 2), where tlagmax is 1.0 s in this study. For some studies in which there are many
local earthquakes close to a volcano, we used tlagmax=0.4 s for the local events (Johnson et al.,
2010; Savage et al., 2008; Savage. et al., 2010). For SKS measurements, tlagmax can be 4 to 6 s
(Greve et al., 2008; Savage et al., 2007). However, note that the original SPLIT Fortran codes, and
also the codes here, reset tlagmax to be an integer multiple of (np2-1)*delta, where delta is the
sample rate of the record and np2 is set in the FORTRAN include file SIZE_np12int.h.
The results of the grid search for one pair of shear wave splitting parameters can be dependent on the
selected measurement window, i.e., the part of the waveform that is actually considered for the
measurement. To address this dependency, the analyst usually performs a measurement several times
with different measurement windows to confirm the stability of the resulting parameters.
Table 2. Parameters
Parameter Name: description
and (script name in which it is
located)
Suggested Range Expected
sensitivity
Value used in this paper
hi and lo filters
(findfilt_prod.m)
Depends on
instruments and
dataset
High See Table 1
t_win_snr (window for SNR)
(sn_rms_filtprod )
Average length of S
wave train for dataset
(2x dominant period
of dataset)
Low 3 s
t_err see explanation in text
(designed to account for error in
S arrival picks)
(sn_rms_filtprod)
5 samples Low 0.05 s
SNRmax (misnomer):
Minimum snr allowed to be
processed (sn_rms_filtprod)
3 at minimum; more
if dataset is
sufficiently large
Medium 3
tlagmax: maximum lag
examined
(create_event_ini.sh)
2x maximum
expected splitting
However, note that
tlagmax is reset in
the Fortran code (see
text)
High 1 s
tlagscale : scale on plots of
error contours
(plot_error_mfm.gmt;
create_event_ini.sh But note
that it may be reset within
tlagmax tlagmax

MFAST Manual V2.0 Page 10
Fortran code zsplit.f)
dtlag_max: maximum error in
tlag to allow in inclusion for
clustering
(create_event_ini.sh)
tlagmax/4 High tlagmax/4.
t_win_freq: window to calculate
dominant frequency fd (get_T2
in macro dir)
1.5 x t_win_snr Low 3 s
Tmid: Dominant period,
(calculated in
create_event_ini.sh)
1/fd
fdmin, fdmax: minimum and
maximum allowed fd
(create_event_ini.sh)
1/t_win_snr to
sample rate/10
High
0.3 to 8 Hz
Nwbeg : number of start times
tested) (nwbeg in mfast_config
or create_event_ini.sh if not
set in mfast_config)
2-5 low
5
Nwend: number of end times
tested ( nwend in
create_event_ini.sh)
>10
15<Nwend<25;
Nend Starts as
int((w4- Tend) but
modified depending on
Tend
Tbeg : time step size between
window start times (dtbeg in
create_event_ini.sh)
Should depend on fd Low 0.2 s, but decreased to the
smaller of 0.1 or
((S-P)/2)/Nbeg if S-P time
is too small
Tend : time step size between
window end times (dtend in
create_event_ini.sh)
High
0.08 s to start--increasing
and decreasing to make
Nend between 15 and 2.
Calculated from w3 and
w4
Tbeg0 : first time to start
window—closest to S arrival:
line (2) in Figure 3 ) (toffbeg
in create_event_ini.sh)
0.3 before S pick but 0.3 is
decreased to the smaller of
0.1 or ((S-P)/2)/(Nbeg+1)
if S-P time is too small.
Tbeg1: last time to start
window—furthest from S
arrival; line (1) in Figure 3
(zass_mfm)
S time –
(toffbeg+Nbeg*Tbeg

MFAST Manual V2.0 Page 11
Tend0 (first time to end
window; line (3) in Figure 3)
(create_event_ini.sh—there it
is called toffend, and w3)
S time + tmid/1.2+0.15
where tmid=1/fd
w4 : desired last end window
time
tmid*2.5+0.15
Tend1: last time to end window;
line (4) in Figure 3 (set in
zass_mfm)
S time + toffend +
Nend*Tend
Ncmin : minimum number of
points in an acceptable cluster
(nmin in create_event_ini.sh)
5
Mmax : maximum number of
clusters (maxnoclusters in
create_event_ini.sh)
15
var(k) Average variance of
cluster k
phi(k) Average fast direction of
cluster k
dt(k) Average delay time of
cluster k
Nmeas(k) Number of
measurements in cluster k
Kbest Cluster number of the
measurement with var(kbest) =
min(var(k))
Phidiff(k) phidiff =
abs(phi(k)-phi(kbest)
)
Tdiff(k) tdiff =
(dt(k)-dt(kbest)).
Nbeg (number of start window
times)
low 5

MFAST Manual V2.0 Page 12
Figure 3 High quality, A grade (Table 3) measurement recorded at station LHOR for a regional event. The grey boxes in panels (a), (b) and (d) delineate the time window used for the final measurement. (a) filtered East (E) North (N) and vertical (Z) waveforms. The solid line is the S arrival. The dashed lines are the minimum start (1) and maximum end (4) times for windows used in the processing, as in (b) . (b) the waveforms rotated into the SC91-determined incoming polarization direction (p) and its perpendicular
value (p), for the original filtered waveform (top) and the waveforms corrected for the SC91-determined dt (bottom) for the window shown in grey. The straight black line is the S arrival. The two sets of dashed lines on either side of the straight line show the range of allowed starting (1 and 2) and ending (3 and 4)
windows for the SC91 measurements. (c) and dt determined for each measurement window as a function of window number. (e) all the clusters of 5 or more measurements, with the large cross being the chosen cluster. (e) waveforms (top) and particle motion (bottom) for the original (left) and corrected (right) waveform according to the final chosen SC91 window. (f) contours of the smallest eigenvalue of the covariance matrix for the final chosen SC91 measurement. Numbers are described in text.

MFAST Manual V2.0 Page 13
The SPLIT method published by Teanby et al. [2004a] automatically performs measurements for a
large number of window configurations and then determines the most stable solution with a cluster
analysis. The original method allows one to choose one set of configuration parameters for all
measurements or to interactively choose measurement window times. In addition to fixing a few
small bugs that we found in the codes, we extended the method to automatically generate a
customized configuration file for each single measurement. Measurement window times relative to
the S arrival are calculated based on the dominant frequency of the signal.
The dominant frequency fd is calculated from a window (t_win_freq; 3 s here) which follows the S
arrival. But the maximum and minimum frequencies are limited so that the window lengths are not
too long or too short. We used 0.3 ≤ fd ≤ 8 Hz (Table 2).

MFAST Manual V2.0 Page 14
Teanby et al. (2004a) define the following variables, which we delineate in Table 2: The beginning
of the analysis window Tbeg is allowed to vary between Tbeg0 and Tbeg1, [(1) and (2) in Figure 3b] with
Nbeg steps of ΔTbeg. Similarly, the end of the analysis window Tend is allowed to vary between Tend0 and
Tend1, [(3) and (4) in Figure 3b] with Nend steps of ΔTend. The total number of analysis windows N is
therefore given by N =NbegNend, and the shear wave analysis window is defined by Tbeg =Tbeg1 - (i -1)
Tbeg for i = 1 . . . Nbeg. Following suggested guidelines (Teanby et al., 2004), the minimum window
(2-3 in Figure 3b) is chosen to be one period long (calculated from 1/ fd), while the maximum
window (1-4) is 2.5 periods long. The number of different measurement window end times Nend
depends on the minimum and maximum window length. For short (long) measurement windows the
standard step size between measurement windows of ΔTmeas=0.08 s is decreased (increased) so that
Nend is between 15 and 25 (Table 2).
The minimum and maximum times of the measurement window start are less critical than the
window end times (Teanby et al., 2004). We consider Nbeg window start times (Nbeg =5) in our
application of the cluster analysis, with ΔTbeg usually given as 0.2 s, so that t=-0.3, -0.5, -0.7, -0.9 and
-1.1 s, relative to the S arrival. However, to minimize interference of the P wave for close
earthquakes, if the time between the S and P arrivals (Ts-Tp) is less than 2.2 s, we make the shortest
time window begin at t=-0.1 s and the longest time window is -(Ts-Tp)/2; the other three time
window start times are scaled accordingly. The total number of measurement windows is thus
between 75 and 125, and is directly proportional to the processing time of the shear wave splitting
measurements.
Figure 4 Sample C quality measurement, as in Figure 3. This sample presents good waveform fits and has a high SNR for the best measurements, but other windows with qualities that are not much different
have that vary by tens of degrees, so the
measurement may exhibit cycle skipping.

MFAST Manual V2.0 Page 15
The cluster analysis searches the parameter space of the pairs of measurements ((i), dt(i)) to
determine clusters of measurements with similar values, and is described more fully elsewhere
(Teanby et al., 2004). Several sets of statistics are used to describe the clusters, the most important
of which is the total variance of each cluster, var(i). It depends on both the average variance of the
individual measurements within each cluster and the variance of measurements within the cluster.
The cluster with the minimum total variance is chosen as the best cluster, and within that cluster, the
measurement with the minimum variance is chosen as the best measurement, and is used as the final
measurement for that phase at that filter. Measurements from different filters are compared as
discussed below.
The maximum number of clusters allowed for any measurement (Mmax) is 15 and the minimum
number of events per cluster Ncmin is 5 (Table 2)
2.4 Grading criteria
One problem plaguing shear wave splitting measurements is that of cycle skipping, in which the
splitting program may mismatch waveforms by an integer number of half-cycles. If the waveform is
mismatched by one half cycle, then the fast and slow waves may be interchanged, and dt differs by
one half period (e.g., Matcham et al., 2000). This is particularly a problem with narrow band filters,
and is a cause of concern at volcanic areas, because the stress field near a dyke is proposed to
reorient by nearly 90º after the intrusion (Gerst and Savage, 2004). Even when cycle skipping is not
present, sometimes a group of windows will include scattered phases that result in multiple solutions
that differ from each other by values that are other than an integer half cycle or 90. Most studies use
manual checks to alleviate the problem, but it can be time consuming and also difficult to be
objective during manual checks. So we introduce an automatic technique instead to eliminate events
with multiple solutions.
We make a small modification to the original FORTRAN code to grade the events based on the
cluster analysis. Instead of simply using the results from the best cluster, all clusters with event
numbers above the minimum threshold Ncmin described above (Table 2) are compared to the chosen
―best cluster‖. We try to reject events in which there are secondary clusters which are of similar
quality to the best cluster, but have very different shear wave splitting parameters. Let var(k),
phi(k), dt(k), and Nmeas(k) be the average variance, fast direction, delay time, and number of
measurements in cluster i, respectively. Let kbest be the cluster number of the measurement with
var(kbest) = min(var(k)). This is the cluster chosen by the original SPLIT program to be the best
measurement. Nmeas(kbest) is thus the number of measurements in the best cluster. To consider
clusters of similar quality, the cluster grading considers all clusters with var(k) <5*var(kbest).
Within these ―OK clusters‖ we consider the differences between the fast directions and delay times
of each cluster compared to the best cluster. Therefore, we define phidiff = abs((phi(k)-phi(kbest))
and tdiff = dt(k)-dt(kbest). Table 3 includes a description of the cluster grading methods. Another
concern is for ―null‖ measurements, which can occur when there is no anisotropy in the plane of the
S wave particle motion, or when the initial shear wave is polarized along the fast or slow orientation
of the medium, so that no orthogonal wave exists to split (see alsoSilver and Chan, 1991; Wüstefeld
and Bokelmann, 2007). These null measurements must be treated separately from regular splitting
measurements. We use a geometrical criterion (Peng and Ben-Zion, 2005; Savage et al., 1996); we
compare the initial polarization pol determined from the SC91 inversion program to the fast
polarization Measurements are considered as null, if they do not fulfill the criterion 20º ≤ |
-pol|≤ 70º. For a uniform distribution of incoming polarizations, we expect 4/9 of the
measurements to be rejected by this criterion.

MFAST Manual V2.0 Page 16
Measurements that result in a delay time close to the maximum indicate cycle skipping or noisy data
(Evans et al., 2006), therefore measurements close to the maximum dt are also rejected. The mean
delay time obtained by (Gerst and Savage, 2004) for local earthquakes at Mt. Ruapehu in 2002 is
0.11 s for shallow events (z<35 km) and 0.27 s for deep events (z>55 km). For local events the delay
times are generally expected to be between 0.1 and 0.6 s (Table 1 of Savage (1999)). Therefore we
choose tlagmax, the maximum delay time for the grid search, to be 1.0 s and subsequently rejected
all measurements with a delay time greater than 0.8 * tlagmax. A final grade of A or B is made based
on whether the event has a cluster grade of Acl or Bcl, values of the SNR and 95% confidence
interval of the measurement (Table 3).
Finally, we developed a criterion based on our manual grading techniques, which involve examining
the plots of the contours of the eigenvalues of the covariance matrix of the final best measurement
(e.g. Figures 3, 4). A small range of contours indicates that the best result is not much better than
the worst result. The 95% confidence interval is defined to have a value of 1, and the rest of the
values are re-scaled so that their values are multiples of the 95% confidence value. We find the
maximum value of the error contours and keep it as a parameter (lamdamax; Table 4) in our results
files. In the Savage et al. (2010) study we use a value of 8 or greater to define a high quality
measurement. The value of 8 was chosen because it left roughly the same number of measurements
in the high quality manual (A and AB) and the automatic technique in an early implementation of the
SNR criteria. This quantity is correlated with the SNR, and with the formal error bars of the final
best splitting measurement, which we also include as grading criteria (errors in must be less than
25º for quality A and B events), and which is also based on the contours. However, the energy
criterion is distinct, as it applies to the whole error surface, not just the region around the minimum.
We found in later analysis at Piton de la Fournaise Volcano, that using 5 instead of 8 allowed more
measurements without significantly increasing the scatter in the results, so we now recommend using
a value of 5 as the default. Furthermore, for time variation studies to get enough measurements we
sometimes go down as low as 3.
During the processing steps a number of parameters, including measurement results, quality criteria
and event and station details are calculated that can be useful in further analysis. We keep track of
these parameters in an ascii log file with 41 parameters for each measurement. A bash script is then
used to compare the parameters to various values and rose diagrams are created to examine the
results as a function of different quality criteria.
2.5 Averages
Averaging of the individual measurements is carried out in the program
meanerr_summfiles_more_all in the utility directory. An updated version is in
meaner_summfilesTo calculate average parameters over multiple events sampling the same
anisotropy, we use Gaussian statistics for the delay times. For the polarizations we use the Von
Mises criterion (Mardia, 1972), a circular analogue to the normal distribution. Along with the
calculation of a mean fast polarization, a test for non-randomness must be conducted (Davis, 1986).
The calculation for the mean of the polarizations involves adding unit vectors with orientations given
by the measured values and dividing by the number of measurements. The ambiguity of 180 in
polarization is taken care of by doubling the angles before the vector addition, and halving the
resultant angle. The length of the resultant vector, R, gives a measure of the misfit between 0 and 1.
R=1 when all the polarizations are exactly lined up. Errors presented are the standard error, which is
valid if the distributions are approximately normal. However, many of the distributions are bimodal
and thus are not well described by normal distributions, so we recommend caution in using the
averages and standard errors.

MFAST Manual V2.0 Page 17
Table 3. Quality Criteria
Grade name
Criterion
(mostly in program proses_graded)
N (null) If the fast polarisation is between -20 to 20 or 70 to 110 degrees of
the incoming polarization
Dcl
Cluster D grade: If there is any cluster i for which the following holds:
nmeas(k)>Nmeas(kbest)/2 and var(k) < 5 var(kbest) and also:
(tdiff(k)> tlagmax/4 or (p/4 < phidiff(k) < 3p/4) )
Ccl
Cluster C grade: If the cluster is not D grade and there is any cluster i for which the following holds:
nmeas(k)>Nmeas(kbest)/2 and var(k) < 5 var(kbest) and also:
tdiff(k) > tlagmax/8 or /8 < phidiff(k) < 7/8.
Bcl
Cluster B grade: If the cluster is not grade D or C and there is any cluster i for which the following holds:
var(k) < 5*var(kbest) and nmeas(k) > Ncmin (5 here) and also:
tdiff(k) > tlagmax/8 or /8 < phidiff(k) < 7/8
Acl Cluster A grade: If the cluster is not grade D or C or B
ABPAR based on parameters alone: not null, dt < 0.8*tlagmax, SNR>3,
dphi<25
APAR
based on parameters alone: dt < 0.8*tlagmax, SNR> 4, dphi < 10,
where dphi = standard deviation of
AB Cluster A or B, not null, dt < 0.8*tlagmax, SNR>3, dphi<25
A Cluster A, dt < 0.8*tlagmax, SNR > 4, dphi < 10
Eng8
As described in text, maximum value of contour energy plots is greater than 8. This value was not used in the proses_graded code,
and was applied after the fact. It is now included in code proses_gradebetter, which uses contours better than 5 and only
uses S picks of grades 0, 1 or 2.
2.6 Use of multiple filters
Several of our earlier studies (e.g., Gerst and Savage, 2004) presented results from the same
event-station pair using multiple filters in the rose diagrams and used these multiple filters in the
averages. The rationale was that if an event had the same results at different filters, including it
several times would effectively weight the results more heavily than if it had different results at
different filters. However, such results should not have been treated with Gaussian statistics because
the results from different filters will correlate with each other. It is also difficult to decide which
filter results to compare with each other. Therefore, we recommend a further step, which is
effectively another grading step: for a given event-station pair, if more than one filter produced a
result that has passed the grading criteria, we compare the results and remove the entire measurement
if they are too different from each other, using the criteria described above for the cluster grading,
i.e., if the time difference is greater than tlagmax/8 or if the angular distance is greater than /8. If
the results are similar, we choose the one with the smallest error bars, as calculated by the sum of the
relative errors, err = (dterr/dtmax + phierr*4/) (Script utilities/sel_bestmeas)

MFAST Manual V2.0 Page 18
2.7 System Requirements
The codes presented here are all free of charge and publicly available. They were developed using
bash and shell scripts on the Linux Ubuntu platform. Fortran compilers, the GMT mapping and
plotting software (Wessel and Smith, 1998) and the SAC analysis package (Goldstein and Snoke,
2005) are all used. The scripts have been written in bash. The data must be present as
three-component SAC files (Goldstein and Snoke, 2005) and an S phase arrival time must be stored
in the file header. The TauP toolkit (Crotwell et al., 1999) is used to calculate incidence angles,
which are written to the results file and are useful for interpreting the data, but this toolkit is not
required to obtain a measurement. These are the only technical requirements to apply the method to
any data from local earthquakes. Modifications for teleseismic earthquakes should be
straightforward if the filter parameters are changed.
Starting with three-component files with S phase arrivals, data can be processed with a single
command line and without any manual intervention. Using optimized compilers on a 4-year old Dell
Latitude D620 laptop with a 1000 MHz CPU, it took about 0.5 minutes per measurement or 1.6
minutes per earthquake when three filters were used. Therefore, even with modest equipment, use of
this technique is faster than conventional manual analysis.
3 Prerequisites to use the programs
The scripts to use the method can be found on the network at Victoria University at
http://mfast-package.geo.vuw.ac.nz. Besides basic Unix tools the code requires some software
packages to run:
SAC: Seismic analysis code. Version 100.X or greater is highly recommended. Obtain from
http://www.iris.edu/manuals/ (visited Aug 8, 2007).
TauP: Seismic travel time utilities. Version 1.1.7 or later is recommended. Obtain from
http://www.seis.sc.edu/software/TauP/ (visited Aug 8, 2007).
GMT: Generic Mapping Tools. Version 4.2.X or greater is highly recommended. Obtain from
http://gmt.soest.hawaii.edu/ (visited Aug 8, 2007).
The mfast/bin directory needs to be included in the $PATH variable of the shell‘s environment so
that the programs can be found by the shell. To find out quickly if all required programs are installed
properly, run mfast_precheck. This script prints a warning message to the screen if a program is
missing or obsolete, or not sourced in the path correctly:
$ mfast_precheck
3.1 Customize paths and variables
The most commonly used settings and paths can easily be set by the user in the file mfast_config.
Some parameters, such as the number of measurement windows for the cluster analysis, have a
default value and do not necessarily have to be adjusted. Paths, however, need to be set up on each

MFAST Manual V2.0 Page 19
machine to run the programs, so that macros (subfolder mfast/macros) and shell scripts and binaries
(subfolder mfast/bin) can be found by the programs. The script mfast_precheck will print an error
message if the paths to the required directories and files are not set properly.
3.2 Programming style and syntax
A few basic shell scripting techniques (using BASH syntax) should be known for better
understanding and easier use of the programs:
awk syntax: awk is a pattern scanning language that is used to extract certain content from logfiles.
To read the second and third column of a comma-delimited text file (data.txt), the command
<data.txt awk -F, ‘{print $2,$3}‘ is used.
for-loops and processing of many events: Most of the programs and scripts are designed to process
one event at a time. When processing many events at a time, a for-loop is used to call the
program for each event until all events have been processed. If the command
$ mfast findfilt_prod -f eq1 is used to run the program findfilt_prod on the event eq1, then
$ for j in *.e; do mfast_findfilt_prod -f ${j%.e}; done
will invoke the program for all events in the current directory. This might come with a loss of
processing speed when handling many events at once (e.g. because programs like SAC have
to be started and quit each time the for-loop is passed through), but allows straightforward
separate processing of single events or custom subsets of events. The ${j%.e} construct is
used to strip the suffix .e from the filename.
command substitution: Variables are often set to the output of a command with the use of backticks.
When using wordcount=`cat data.txt | wc –w`, the variable wordcount will be set to the output
of the given command within the backticks (in this example, cat opens the file and wc counts
the words in the document). Note the difference between regular ticks (‗) and the backticks (`)
used in this example.
4. Download and convert data Earlier versions of these codes include programs to download and convert data from the New
Zealand Geonet network. However, because the Geonet network has changed its interface, we no
longer include the programs in our package or in the manual.
4.1 Prepare data for splitting measurement (I) While the splitting measurement routine has few requirements beyond an S arrival time, other
utilities including the post-processing grading utilities use other information such as the event
location and station location, so it is helpful to include as much information in the SAC headers as
you can. The scripts expect the data to be organized by station directories in SAC file triplets with
suffixes (.e, .n, .z) for East, North and Vertical components. The scripts expect P arrival picks in the
‗a‘ header variable, and S arrival picks in either the ‗t0‘, ‗t5‘, or ‗t6‘ header variables, depending on
which version of script checkspick is used. If the S arrivals have pick qualities in the header, those
qualities will be saved in the output summary file for ease of use in selecting data. Make sure you
have a backup of your files before you run any of the next steps, which start out by cutting the
files and overwriting the data so that they have a common length before the S arrival.

MFAST Manual V2.0 Page 20
SAC Header variables that are stored in the output summary file or used in the program or grading
routines. Explanations are in parentheses, with names used in the scripts given in italics:
kstnm (stat station name)
evla (evla event latitude)
evlo (evlo event longitude)
evdp (depthkm event depth in km)
dist (dist station-event distance in km)
stla (slat latitude of station)
stlo (slon longitude of station)
nzyear (year year of earthquake)
kt5 (pikgrd grade of pick from 0 as best to 4 as not usable)
kzdate (kzdate Date of event in ascii format; doy Julian date)
o, t5 (origin time and S pick time are combined to make the S travel time variable ttime. t5 is
needed to run the Teanby codes.)
RESP0, RESP1, RESP2, RESP3 and KRESP: These variables are used within the Teanby codes
and must be unset before running the splitting codes. This is now done in the ―checkspick‖
routines. The Teanby codes use these values to move from the seismogram reference frame to the
e, n, z frame and if they are set wrongly, the splitting measurements could be reported wrongly.
user1 (dist_ruap_deg: distance in degrees from the event to a pre-defined point (originally the
crater lake at Ruapehu; not used in the codes now)
user2 (dist_ruap_km: distance in km from the event to a pre-defined point (originally the crater
lake at Ruapehu; not used in the codes now)
user5 (anginc Angle of incidence in degrees if code mfast_logfiles_local is used in processing.
Otherwise anginc is set from the TauP codes. To get a proper angle of incidence, the velocity
model must also be set in the variable TAUPMOD in mfast_config. There should be two files with
the root name of the file set in TAUPMOD, ending in .tvel and in .taup This is set in the code
mfast_logfiles.
5. Processing of data for splitting measurement
The SAC format data can now be processed with the program mfast_mfm, a shell script that is used
to start several other programs and that can process one single event or many events at once. Another
script, do_station_mfm, is also available to call the commands in an order to conveniently process
entire directories, moving problem data into separate subdirectories. We first describe the workings
of the individual routines.

MFAST Manual V2.0 Page 21
Event data are prepared for splitting measurements and processed with the splitting measurement
code. Finally the results are stored in a file and displayed in various ways. The programs that are
mentioned in this section can be run without any arguments to display a manual that gives advice for
the exact command syntax. A data file triplet is expected to have name suffixes .e, .n and .z for east,
north and vertical component, respectively. Data files in this tutorial are named following a scheme:
2002.054.09.47.lhor2.e, with year, Julian day, hr, min, station name and component. But other
naming conventions are fine as long as the last letter is the component e, n, z . In fact, a preferred
naming convention is one with a unique identifier for each earthquake.
The following steps will usually be applied to the data from a certain station and the commands are
executed from within a stations directory, although the programs will work with other data structures
as well. Note that the seismograms will be cut and the original files are overwritten with these
altered shorter ones in the next processing steps. It is advisable to create backups (e.g. $ tar cvfz
lhor.tar.gz LHOR/ to create a backup archive of the directory LHOR). To analyse data from station
LHOR, change to the directory for this station:
$ cd LHOR
5.1 Prepare data for splitting measurements (II) The shear wave splitting measurement code has some requirements concerning the data files. The
data file triplet is required to start at the same absolute time and therefore needs to be synchronised.
Broadband data has to be down sampled and long seismograms have to be cut to prevent program
crashes (The maximum length of a seismogram depends on the sampling rate. The cluster analysis
program can handle a maximum of 10,000 samples).
The S-pick time is saved in the header field t5
of the north component file and events without any S-phase pick will not be included in any further
processing. All main scripts used from this step on are named with the prefix ―mfast ―. They should
work with any local earthquake data set. If the files have been picked with the header variable t0 as
the S pick, then use the codes described here, which also preserve the pick grade from the header.
If they have been picked with t5 or t6 as the S pick, use the code mfast_checkspick_t5_or_t6, which
has the same calling structure. If some other header variable has been used, the codes could be
modified. If data have been picked with both ‗t5‘ and ‗t0‘, the ‗t5‘ values will be used. So if you
repick data that has already been processed, be sure you remove all the ‗t5‘ headers before running
checkspick. You can do this by: in SAC,
SAC> read *.e *.n *.z
SAC>ch t5 UNDEFINED
SAC>wh over
Hints for picking:
One can put in the P and S picks expected for the origin time, using the TauP codes. Here's how to do
it:
$ taup_setsac -mod ak135 -evdpkm -ph p-8,s-9 filename, where filename is the SAC file you want to
change. It puts P phases into t8 and S phases into t9. Note the small letters for local earthquakes.
Best practice would have model ak135 changed to a local velocity structure.
MFAST Manual V2.0 Page 22
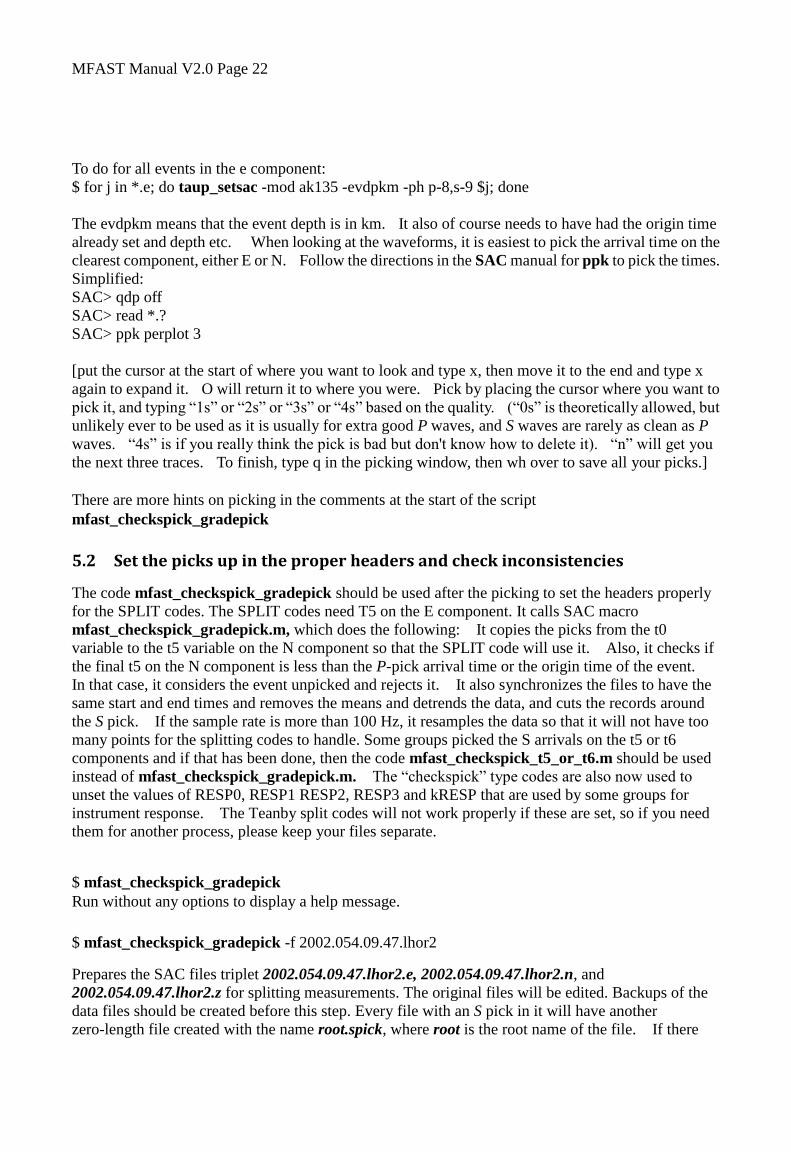
To do for all events in the e component:
$ for j in *.e; do taup_setsac -mod ak135 -evdpkm -ph p-8,s-9 $j; done
The evdpkm means that the event depth is in km. It also of course needs to have had the origin time
already set and depth etc. When looking at the waveforms, it is easiest to pick the arrival time on the
clearest component, either E or N. Follow the directions in the SAC manual for ppk to pick the times.
Simplified:
SAC> qdp off
SAC> read *.?
SAC> ppk perplot 3
[put the cursor at the start of where you want to look and type x, then move it to the end and type x
again to expand it. O will return it to where you were. Pick by placing the cursor where you want to
pick it, and typing ―1s‖ or ―2s‖ or ―3s‖ or ―4s‖ based on the quality. (―0s‖ is theoretically allowed, but
unlikely ever to be used as it is usually for extra good P waves, and S waves are rarely as clean as P
waves. ―4s‖ is if you really think the pick is bad but don't know how to delete it). ―n‖ will get you
the next three traces. To finish, type q in the picking window, then wh over to save all your picks.]
There are more hints on picking in the comments at the start of the script
mfast_checkspick_gradepick
5.2 Set the picks up in the proper headers and check inconsistencies
The code mfast_checkspick_gradepick should be used after the picking to set the headers properly
for the SPLIT codes. The SPLIT codes need T5 on the E component. It calls SAC macro
mfast_checkspick_gradepick.m, which does the following: It copies the picks from the t0
variable to the t5 variable on the N component so that the SPLIT code will use it. Also, it checks if
the final t5 on the N component is less than the P-pick arrival time or the origin time of the event.
In that case, it considers the event unpicked and rejects it. It also synchronizes the files to have the
same start and end times and removes the means and detrends the data, and cuts the records around
the S pick. If the sample rate is more than 100 Hz, it resamples the data so that it will not have too
many points for the splitting codes to handle. Some groups picked the S arrivals on the t5 or t6
components and if that has been done, then the code mfast_checkspick_t5_or_t6.m should be used
instead of mfast_checkspick_gradepick.m. The ―checkspick‖ type codes are also now used to
unset the values of RESP0, RESP1 RESP2, RESP3 and kRESP that are used by some groups for
instrument response. The Teanby split codes will not work properly if these are set, so if you need
them for another process, please keep your files separate.
$ mfast_checkspick_gradepick
Run without any options to display a help message.
$ mfast_checkspick_gradepick -f 2002.054.09.47.lhor2
Prepares the SAC files triplet 2002.054.09.47.lhor2.e, 2002.054.09.47.lhor2.n, and
2002.054.09.47.lhor2.z for splitting measurements. The original files will be edited. Backups of the
data files should be created before this step. Every file with an S pick in it will have another
zero-length file created with the name root.spick, where root is the root name of the file. If there

MFAST Manual V2.0 Page 23
are no spicks the file root.nospick will be created. The script do_station_mfm in the sample_data
directory moves these files to a directory called nospicks for possible repicking.
5.3 Find best filter
To improve the SNR and remove unwanted noise from the seismogram, the data can be filtered
(Figure 2). The program mfast_filt allows one to quickly apply the same bandpass filter to a data set.
It can also be used for an interactive selection of the best filter by visual inspection of the
waveforms.
The program mfast_findfilt_prod has been developed to automate this task. It applies a set of
different filters and ascertains the best one by calculating the SNR-bandwidth product (see next
section). The number, type and corner frequencies of the tested filters are set in the macro
findfilt_prod.m. Its methodology is described in Section 2.1.
$ mfast_findfilt_prod Run without any options to display a help message.
$ mfast_findfilt_prod -f 2002.054.09.47.lhor2
This applies a set of different filters to the event 2002.054.09.47.lhor2 and selects the three best
filters for further analysis. The SNR has to be two or greater as a minimum requirement at this point.
If no (or less than three) filters result in a file to fulfill this criterion, fewer files will be stored. In the
given example, the file triplets 2002.054.09.47.lhor2.1-8.fb1.(enz),
2002.054.09.47.lhor2.0,8-6fb2.(enz) and 2002.054.09.47.lhor21-5.fb3.(enz) are created, where the
corner frequencies of the bandpass filter are included in the filename and fb1, fb2 and fb3 mark the
best, second best and third best filter respectively. The ranking is based on which filter has the
largest SNR-bandwidth product. This naming scheme allows easy distinction for later analysis, when
only the best filter for each event (*.fb1), or possibly more than one filter per event (*.fb1, *.fb2,
*.fb3) are to be considered.
5.4 Calculate signal-to-noise ratio The next step is to calculate the SNR. If the mfast_findfilt_prod routine was used, the SNR was
already calculated, but if not, it is calculated in this step with a slightly different algorithm. (In case
manually filtered or raw data are analysed the calculation is repeated here. The calculation takes less
than half a second for each event on a 1.83 GHz computer.) For the shear wave splitting
measurements, even a P-wave has to be considered as noise. Therefore, the noise-level is calculated
from a window directly preceding the S-pick See section 2.2 for more explanations.
$ mfast_snr
Run without any options to display a help message.
$ mfast_snr -f 2002.054.09.47.lhor2
Calculate the SNR for 2002.054.09.47.lhor2.e and 2002.054.09.47.lhor2.n and write the arithmetic
mean of these two values to a file 2002.054.09.47.lhor2.sn, along with back azimuth and Nyquist

MFAST Manual V2.0 Page 24
Table 4. Fields of results log file (.res and .summ): The comma-delimited log file contains
information about the event and the measurement results. See text for details. A description of
all fields is given below. Fields of results log file (.res): The comma-delimited log file contains
information about the event and the measurement results. See text for details. A description of
all fields is given below. Results file parameters
1) event 21) δt [s]
2) stat 22) Dδt [s]
3) slat [◦] 23) Φ [◦]
4) slon [◦] 24) DΦ [◦]
5) CUSPID 25) anginc [◦]
6) year 26) anginccorr [◦]
7) doy det 27) type ini
8) evla [◦] 28) timestamp
9) evlo [◦] 29) comment
10) dist (ev–stat) [km] 30) Nyquist frequency [Hz]
11) depth [km] 31) grade (A,B,C,N,R,U)
12) magnitude 32) filt LO [Hz]
13) BAZ [◦] 33) filt HI [Hz]
14) Spol [◦] 34) |Spol − Φ| [◦]
15) DSpol [◦] 35) Incidence angle with respect to crack plane
16) wbeg 36) Grade in pick header t0
17) wend 37) Lamda max
18) dist Ruap [◦] 38) Ndf
19) dist Ruap [km] 39) Lambda2_min
20) SNR 40) Ttime [s]
41) Maxfreq (dominant frequency in S wave)
frequency.
5.5 Create configuration file and measure shear wave splitting
The SPLIT shear wave splitting measurement code automatically cycles through a given number of
measurement windows. The number and range of the tested windows is determined by parameters in
a configuration file. A general configuration file can either be used for all events or manually created
for each single event. The waveforms of the events analysed in this and in the previous studies have
a broad variation in terms of frequency content, so that a single configuration setup for all events led
to erroneous results. Period lengths of the signal waveform usually vary between 0.7 to 2 s. To
address this variability, a customised configuration file is created for every event before the actual
splitting measurement with the program ass_mfm is done. Parameters used for these calculations are
set in the file create_event_ini.sh.
The code ass_mfm, is a modified version of the SPLIT code, in that it prints out more information
about the clusters to help in later evaluation, and it also grades the cluster based on properties of the
clusters. A new subroutine called zgrade_mfm.f was written, and zass_mfm.f calls zgrade_mfm
and also puts out a new file with more information in it. For compatibility with previous codes, the
program does not change any of the files originally created. It makes new files with extensions
―clustnew‖ and ―ilognew.ass‖ to add to the previous files with extensions ―clust‖ and ―ilog.ass‖. The
new files just put out more information. The grades are put into ilognew.ass. The grades are ACl,
BCl, CCl, and DCl, and are described in section 2.4 and Table 3.
$ assi_mfm -f 2002.054.09.47.lhor2 -s /path/to/file/ass.config.ini
Do a splitting measurement on the event 2002.054.09.47.lhor2 and use the parameters given in the
ass.config.ini file to determine start and end time ranges of the measurement window (Figure 3,4)
number of measurement windows and other parameters. See Teanby et al. [2004] and the

MFAST Manual V2.0 Page 25
documentation in the split_mfm directory for descriptions of the input files.
1. event: Name of the event and base name of the files. (2006.300.TUVZ.2644522.3-8.fb1)
2. stat: Station name. (TUVZ)
3. slat: Latitude of the station in degrees. (-39.26943)
4. slon: Longitude of the station in degrees. (175.65398)
5. cuspid: A 7-digit event identification number. (2644522)
6. year: Calendar year in which the event occurred. (2006)
7. doy det: Julian day on which the event occurred, with decimal digits giving the fraction of the day.
(300.051)
8. evla: Latitude of the event hypocentre in degrees. (-40.862)
9. evlo: Longitude of the event hypocentre in degrees. (176.915)
10. dist (ev–stat): Distance between event hypocentre and station in km. (206.981)
11. depthkm: Epicentral depth of the event in km. (39.81)
12. mag: Event magnitude. For GeoNet data this is a local magnitude ML. (3.335)
13. BAZ: Back azimuth in degrees. This is the azimuthal angle at which the signal arrives at the
station. (149.087)
14. spol: Initial polarisation of the shear wave in degrees. (41.805)
15. Dspol: Error of Spol in degrees, one standard deviation. (1.685)
16. wbeg: Start time of the selected measurement window in seconds, relative to the start of the
seismogram at t =0 (25.652000)
17. wend: End time of the selected measurement window in seconds, relative to the start of the
seismogram at t =0 (26.353741)
18. dist ruap km: Distance of the event hypocentre from Mt. Ruapehu in kilometres. The distance is
given as a surface distance for a spherical earth with a radius R = 6371km and is calculated from the
point 39.281◦
S/175.564◦
E which is located at the centre of Crater Lake. (210.073)
19. dist ruap deg: Distance from Mt. Ruapehu in degrees. (1.88924)
20. SNR: Signal to noise ratio for this event. (5.43038)
21. tlag: Delay time between fast and slow shear wave in seconds. (0.870000)
22. dtlag: Error of δt in degrees, one standard deviation. (0.028125)
23. fast: Angle of the orientation of the fast shear wave, in degrees from North. (-62)
24. dfast: Error of in degrees, one standard deviation. (5.250)
25. anginc: Angle of incidence at the station, measured against a horizontal plane in degrees, where
0◦
means vertical incidence. (20.8)
26. anginc corr: Angle of incidence corrected for topography slope at the area around the station.
(20.8)
27. type ini: Type of measurement. This field contains the measurement code that is used (ass), the
number of measurement window start times nbeg and the number of window end times nend. (ass 3
25)
28. timestamp: Date at which the measurement was performed and the log file (.ilog.ass) was
created. (2007-10-12)
29. comment: Any additional information or comment that can be added manually or set in
mfast_config. (any text)

MFAST Manual V2.0 Page 26
30. nyquist: Nyquist frequency of the event in Hz. The Nyquist frequency fnyquist depends on the
sampling rate of an event (f, in Hz), where fnyquist = f/2.
31. gradeABCNR: Evaluation of the measurement quality. See Table 3
32. filt LO: Lower corner frequency of the bandpass filter in Hz. (3)
33. filt HI: Higher corner frequency of the bandpass filter in Hz. (8)
34. spol−fast: Angle between the initial polarisation and the fast orientation in degrees. This value is
used to detect null measurements. (76.195)
35. Incidence angle with respect to the crack planes.
36. Grade in pick header t0. This is the grade that the analyst gave to the S arrival pick.
37. Lamda max. The maximum value of the eigenvalue of the corrected covariance matrix, which
relates to the number of contour intervals are in the plots in Figure 3(f) in Savage et al. 2010.
Higher values have more distinct differences between the best and worst splitting values and indicate
higher quality measurements.
38. ndf. The number of degrees of freedom in the measurement. Not used yet, but will be
necessary for certain cases in which correct error bars for averaging multiple measurements is
desired.
39. lambda2_min. The minimum value of the eigenvalue of the covariance matrix before it was
scaled to have the 95% confidence level set to 1. This is the value that was used to do the scaling.
This value may be important in later error analysis.
40. ttime. The S-wave travel time between the earthquake and the station. Determined from the
SAC headers o and t5.
41. maxfreq. The dominant frequency in the S wave, determined from the frequency at the
maximum spectral amplitude.
$ assi_mfm -f 2002.054.09.47.lhor2 -c Create an event-specific configuration file and use the
parameters in this file for the splitting measurement. The splitting measurement is done with the
program ass_mfm (Teanby et al., 2004), modified to include automatic grading, and logfiles
(event.ilog.ass and event.ilognew.ass) are created. The file with the extension ilog.ass is the original
format of the SPLIT codes, while ilognew.ass has the same information but with two extra
columns—one containing the cluster grade and another with the number of degrees of freedom in the
best measurement. The start and end time ranges of the measurement windows are calculated with
the SAC macro get_T2 that also calculates the main frequency fd of the shear wave. See Section 2.3
for details. After the calculation of the main frequency of the shear wave, the minimum and
maximum window end times are derived, where the minimum window end time is by default set to
5/6 · T and maximum end time to 2.5 · T, where T is the dominant period of the shear wave. (A small
offset of 0.15 s is added to account for some slightly early S picks). These values prove to be a good
compromise between allowing longer measurement windows that possibly suffer from interfering
secondary phases and shorter windows that result in less stable measurements.
Several new files will be created when a splitting measurement is done. The script mfast_logfiles is
used write results to a log file. For each measurement, a results file (extension .yyyy-mm-dd.res
where the first part is the date of the processing) with relevant event details, measurement parameters
and measurement results is created. A description and example content for every field is listed below
Table 5.
$ mfast_logfiles -f 2002.016.lhut
This command will create a file 2002.016.lhut.res which contains the fields as described above. This

MFAST Manual V2.0 Page 27
does not need to be done if the measurement has been done with the script assi_mfm, in which case
the .res file is automatically created.
$ mfast_logfiles -a
The -a option will write the .res files for all measurements in the current directory. This can be used
if some result files were deleted or to assure that a result file for each measurement is present.
$ mfast_logfiles -s
This command is used to create one summary file (.summ) of all measurements in the current
directory. It should be used after all events in a directory (e.g. one year‘s data from one station) have
been processed. The summary file contains the same fields as the results file (see Table 6) and will
have one line per measurement.
$ mfast_logfiles_local was modified from mfast_logfile to put in the angle of incidence from the
SAC user5 variable, as was set calculated from the location programs and the velocity files that were
used in the routine processing, which is considered better than using the default values in the TauP
codes.
$mfast_logfiles_agathe is the same as mfast_logfiles_local but it adds two variables, utmlat and
utmlon, which are latitude and longitude in utm coordinates (distance in m from a specific point) for
use in plotting.
Table 5. A list of all the files made, with explanations. See also the documentation provided with
the SPLIT codes.
File
extension
Explanation
date.res As explained beneath description of assi_mfm.
ass_auto.log output from the code that give intermediate steps and results of possible interest
especially in debugging
assdone Zero-length file that is used to tell the automatic codes not to recalculate the splitting
part of this measurement.
clusters Information about the results from different clusters—set in the original SPLIT codes
clustnew Same as clusters but containing new information about the grading
clustxy Information to be used for plotting the clusters
done Zero-length file that is used to tell the automatic codes not to recalculate this
measurement.
error The error surface for plotting e.g. figure 3 and 4 e in Savage et al. 2010
freq The dominant frequencies of the components within a window about the S wave
gmt Used for plotting
ilog.ass Output data from the splitting measurement
ilog.assnew Same as ilog.ass but containing more information
ini The initialization file used to make the measurement with the SPLIT codes
pm Particle motion for plotting
pmc Corrected particle motion for plotting
af Slow and fast wave for plotting
sfc Corrected slow and fast wave for plotting

MFAST Manual V2.0 Page 28
sn SNR of various filters
soln Solution results to put onto plot
src Corrected component parallel to the initial particle motion
sro Original component parallel to the initial particle motion
ss Uncorrected slow wave
ssc Corrected slow wave
stc Corrected component perpendicular to the initial particle motion
sto Original component perpendicular to the initial particle motion
snprodlist List of the product of SNR and bandwidths for the filters to be compared
spick Zero-length file telling the automatic codes that the measurement has an S arrival
picked in the SAC header.
5.6 Display results
Measurement results can be illustrated in individual measurement plots, rose diagrams, split maps
that show individual measurements as bars on a map, and several other analysis plots. The programs
to display these results work in two steps. First, they read out the summary file and select and reject
several events according to certain quality criteria. Second, they create a PostScript figure that
illustrates the results that have passed the selection step.
$ ass_plot_mfm.sh 2002.050.05.34.lhut2.2-3.fb1
This will create a measurement analysis plot (Figure 3). This analysis plot is composed of six
individual plots and a text box with event information and measurement results. The file containing
the analysis plot is named with a prefix all6_,
e.g. all6_2002.050.05.34.lhut2.2-3.fb1.ps. The individual plots are also stored as individual files and
have the event name (2002.050.05.34.lhut2.2-3.fb1) and a suffix (_wind.eps, _rt.eps, _fs.eps,
eventinfo.eps, _error.eps and _clusters.eps). The program only needs the event name as an argument.
$ proses_ graded –t 0.8 -f *.summ. Display measurement results of the fast orientation in a rose
diagram. A cut-off delay time can be passed to the program (–t option) to reject events with a too
high delay time. The program displays six rose diagrams by default. It uses the quality criteria
discussed in Savage et al (2010) to distinguish different rose diagrams (Figure 5). Summary file
outputs containing different quality measurements used in each rose diagram are also made. Output
is put into rose diagrams that are coded by the station name, but the .summ files have no station
name in them yet.
roseABC.sta and selroseABC.summ: (Cluster grading of A,B, or C. Nulls by the incoming
polarization criterion are allowed in, and SNR is not checked except that the measurement only is
attempted if the initial SNR of the filtered seismograms was good enough.
roseAB.sta and selroseAB.summ: Cluster grading of A or B. Not a null according to the
polarisation criterion (i.e., the result is between 20 and 70 degrees from the incoming polarisation
direction). SNR greater than 3 and delay time less than dtmax set with the –t option (defaults to 0.8).
Maximum error in phi is <=25 degrees.

MFAST Manual V2.0 Page 29
roseA.sta and selroseA.summ. Cluster grading of A. Not including nulls according to incoming
polarization-back azimuth criterion (i.e., the event is between 20 and 70 degrees from the incoming
polarisation direction). SNR greater than 4 and delay time less than dtmax set with the –t option
(defaults to 0.8). Maximum error in phi is <=10 degrees.
roseABshortdt.sta and selroseABshortdt.summ. Same as roseAB but max dt is dtmax/2.
roseABpol.sta Just the incoming polarisation directions of the A and B events.
rosenullgrade.sta: Grades of A and B from the cluster analysis that were considered null by the
polarisation/back azimuth criterion.
$ proses_old_noprint -t 0.8 -f *.summ
Display measurement results of the fast orientation in a rose diagram (Figure 6). A cut-off delay
time can be passed to the program (–t option) to reject events with a too high delay time. The
program displays six rose diagrams by default. For each deep and shallow events, it plots two rose
diagrams of the fast orientation with different quality criteria and a diagram showing null
measurements at the bottom. Parameters can be passed on as arguments or can be set directly in the
proses_old_noprint script. The program can be run without any arguments to display a help message.
Mostly temporary files are created to make the plots.

MFAST Manual V2.0 Page 30
The six plots represent the results of the different type of grading carried out. These plots take into
account both the new machine grading from the cluster analysis and also grading criteria based on the
measurement results. We also print out the different types of files in selected .summ files to be able to
compare more information about the records. The grading scheme is:
$ proses_gradebetter -f $1.*.summ -s $1 -t 0.8
This is the same as proses_graded except that it includes a check for the ―better‖ criterion below.
roseABC.sta and selroseABC.sta.summ: (Cluster grading of A,B, or C. Nulls by the incoming
polarization criterion are allowed in, and SNR is not checked except that the measurement only is
attempted if the initial SNR of the filtered seismograms was good enough.
roseAB.sta and selroseAB.sta.summ: Cluster grading of A or B. Not a null according to the
polarisation criterion (i.e., the result is between 20 and 70 degrees from the incoming polarisation
direction). SNR greater than 3 and delay time less than dtmax set with the –t option (defaults to 0.8).
Maximum error in phi is <=25 degrees.
roseA.sta and selroseA.sta.summ. Cluster grading of A. Not including nulls according to incoming
polarization-back azimuth criterion (i.e., the event is between 20 and 70 degrees from the incoming
polarisation direction). SNR greater than 4 and delay time less than dtmax set with the –t option
Figure 5 Rose diagram plots from proses_graded to display in the results of several measurements for station LHOR in 2002.
Figure 6 Rose diagram plots from
proses_old_noprint. Results from GeoNet station
TUVZ for all data from 2004 to 2006.

MFAST Manual V2.0 Page 31
(defaults to 0.8). Maximum error in phi is <=10 degrees.
roseABshortdt.sta and selroseABshortdt.sta.summ. Same as roseAB but max dt is dtmax/2.
roseABpol.sta Just the incoming polarisation directions of the A and B events.
rosenullgrade.sta: Grades of A and B from the cluster analysis that were considered null by the
polarisation/back azimuth criterion.
rosebetter.sta and rosebetter.sta.summ The measurements pass the AB criteria, and in addition, the
minimum labdamax is greater than 5, and only S picks from 0, 1, and 2 are used.
Further ways to select measurements:
In the Savage et al. Mfast paper (Savage et al., 2010), figures were made in which the frequencies
were selected from the same manner as the cluster analysis, i.e., the top three measurements were
compared and were thrown out if they were not close enough to each other. That code is in the
utilities directory and is called sel_bestmeas. The way to use it is to say:
$sel_bestmeas filename.summ
Where filename.summ is the summary file you want to work with.
Also, some figures used the “eng8” selection, which was to choose only measurements in the
summary files that had lamdamax > 8. That is done by the following command:
$awk –F, „{if ($37 > 8) print $0}‟ <filename.summ >filename.eng8.summ
This is now not necessary if you use the rosebetter grade with the criteria of 5 instead of 8, but the
command is included here in case somebody wants to do a different check or similar selections could
be made according to any of the columns desired in the .summ files.
6 Automatic measurement and monitoring tool
To simplify the use of the programs and to keep manual user input to a minimum, the script
mfast_mfm can be used to invoke all commands that are listed above. Starting with a triplet of SAC
files, this allows the user the automated processing of one or many events with a single command.
However, we have found that sometimes it is more straightforward to run parts of the commands
with checks in between to remove unwanted files. This is accomplished using script
do_station_mfm, which can easily be modified to stop at whatever step is desired.
$ mfast_mfm -f 2004.002.FWVZ.2165587 -p -r
This command is used for the processing of one event that is passed to the script with the -f option.
The data are byteswapped, an S-Pick is stored in the SAC file header, the seismograms are
synchronised and cut, the SNR is calculated, a configuration file is created, the measurement and the

MFAST Manual V2.0 Page 32
cluster analysis are done and the results are written to a log file. However, there are some minimum
requirements to run all steps. If no S-Pick is found in the file header or the SNR is less than 2, the
processing will be interrupted and the user is informed by an error message printed to the terminal.
The script do_station_mfm gets around this by creating directories of problem files and allowing the
calculation to continue on the other files.
The next commands will process all files in the current directory by invoking a for loop. This is an
easy way to handle large data sets. These commands do not need to be typed manually. They can be
copied from the terminal text that is printed to the screen by just invoking mfast without any
arguments. The do_station_mfm script invokes these types of commands.
$for j in *.e; do if [ ! – f "${j%.e}*.done" ]; then mfast_mfm -x 9 -f ${j%.e}; fi; done
This command invokes the program mfast_findfilt and automatically selects up to three bandpass
filters that give the best SNR for each event. This is an optional step, but raw data rarely give good
results when local events are analysed.
$for j in *.fb1.e; do if [ ! –f "${j%.e}*.done" ]; then mfast_mfm -r -f ${j%.e}; fi;
done
Again, this command line does not need to be typed by the user. By running mfast_mfm without any
options, some commonly used command lines are printed to the terminal and can simply be copied
All events for which a sufficiently good filter has been found are now analysed for shear wave
splitting. The for loop now includes the events with the best filter that was found (*.fb1.e). For
sparse data sets it is possible to include also the second-and third best filter for each event by adding
*.fb2.e and/or *.fb3.e to the for loop. This is done in the do_station_mfm script.
Starting with a directory containing several SAC file triplet, the do_station_mfm script checks the
S picks, prepares the data, finds the best bandpass filters for each event, performs the
measurements, write a summary log file and display the results in a rose diagram (proses_
graded). At the end, the code ―archive.sh‖ is used to move intermediate files into directories and
make them into tar files to make the directories more manageable. A ―Cheat sheet‖ at the end of
this Manual gives a quick overview of all commands and programs.
7. Utilities The directory ―utilities‖ accompanying this package has some programs that were useful for
display and analysis. They do not work in the automatic fashion of the other programs, and they
will need to be modified for use with other datasets. They are included only as a guide and help to
individuals who are interested in creating their own script: we do not plan to support them.
There is some documentation within the scripts themselves. Here is a description of the programs
and how some of them are used:
corr_arrival_angle Corrects the angle of incidence for a dipping surface.

MFAST Manual V2.0 Page 33
crampin_band.awk: This code should not be necessary if mfast_logfiles was used. It calculates
the angle of the propagation vector with respect to the crack plane, which is assumed to be vertical
and oriented parallel to the fast polarization measurement.
crampin_band_inputcrack.awk: Same as above, but the crack planes are assumed vertical with
the orientation given in an argument to the file.
meaner_summfiles_more_all Program to calculate means of parameters in the .summ files using
circular statistics or straight Gaussian statistics depending on the variable.
kappa, window_*: used in the averaging programs and overlay_stay_file_errorbar.gmt.
overlay_sta_file_errbar.gmt and similar: Create plots of moving averages with error bars. Uses
some of the other files in the directory.
sel_bestmeas: Checks files with measurements at more than one filter. It leaves out events with
results that are too different for different filters, and otherwise chooses the filter with the best results.
do_station_mfm_jj: A modification of do_station_mfm created by Jessica Johnson to work with a
different directory structure. It also calls archiving script archive.sh to clean up the directory after
execution so that many of the files created in the earlier steps are stored in archive folders.
mapping_utilities: A folder with various mapping utilities, such as:
map_taupo_eventnos.bash: A bash script to create a map with rose diagrams, used in the
region of Taupo, New Zealand and provided by Katharina Unglert.
05km_proj: A folder with various files used to create plots for splitting measurements
plotted at the point where the ray between the earthquake and the station pierces the 5 km depth
projection. This program assumes a straight-line ray path, i.e., a homogeneous velocity model, and
uses the angle of incidence to back-project the position, regardless of the earthquake depth. For
example, and earthquake with depth of 2 km will be plotted at the same position as one of 10 km
with the same incidence angle. So it is not meant to give an accurate location of the piercing point,
but merely to give an indication of the back-azimuthal patterns that occur for the splitting
measurements at any given station.
8. Third party software used for this study
Essential parts of this work have been done with the help of the following software and tools:
Interpreters: bash, csh
SAC 100.1 Seismic analysis code was used to load, plot, filter, edit and process the seismograms.
See Goldstein and Snoke [2005].
GMT 4.2.0 Most of the plots and almost all of the maps were created with the Generic Mapping
Tools developed by Wessel and Smith [1998].

MFAST Manual V2.0 Page 34
SPLIT cluster analysis code. The cluster analysis code developed and published by Teanby et al.
(2004) constituted the core of the programs that have been used. During the project, source code and
scripts have been modified to adjust to the requirements of this specific study. The code was
compiled with the free compiler g77 and gfortran. For a more detailed description of this code see
the original publication or Wessel (2008).
gfortran Fortran compiler gfortran was used to compile the cluster analysis code.
TauP: The TauP toolkit codes are used in the analysis (Crotwell et al., 1999).
Unix tools: cat, awk, sed, grep and many more.

MFAST Manual V2.0 Page 35
9. Cheat sheet
The next two pages contain a short guide to use the automatic shear wave splitting measurement
programs and can be printed or copied for reference. Some of the programs require certain
environment variables to be set. Further information can be found in the according Readme and
manpages. Although the shell scripts have been mainly developed following Bash syntax, several
GMT scripts use the C shell as an interpreter and not all of them were rewritten into Bash syntax. As
Bash and Csh are both freely available, it is recommended to have both set up when running the
scripts. The programs can be started from a Bash or Csh environment, because the scripts select their
correct interpreter with a special command in the first line (e.g. #!/bin/bash).
get data (Done outside mfast codes)
select events, retrieve via your favourite method for your seismic network.
byteswap data (if extracted on another machine)
write the S-phase picks into the files
preparation (in station directory through mfast codes)
check S-pick
apply filter
raw data – one filter for all data
find best filter automatically
calculate signal to noise ratio (SNR)
splitting measurements and cluster analysis (time-and CPU-intensive)
• create an event-specific ass.ini configuration file (considers different window ranges
according to the period length of the event; selects a reasonable number of windows and step length)
• write logfiles (.res, .summ)
• reads all information from several files
• creates a .res results file for each event
• creates a .summ summary file for each station for further analysis
• quality control (signal to noise ratio, maximum delay time, maximum error for , stable
windows, null measurements)
• analysis plots (all6 .....) for visual quality control (e.g. linearity of the particle motion) of
single measurements
• rose diagrams (for each station)
• splitting on a map, density plots of parameters vs. depth (to look for spatial changes)
• splitting parameters vs. time (to look for temporal changes)
Quick command guide:
Starting with SAC file triplets which have S-phase picks stored in the header field t0, the following
commands can be used to automatically do shear wave splitting measurements with all events in the
current directory. These commands can be copied from the screen when invoking the command
mfast_mfm without any options.
• Prepare: $for j in*.e; do if [ ! –f "${j%.e}*.done" ]; then mfast_mfm -p -f ${j%.e}; fi; done

MFAST Manual V2.0 Page 36
• Filter: $for j in*.e; do if [ ! –f "${j%.e}*.done" ]; then mfast_mfm -x 9 -f ${j%.e}; fi; done
• Measurement:$ for j in*.fb1.e; do if[! -f"${j%.e}*.done" ]; then mfast_mfm -r -f ${j%.e}; fi;
done
• Further analysis:
mfast_mfm_ logfiles -s;
proses_graded -t 0.8 -f *.summ
• All in one step: for j in*.e; do if[! -f"${j%.e}*.done" ]; then mfast_mfm -p -f ${j%.e}; fi; done; for
j in *.e; do mfast_mfm -x 9 -f ${j%.e}; done; for j in*.fb1.e;do if[! -f"${j%.e}*.done" ]; then
mfast_mfm -r -f ${j%.e}; fi; done; mfast_mfm logfiles -s; proses_graded -t 0.8 -f *.summ
10. Trouble Shooting
The codes have been tested on Dell Laptops running Ubuntu Linux and also on Red Hat Enterprise
Linux version 5, and both work. They were also tested on a MacOSx operating system by Kohtaro
Araragi, and the following changes needed to be made if the Mac system is used:
The plotting codes that use the Linux command sed have to be changed from: [sed -i] to [sed -i "" -e]
in the following codes: ass_plot_mfm.sh, proses_old_noprint, proses_mfm.
Most problems stem from either the paths or the SAC files not being set up properly. If problems
are found, the best procedure is to break down the steps into smaller ones. For instance, instead of
running the script do_station_mfm, copy and paste each line of it into your directory to run it one
line at a time and on one file at a time to find in which code the problem lies. Then do the same for
the script that it is calling, etc. Many of the scripts have ―print‖ or ―echo‖ commands that are
commented out now, but which can be un-commented to trouble shoot problems.
The file filenamebase.auto.log contains some of the input and output used in the code, and can help
with trouble shooting. Also, as you run through each step, look for the most newly created files and
check that they include the needed information (e.g., ls –lrt will print a list of files in your directory
with the most recent files at the bottom).

MFAST Manual V2.0 Page 37
References
Crotwell, H.P., Owens, T.J., and Ritsema, J., 1999, The TauP Toolkit: flexible seismic travel-time
and ray-path utilities: Seism. Res. Lett., v. 70, p. 154–160.
Davis, J.C., 1986, Analysis of directional data, Statistics and Data Analysis in Geology - Second
Edition, John Wiley & Sons, Inc., p. 314-330.
Evans, M.S., Kendall, J.-M., and Willemann, R.J., 2006, Automated SKS splitting and upper-mantle
anisotropy beneath Canadian seismic stations: Geophysical Journal International, v. 165, p.
931-942.
Gerst, A., 2003, Temporal Changes in Seismic Anisotropy as a New Eruption Forecasting Tool,
Victoria University of Wellington, New Zealand.
Gerst, A., and Savage, M.K., 2004, Seismic anisotropy beneath Ruapehu Volcano: A possible
eruption forecasting tool: Science, v. 306, p. 1543-1547.
Goldstein, P., and Snoke, A., 2005, SAC availability for the IRIS community: Incorporated Research
Institutions for Seismology Newsletter, v. 7.
Greve, S.M., Savage, M.K., and Hofmann, S.D., 2008, Strong variations in seismic anisotropy across
the Hikurangi subduction zone, North Island, New Zealand.: Tectonophysics, v. 462, p. 7-21.
Johnson, J., Prejean, S., Townend, J., and Savage, M., 2010, Anisotropy, repeating earthquakes, and
seismicity associated with the 2008 eruption of Okmok Volcano, Alaska: Journal of
Geophysical Research, v. in press.
Mardia, K.V., 1972, Statistics of Directional Data: New York and London, Academic Press.
Matcham, I., Savage, M.K., and Gledhill, K.R., 2000, Distribution of seismic anisotropy in the
subduction zone beneath the Wellington region, New Zealand: Geophysical Journal
International, v. 140, p. 1-10.
Peng, Z., and Ben-Zion, Y., 2005, Spatiotemporal variations of crustal anisotropy from similar
events in aftershocks of the 1999 M7. 4 Izmit and M7. 1 Düzce, Turkey, earthquake
sequences: Geophysical Journal International, v. 160, p. 1027.
Savage, M.K., 1999, Seismic anisotropy and mantle deformation: what have we learned from shear
wave splitting?: Reviews of Geophysics, v. 37, p. 65-106.
Savage, M.K., Duclos, M., and Marson-Pidgeon, K., 2007, Seismic Anisotropy in the South Island,
New Zealand, in Okaya, D., Stern, T., and Davey, F., eds., A Continental Plate Boundary:
Tectonics at South Island, New Zealand, Volume 175, Am. Geophys. Union Geophys.
Monograph Series, p. 95-116.
Savage, M.K., Ohkura, T., Umakoshi, K., Shimizu, H., Kohno, Y., Iguchi, M., Wessel, A., and Mori,
J.V., 2008, Variations in Seismic Anisotropy with time on Volcanoes in Kyushu Island,
Southern Japan: Eos Trans. AGU, v. 89 p. S53A-1813.
Savage, M.K., Sheehan, A.F., and Lerner-Lam, A., 1996, Shear-wave splitting across the Rocky
Mountain Front: Geophysical Research Letters, v. 23, p. 2267-2270.

MFAST Manual V2.0 Page 38
Savage, M.K., Wessel, A., Teanby, N., and Hurst, T., 2010, Automatic measurement of shear wave
splitting and applications to time varying anisotropy at Mt. Ruapehu volcano, New Zealand:
Journal of Geophysical Research B: Solid Earth, v. submitted 2010.
Savage., M.K., Ohminato, T., Aoki, Y., Tsuji, H., and Greve, S., 2010, Absolute stress and its
temporal variation at Mt. Asama Volcano, Japan, from seismic anisotropy and GPS: Earth
&Planet. Sci. Lett., v. 290, p. 403-414.
Silver, P.G., and Chan, W.W., 1991, Shear wave splitting and subcontinental mantle deformation: J.
Geophys. Res., v. 96, p. 16429–16454.
Teanby, N., Kendall, J.-M., and van der Baan, M., 2004, Automation of shear-wave splitting
measurements using cluster analysis: Bull. Seism. Soc. Amer, v. 94, p. 453-463.
Wessel, A., 2008, Automatic shear wave splitting measurements at Mt. Ruapehu volcano, New
Zealand [MSc thesis]: Wellington, Victoria Univ. Wellington.
Wessel, P., and Smith, W.H.F., 1998, New, improved version of the Generic Mapping Tools
Released: EOS Trans. AGU, v. 79, p. 579.
Wüstefeld, A., and Bokelmann, G., 2007, Null Detection in Shear-Wave Splitting Measurements:
Bulletin of the Seismological Society of America, v. 97, p. 1204-1211.