Manual for Demo Data - jsi-medisys.de · Manual for Demo Data SEQUENCE Pilot module SeqPatient...
42
Manual for Demo Data SEQUENCE Pilot module SeqPatient Version 5.0.0 (July 31st 2018) developed by JSI medical systems GmbH Tullastr. 18 77975 Ettenheim GERMANY phone: +49-7822/440150-0 fax: +49-7822/440150-20 email: [email protected] web: www.jsi-medisys.com (for research use only)
Transcript of Manual for Demo Data - jsi-medisys.de · Manual for Demo Data SEQUENCE Pilot module SeqPatient...

Manual for Demo Data
SEQUENCE Pilotmodule SeqPatient
Version 5.0.0(July 31st 2018)
developed by
JSI medical systems GmbHTullastr. 18
77975 EttenheimGERMANY
phone: +49-7822/440150-0 fax: +49-7822/440150-20email: [email protected]: www.jsi-medisys.com
(for research use only)
Table of Contents1 Introduction to SEQUENCE Pilot – SeqPatient................................................................................22 Installation........................................................................................................................................2
2.1 SEQUENCE Pilot......................................................................................................................23 Installation of demo data..................................................................................................................24 What is configured...........................................................................................................................25 The first login...................................................................................................................................36 SEQUENCE Pilot screen.................................................................................................................37 Create your own user.......................................................................................................................48 Configuring of the base caller..........................................................................................................59 Load sequencing result files............................................................................................................510 Joining........................................................................................................................................... 611 Worklist..........................................................................................................................................912 Sequence.......................................................................................................................................9
12.1 Order/Statistic/Protocol/Family..............................................................................................1012.2 Reference.............................................................................................................................1112.3 Genes...................................................................................................................................1112.4 Sources.................................................................................................................................1212.5 Positions/Resultfiles..............................................................................................................1212.6 Variation/Mutation Table.......................................................................................................1312.7 Electropherogram.................................................................................................................1412.8 Show.....................................................................................................................................1612.9 Functions..............................................................................................................................17
13 Analysis of the demo data............................................................................................................1813.1 COL1A1................................................................................................................................18
13.1.1 Mutation in E13 position -14...........................................................................................1913.1.2 Mutation in E22 position 38............................................................................................2213.1.3 Mutation in E43 position 34............................................................................................23
13.1.3.1 Edit Bases...............................................................................................................2313.1.3.2 Undo Function.........................................................................................................25
13.1.4 Mutation in E43 position 37............................................................................................2513.1.5 Mutation in E43 position +19..........................................................................................2613.1.6 Mutation in E49 position 19............................................................................................2713.1.7 Mutation in E49 position 58............................................................................................2813.1.8 Mutation in E52 position -12...........................................................................................2913.1.9 Result of the COL1A1 analysis......................................................................................3013.1.10 Validation.....................................................................................................................3013.1.11 Printing of a report........................................................................................................3113.1.12 Basecaller and Auto Edit..............................................................................................3313.1.13 How to analyse the order again....................................................................................35
13.2 Mareno..................................................................................................................................3613.2.1 Sample with DNA number 159.......................................................................................3613.2.2 Sample with DNA number 160 – Statistic Warnings.......................................................37
13.3 Discussion of the analysis.....................................................................................................3914 Archiving, Statistics and Mutation database.................................................................................4015 Shortcuts......................................................................................................................................40
Manual for demo data SEQUENCE Pilot – module SeqPatient 1
1 Introduction to SEQUENCE Pilot – SeqPatient
The module SeqPatient is made for bioinformatical analysis of Sanger sequencing data and iscompatible with all sequencers. It uses an unique learning basecaller based on statistic data and hasits own auto edit function. Moreover an internal mutation database is integrated. After the analysis, adiagnostic report for each sample is received. SeqPatient is a simple, easy to use desktop application including a variety of functionalities to fit theprogram to many different specific needs.
2 Installation
2.1 SEQUENCE Pilot
In case you have done the Installation of SeqPilot already, please proceed with chapter 3.
For the installation of SEQUENCE Pilot, please do the following:
Go to our website http://www.jsi-medisys.com/free-trial-license to obtain a free trial license.
You will receive installation instructions for our latest version of SeqPilot.
3 Installation of demo dataThe demo data package SeqPatient_DemoData.exe includes the complete configuration andexample files for the genes COL1A1 and Mareno and shows step by step how to load and analysethe data.
Please note, that this package shouldn't be installed to systems already including data for genesCOL1A1 or Mareno. This might overwrite your local configuration and statistic values. In this case,please contact our support associates ([email protected]) for a separated installation.For the installation of the demo data, do the following:
Stop SEQUENCE Pilot. The program should not run during installation !!!
Go to our websitehttp://www.jsi-medisys.de/DownLoadFiles/DemoData/SeqPatient_DemoData.exe
Press [Execute] in the dialogue file download – security warning.
Press [Execute] again in case of another security warning.
Press [Next] in the dialogue Setup – SeqPatient Demo Data.
Check the box I accept the agreement after reading the Software License Agreement andpress [Next].
Press [Next] after reading the Info and Installation Instructions for Sequence Pilot demo data.
Select the destination folder, where the SEQUENCE Pilot demo data should be installed. Bydefault this is c:\SeqPilot. Then press [Next].
Press [Install].
Press [Finish] when the SEQUENCE Pilot installation is completed.
4 What is configured
All sequencing result files and configuration data are extracted and deposited within the Demo-directory of your installation.
Manual for demo data SEQUENCE Pilot – module SeqPatient 2

The COL1A1.txt and Mareno.txt gene files – previously downloaded from www.ensembl.org arecopied to the GeneFiles-directory of the installation. View them with any text editor or check thecontents with SEQUENCE Pilot (menu item SeqPatient/Gene Admin). For each gene, informationsuch as gene name, loaded files, information for each sequence version, coding sequence (CDS),mRNA, translation, cDNA and known variations are listed.Several master files for Amp. Modules, Sequencing Primer and Thresholds are added to the system.They are shown within the corresponding operations in the category SeqPatient on the left side of thescreen. Please refer to the Manual SEQUENCE Pilot - module SeqPatient for a detaileddescription.Moreover reference sequences, statistic values and found mutations from previously analysedsamples for COL1A1 and Mareno are loaded.
5 The first login
Once SEQUENCE Pilot is installed and licensed, login using the username jsi (leave the passwordfield empty).
6 SEQUENCE Pilot screen
In SEQUENCE Pilot a menu is available which consists of the items System, SeqPatient and Help.Furthermore several categories and operations are shown on the left side of the screen. Open acategory or an operation by clicking on the corresponding icon. Then different screens with differentfunctionalities are opened.
Manual for demo data SEQUENCE Pilot – module SeqPatient 3
operations
categories
menu
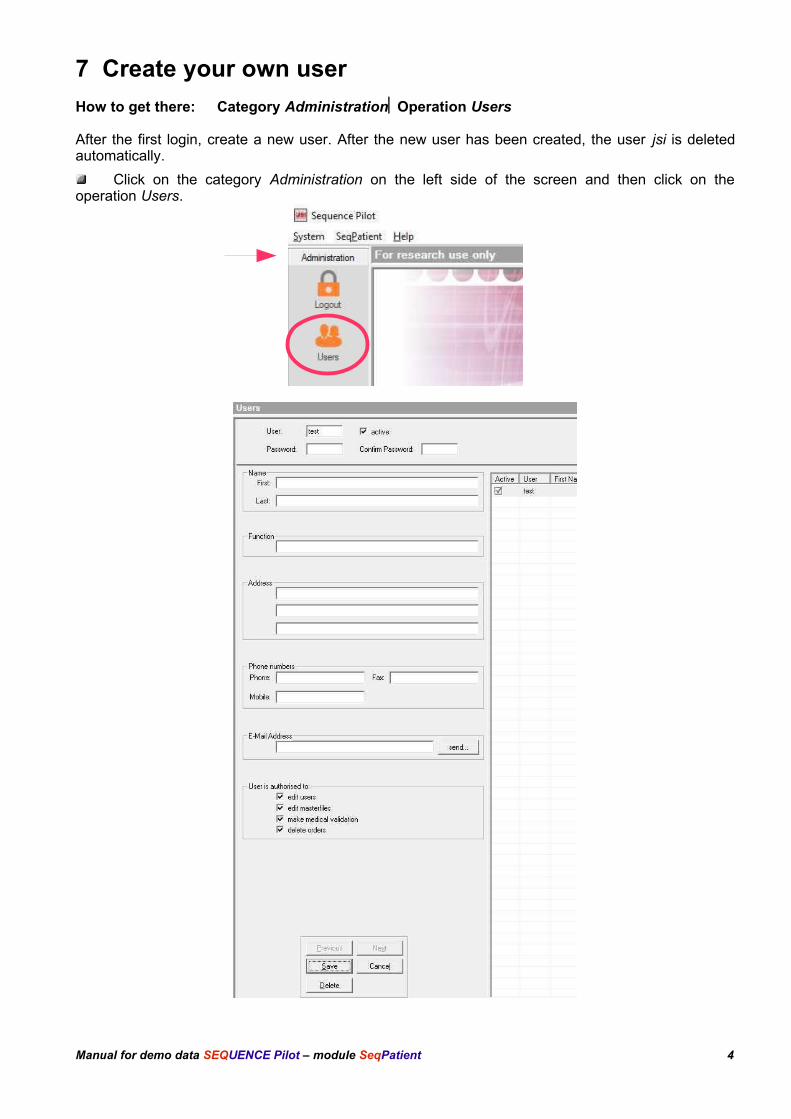
7 Create your own user
How to get there: Category AdministrationOperation Users
After the first login, create a new user. After the new user has been created, the user jsi is deletedautomatically.
Click on the category Administration on the left side of the screen and then click on theoperation Users.
Manual for demo data SEQUENCE Pilot – module SeqPatient 4
Fill out the field User (max. 4 letters).
Mark active and all options user is authorized to....
Press [Save].
Select the operation Logout and then login with the new user.
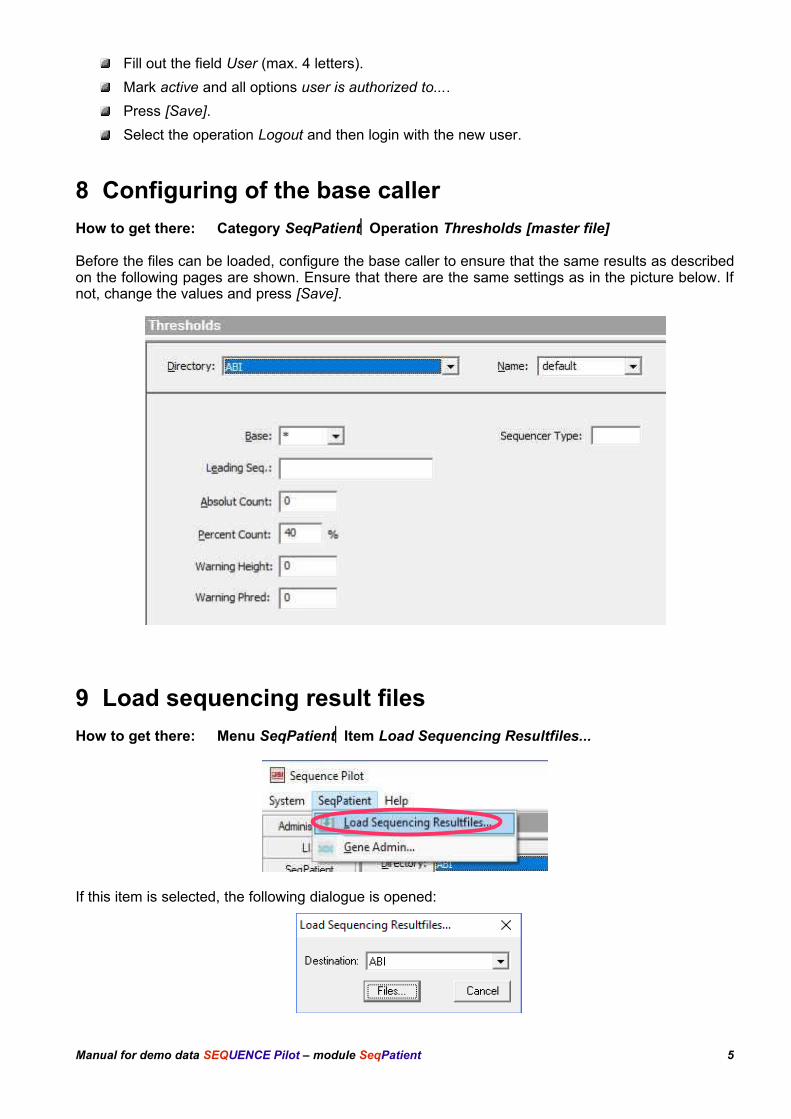
8 Configuring of the base caller
How to get there: Category SeqPatientOperation Thresholds [master file]
Before the files can be loaded, configure the base caller to ensure that the same results as describedon the following pages are shown. Ensure that there are the same settings as in the picture below. Ifnot, change the values and press [Save].
9 Load sequencing result files
How to get there: Menu SeqPatientItem Load Sequencing Resultfiles...
If this item is selected, the following dialogue is opened:
Manual for demo data SEQUENCE Pilot – module SeqPatient 5
Within the field Destination, select the sequencer being worked with. By default the sequencer typeABI is already preselected. Please do not change this entry, because the demo files are made withABI sequencers.
Loading of the sequencing result files for COL1A1:
Press [Files...].
Open the directory SeqPilot/Demo/COL1A1.
Select all result files with ctrl+A.
Press [Open] to load the selected result files.
Load the Mareno files in the same way. They are located in the folder Mareno of the Demo-directory.
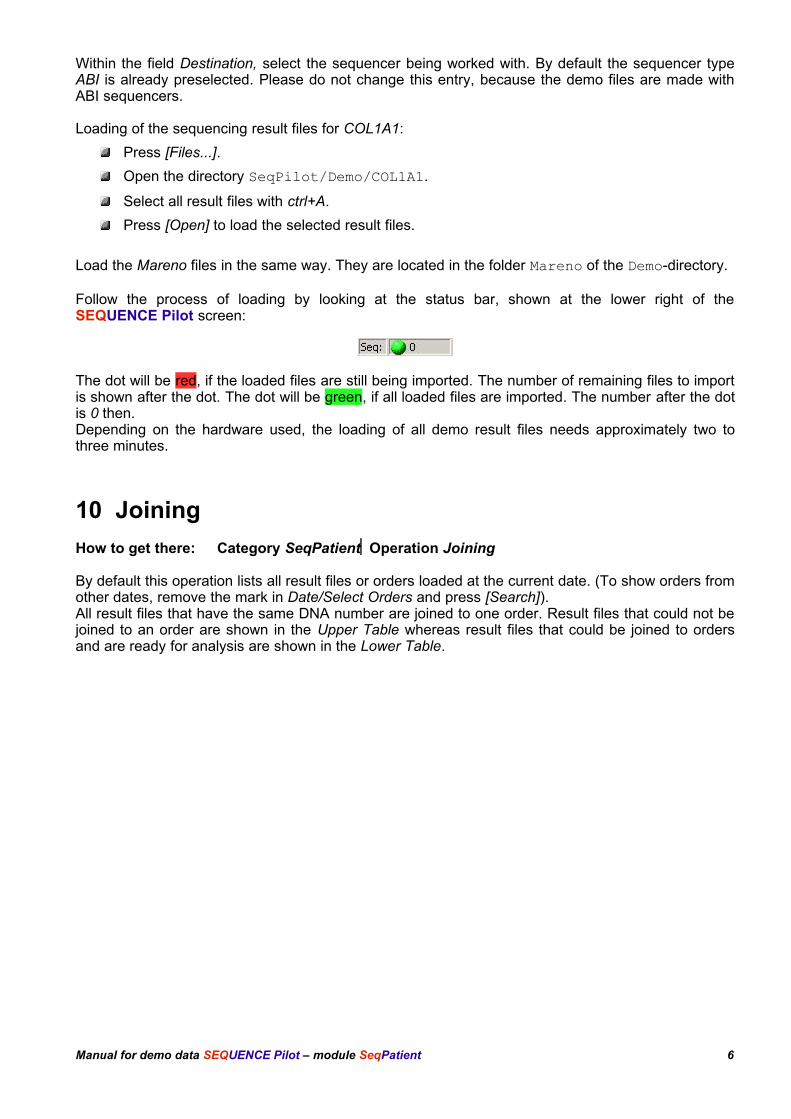
Follow the process of loading by looking at the status bar, shown at the lower right of theSEQUENCE Pilot screen:
The dot will be red, if the loaded files are still being imported. The number of remaining files to importis shown after the dot. The dot will be green, if all loaded files are imported. The number after the dotis 0 then.Depending on the hardware used, the loading of all demo result files needs approximately two tothree minutes.
10 Joining
How to get there: Category SeqPatientOperation Joining
By default this operation lists all result files or orders loaded at the current date. (To show orders fromother dates, remove the mark in Date/Select Orders and press [Search]). All result files that have the same DNA number are joined to one order. Result files that could not bejoined to an order are shown in the Upper Table whereas result files that could be joined to ordersand are ready for analysis are shown in the Lower Table.
Manual for demo data SEQUENCE Pilot – module SeqPatient 6
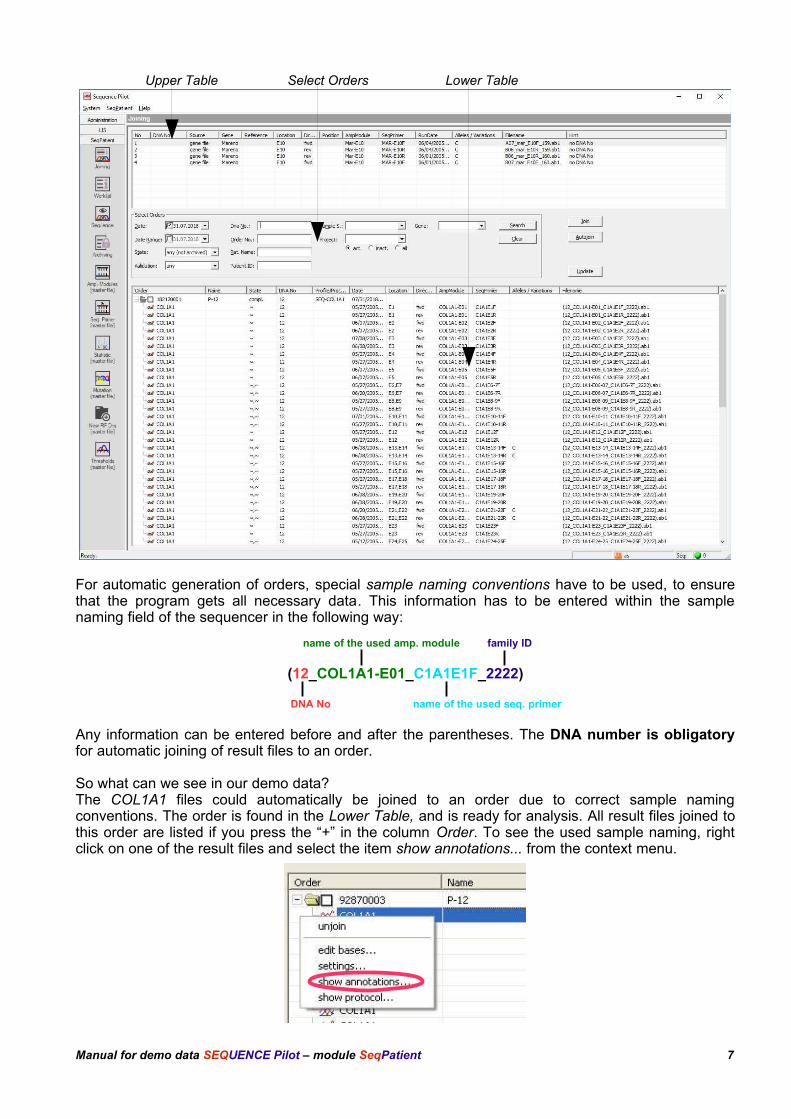
Upper Table Select Orders Lower Table
For automatic generation of orders, special sample naming conventions have to be used, to ensurethat the program gets all necessary data. This information has to be entered within the samplenaming field of the sequencer in the following way:
name of the used amp. module family ID
(12_COL1A1-E01_C1A1E1F_2222)
DNA No name of the used seq. primer
Any information can be entered before and after the parentheses. The DNA number is obligatoryfor automatic joining of result files to an order.
So what can we see in our demo data?The COL1A1 files could automatically be joined to an order due to correct sample namingconventions. The order is found in the Lower Table, and is ready for analysis. All result files joined tothis order are listed if you press the “+” in the column Order. To see the used sample naming, rightclick on one of the result files and select the item show annotations... from the context menu.
Manual for demo data SEQUENCE Pilot – module SeqPatient 7
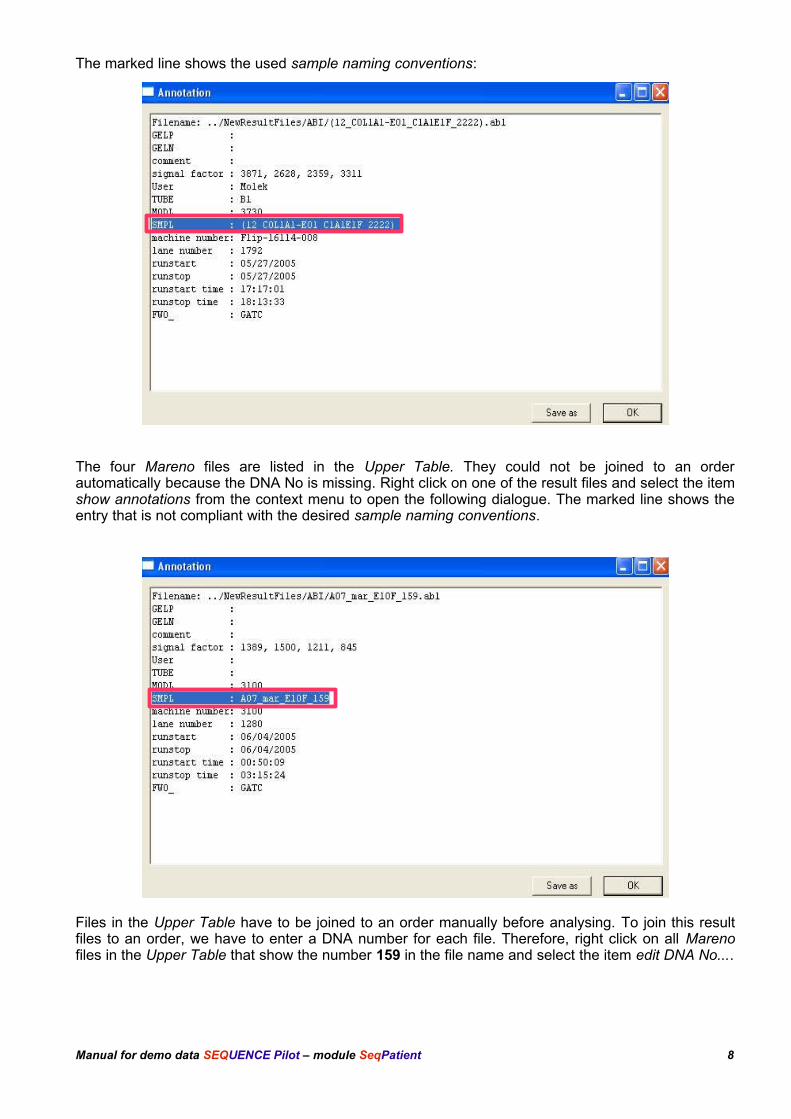
The marked line shows the used sample naming conventions:
The four Mareno files are listed in the Upper Table. They could not be joined to an orderautomatically because the DNA No is missing. Right click on one of the result files and select the itemshow annotations from the context menu to open the following dialogue. The marked line shows theentry that is not compliant with the desired sample naming conventions.
Files in the Upper Table have to be joined to an order manually before analysing. To join this resultfiles to an order, we have to enter a DNA number for each file. Therefore, right click on all Marenofiles in the Upper Table that show the number 159 in the file name and select the item edit DNA No....
Manual for demo data SEQUENCE Pilot – module SeqPatient 8
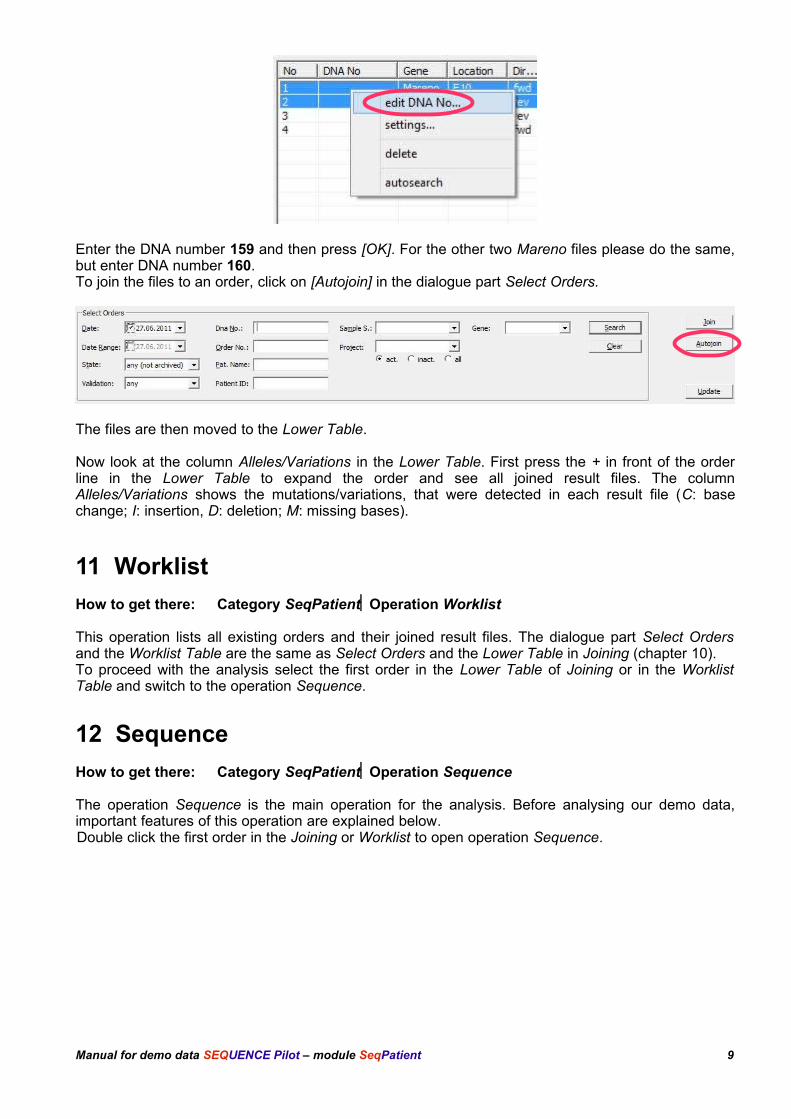
Enter the DNA number 159 and then press [OK]. For the other two Mareno files please do the same,but enter DNA number 160.To join the files to an order, click on [Autojoin] in the dialogue part Select Orders.
The files are then moved to the Lower Table.
Now look at the column Alleles/Variations in the Lower Table. First press the + in front of the orderline in the Lower Table to expand the order and see all joined result files. The columnAlleles/Variations shows the mutations/variations, that were detected in each result file (C: basechange; I: insertion, D: deletion; M: missing bases).
11 Worklist
How to get there: Category SeqPatientOperation Worklist
This operation lists all existing orders and their joined result files. The dialogue part Select Ordersand the Worklist Table are the same as Select Orders and the Lower Table in Joining (chapter 10). To proceed with the analysis select the first order in the Lower Table of Joining or in the WorklistTable and switch to the operation Sequence.
12 Sequence
How to get there: Category SeqPatientOperation Sequence
The operation Sequence is the main operation for the analysis. Before analysing our demo data,important features of this operation are explained below.Double click the first order in the Joining or Worklist to open operation Sequence.
Manual for demo data SEQUENCE Pilot – module SeqPatient 9
12.1 Order/Statistic/Protocol/Family
Order: This tab shows all important information about the order like order number, patient,DNA number, date etc.
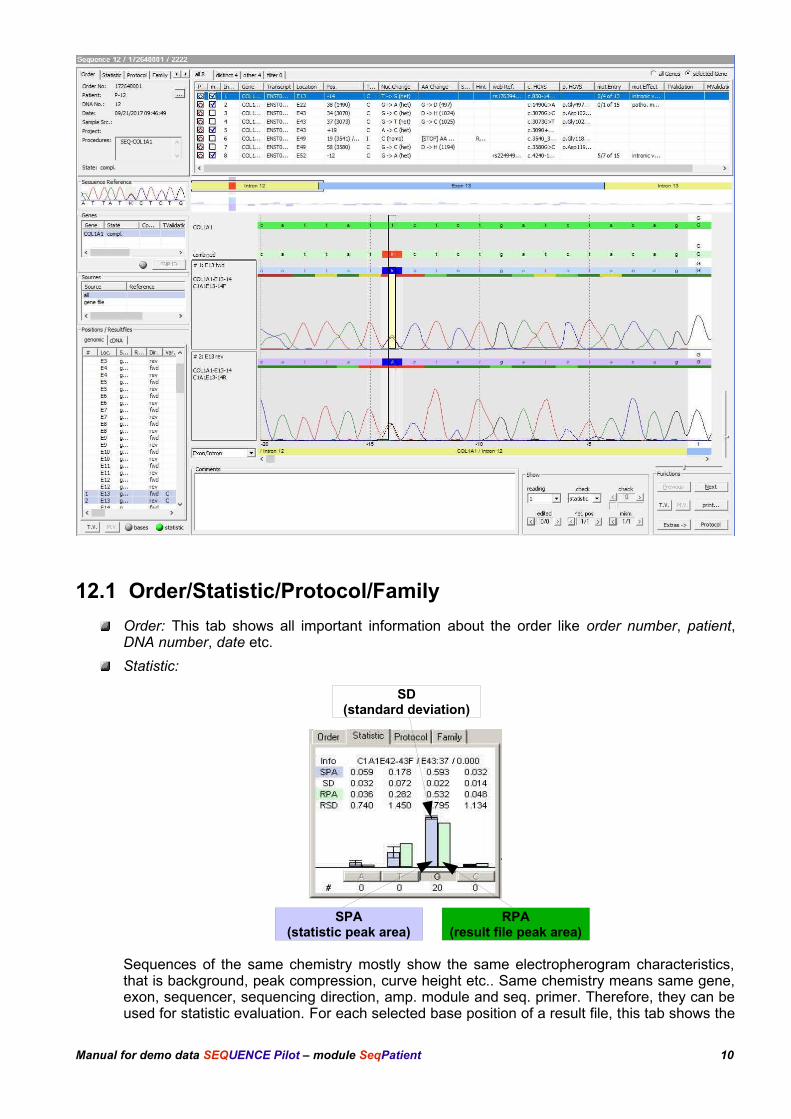
Statistic:
Sequences of the same chemistry mostly show the same electropherogram characteristics,that is background, peak compression, curve height etc.. Same chemistry means same gene,exon, sequencer, sequencing direction, amp. module and seq. primer. Therefore, they can beused for statistic evaluation. For each selected base position of a result file, this tab shows the
Manual for demo data SEQUENCE Pilot – module SeqPatient 10
SD(standard deviation)
SPA(statistic peak area)
RPA(result file peak area)
corresponding statistic values (statistic value of the peak area, statistic value of thebackground, standard deviation). These were calculated over all existing result files of thesame chemistry already archived (see chapter 14), where the selected base was detectedhomozygously. Heterozygous positions are not used to calculate the statistic. The presentstatistics are listed in the operation Statistic [master file] (see also chapter 14). The advantageis, that all analyses can be compared with previous analyses. Therefore the statistic helps todecide whether a postion is heterozygous.
Protocol: This tab shows a list of all base changes as well as ignored bases to left and to rightof the currently selected gene within the dialogue part Genes for each result file. By selectingan entry, the cursor jumps to the corresponding base position within the Electropherogram.
Family: This tab shows a list of all orders belonging to the same family ID. The current order isalways shown in the first line. Click on one of the other orders to open it.
12.2 Reference
A reference sequence is shown that corresponds to the sequence of the result file in theelectropherogram. A reference sequence is a sequence of the same chemistry (gene, exon,sequencer, direction, amp module and seq. primer) which was analysed previously and defined as areference. Only one reference sequence can be saved for each chemistry. To save a result file sequence as a reference, right-click on a base of the result file sequence (see13.6 Electropherogram for result file sequence) and select the item reference > save as from thecontext menu. If a reference sequence with the same chemistry has been saved already, there is the option tooverwrite it. All reference sequences are listed in the lower table of the operation Statistic [master file](see chapter 14 for Statistic [master file]).
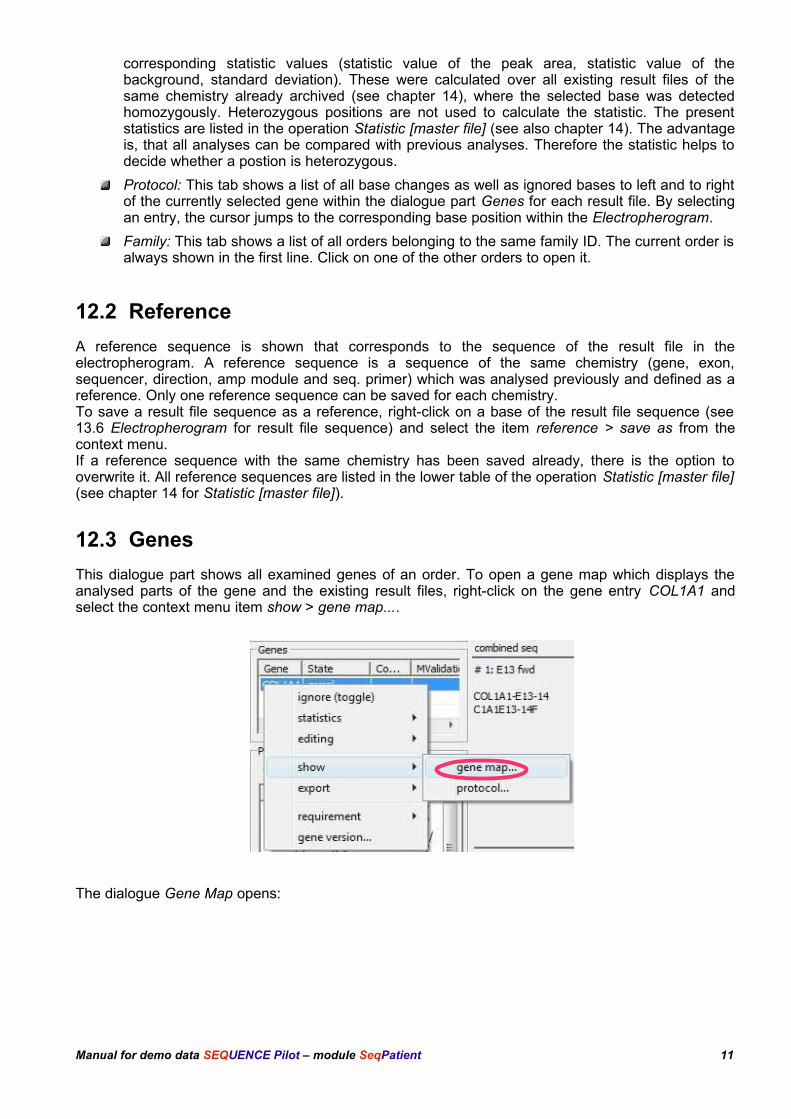
12.3 Genes
This dialogue part shows all examined genes of an order. To open a gene map which displays theanalysed parts of the gene and the existing result files, right-click on the gene entry COL1A1 andselect the context menu item show > gene map....
The dialogue Gene Map opens:
Manual for demo data SEQUENCE Pilot – module SeqPatient 11
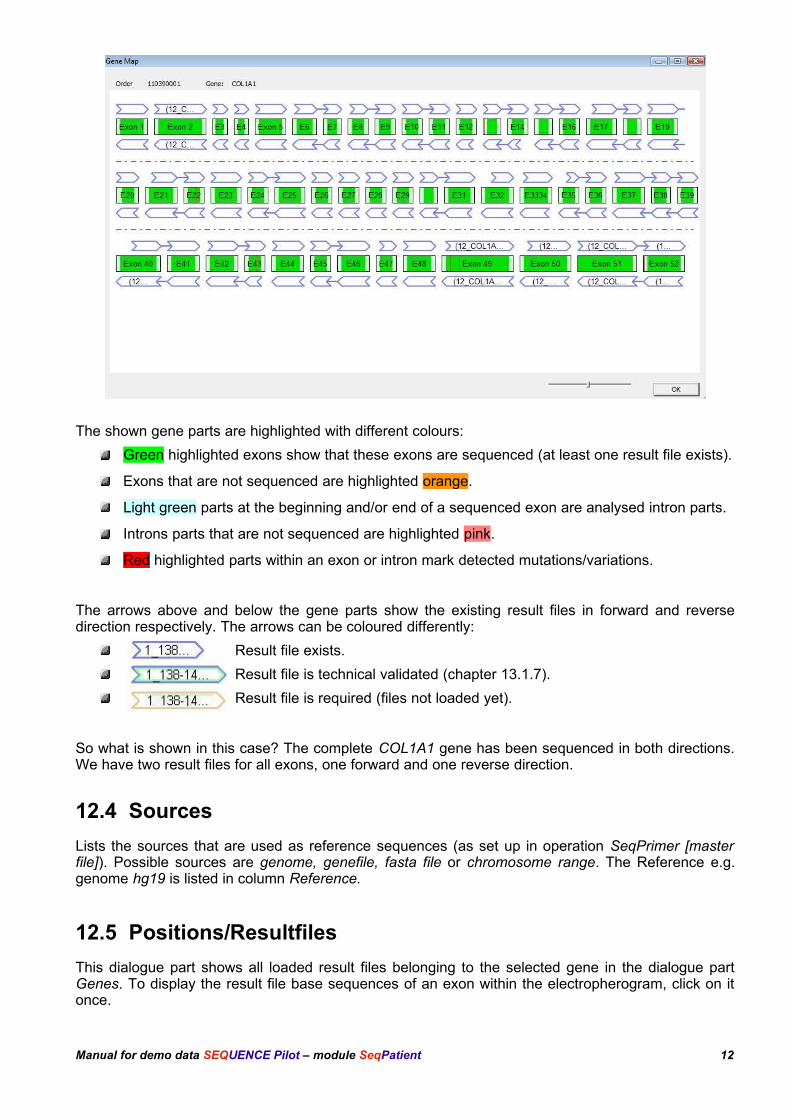
The shown gene parts are highlighted with different colours:
Green highlighted exons show that these exons are sequenced (at least one result file exists).
Exons that are not sequenced are highlighted orange.
Light green parts at the beginning and/or end of a sequenced exon are analysed intron parts.
Introns parts that are not sequenced are highlighted pink.
Red highlighted parts within an exon or intron mark detected mutations/variations.
The arrows above and below the gene parts show the existing result files in forward and reversedirection respectively. The arrows can be coloured differently:
Result file exists.
Result file is technical validated (chapter 13.1.7).
Result file is required (files not loaded yet).
So what is shown in this case? The complete COL1A1 gene has been sequenced in both directions.We have two result files for all exons, one forward and one reverse direction.
12.4 Sources
Lists the sources that are used as reference sequences (as set up in operation SeqPrimer [masterfile]). Possible sources are genome, genefile, fasta file or chromosome range. The Reference e.g.genome hg19 is listed in column Reference.
12.5 Positions/Resultfiles
This dialogue part shows all loaded result files belonging to the selected gene in the dialogue partGenes. To display the result file base sequences of an exon within the electropherogram, click on itonce.
Manual for demo data SEQUENCE Pilot – module SeqPatient 12
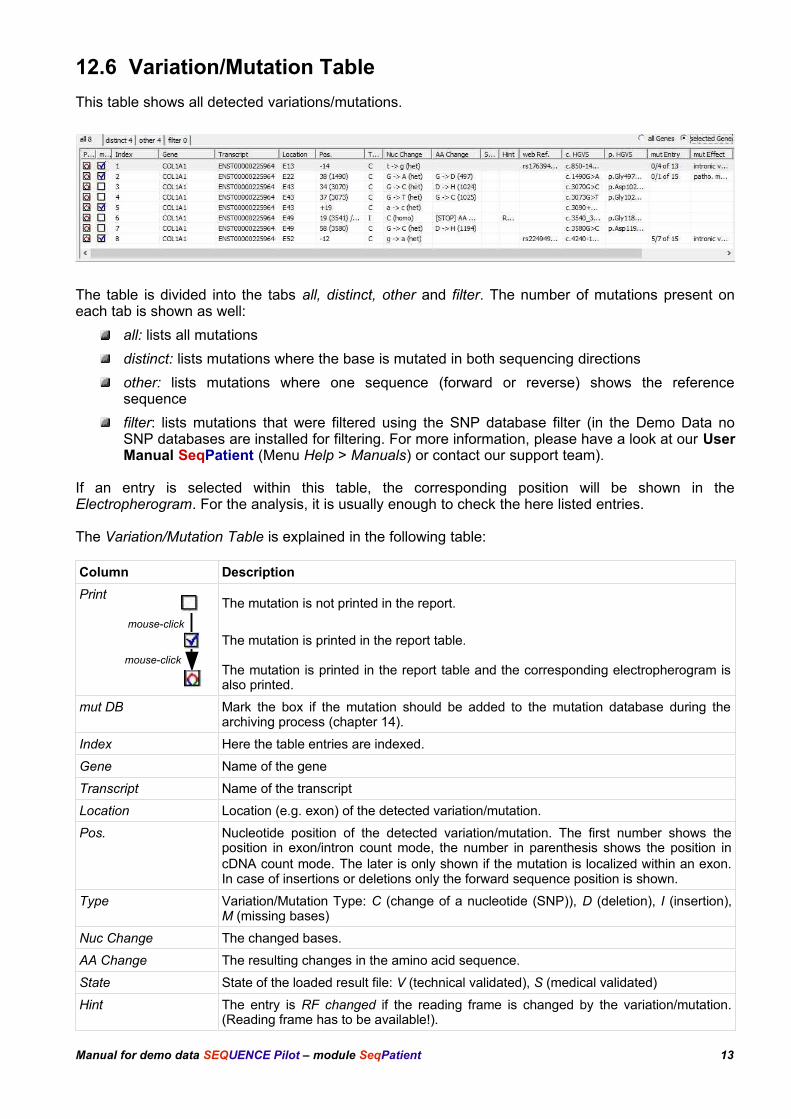
12.6 Variation/Mutation Table
This table shows all detected variations/mutations.
The table is divided into the tabs all, distinct, other and filter. The number of mutations present oneach tab is shown as well:
all: lists all mutations
distinct: lists mutations where the base is mutated in both sequencing directions
other: lists mutations where one sequence (forward or reverse) shows the referencesequence
filter: lists mutations that were filtered using the SNP database filter (in the Demo Data noSNP databases are installed for filtering. For more information, please have a look at our UserManual SeqPatient (Menu Help > Manuals) or contact our support team).
If an entry is selected within this table, the corresponding position will be shown in theElectropherogram. For the analysis, it is usually enough to check the here listed entries.
The Variation/Mutation Table is explained in the following table:
Column Description
mouse-click
mouse-click
The mutation is not printed in the report.
The mutation is printed in the report table.
The mutation is printed in the report table and the corresponding electropherogram isalso printed.
mut DB Mark the box if the mutation should be added to the mutation database during thearchiving process (chapter 14).
Index Here the table entries are indexed.
Gene Name of the gene
Transcript Name of the transcript
Location Location (e.g. exon) of the detected variation/mutation.
Pos. Nucleotide position of the detected variation/mutation. The first number shows theposition in exon/intron count mode, the number in parenthesis shows the position incDNA count mode. The later is only shown if the mutation is localized within an exon.In case of insertions or deletions only the forward sequence position is shown.
Type Variation/Mutation Type: C (change of a nucleotide (SNP)), D (deletion), I (insertion),M (missing bases)
Nuc Change The changed bases.
AA Change The resulting changes in the amino acid sequence.
State State of the loaded result file: V (technical validated), S (medical validated)
Hint The entry is RF changed if the reading frame is changed by the variation/mutation.(Reading frame has to be available!).
Manual for demo data SEQUENCE Pilot – module SeqPatient 13
web Ref. Reference index of the detected variation, if it is described in the downloaded gene file.
HGVS nomenclature Here the HGVS nomenclature for each table entry is listed.
mut Entry In case the mutation is present in the internal mutation database the column mut Entryshows the frequency (homo/hetero) of the mutation.
mut Effect If the mutation is in the mutation database and a information is entered, it will be shownin this column.
TValidation User and date of technical validation.
MValidation User and date of medical validation.
Note: In case SNP databases are installed, information from the SNP database for a mutation can beshown in additional columns (in the Demo Data no SNP databases are installed for filtering. For moreinformation, please have a look at our User Manual SeqPatient (Menu Help > Manuals) or contactour support team).
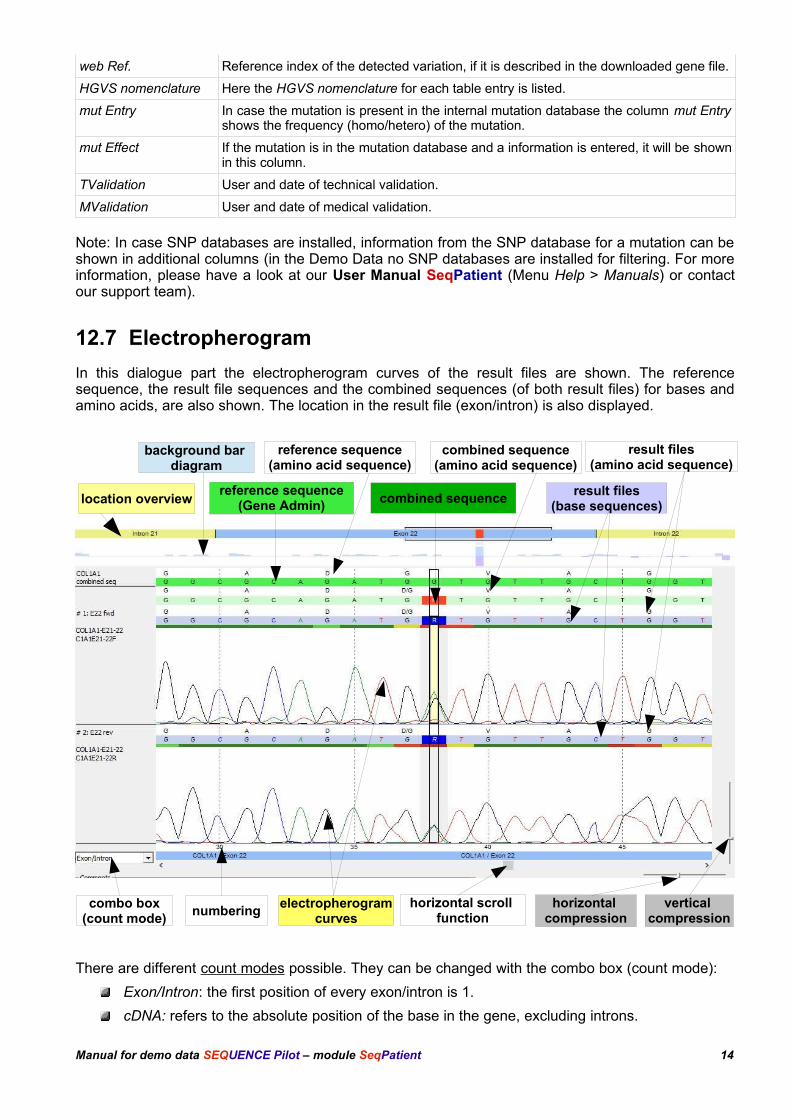
12.7 Electropherogram
In this dialogue part the electropherogram curves of the result files are shown. The referencesequence, the result file sequences and the combined sequences (of both result files) for bases andamino acids, are also shown. The location in the result file (exon/intron) is also displayed.
There are different count modes possible. They can be changed with the combo box (count mode):
Exon/Intron: the first position of every exon/intron is 1.
cDNA: refers to the absolute position of the base in the gene, excluding introns.
Manual for demo data SEQUENCE Pilot – module SeqPatient 14
vertical compression
electropherogramcurves
reference sequence(amino acid sequence)
combined sequence(amino acid sequence)
combined sequence
result files(amino acid sequence)
horizontal compression
combo box(count mode)
numbering
result files(base sequences)
reference sequence(Gene Admin)
horizontal scroll function
location overview
background bar diagram
AA: every amino acid is counted.
File: first base of the file is 1.
Gene abs: absolute position in the gene.
Genome Position: genomic position.
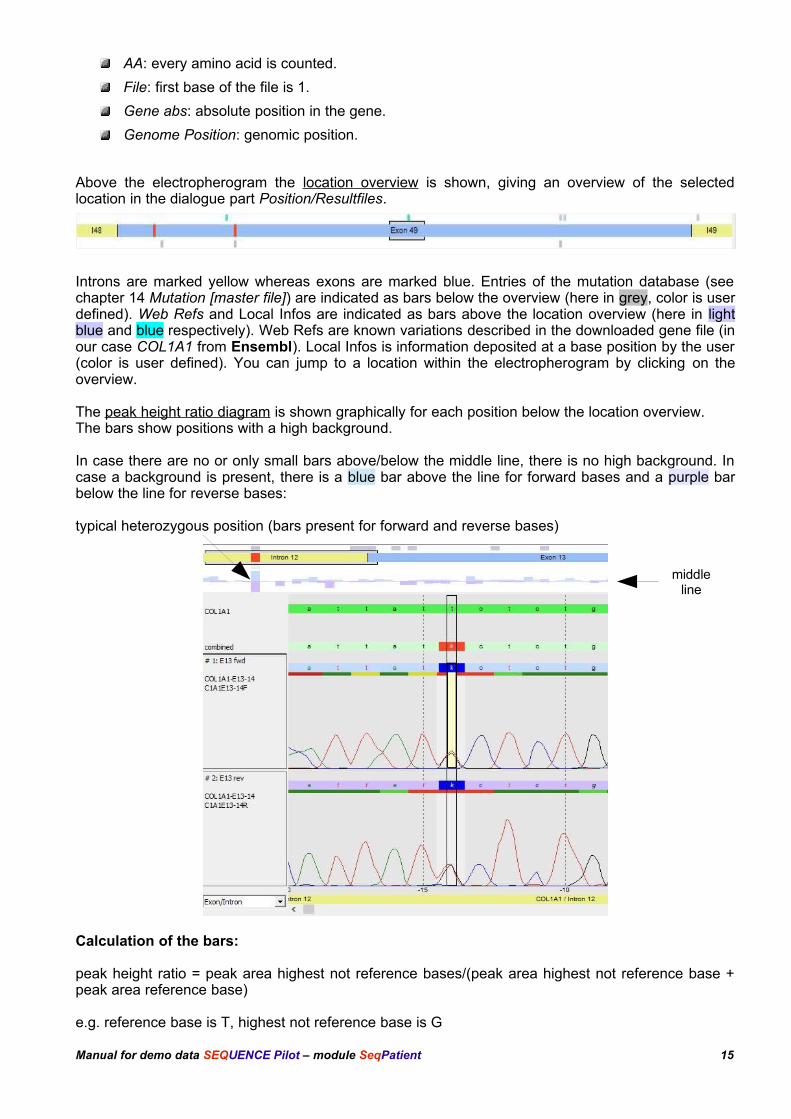
Above the electropherogram the location overview is shown, giving an overview of the selectedlocation in the dialogue part Position/Resultfiles.
Introns are marked yellow whereas exons are marked blue. Entries of the mutation database (seechapter 14 Mutation [master file]) are indicated as bars below the overview (here in grey, color is userdefined). Web Refs and Local Infos are indicated as bars above the location overview (here in lightblue and blue respectively). Web Refs are known variations described in the downloaded gene file (inour case COL1A1 from Ensembl). Local Infos is information deposited at a base position by the user(color is user defined). You can jump to a location within the electropherogram by clicking on theoverview.
The peak height ratio diagram is shown graphically for each position below the location overview. The bars show positions with a high background.
In case there are no or only small bars above/below the middle line, there is no high background. Incase a background is present, there is a blue bar above the line for forward bases and a purple barbelow the line for reverse bases:
typical heterozygous position (bars present for forward and reverse bases)
Calculation of the bars:
peak height ratio = peak area highest not reference bases/(peak area highest not reference base +peak area reference base)
e.g. reference base is T, highest not reference base is G
Manual for demo data SEQUENCE Pilot – module SeqPatient 15
middle line
peak height ratio= peak area G/ (peak area G + peak area T)The peak height ratio is shown as a bar in the graph for each base position.
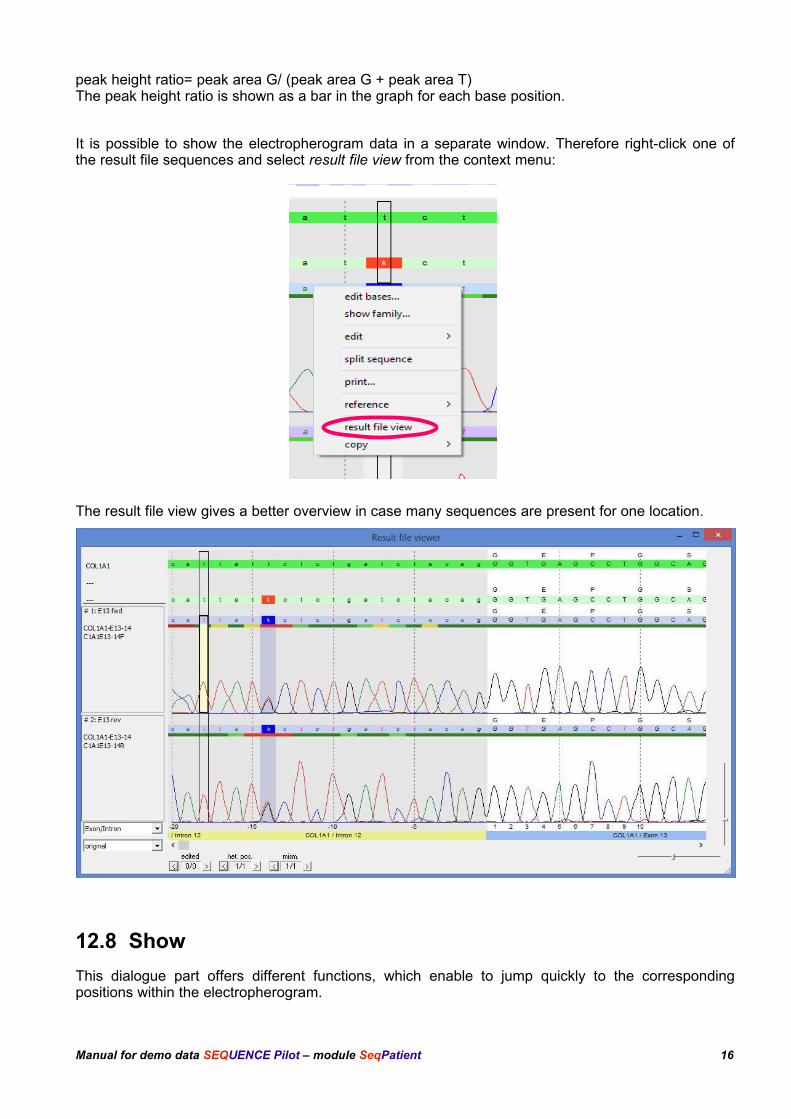
It is possible to show the electropherogram data in a separate window. Therefore right-click one ofthe result file sequences and select result file view from the context menu:
The result file view gives a better overview in case many sequences are present for one location.
12.8 Show
This dialogue part offers different functions, which enable to jump quickly to the correspondingpositions within the electropherogram.
Manual for demo data SEQUENCE Pilot – module SeqPatient 16
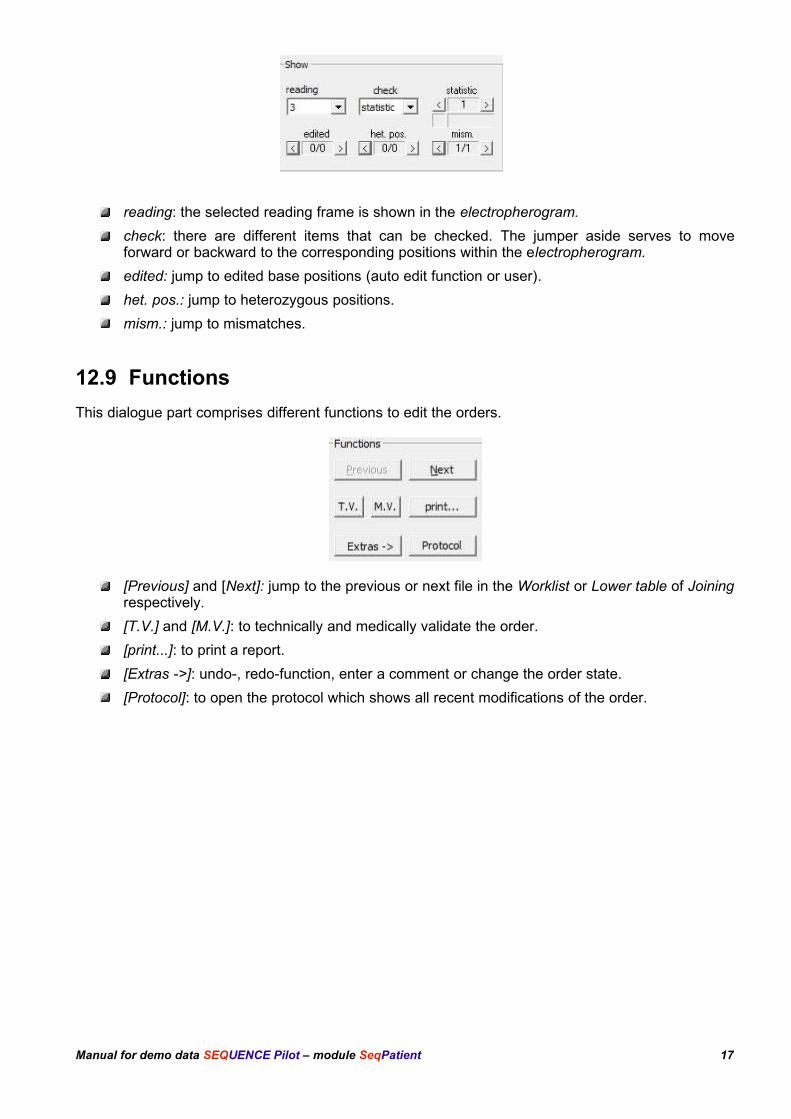
reading: the selected reading frame is shown in the electropherogram.
check: there are different items that can be checked. The jumper aside serves to moveforward or backward to the corresponding positions within the electropherogram.
edited: jump to edited base positions (auto edit function or user).
het. pos.: jump to heterozygous positions.
mism.: jump to mismatches.
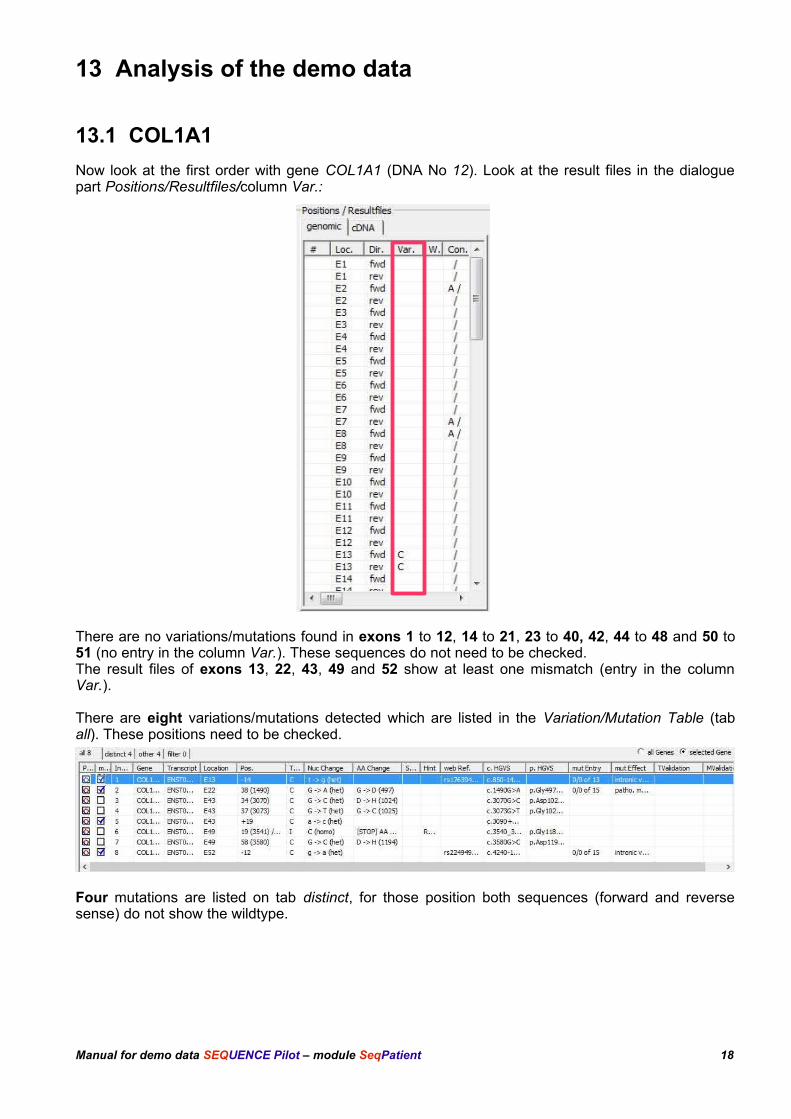
12.9 Functions
This dialogue part comprises different functions to edit the orders.
[Previous] and [Next]: jump to the previous or next file in the Worklist or Lower table of Joiningrespectively.
[T.V.] and [M.V.]: to technically and medically validate the order.
[print...]: to print a report.
[Extras ->]: undo-, redo-function, enter a comment or change the order state.
[Protocol]: to open the protocol which shows all recent modifications of the order.
Manual for demo data SEQUENCE Pilot – module SeqPatient 17
13 Analysis of the demo data
13.1 COL1A1
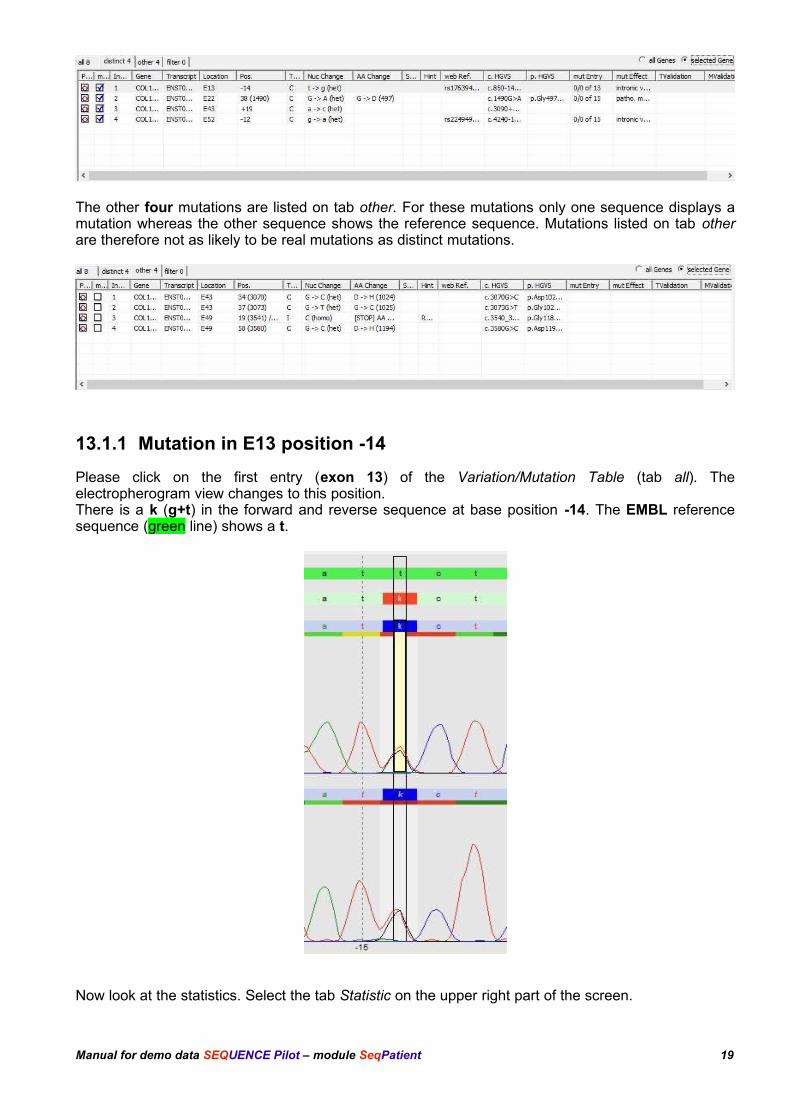
Now look at the first order with gene COL1A1 (DNA No 12). Look at the result files in the dialoguepart Positions/Resultfiles/column Var.:
There are no variations/mutations found in exons 1 to 12, 14 to 21, 23 to 40, 42, 44 to 48 and 50 to51 (no entry in the column Var.). These sequences do not need to be checked.The result files of exons 13, 22, 43, 49 and 52 show at least one mismatch (entry in the columnVar.).
There are eight variations/mutations detected which are listed in the Variation/Mutation Table (taball). These positions need to be checked.
Four mutations are listed on tab distinct, for those position both sequences (forward and reversesense) do not show the wildtype.
Manual for demo data SEQUENCE Pilot – module SeqPatient 18
The other four mutations are listed on tab other. For these mutations only one sequence displays amutation whereas the other sequence shows the reference sequence. Mutations listed on tab otherare therefore not as likely to be real mutations as distinct mutations.
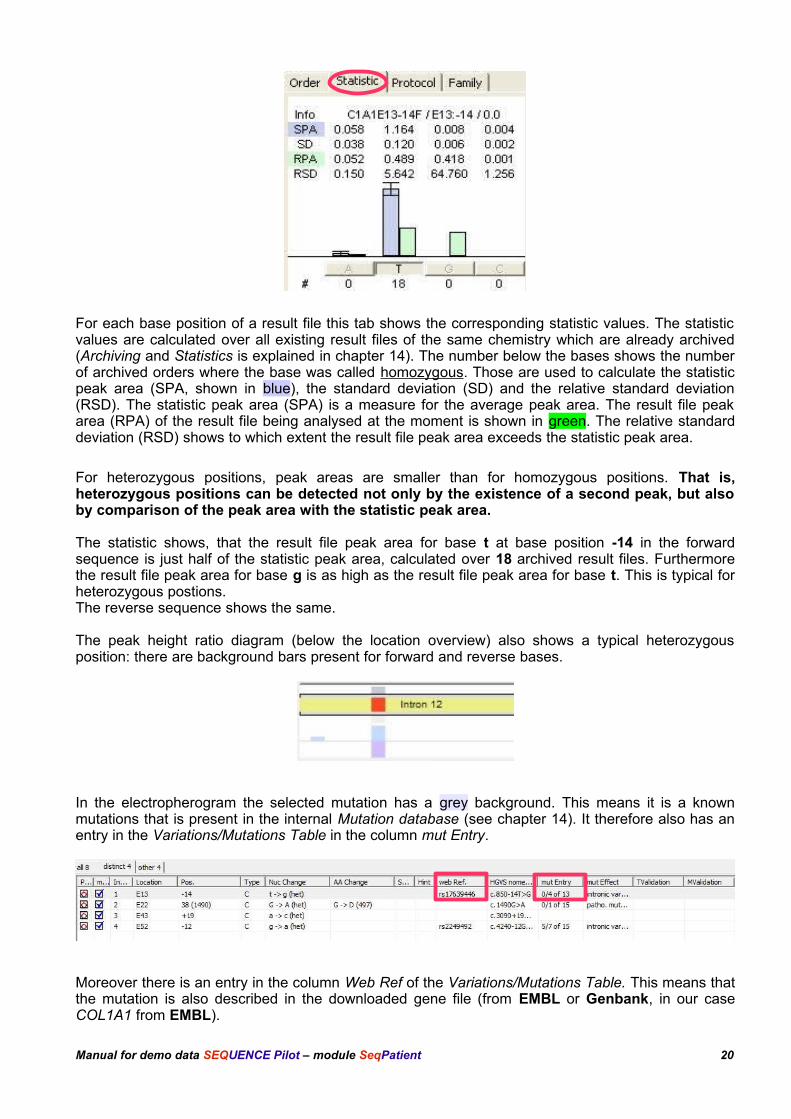
13.1.1 Mutation in E13 position -14
Please click on the first entry (exon 13) of the Variation/Mutation Table (tab all). Theelectropherogram view changes to this position. There is a k (g+t) in the forward and reverse sequence at base position -14. The EMBL referencesequence (green line) shows a t.
Now look at the statistics. Select the tab Statistic on the upper right part of the screen.
Manual for demo data SEQUENCE Pilot – module SeqPatient 19
For each base position of a result file this tab shows the corresponding statistic values. The statisticvalues are calculated over all existing result files of the same chemistry which are already archived(Archiving and Statistics is explained in chapter 14). The number below the bases shows the numberof archived orders where the base was called homozygous. Those are used to calculate the statisticpeak area (SPA, shown in blue), the standard deviation (SD) and the relative standard deviation(RSD). The statistic peak area (SPA) is a measure for the average peak area. The result file peakarea (RPA) of the result file being analysed at the moment is shown in green. The relative standarddeviation (RSD) shows to which extent the result file peak area exceeds the statistic peak area.
For heterozygous positions, peak areas are smaller than for homozygous positions. That is,heterozygous positions can be detected not only by the existence of a second peak, but alsoby comparison of the peak area with the statistic peak area.
The statistic shows, that the result file peak area for base t at base position -14 in the forwardsequence is just half of the statistic peak area, calculated over 18 archived result files. Furthermorethe result file peak area for base g is as high as the result file peak area for base t. This is typical forheterozygous postions.The reverse sequence shows the same.
The peak height ratio diagram (below the location overview) also shows a typical heterozygousposition: there are background bars present for forward and reverse bases.
In the electropherogram the selected mutation has a grey background. This means it is a knownmutations that is present in the internal Mutation database (see chapter 14). It therefore also has anentry in the Variations/Mutations Table in the column mut Entry.
Moreover there is an entry in the column Web Ref of the Variations/Mutations Table. This means thatthe mutation is also described in the downloaded gene file (from EMBL or Genbank, in our caseCOL1A1 from EMBL).
Manual for demo data SEQUENCE Pilot – module SeqPatient 20
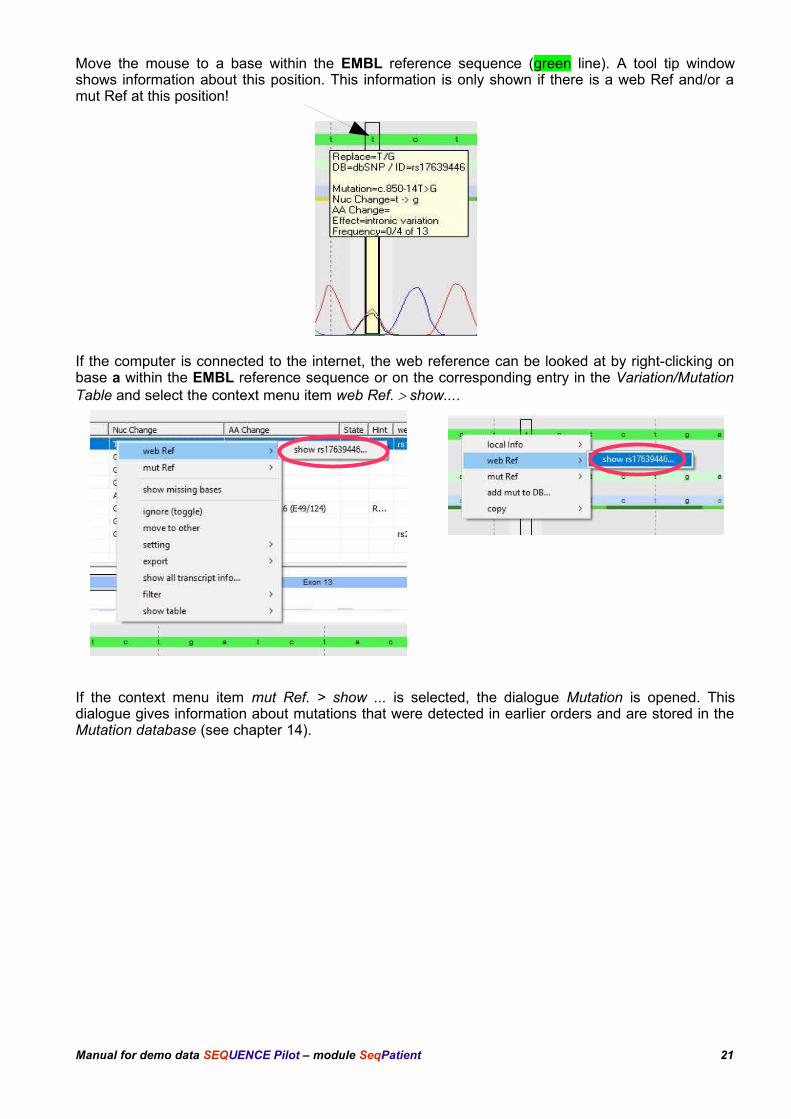
Move the mouse to a base within the EMBL reference sequence (green line). A tool tip windowshows information about this position. This information is only shown if there is a web Ref and/or amut Ref at this position!
If the computer is connected to the internet, the web reference can be looked at by right-clicking onbase a within the EMBL reference sequence or on the corresponding entry in the Variation/MutationTable and select the context menu item web Ref. > show....
If the context menu item mut Ref. > show ... is selected, the dialogue Mutation is opened. Thisdialogue gives information about mutations that were detected in earlier orders and are stored in theMutation database (see chapter 14).
Manual for demo data SEQUENCE Pilot – module SeqPatient 21
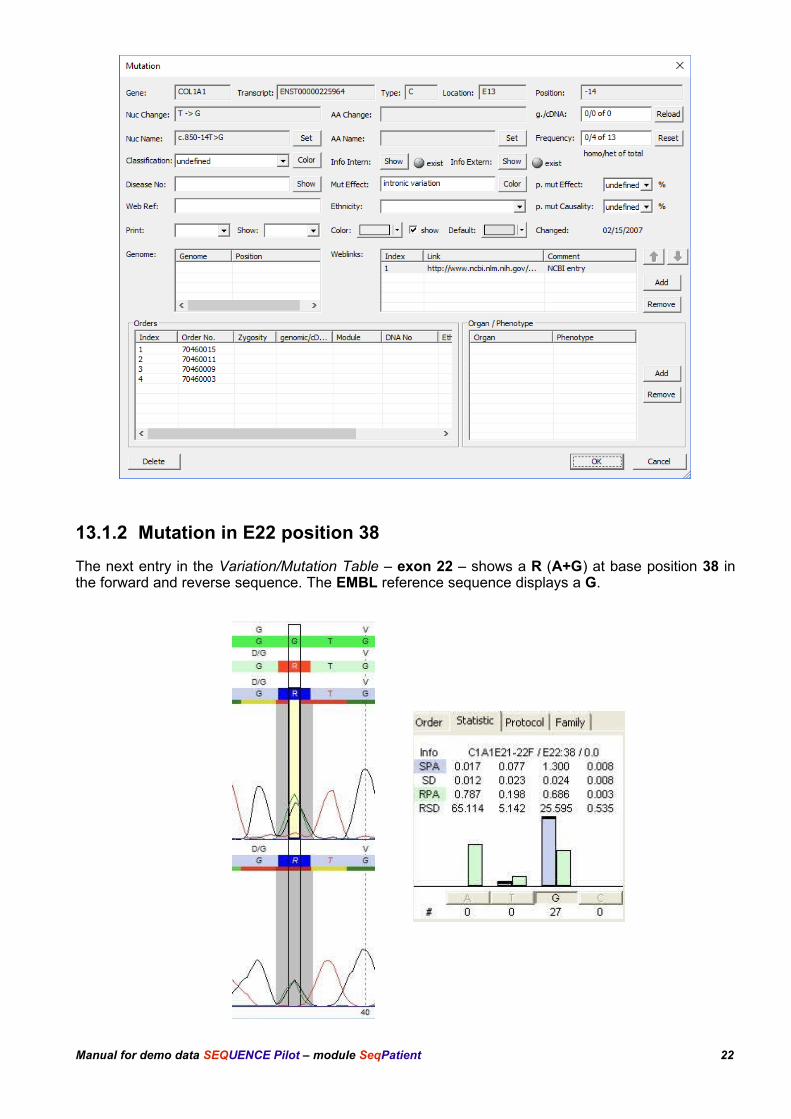
13.1.2 Mutation in E22 position 38
The next entry in the Variation/Mutation Table – exon 22 – shows a R (A+G) at base position 38 inthe forward and reverse sequence. The EMBL reference sequence displays a G.
Manual for demo data SEQUENCE Pilot – module SeqPatient 22
The statistic shows that the result file peak area for base G in the forward sequence is just half of thestatistic peak area, calculated over 27 archived result files. Furthermore the result file peak area forbase A is as high as the result file base area for base G. The reverse sequence shows the same. This is a true heterozygous position (R).
In the electropherogram the mutation has a grey background. This shows, that there is a mutationreference at that position. This can also be seen in the column mut Ref. of the Variation/MutationTable. For detailed descriptions see chapter 13.1.1.
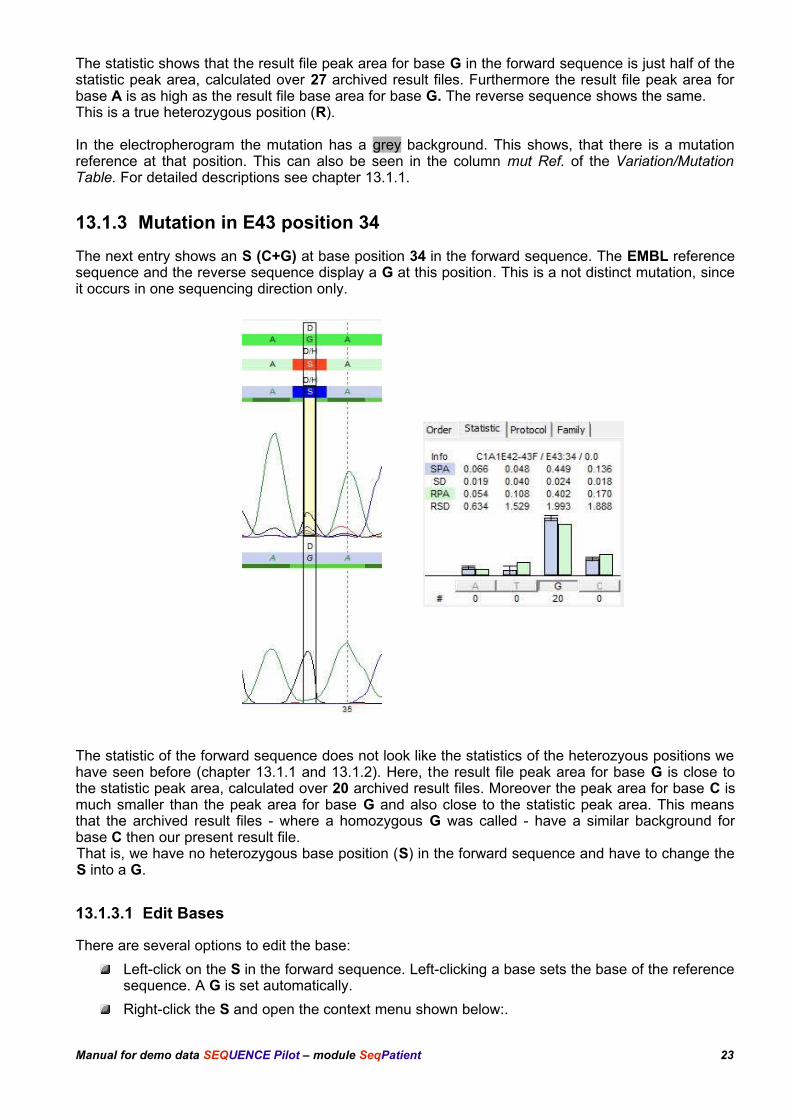
13.1.3 Mutation in E43 position 34
The next entry shows an S (C+G) at base position 34 in the forward sequence. The EMBL referencesequence and the reverse sequence display a G at this position. This is a not distinct mutation, sinceit occurs in one sequencing direction only.
The statistic of the forward sequence does not look like the statistics of the heterozyous positions wehave seen before (chapter 13.1.1 and 13.1.2). Here, the result file peak area for base G is close tothe statistic peak area, calculated over 20 archived result files. Moreover the peak area for base C ismuch smaller than the peak area for base G and also close to the statistic peak area. This meansthat the archived result files - where a homozygous G was called - have a similar background forbase C then our present result file. That is, we have no heterozygous base position (S) in the forward sequence and have to change theS into a G.
13.1.3.1 Edit Bases
There are several options to edit the base:
Left-click on the S in the forward sequence. Left-clicking a base sets the base of the referencesequence. A G is set automatically.
Right-click the S and open the context menu shown below:.
Manual for demo data SEQUENCE Pilot – module SeqPatient 23
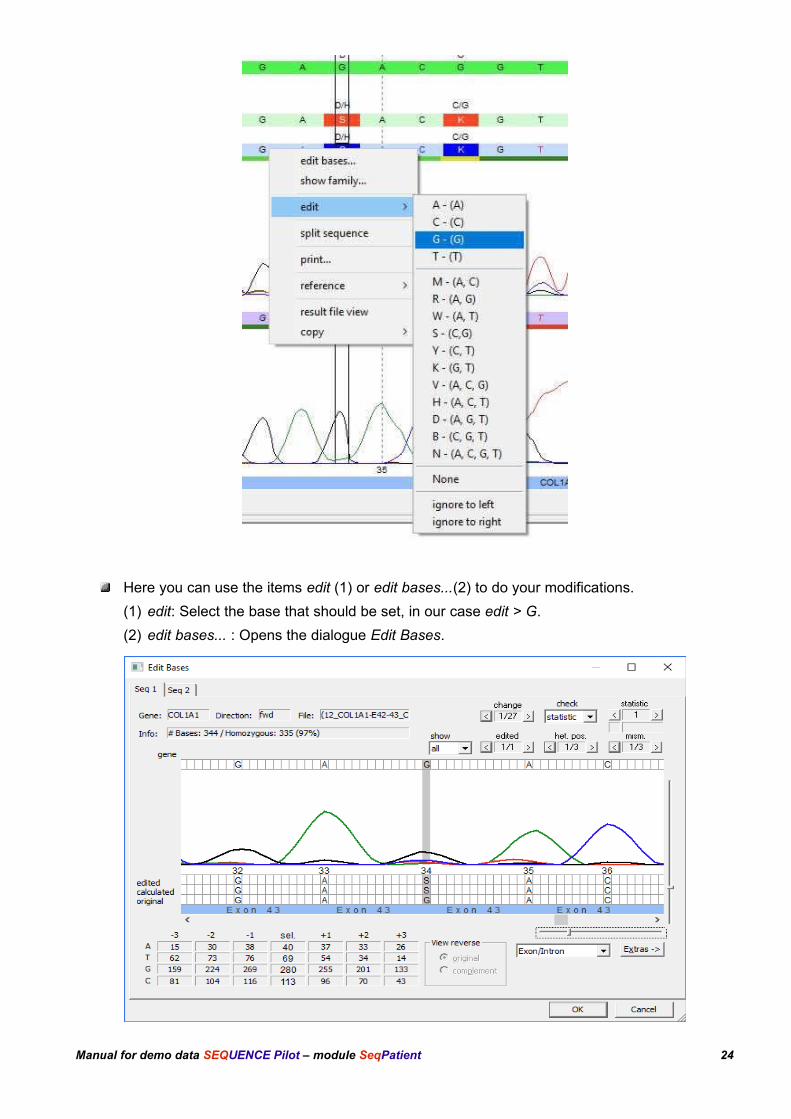
Here you can use the items edit (1) or edit bases...(2) to do your modifications.
(1) edit: Select the base that should be set, in our case edit > G.
(2) edit bases... : Opens the dialogue Edit Bases.
Manual for demo data SEQUENCE Pilot – module SeqPatient 24
To set a G at base position 34 right-click on it within the edited line and select G from the context menu. Then press [OK].
The Mutation in E43 at position 34 disappears in the Variation/Mutation Table.
13.1.3.2 Undo Function
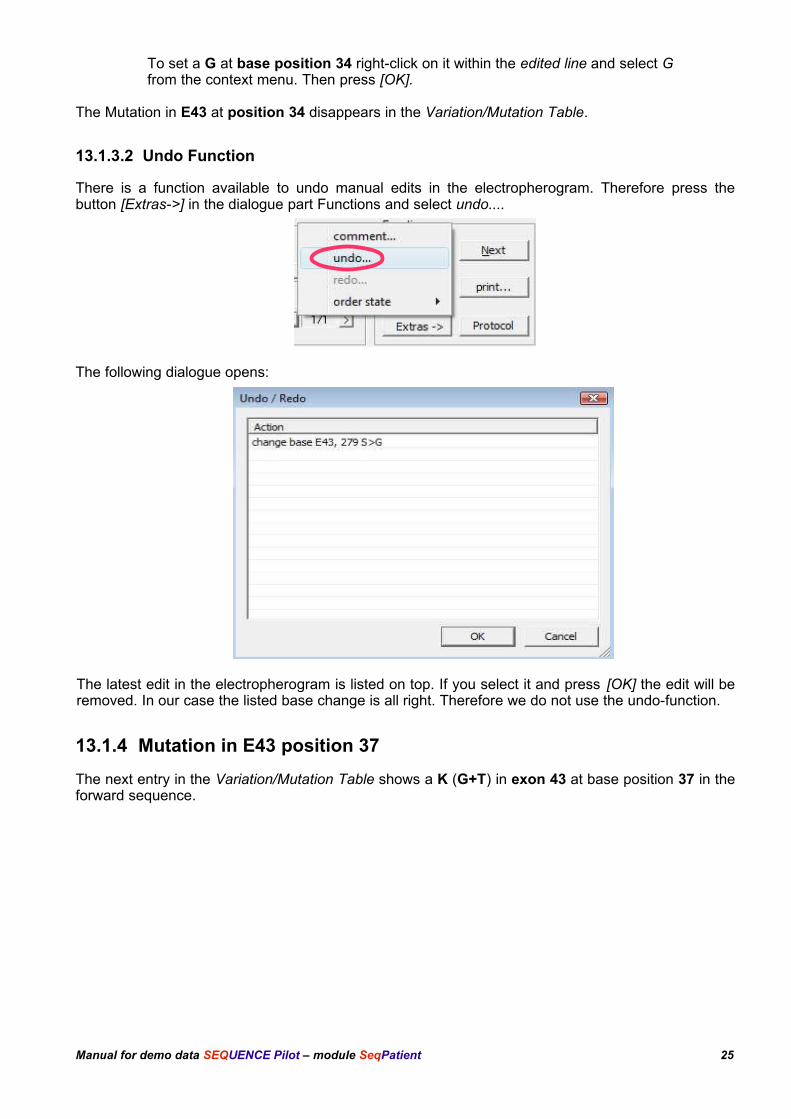
There is a function available to undo manual edits in the electropherogram. Therefore press thebutton [Extras->] in the dialogue part Functions and select undo....
The following dialogue opens:
The latest edit in the electropherogram is listed on top. If you select it and press [OK] the edit will beremoved. In our case the listed base change is all right. Therefore we do not use the undo-function.
13.1.4 Mutation in E43 position 37
The next entry in the Variation/Mutation Table shows a K (G+T) in exon 43 at base position 37 in theforward sequence.
Manual for demo data SEQUENCE Pilot – module SeqPatient 25
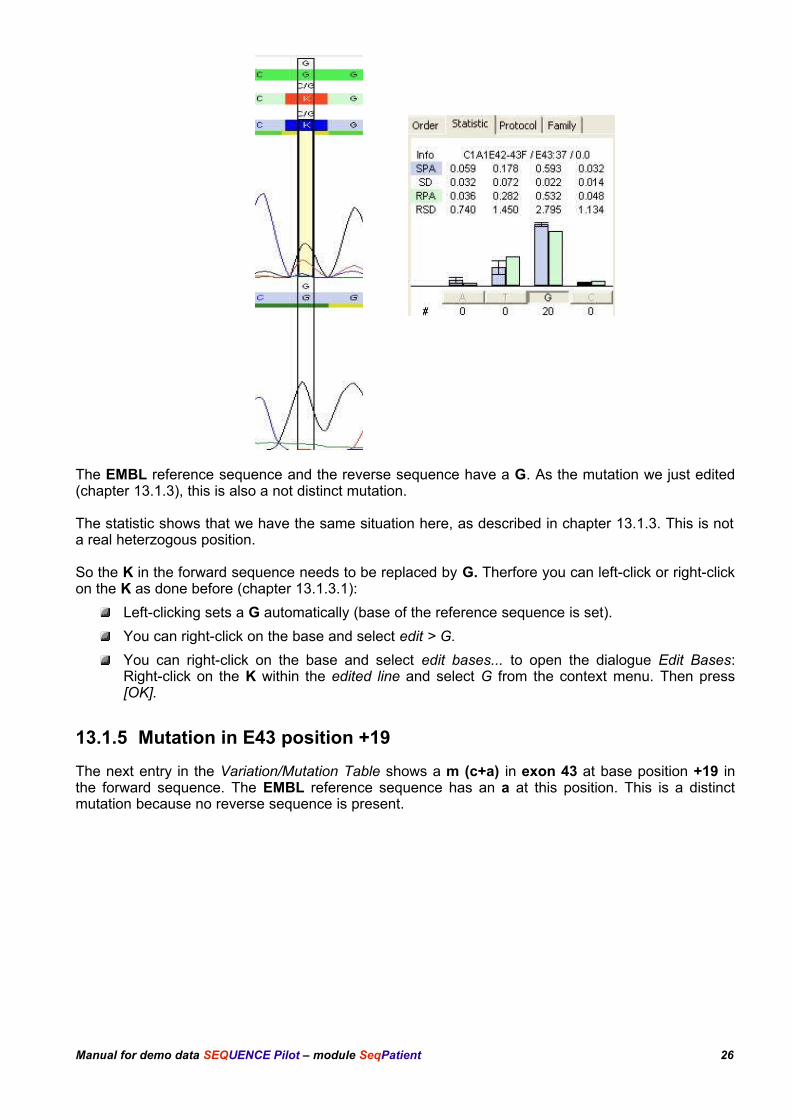
The EMBL reference sequence and the reverse sequence have a G. As the mutation we just edited(chapter 13.1.3), this is also a not distinct mutation.
The statistic shows that we have the same situation here, as described in chapter 13.1.3. This is nota real heterzogous position.
So the K in the forward sequence needs to be replaced by G. Therfore you can left-click or right-clickon the K as done before (chapter 13.1.3.1):
Left-clicking sets a G automatically (base of the reference sequence is set).
You can right-click on the base and select edit > G.
You can right-click on the base and select edit bases... to open the dialogue Edit Bases:Right-click on the K within the edited line and select G from the context menu. Then press[OK].
13.1.5 Mutation in E43 position +19
The next entry in the Variation/Mutation Table shows a m (c+a) in exon 43 at base position +19 inthe forward sequence. The EMBL reference sequence has an a at this position. This is a distinctmutation because no reverse sequence is present.
Manual for demo data SEQUENCE Pilot – module SeqPatient 26
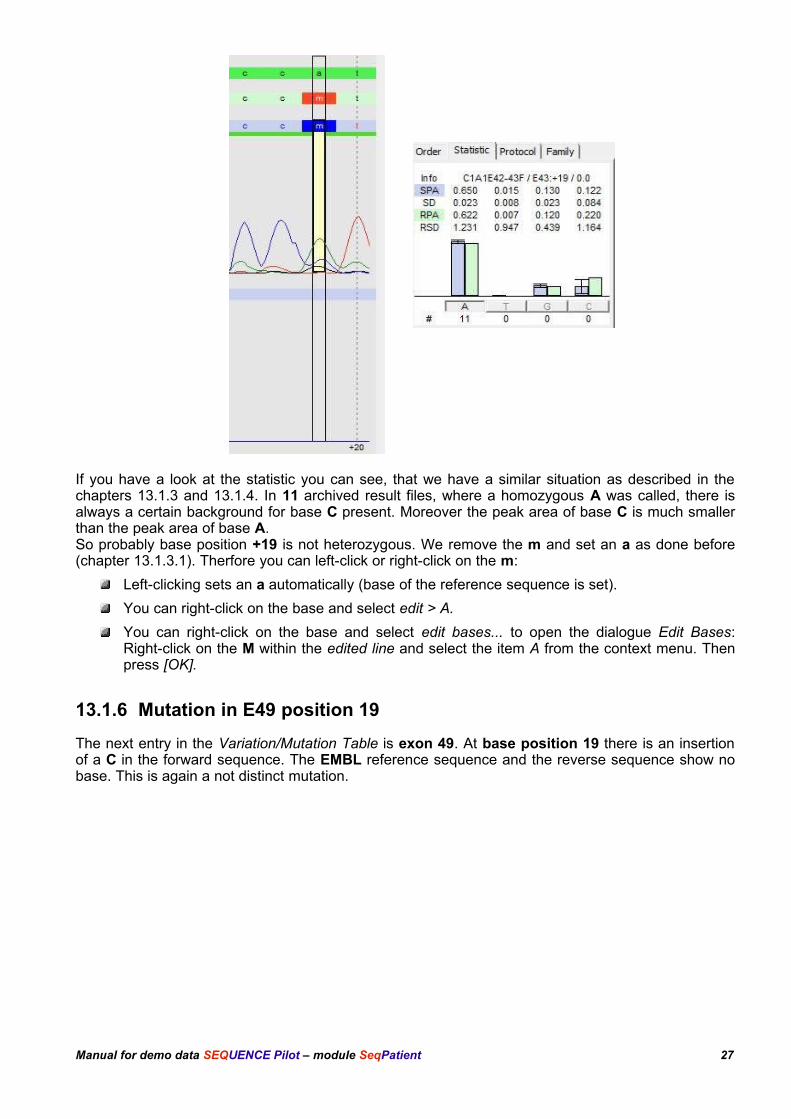
If you have a look at the statistic you can see, that we have a similar situation as described in thechapters 13.1.3 and 13.1.4. In 11 archived result files, where a homozygous A was called, there isalways a certain background for base C present. Moreover the peak area of base C is much smallerthan the peak area of base A.So probably base position +19 is not heterozygous. We remove the m and set an a as done before(chapter 13.1.3.1). Therfore you can left-click or right-click on the m:
Left-clicking sets an a automatically (base of the reference sequence is set).
You can right-click on the base and select edit > A.
You can right-click on the base and select edit bases... to open the dialogue Edit Bases:Right-click on the M within the edited line and select the item A from the context menu. Thenpress [OK].
13.1.6 Mutation in E49 position 19
The next entry in the Variation/Mutation Table is exon 49. At base position 19 there is an insertionof a C in the forward sequence. The EMBL reference sequence and the reverse sequence show nobase. This is again a not distinct mutation.
Manual for demo data SEQUENCE Pilot – module SeqPatient 27
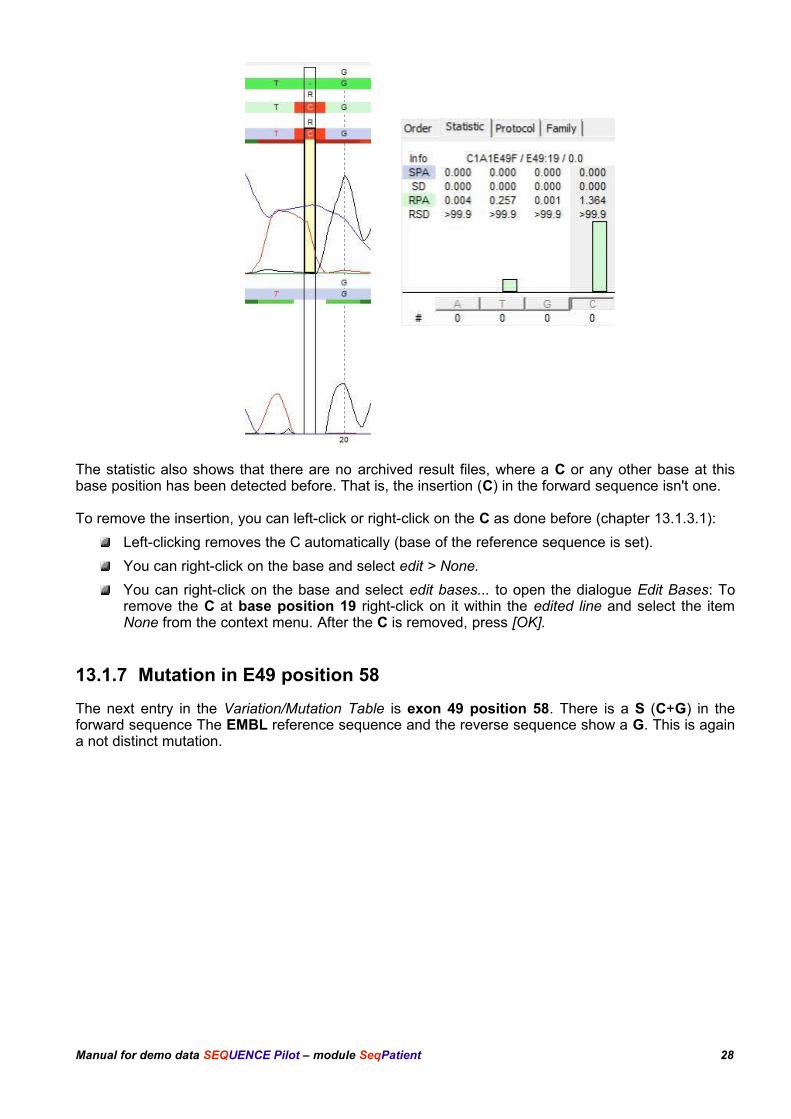
The statistic also shows that there are no archived result files, where a C or any other base at thisbase position has been detected before. That is, the insertion (C) in the forward sequence isn't one.
To remove the insertion, you can left-click or right-click on the C as done before (chapter 13.1.3.1):
Left-clicking removes the C automatically (base of the reference sequence is set).
You can right-click on the base and select edit > None.
You can right-click on the base and select edit bases... to open the dialogue Edit Bases: Toremove the C at base position 19 right-click on it within the edited line and select the itemNone from the context menu. After the C is removed, press [OK].
13.1.7 Mutation in E49 position 58
The next entry in the Variation/Mutation Table is exon 49 position 58. There is a S (C+G) in theforward sequence The EMBL reference sequence and the reverse sequence show a G. This is againa not distinct mutation.
Manual for demo data SEQUENCE Pilot – module SeqPatient 28
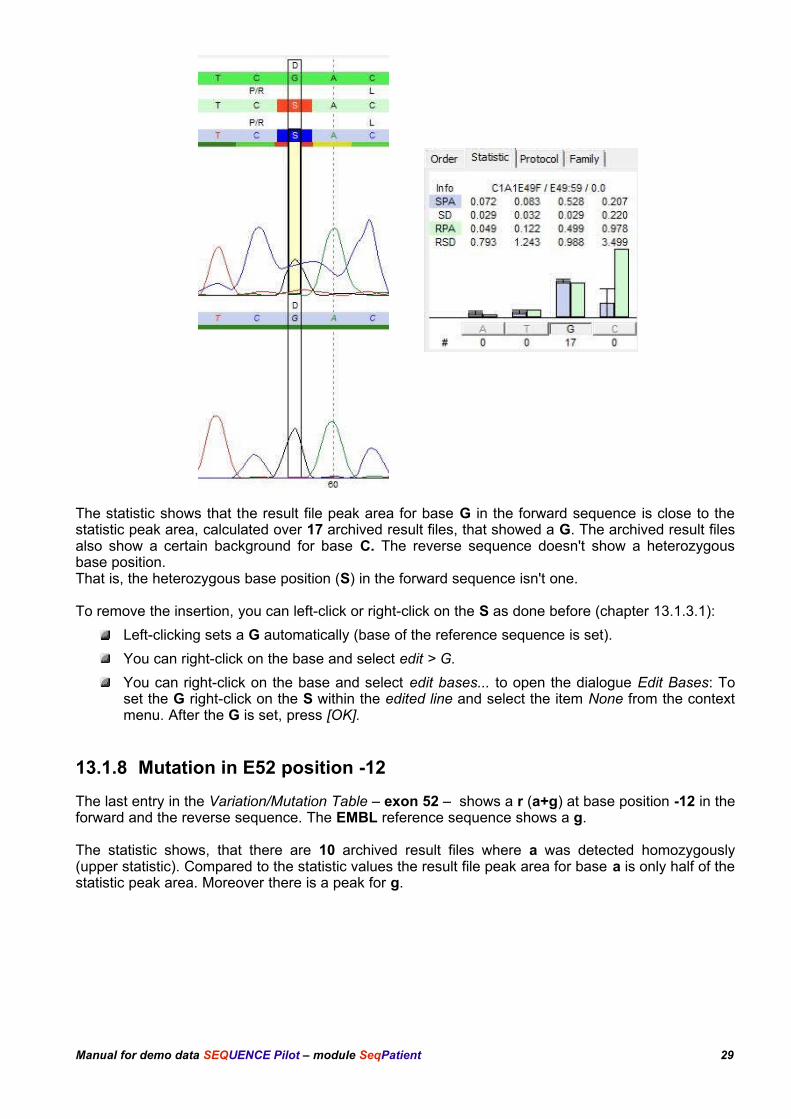
The statistic shows that the result file peak area for base G in the forward sequence is close to thestatistic peak area, calculated over 17 archived result files, that showed a G. The archived result filesalso show a certain background for base C. The reverse sequence doesn't show a heterozygousbase position. That is, the heterozygous base position (S) in the forward sequence isn't one.
To remove the insertion, you can left-click or right-click on the S as done before (chapter 13.1.3.1):
Left-clicking sets a G automatically (base of the reference sequence is set).
You can right-click on the base and select edit > G.
You can right-click on the base and select edit bases... to open the dialogue Edit Bases: Toset the G right-click on the S within the edited line and select the item None from the contextmenu. After the G is set, press [OK].
13.1.8 Mutation in E52 position -12
The last entry in the Variation/Mutation Table – exon 52 – shows a r (a+g) at base position -12 in theforward and the reverse sequence. The EMBL reference sequence shows a g.
The statistic shows, that there are 10 archived result files where a was detected homozygously(upper statistic). Compared to the statistic values the result file peak area for base a is only half of thestatistic peak area. Moreover there is a peak for g.
Manual for demo data SEQUENCE Pilot – module SeqPatient 29
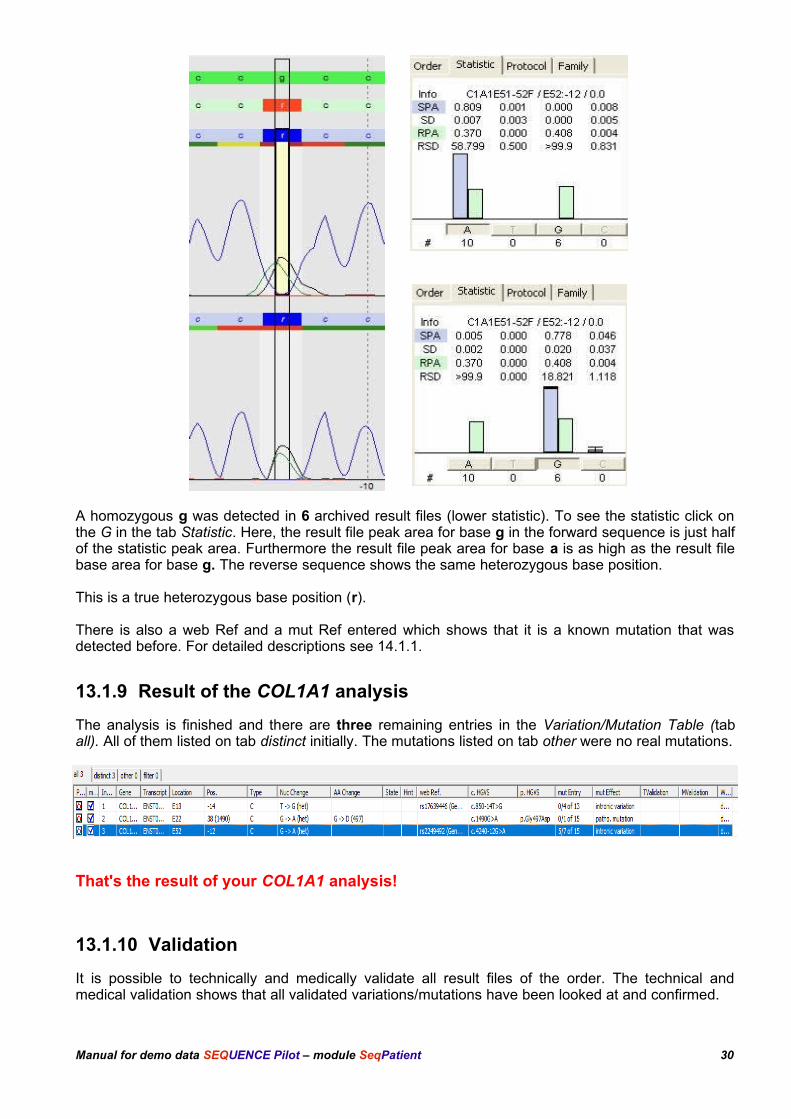
A homozygous g was detected in 6 archived result files (lower statistic). To see the statistic click onthe G in the tab Statistic. Here, the result file peak area for base g in the forward sequence is just halfof the statistic peak area. Furthermore the result file peak area for base a is as high as the result filebase area for base g. The reverse sequence shows the same heterozygous base position.
This is a true heterozygous base position (r).
There is also a web Ref and a mut Ref entered which shows that it is a known mutation that wasdetected before. For detailed descriptions see 14.1.1.
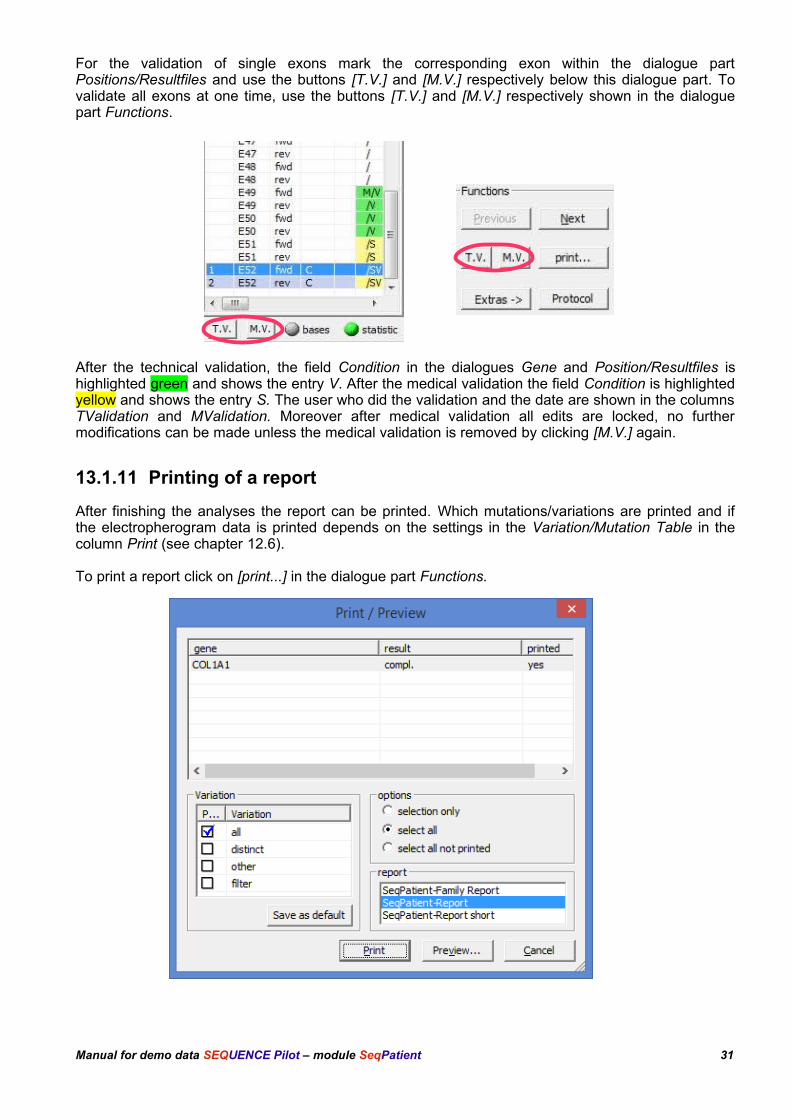
13.1.9 Result of the COL1A1 analysis
The analysis is finished and there are three remaining entries in the Variation/Mutation Table (taball). All of them listed on tab distinct initially. The mutations listed on tab other were no real mutations.
That's the result of your COL1A1 analysis!
13.1.10 Validation
It is possible to technically and medically validate all result files of the order. The technical andmedical validation shows that all validated variations/mutations have been looked at and confirmed.
Manual for demo data SEQUENCE Pilot – module SeqPatient 30
For the validation of single exons mark the corresponding exon within the dialogue partPositions/Resultfiles and use the buttons [T.V.] and [M.V.] respectively below this dialogue part. Tovalidate all exons at one time, use the buttons [T.V.] and [M.V.] respectively shown in the dialoguepart Functions.
After the technical validation, the field Condition in the dialogues Gene and Position/Resultfiles ishighlighted green and shows the entry V. After the medical validation the field Condition is highlightedyellow and shows the entry S. The user who did the validation and the date are shown in the columnsTValidation and MValidation. Moreover after medical validation all edits are locked, no furthermodifications can be made unless the medical validation is removed by clicking [M.V.] again.
13.1.11 Printing of a report
After finishing the analyses the report can be printed. Which mutations/variations are printed and ifthe electropherogram data is printed depends on the settings in the Variation/Mutation Table in thecolumn Print (see chapter 12.6).
To print a report click on [print...] in the dialogue part Functions.
Manual for demo data SEQUENCE Pilot – module SeqPatient 31
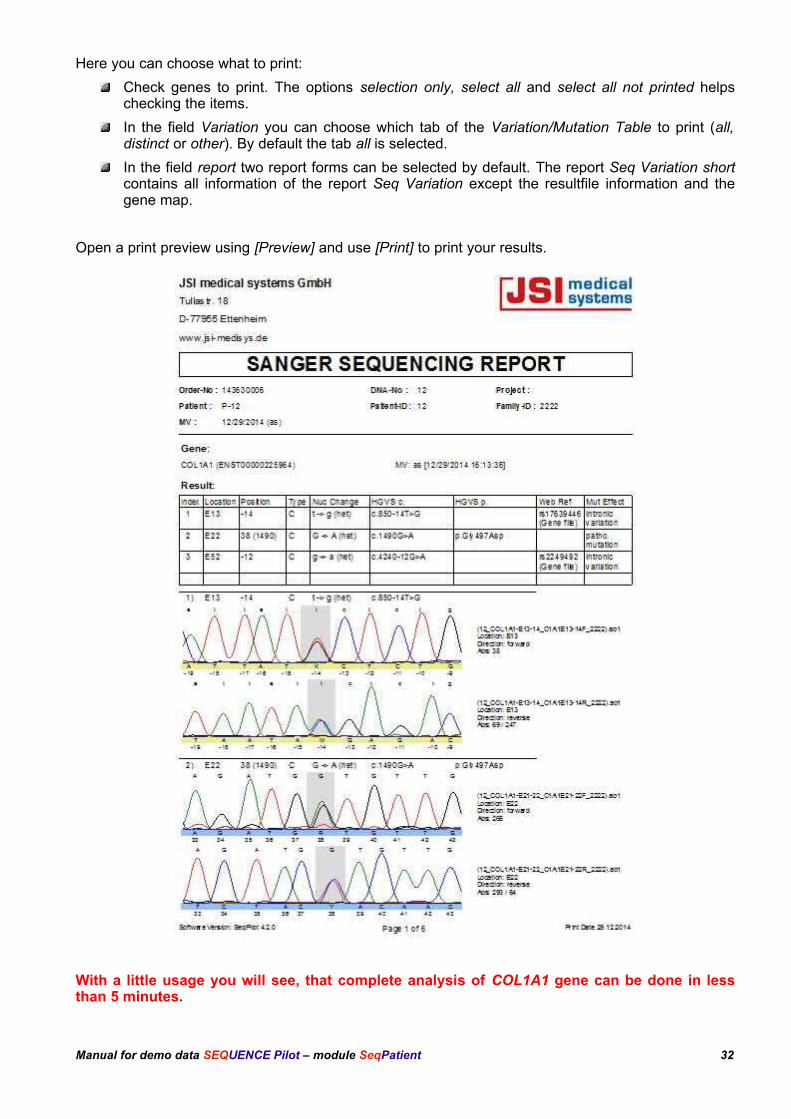
Here you can choose what to print:
Check genes to print. The options selection only, select all and select all not printed helpschecking the items.
In the field Variation you can choose which tab of the Variation/Mutation Table to print (all,distinct or other). By default the tab all is selected.
In the field report two report forms can be selected by default. The report Seq Variation shortcontains all information of the report Seq Variation except the resultfile information and thegene map.
Open a print preview using [Preview] and use [Print] to print your results.
With a little usage you will see, that complete analysis of COL1A1 gene can be done in lessthan 5 minutes.
Manual for demo data SEQUENCE Pilot – module SeqPatient 32
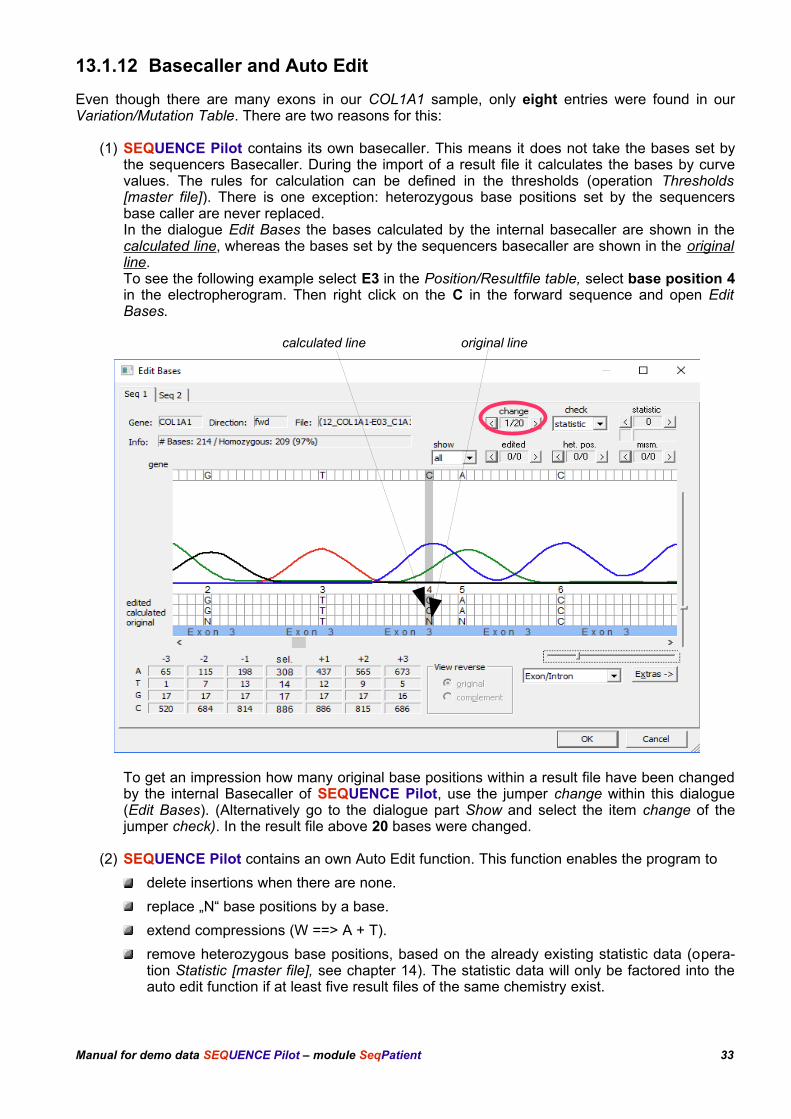
13.1.12 Basecaller and Auto Edit
Even though there are many exons in our COL1A1 sample, only eight entries were found in ourVariation/Mutation Table. There are two reasons for this:
(1) SEQUENCE Pilot contains its own basecaller. This means it does not take the bases set bythe sequencers Basecaller. During the import of a result file it calculates the bases by curvevalues. The rules for calculation can be defined in the thresholds (operation Thresholds[master file]). There is one exception: heterozygous base positions set by the sequencersbase caller are never replaced.In the dialogue Edit Bases the bases calculated by the internal basecaller are shown in thecalculated line, whereas the bases set by the sequencers basecaller are shown in the originalline.To see the following example select E3 in the Position/Resultfile table, select base position 4in the electropherogram. Then right click on the C in the forward sequence and open EditBases.
calculated line original line
To get an impression how many original base positions within a result file have been changedby the internal Basecaller of SEQUENCE Pilot, use the jumper change within this dialogue(Edit Bases). (Alternatively go to the dialogue part Show and select the item change of thejumper check). In the result file above 20 bases were changed.
(2) SEQUENCE Pilot contains an own Auto Edit function. This function enables the program to
delete insertions when there are none.
replace „N“ base positions by a base.
extend compressions (W ==> A + T).
remove heterozygous base positions, based on the already existing statistic data (opera-tion Statistic [master file], see chapter 14). The statistic data will only be factored into theauto edit function if at least five result files of the same chemistry exist.
Manual for demo data SEQUENCE Pilot – module SeqPatient 33
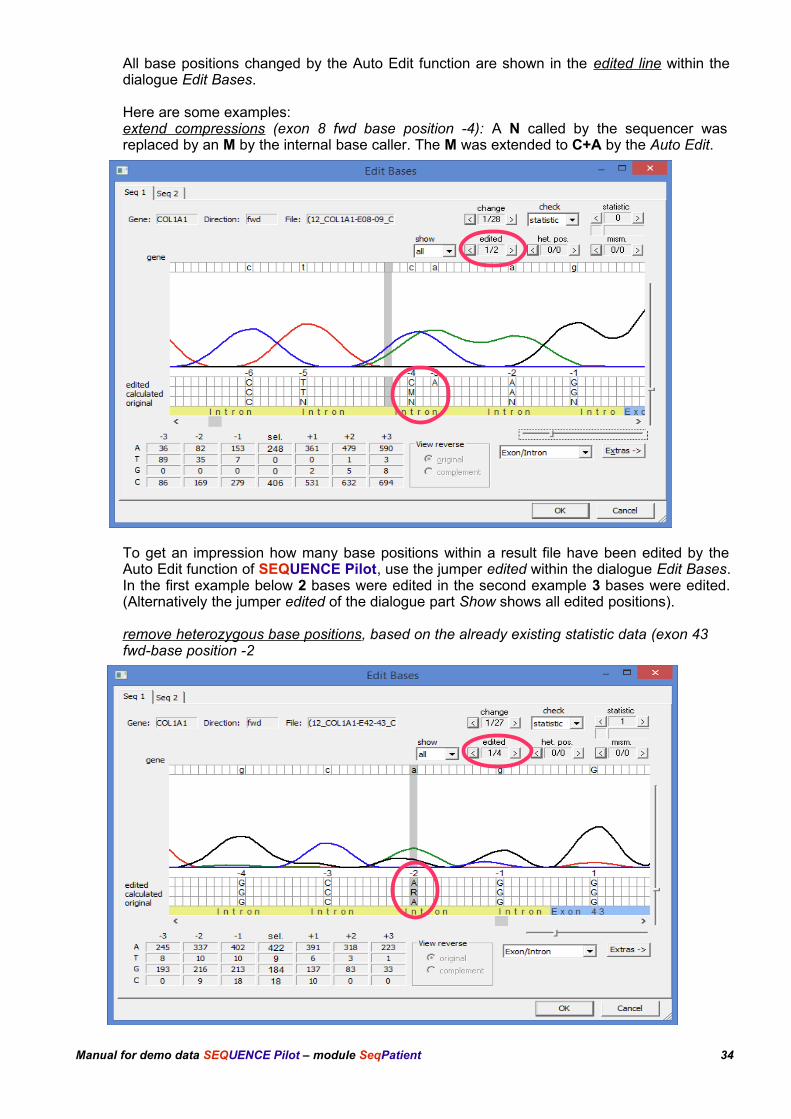
All base positions changed by the Auto Edit function are shown in the edited line within the dialogue Edit Bases.
Here are some examples:extend compressions (exon 8 fwd base position -4): A N called by the sequencer was replaced by an M by the internal base caller. The M was extended to C+A by the Auto Edit.
To get an impression how many base positions within a result file have been edited by the Auto Edit function of SEQUENCE Pilot, use the jumper edited within the dialogue Edit Bases. In the first example below 2 bases were edited in the second example 3 bases were edited. (Alternatively the jumper edited of the dialogue part Show shows all edited positions).
remove heterozygous base positions, based on the already existing statistic data (exon 43 fwd-base position -2
Manual for demo data SEQUENCE Pilot – module SeqPatient 34
By default the auto edit is activated. If desired it can be deactivated.
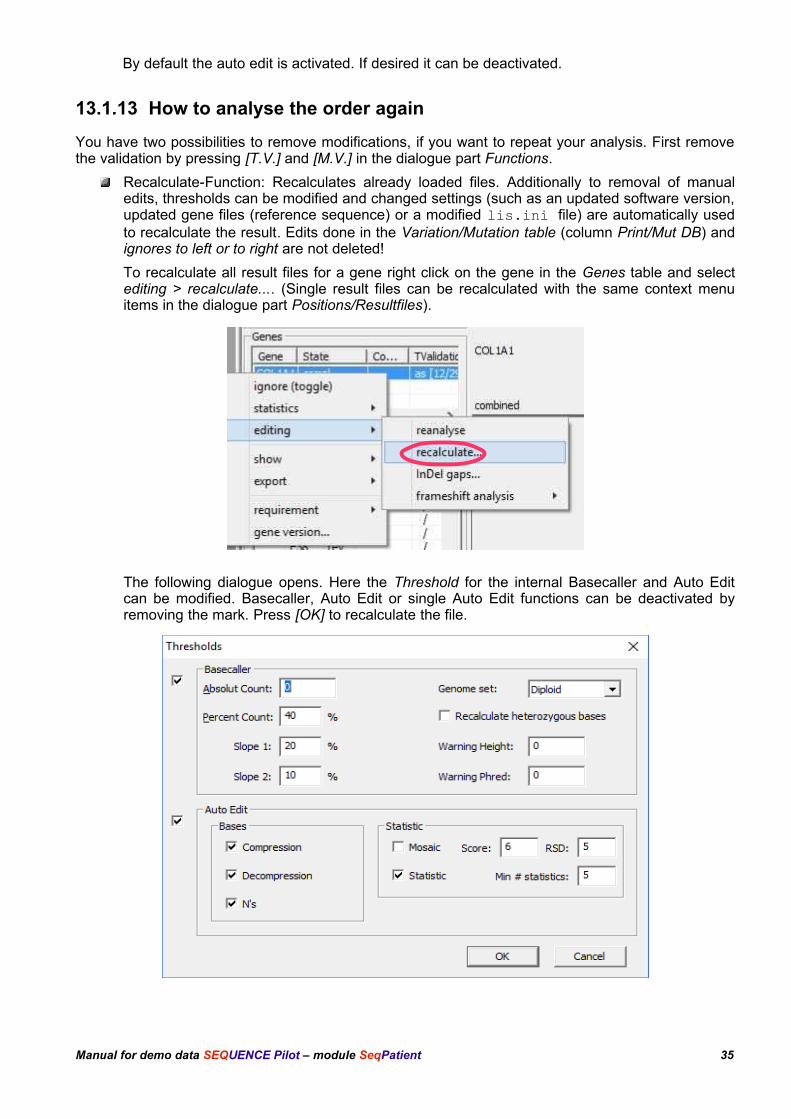
13.1.13 How to analyse the order again
You have two possibilities to remove modifications, if you want to repeat your analysis. First removethe validation by pressing [T.V.] and [M.V.] in the dialogue part Functions.
Recalculate-Function: Recalculates already loaded files. Additionally to removal of manualedits, thresholds can be modified and changed settings (such as an updated software version,updated gene files (reference sequence) or a modified lis.ini file) are automatically usedto recalculate the result. Edits done in the Variation/Mutation table (column Print/Mut DB) andignores to left or to right are not deleted!
To recalculate all result files for a gene right click on the gene in the Genes table and selectediting > recalculate.... (Single result files can be recalculated with the same context menuitems in the dialogue part Positions/Resultfiles).
The following dialogue opens. Here the Threshold for the internal Basecaller and Auto Editcan be modified. Basecaller, Auto Edit or single Auto Edit functions can be deactivated byremoving the mark. Press [OK] to recalculate the file.
Manual for demo data SEQUENCE Pilot – module SeqPatient 35
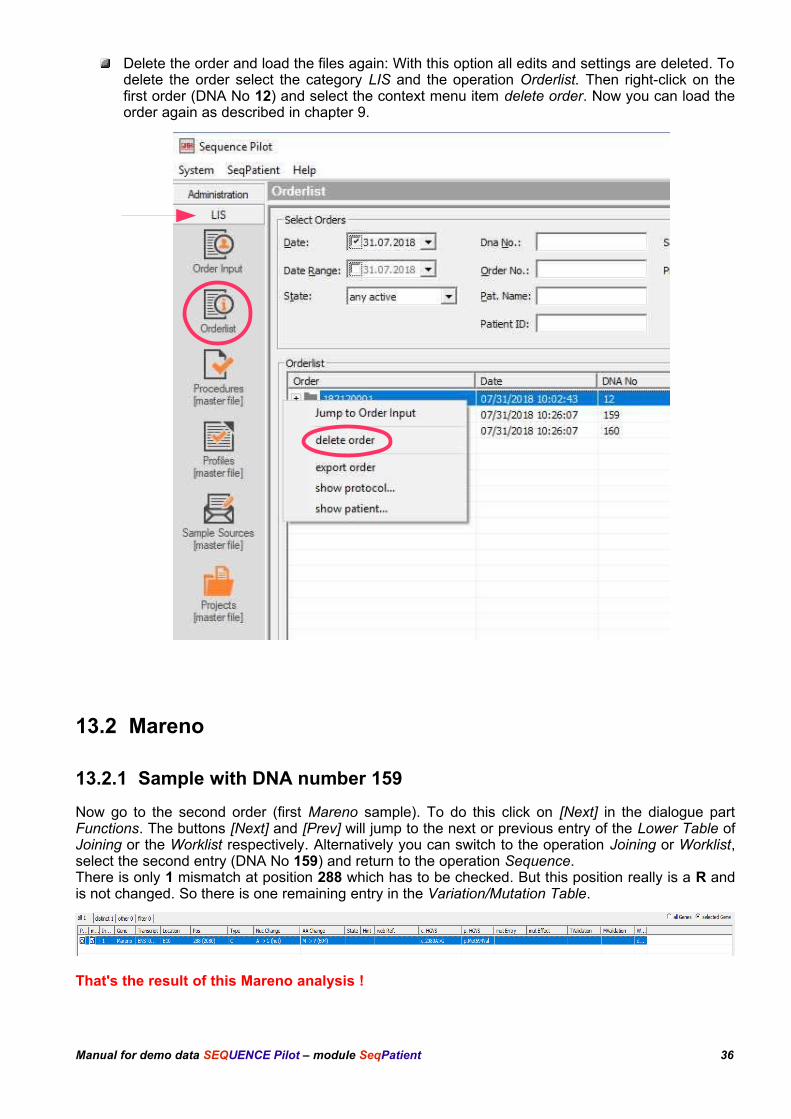
Delete the order and load the files again: With this option all edits and settings are deleted. Todelete the order select the category LIS and the operation Orderlist. Then right-click on thefirst order (DNA No 12) and select the context menu item delete order. Now you can load theorder again as described in chapter 9.
13.2 Mareno
13.2.1 Sample with DNA number 159
Now go to the second order (first Mareno sample). To do this click on [Next] in the dialogue partFunctions. The buttons [Next] and [Prev] will jump to the next or previous entry of the Lower Table ofJoining or the Worklist respectively. Alternatively you can switch to the operation Joining or Worklist,select the second entry (DNA No 159) and return to the operation Sequence.There is only 1 mismatch at position 288 which has to be checked. But this position really is a R andis not changed. So there is one remaining entry in the Variation/Mutation Table.
That's the result of this Mareno analysis !
Manual for demo data SEQUENCE Pilot – module SeqPatient 36
Technically and medically validate all result files of this order and print the report like described inchapters 13.1.8 and 13.1.9.
13.2.2 Sample with DNA number 160 – Statistic Warnings
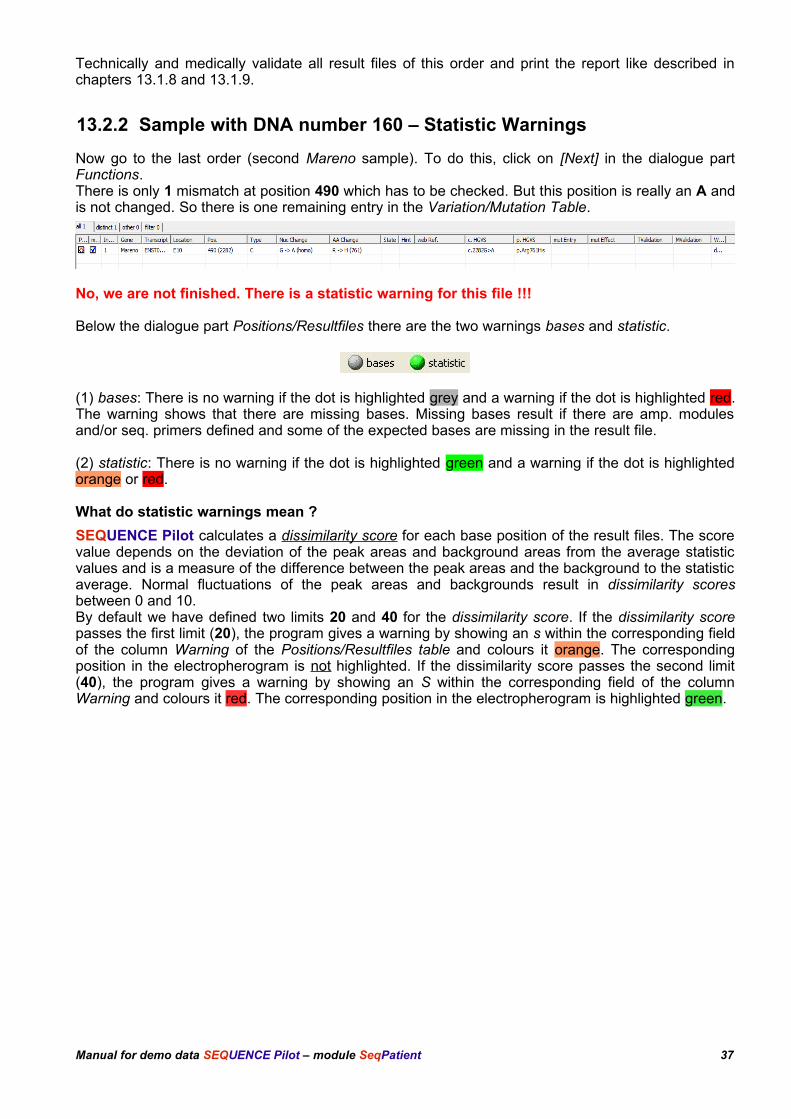
Now go to the last order (second Mareno sample). To do this, click on [Next] in the dialogue partFunctions.There is only 1 mismatch at position 490 which has to be checked. But this position is really an A andis not changed. So there is one remaining entry in the Variation/Mutation Table.
No, we are not finished. There is a statistic warning for this file !!!
Below the dialogue part Positions/Resultfiles there are the two warnings bases and statistic.
(1) bases: There is no warning if the dot is highlighted grey and a warning if the dot is highlighted red.The warning shows that there are missing bases. Missing bases result if there are amp. modulesand/or seq. primers defined and some of the expected bases are missing in the result file.
(2) statistic: There is no warning if the dot is highlighted green and a warning if the dot is highlightedorange or red.
What do statistic warnings mean ?
SEQUENCE Pilot calculates a dissimilarity score for each base position of the result files. The scorevalue depends on the deviation of the peak areas and background areas from the average statisticvalues and is a measure of the difference between the peak areas and the background to the statisticaverage. Normal fluctuations of the peak areas and backgrounds result in dissimilarity scoresbetween 0 and 10. By default we have defined two limits 20 and 40 for the dissimilarity score. If the dissimilarity scorepasses the first limit (20), the program gives a warning by showing an s within the corresponding fieldof the column Warning of the Positions/Resultfiles table and colours it orange. The correspondingposition in the electropherogram is not highlighted. If the dissimilarity score passes the second limit(40), the program gives a warning by showing an S within the corresponding field of the columnWarning and colours it red. The corresponding position in the electropherogram is highlighted green.
Manual for demo data SEQUENCE Pilot – module SeqPatient 37
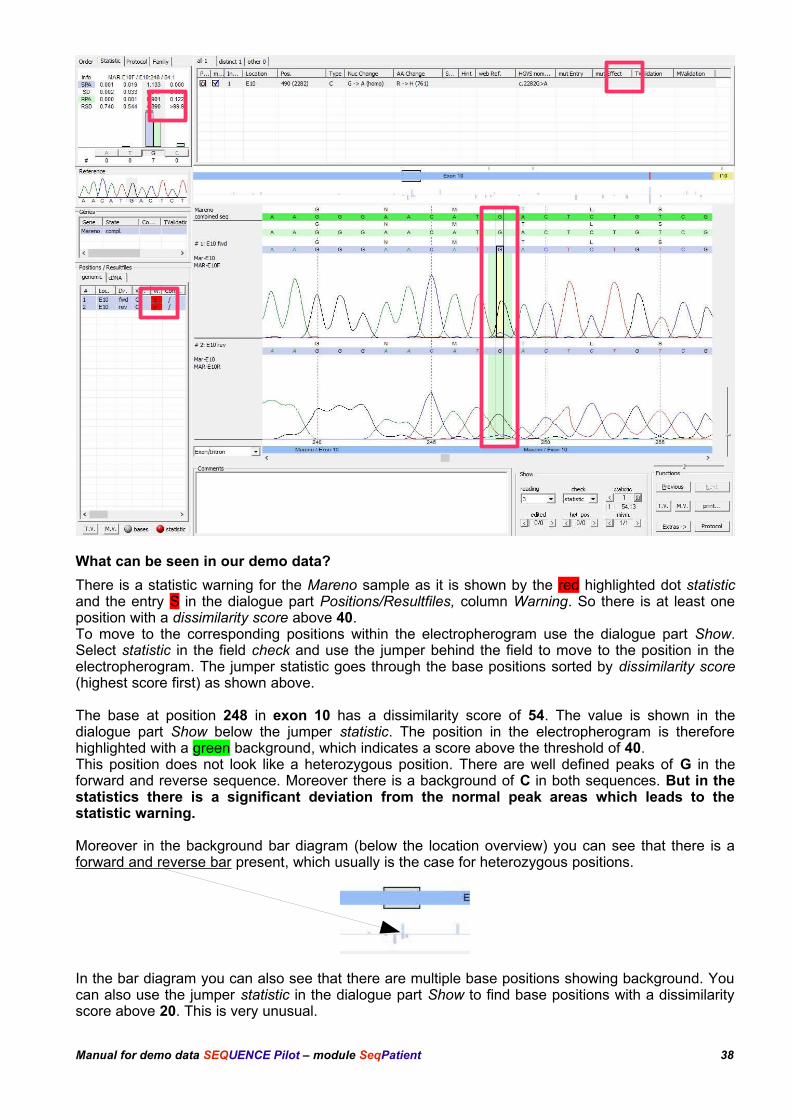
What can be seen in our demo data?
There is a statistic warning for the Mareno sample as it is shown by the red highlighted dot statisticand the entry S in the dialogue part Positions/Resultfiles, column Warning. So there is at least oneposition with a dissimilarity score above 40. To move to the corresponding positions within the electropherogram use the dialogue part Show.Select statistic in the field check and use the jumper behind the field to move to the position in theelectropherogram. The jumper statistic goes through the base positions sorted by dissimilarity score(highest score first) as shown above.
The base at position 248 in exon 10 has a dissimilarity score of 54. The value is shown in thedialogue part Show below the jumper statistic. The position in the electropherogram is thereforehighlighted with a green background, which indicates a score above the threshold of 40.This position does not look like a heterozygous position. There are well defined peaks of G in theforward and reverse sequence. Moreover there is a background of C in both sequences. But in thestatistics there is a significant deviation from the normal peak areas which leads to thestatistic warning.
Moreover in the background bar diagram (below the location overview) you can see that there is aforward and reverse bar present, which usually is the case for heterozygous positions.
In the bar diagram you can also see that there are multiple base positions showing background. Youcan also use the jumper statistic in the dialogue part Show to find base positions with a dissimilarityscore above 20. This is very unusual.
Manual for demo data SEQUENCE Pilot – module SeqPatient 38
What happened to this Mareno sample ?There was an allelic drop-out, this means a mismatch at a PCR-Primer position for one allele. Thisallele was not amplified with the PCR as expected and is only present with a small copy number.Therefore several peaks do not match to the normal relative peak areas and we get high dissimilarityscores. At position 248 the G peak is too small and we have a C background. Knowing the allelic drop-out,we see that the C is no background but a real peak and the small peak area is a result of the smallcopy number.SEQUENCE Pilot can not define positions like 248 to be heterozygous, but it will give a warning ifsomething differs from the statistic average.Knowing this, position 490 can also be defined to be heterozygous, which was previously assumed tobe homozygous.
So the warning means – do not trust the results and think about what could have happened.
13.3 Discussion of the analysis
All variations/mutations which appeared in the Variations/Mutations Table were checked. Threemutations/variation in the COL1A1 sample and one mutation in the first Mareno sample (DNAnumber 159) were found. All of them were distinct mutations. The second Mareno sample (DNAnumber 160) could not really be analysed because there was a problem with the PCR.There were many exons in our COL1A1 sample that were not checked, because there was nomismatch found. As described for the Mareno sample with DNA number 160, all positions arechecked against the average statistic peak areas and there was no warning for any COL1A1 orMareno (DNA number 159) result file.Check the dissimilarity scores in the Mareno sample (DNA number 159) or the COL1A1 sample tosee if there are any statistic aberrations. Therefore press [Prev] in the dialogue part Functions and toswitch to the Mareno sample (DNA number 159) or the COL1A1 sample. Select any result file in thePositions/Resultfiles table. Then check the dissimilarity scores with the jumper statistic. In most casesthere will be “no entry” - this means there is no peak with a dissimilarity score above 1. For someexons there will be dissimilarity scores in the range of 1 to 3. The highest dissimilarity score is in exon4, position +15 of the COL1A1 sample with a value of 9.05.Another test for the dissimilarity scores (remove the medical validation before you do your edits!):
Move to exon 10 of the Mareno sample (DNA number 159), edit the heterozygous position 288 in theforward, reverse or both sequences to 'A' (this simulates a not recognized heterozygous position) andcheck the dissimilarity scores. Try the same with the found heterozygous base position -12 in exon 52of the COL1A1 sample. Set a 'g' here. Statistic warnings appear with dissimilarity scores of 325 and170 respectively:
Manual for demo data SEQUENCE Pilot – module SeqPatient 39
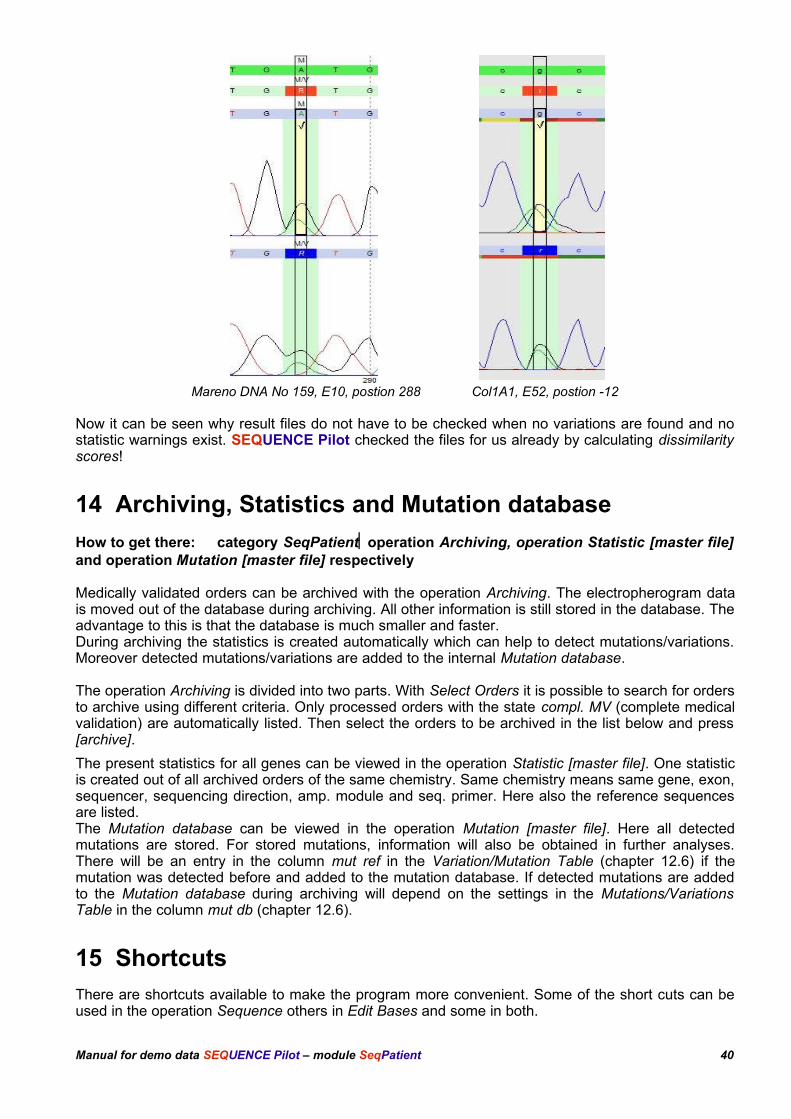
Mareno DNA No 159, E10, postion 288 Col1A1, E52, postion -12
Now it can be seen why result files do not have to be checked when no variations are found and nostatistic warnings exist. SEQUENCE Pilot checked the files for us already by calculating dissimilarityscores!
14 Archiving, Statistics and Mutation database
How to get there: category SeqPatientoperation Archiving, operation Statistic [master file]and operation Mutation [master file] respectively
Medically validated orders can be archived with the operation Archiving. The electropherogram datais moved out of the database during archiving. All other information is still stored in the database. Theadvantage to this is that the database is much smaller and faster. During archiving the statistics is created automatically which can help to detect mutations/variations.Moreover detected mutations/variations are added to the internal Mutation database.
The operation Archiving is divided into two parts. With Select Orders it is possible to search for ordersto archive using different criteria. Only processed orders with the state compl. MV (complete medicalvalidation) are automatically listed. Then select the orders to be archived in the list below and press[archive].
The present statistics for all genes can be viewed in the operation Statistic [master file]. One statisticis created out of all archived orders of the same chemistry. Same chemistry means same gene, exon,sequencer, sequencing direction, amp. module and seq. primer. Here also the reference sequencesare listed. The Mutation database can be viewed in the operation Mutation [master file]. Here all detectedmutations are stored. For stored mutations, information will also be obtained in further analyses.There will be an entry in the column mut ref in the Variation/Mutation Table (chapter 12.6) if themutation was detected before and added to the mutation database. If detected mutations are addedto the Mutation database during archiving will depend on the settings in the Mutations/VariationsTable in the column mut db (chapter 12.6).
15 ShortcutsThere are shortcuts available to make the program more convenient. Some of the short cuts can beused in the operation Sequence others in Edit Bases and some in both.
Manual for demo data SEQUENCE Pilot – module SeqPatient 40
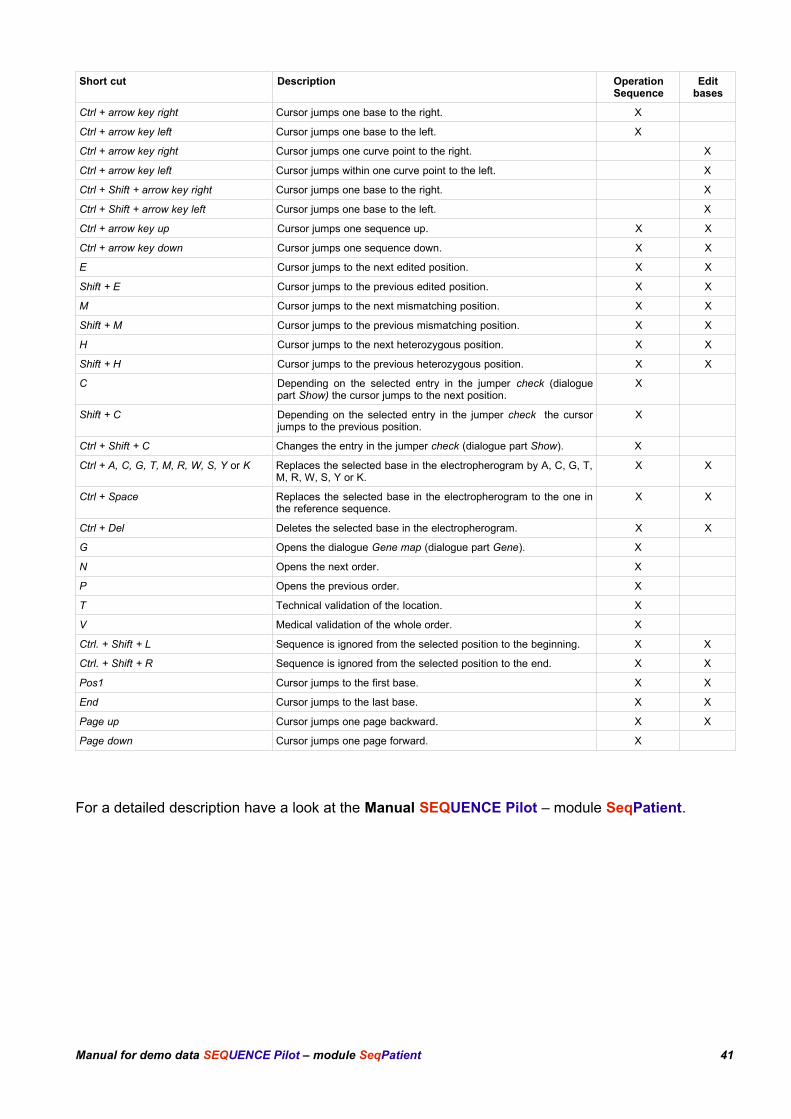
Short cut Description OperationSequence
Editbases
Ctrl + arrow key right Cursor jumps one base to the right. X
Ctrl + arrow key left Cursor jumps one base to the left. X
Ctrl + arrow key right Cursor jumps one curve point to the right. X
Ctrl + arrow key left Cursor jumps within one curve point to the left. X
Ctrl + Shift + arrow key right Cursor jumps one base to the right. X
Ctrl + Shift + arrow key left Cursor jumps one base to the left. X
Ctrl + arrow key up Cursor jumps one sequence up. X X
Ctrl + arrow key down Cursor jumps one sequence down. X X
E Cursor jumps to the next edited position. X X
Shift + E Cursor jumps to the previous edited position. X X
M Cursor jumps to the next mismatching position. X X
Shift + M Cursor jumps to the previous mismatching position. X X
H Cursor jumps to the next heterozygous position. X X
Shift + H Cursor jumps to the previous heterozygous position. X X
C Depending on the selected entry in the jumper check (dialoguepart Show) the cursor jumps to the next position.
X
Shift + C Depending on the selected entry in the jumper check the cursorjumps to the previous position.
X
Ctrl + Shift + C Changes the entry in the jumper check (dialogue part Show). X
Ctrl + A, C, G, T, M, R, W, S, Y or K Replaces the selected base in the electropherogram by A, C, G, T,M, R, W, S, Y or K.
X X
Ctrl + Space Replaces the selected base in the electropherogram to the one inthe reference sequence.
X X
Ctrl + Del Deletes the selected base in the electropherogram. X X
G Opens the dialogue Gene map (dialogue part Gene). X
N Opens the next order. X
P Opens the previous order. X
T Technical validation of the location. X
V Medical validation of the whole order. X
Ctrl. + Shift + L Sequence is ignored from the selected position to the beginning. X X
Ctrl. + Shift + R Sequence is ignored from the selected position to the end. X X
Pos1 Cursor jumps to the first base. X X
End Cursor jumps to the last base. X X
Page up Cursor jumps one page backward. X X
Page down Cursor jumps one page forward. X
For a detailed description have a look at the Manual SEQUENCE Pilot – module SeqPatient.
Manual for demo data SEQUENCE Pilot – module SeqPatient 41