MANTRA 2.0 TUTORIAL › About › MantraTutorial.pdf · MANTRA WEB TOOL - Mantra 2.0 Features •...
54
mantra.tigem.it MANTRA 2.0 TUTORIAL
Transcript of MANTRA 2.0 TUTORIAL › About › MantraTutorial.pdf · MANTRA WEB TOOL - Mantra 2.0 Features •...
mantra.tigem.it
MANTRA 2.0 TUTORIAL
OUTLINE
1. MANTRA Web Tool2. Analysis
a) New Experimentb) New Nodec) GSEA
3. Networka) Viewb) Button Panel
4. Search5. In Summary6. Conclusion
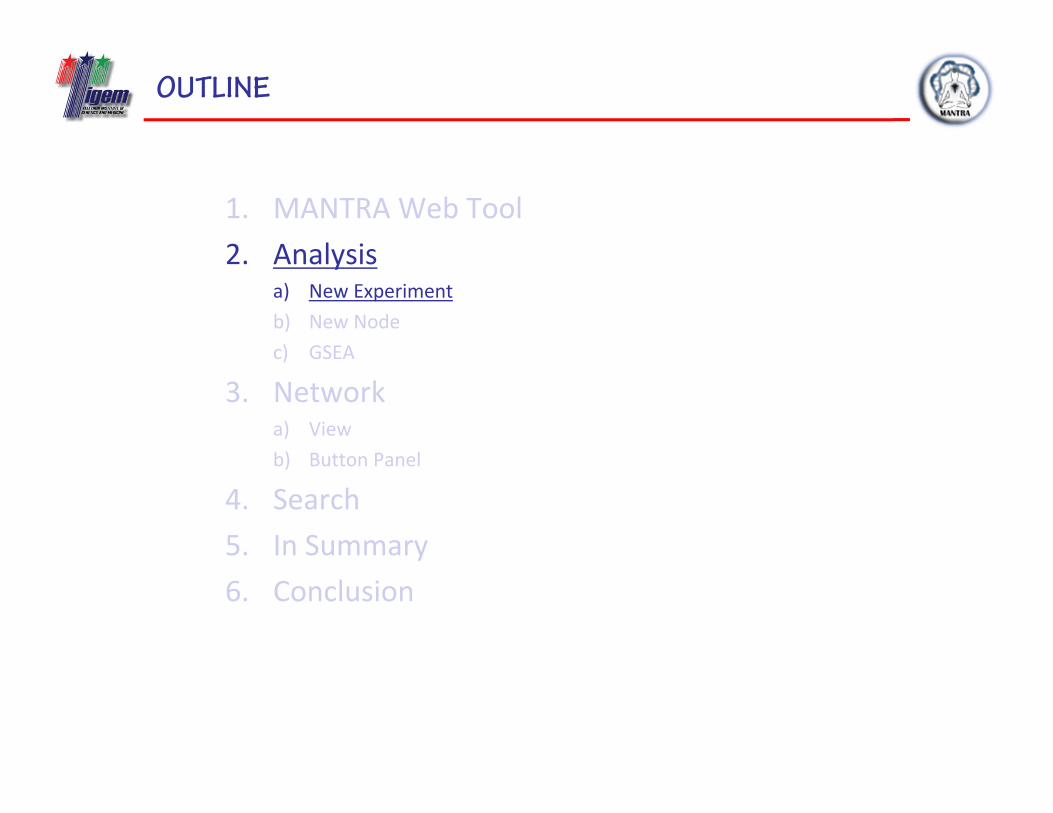
OUTLINE
1. MANTRA Web Tool2. Analysis
a) New Experimentb) New Nodec) GSEA
3. Networka) Viewb) Button Panel
4. Search5. In Summary6. Conclusion
MANTRA WEB TOOL
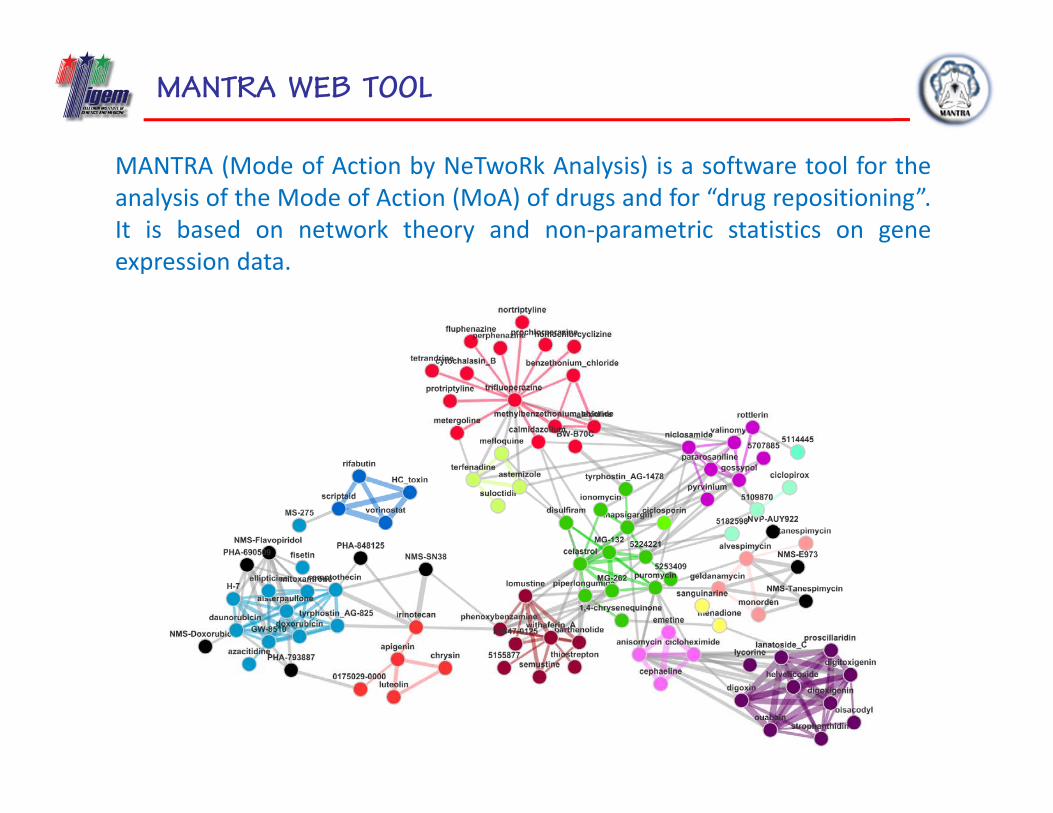
MANTRA (Mode of Action by NeTwoRk Analysis) is a software tool for theanalysis of the Mode of Action (MoA) of drugs and for “drug repositioning”.It is based on network theory and non‐parametric statistics on geneexpression data.
MANTRA WEB TOOL - Mantra 2.0 Features
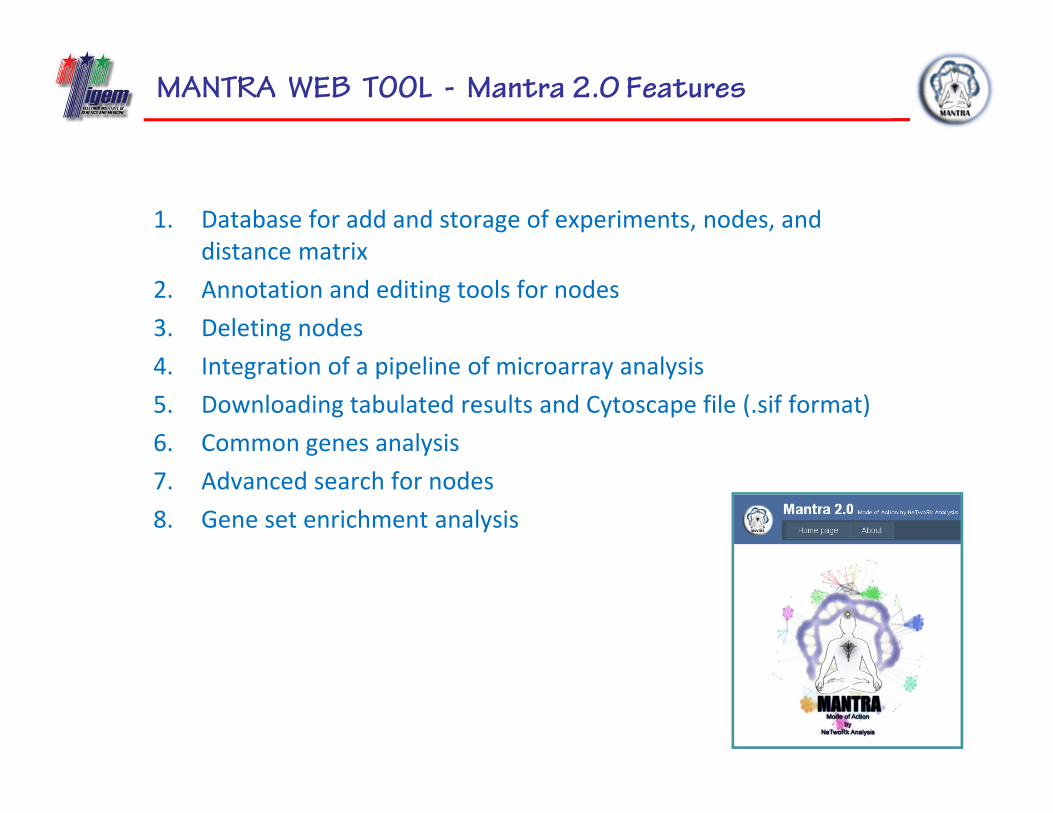
1. Database for add and storage of experiments, nodes, and distance matrix
2. Annotation and editing tools for nodes3. Deleting nodes4. Integration of a pipeline of microarray analysis5. Downloading tabulated results and Cytoscape file (.sif format)6. Common genes analysis7. Advanced search for nodes8. Gene set enrichment analysis
MANTRA WEB TOOL - Mantra 2.0 Features
• MANTRA 2.0 has been implemented by customizing the Applet versionof Medusa (Hooper and Bork, 2005), a front end for protein interactiondatabases, which can be also used as a general graph visualization tool.
• The MANTRA 2.0 implements the method in (Iorio, et al., 2010) for thediscovery of drug MoA and the repositioning of known drugs from theanalysis of transcriptional responses.
• It allows users to visually explore the Drug Network that we inferredfor 1309 compounds in a user‐friendly environment providing, for eachof the drugs, information about biochemical interactions, therapeuticindications, known MoA, pharmacology and targeted proteins.
• By exploring the Drug Network, users can identify unexpectedsimilarities between drugs acting on different direct intra‐cellulartargets and search for “repositionable” drugs.
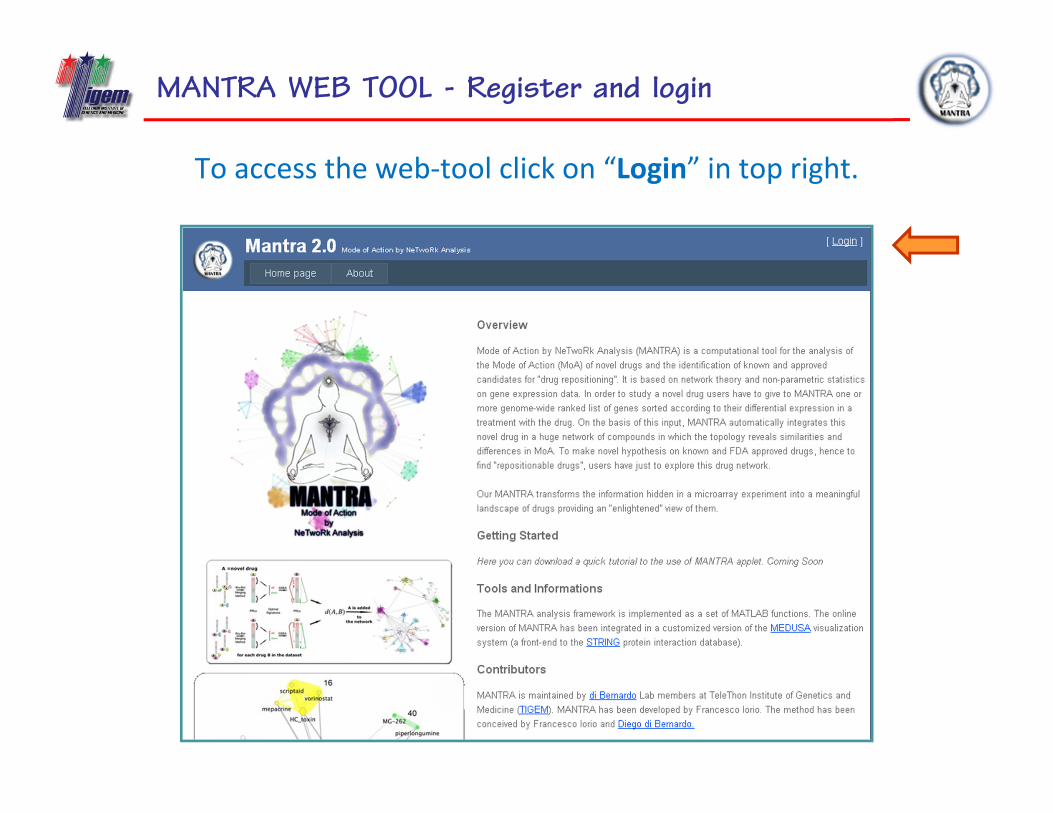
MANTRA WEB TOOL - Register and login
To access the web‐tool click on “Login” in top right.
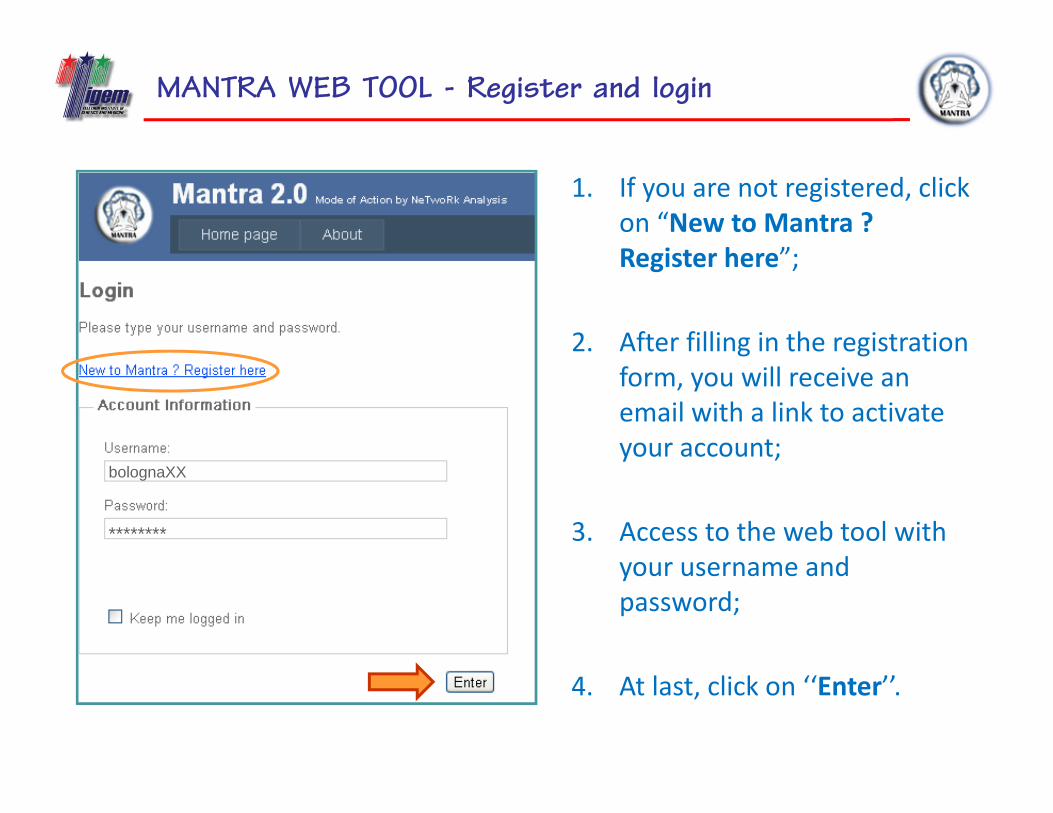
MANTRA WEB TOOL - Register and login
1. If you are not registered, click on “New to Mantra ? Register here”;
2. After filling in the registration form, you will receive an email with a link to activate your account;
3. Access to the web tool with your username and password;
4. At last, click on ‘‘Enter’’.
bolognaXX
********
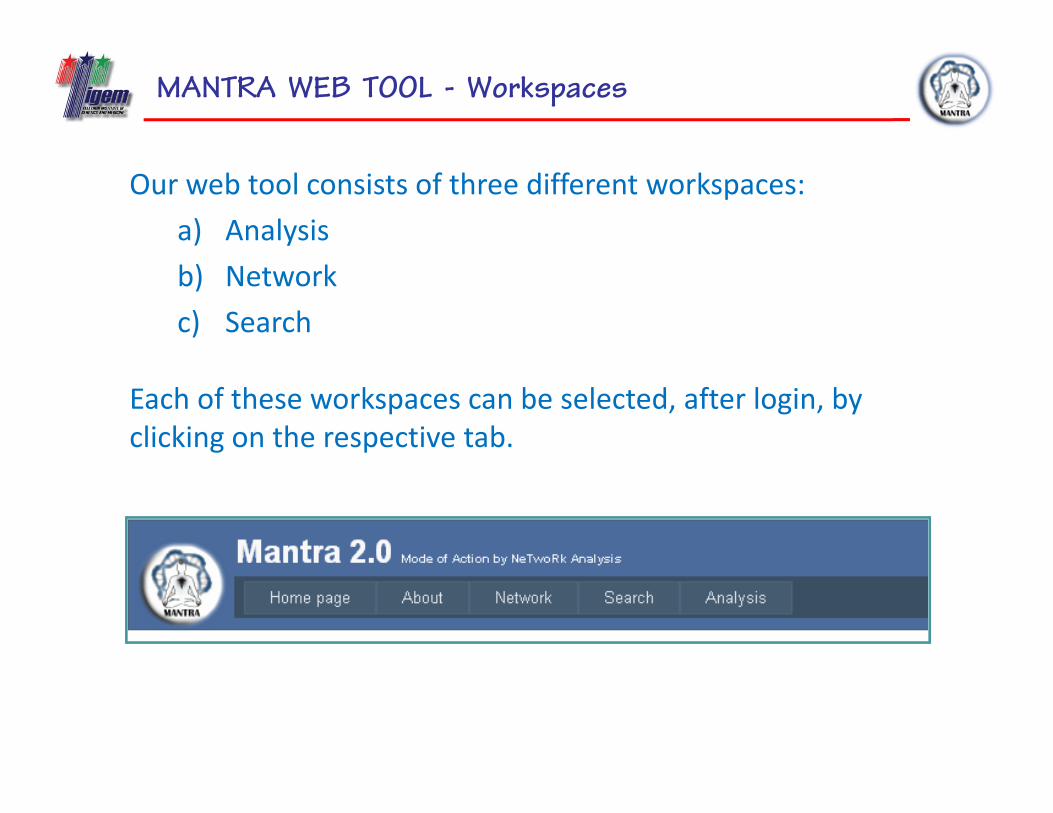
MANTRA WEB TOOL - Workspaces
Our web tool consists of three different workspaces: a) Analysisb) Networkc) Search
Each of these workspaces can be selected, after login, by clicking on the respective tab.
OUTLINE
1. MANTRA Web Tool2. Analysis
a) New Experimentb) New Nodec) GSEA
3. Networka) Viewb) Button Panel
4. Search5. In Summary6. Conclusion
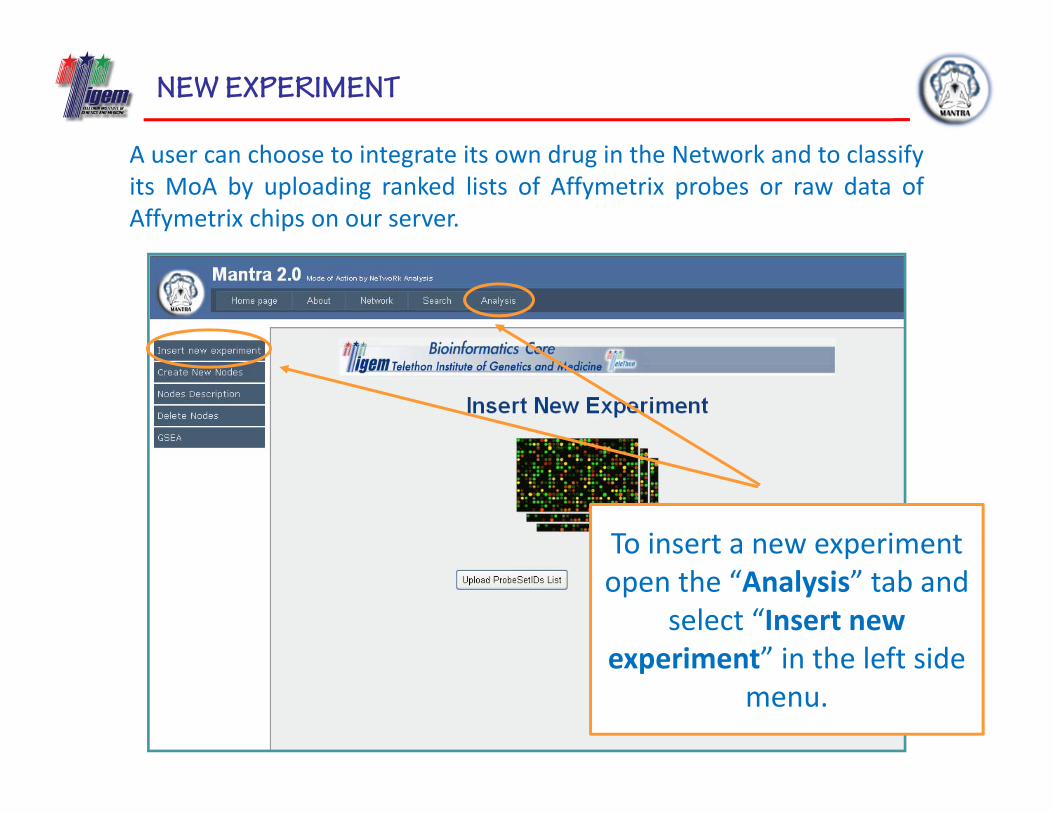
NEW EXPERIMENT
A user can choose to integrate its own drug in the Network and to classifyits MoA by uploading ranked lists of Affymetrix probes or raw data ofAffymetrix chips on our server.
To insert a new experiment open the “Analysis” tab and
select “Insert new experiment” in the left side
menu.
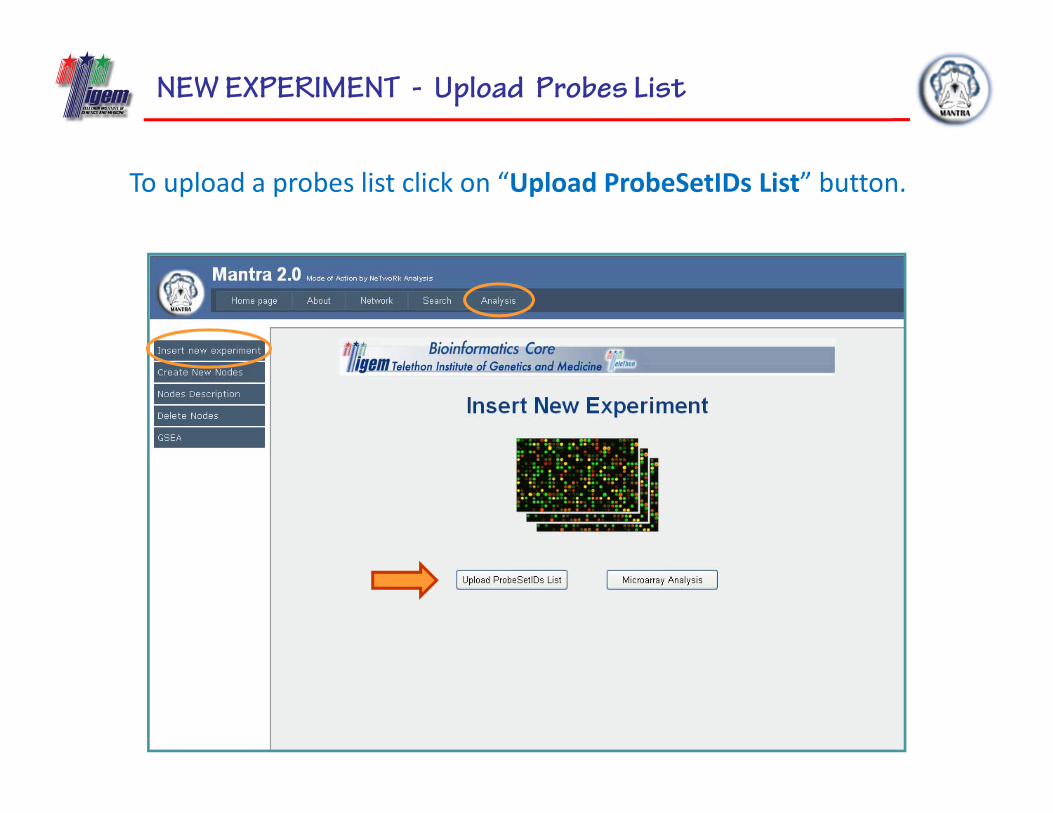
NEW EXPERIMENT - Upload Probes List
To upload a probes list click on “Upload ProbeSetIDs List” button.
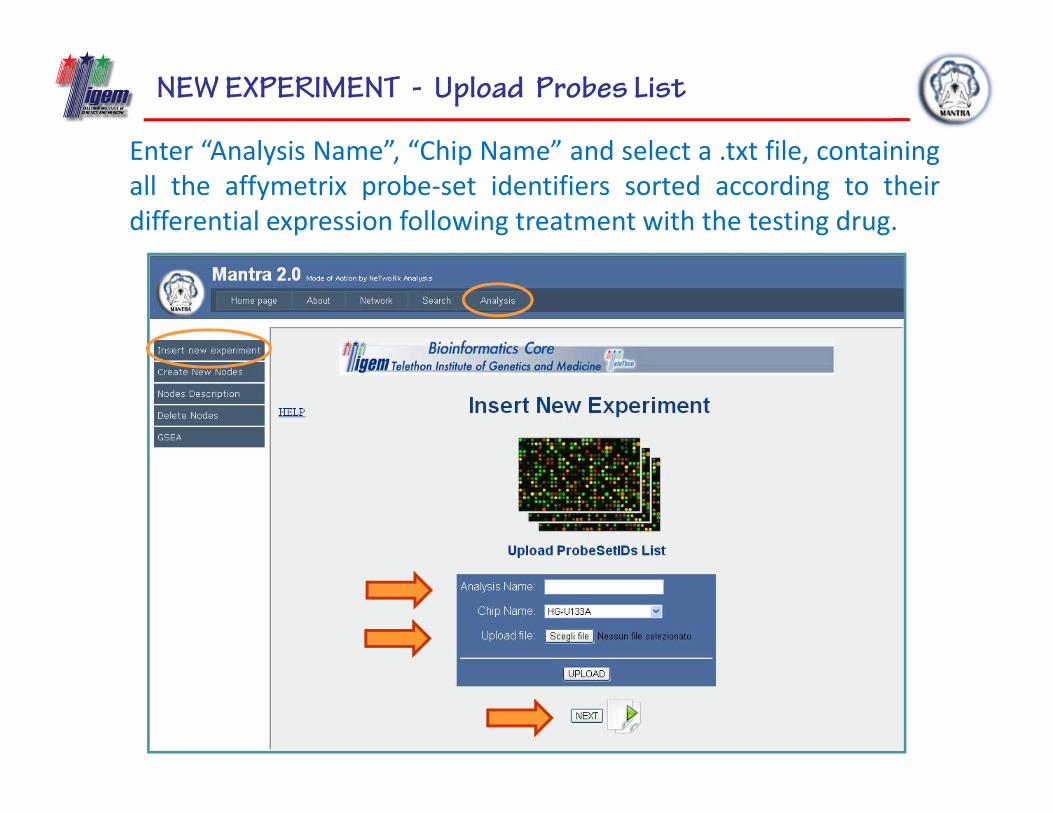
NEW EXPERIMENT - Upload Probes List
Enter “Analysis Name”, “Chip Name” and select a .txt file, containingall the affymetrix probe‐set identifiers sorted according to theirdifferential expression following treatment with the testing drug.
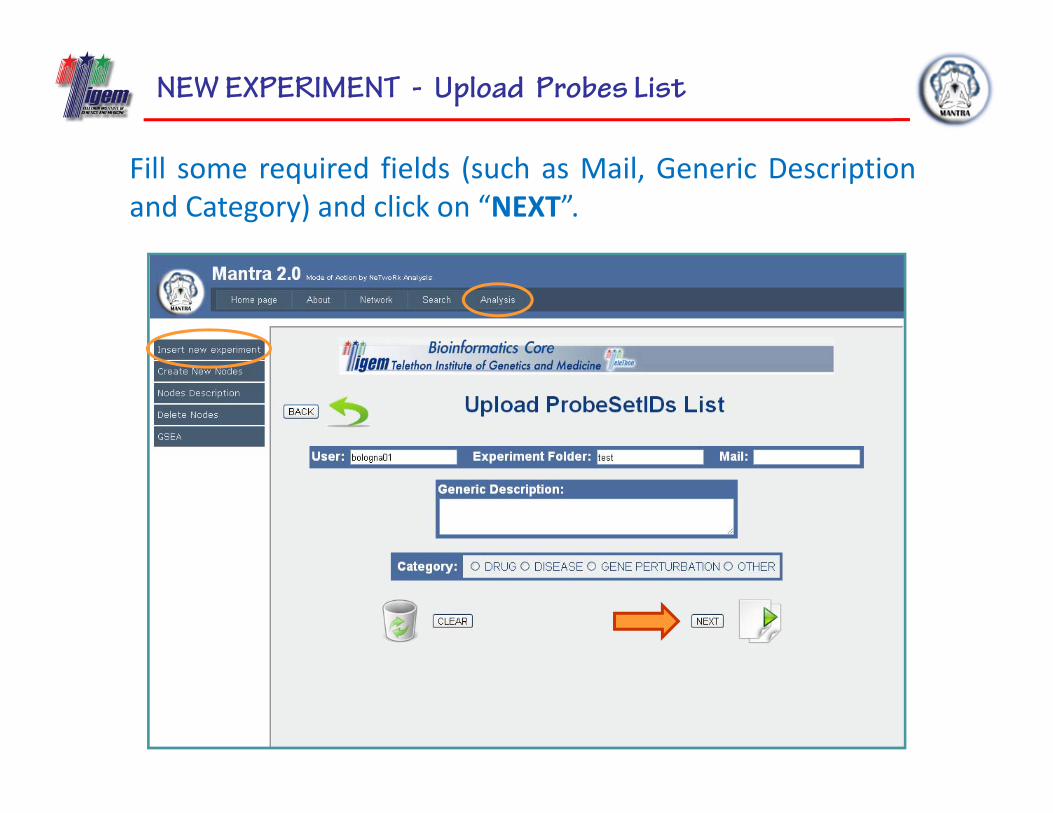
NEW EXPERIMENT - Upload Probes List
Fill some required fields (such as Mail, Generic Descriptionand Category) and click on “NEXT”.
NEW EXPERIMENT - Upload Probes List
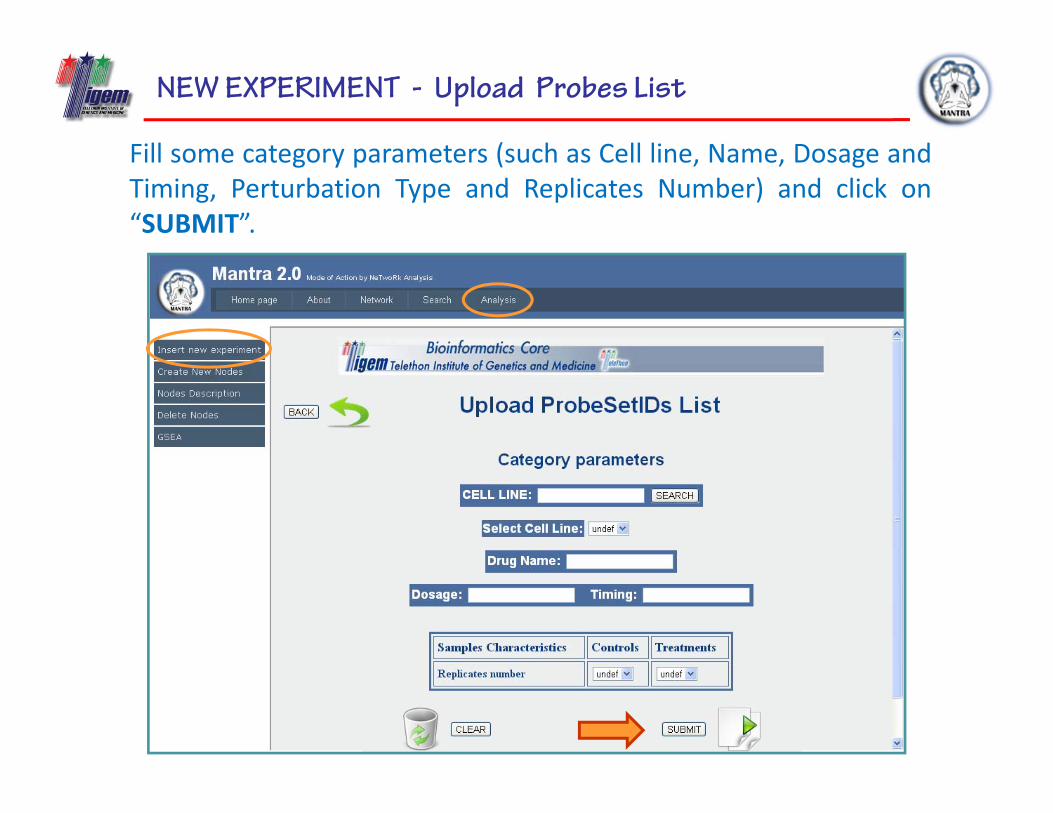
Fill some category parameters (such as Cell line, Name, Dosage andTiming, Perturbation Type and Replicates Number) and click on“SUBMIT”.
NEW EXPERIMENT - Microarray Analysis
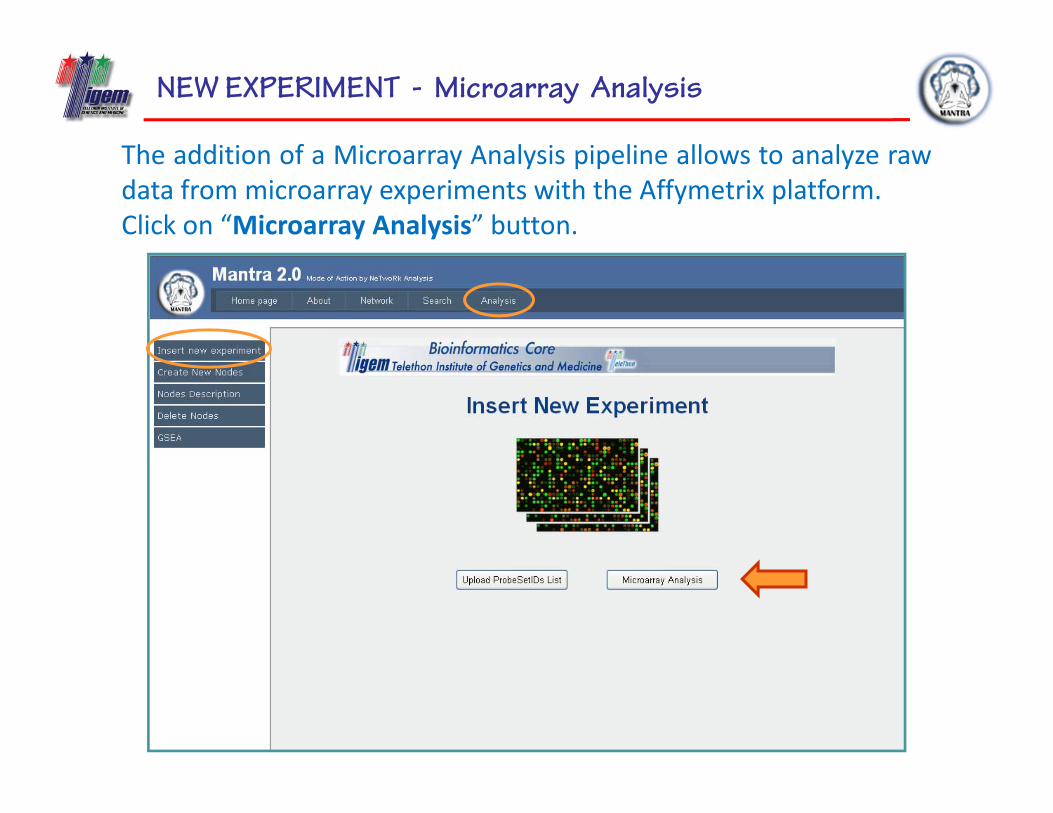
The addition of a Microarray Analysis pipeline allows to analyze rawdata from microarray experiments with the Affymetrix platform.Click on “Microarray Analysis” button.
NEW EXPERIMENT - Microarray Analysis
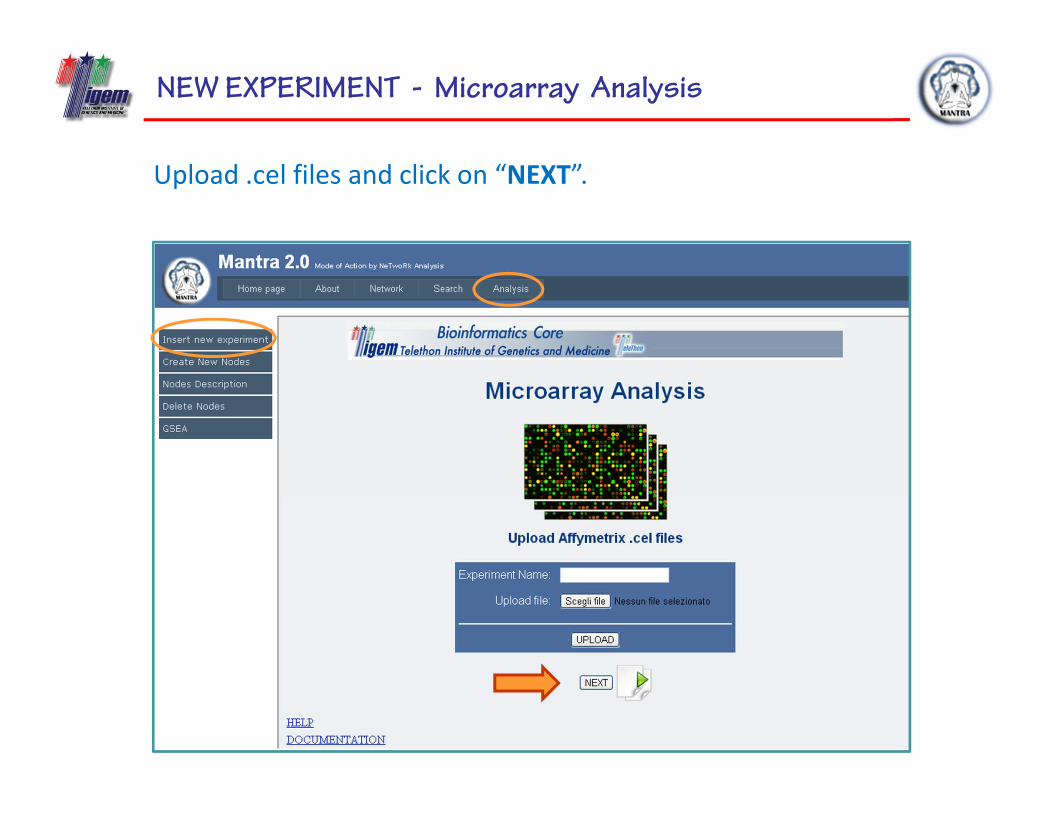
Upload .cel files and click on “NEXT”.
NEW EXPERIMENT - Microarray Analysis
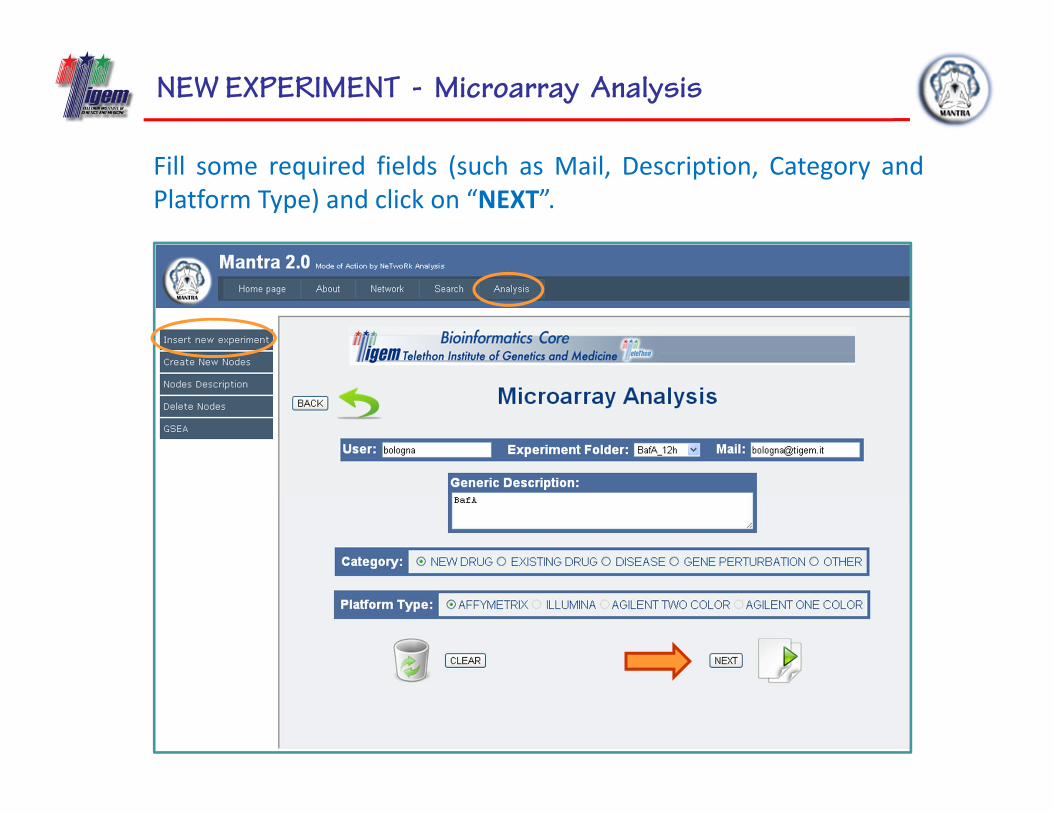
Fill some required fields (such as Mail, Description, Category andPlatform Type) and click on “NEXT”.
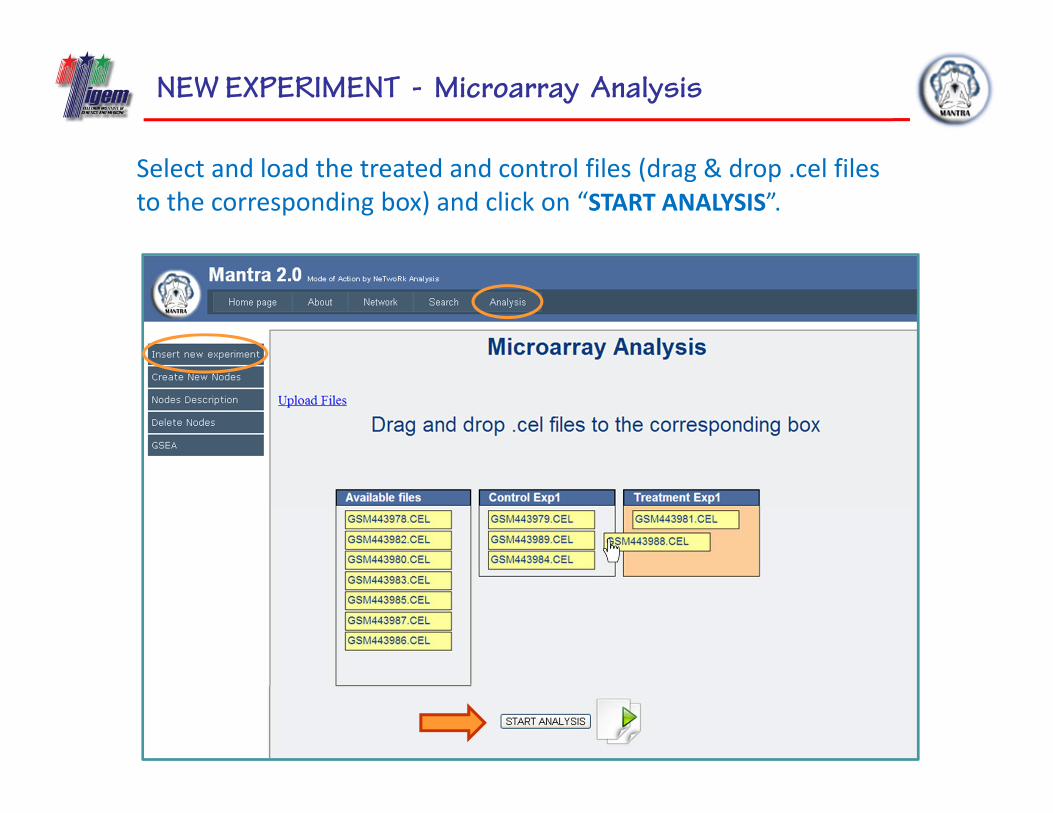
NEW EXPERIMENT - Microarray Analysis
Select and load the treated and control files (drag & drop .cel files to the corresponding box) and click on “START ANALYSIS”.
OUTLINE
1. MANTRA Web Tool2. Analysis
a) New Experimentb) New Nodec) GSEA
3. Networka) Viewb) Button Panel
4. Search5. In Summary6. Conclusion
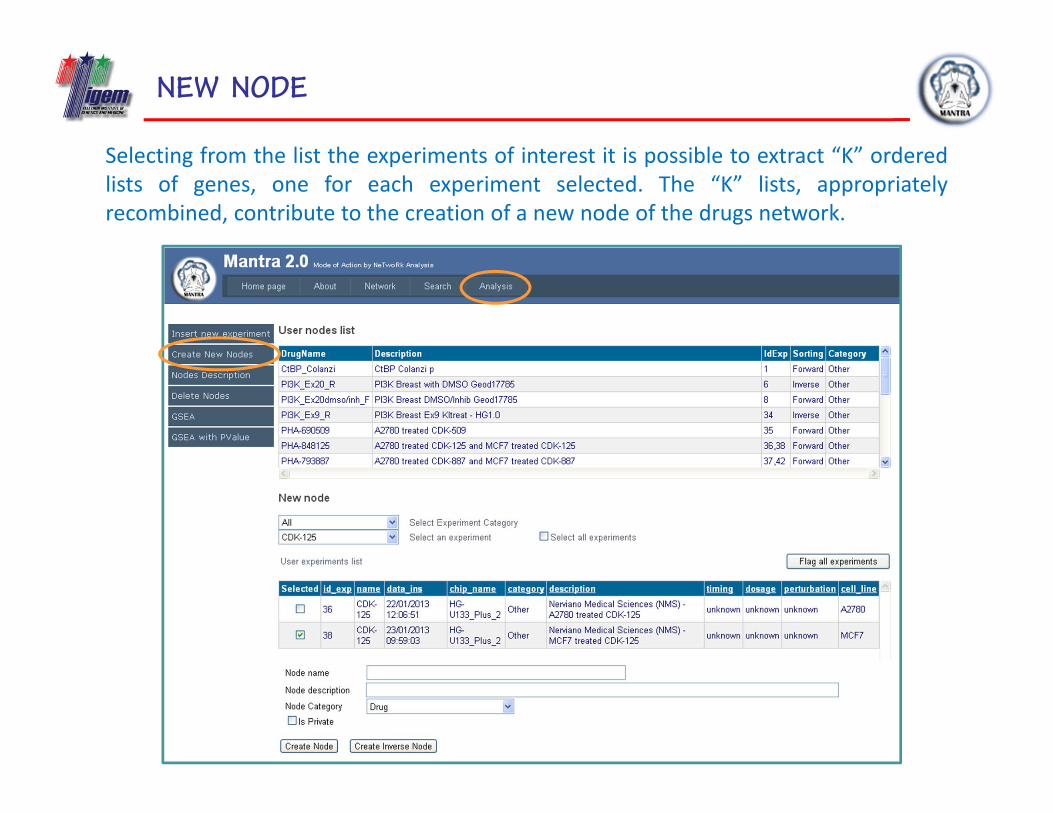
NEW NODE
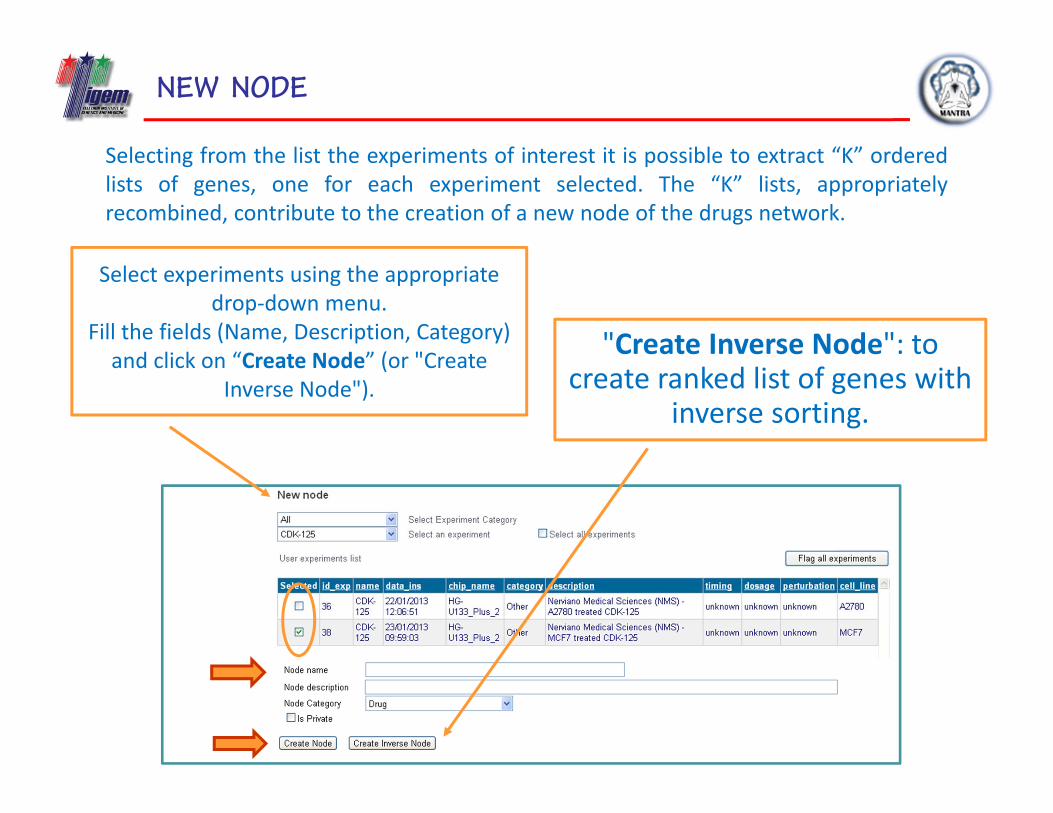
Selecting from the list the experiments of interest it is possible to extract “K” orderedlists of genes, one for each experiment selected. The “K” lists, appropriatelyrecombined, contribute to the creation of a new node of the drugs network.
NEW NODE
Selecting from the list the experiments of interest it is possible to extract “K” orderedlists of genes, one for each experiment selected. The “K” lists, appropriatelyrecombined, contribute to the creation of a new node of the drugs network.
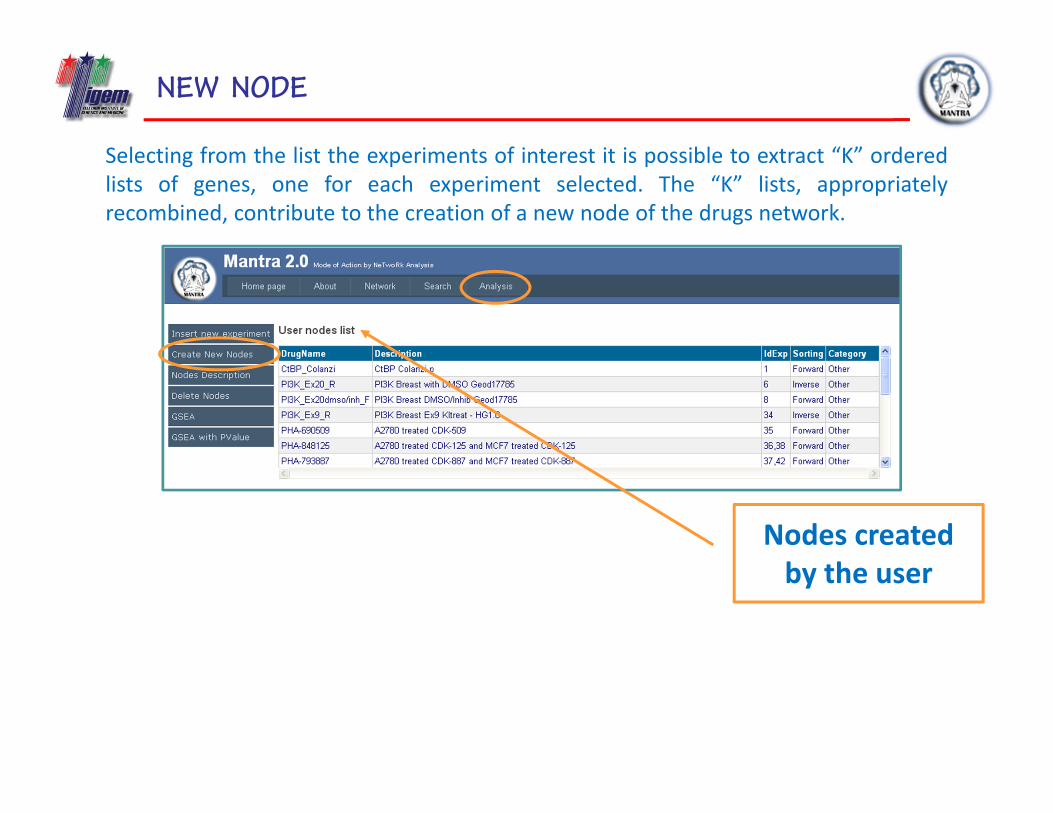
Nodes created by the user
NEW NODE
Selecting from the list the experiments of interest it is possible to extract “K” orderedlists of genes, one for each experiment selected. The “K” lists, appropriatelyrecombined, contribute to the creation of a new node of the drugs network.
"Create Inverse Node": to create ranked list of genes with
inverse sorting.
Select experiments using the appropriate drop‐down menu.
Fill the fields (Name, Description, Category) and click on “Create Node” (or "Create
Inverse Node").
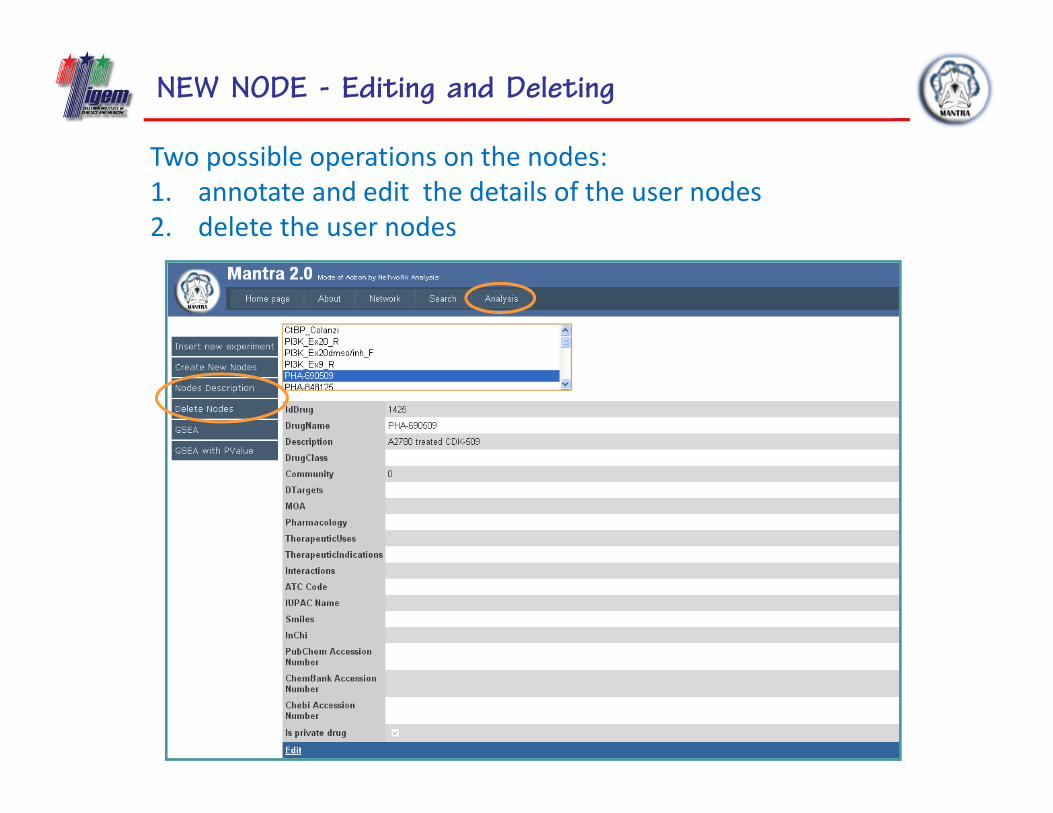
NEW NODE - Editing and Deleting
Two possible operations on the nodes:1. annotate and edit the details of the user nodes2. delete the user nodes
OUTLINE
1. MANTRA Web Tool2. Analysis
a) New Experimentb) New Nodec) GSEA
3. Networka) Viewb) Button Panel
4. Search5. In Summary6. Conclusion
GSEA
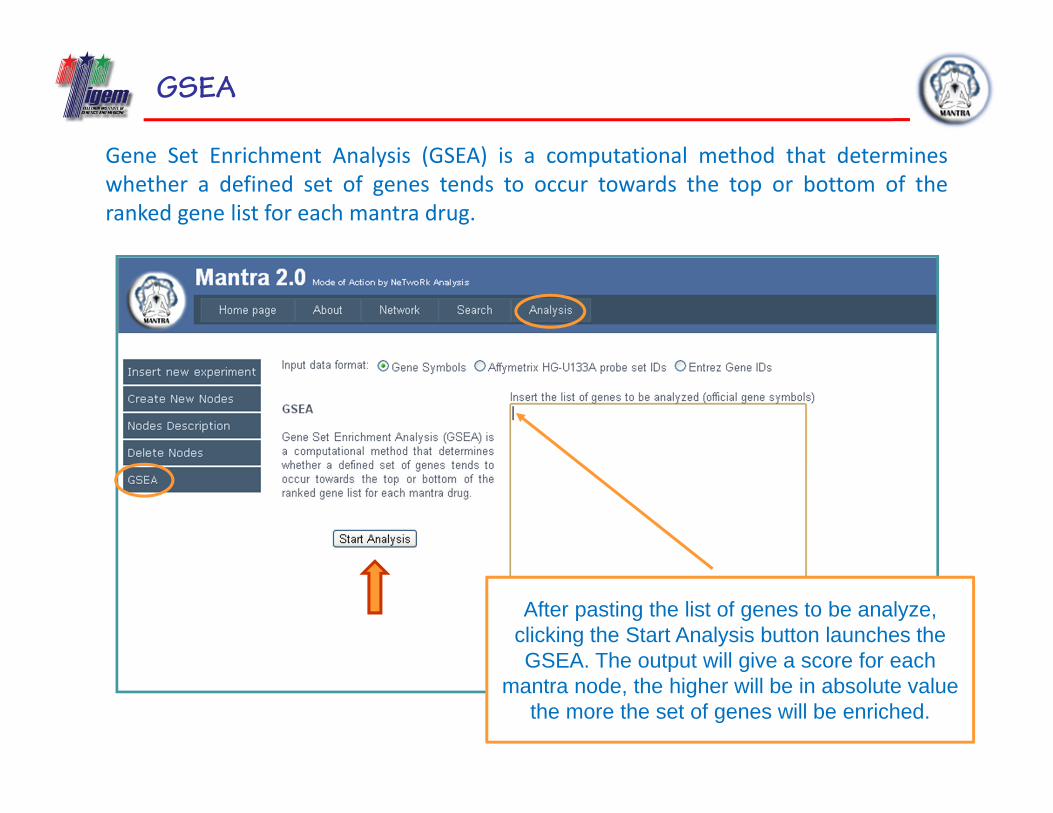
Gene Set Enrichment Analysis (GSEA) is a computational method that determineswhether a defined set of genes tends to occur towards the top or bottom of theranked gene list for each mantra drug.
After pasting the list of genes to be analyze, clicking the Start Analysis button launches the GSEA. The output will give a score for each
mantra node, the higher will be in absolute value the more the set of genes will be enriched.
OUTLINE
1. MANTRA Web Tool2. Analysis
a) New Experimentb) New Nodec) GSEA
3. Networka) Viewb) Button Panel
4. Search5. In Summary6. Conclusion
VIEW
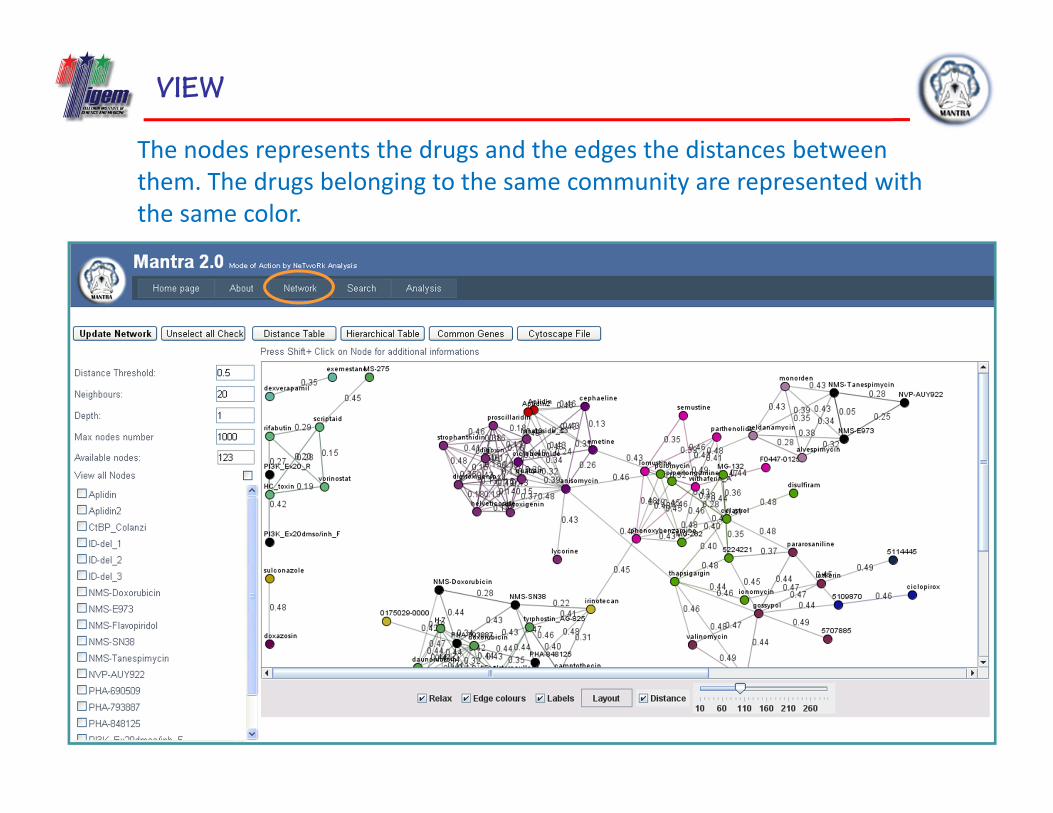
The nodes represents the drugs and the edges the distances between them. The drugs belonging to the same community are represented with the same color.
VIEW
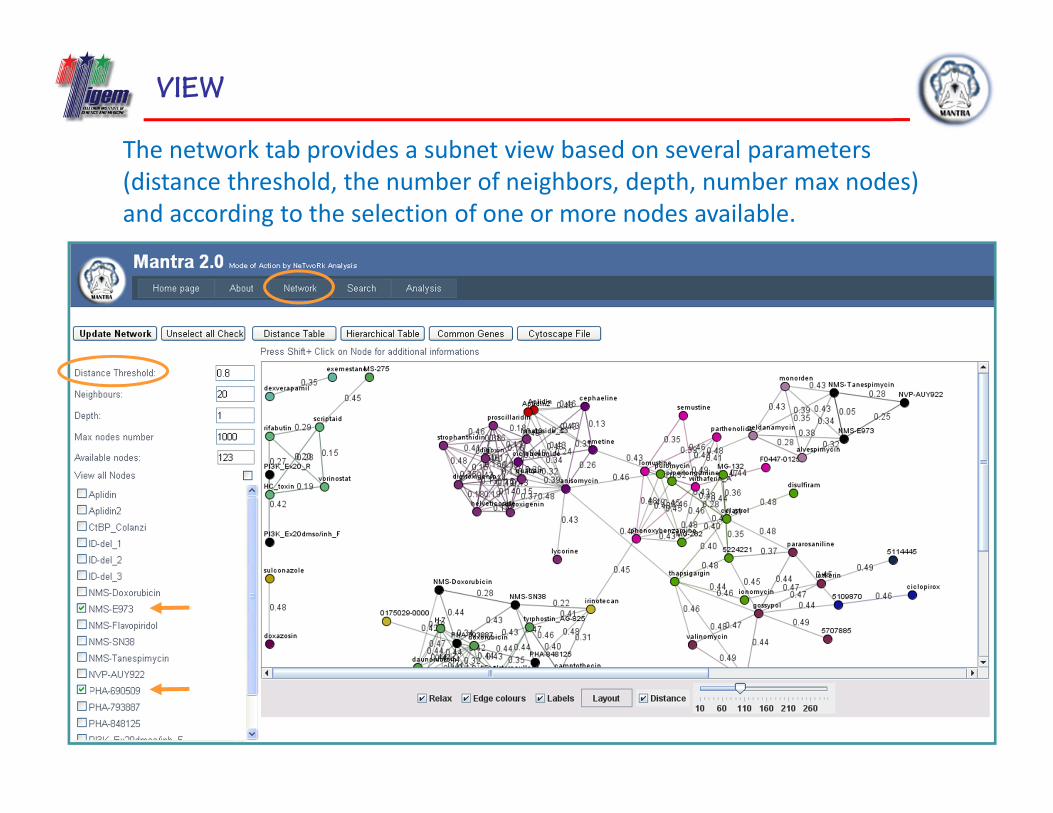
The network tab provides a subnet view based on several parameters(distance threshold, the number of neighbors, depth, number max nodes) and according to the selection of one or more nodes available.
VIEW
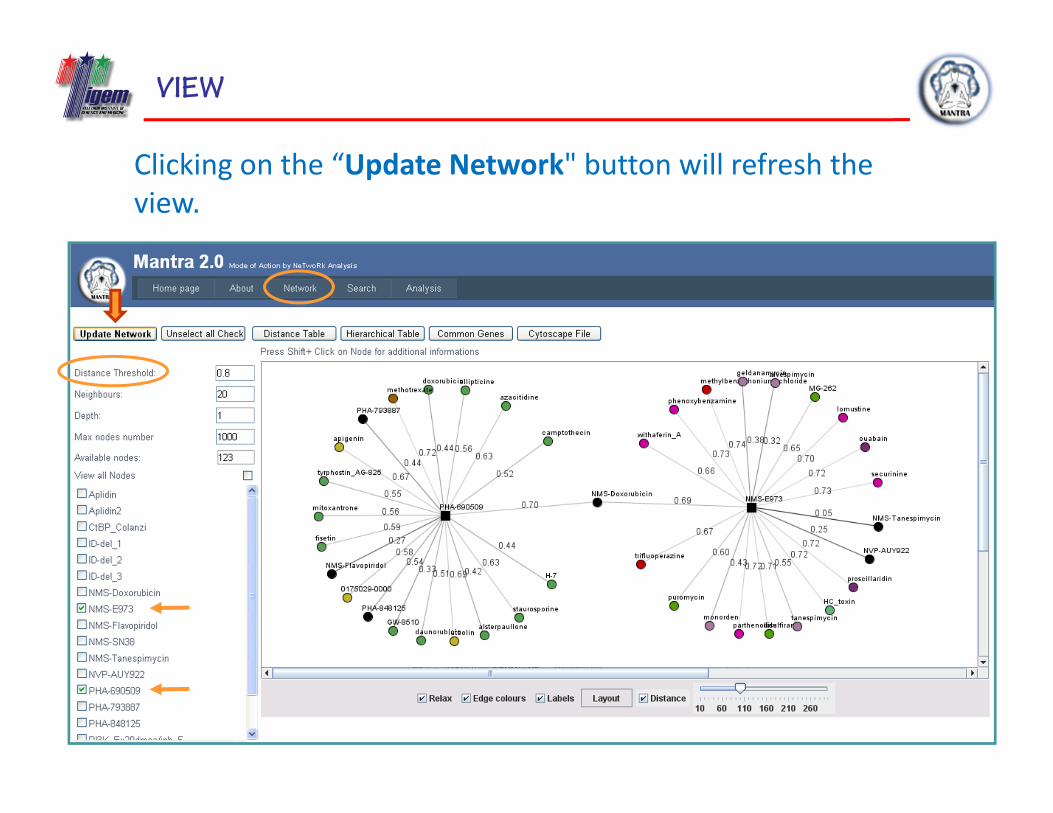
Clicking on the “Update Network" button will refresh the view.
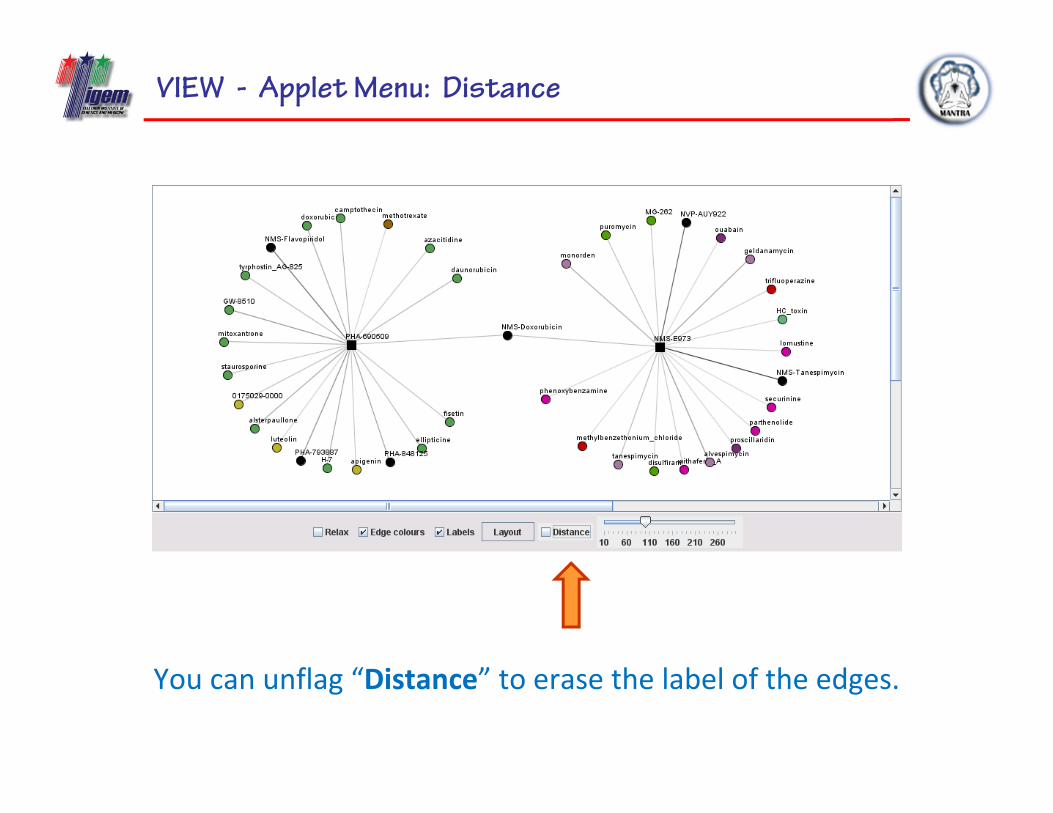
VIEW - Applet Menu: Distance
You can unflag “Distance” to erase the label of the edges.
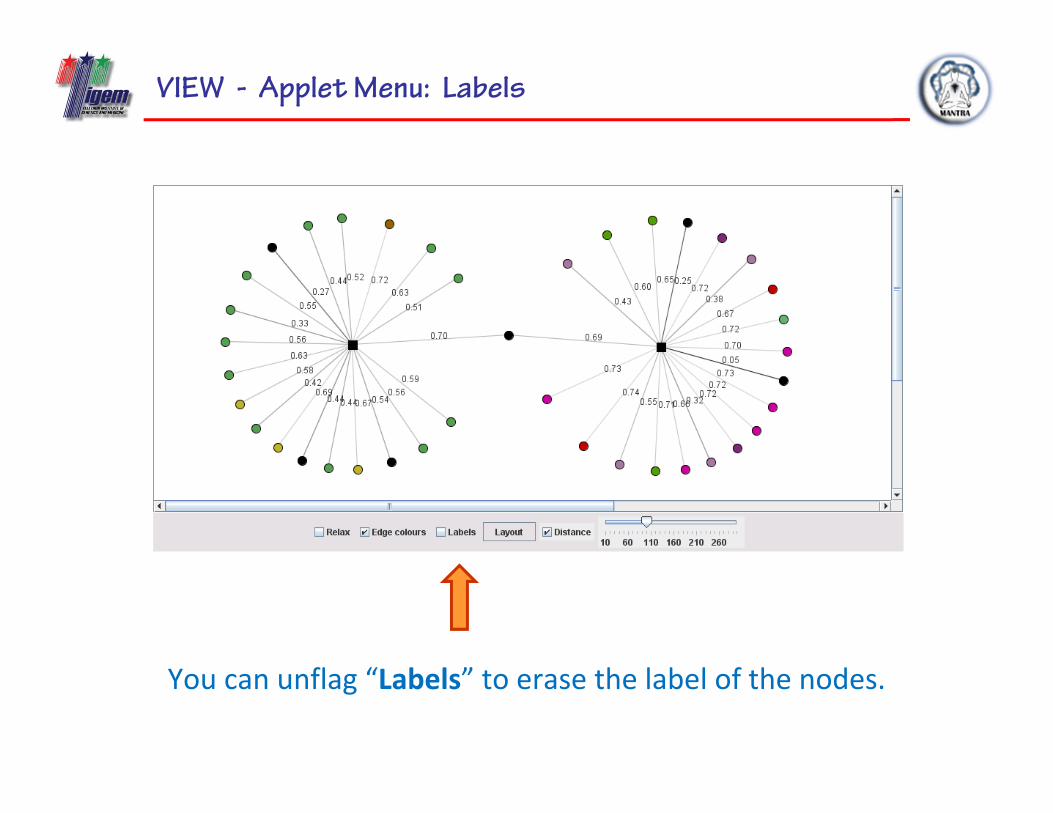
VIEW - Applet Menu: Labels
You can unflag “Labels” to erase the label of the nodes.
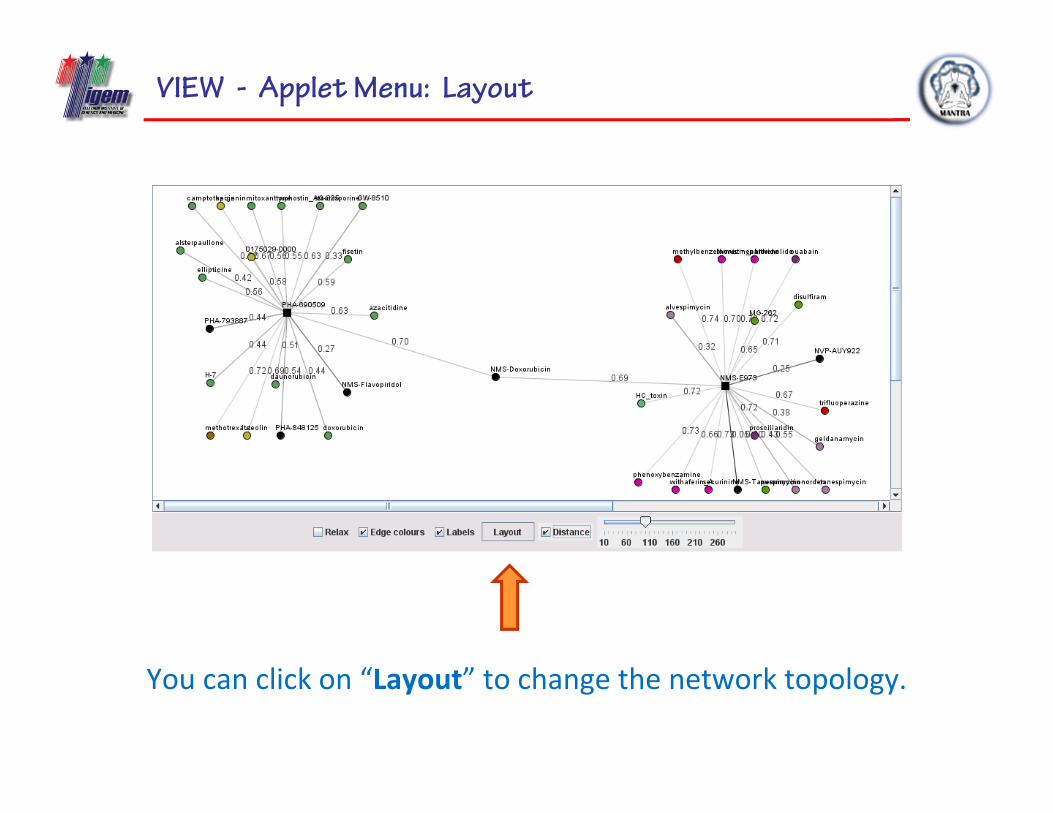
VIEW - Applet Menu: Layout
You can click on “Layout” to change the network topology.
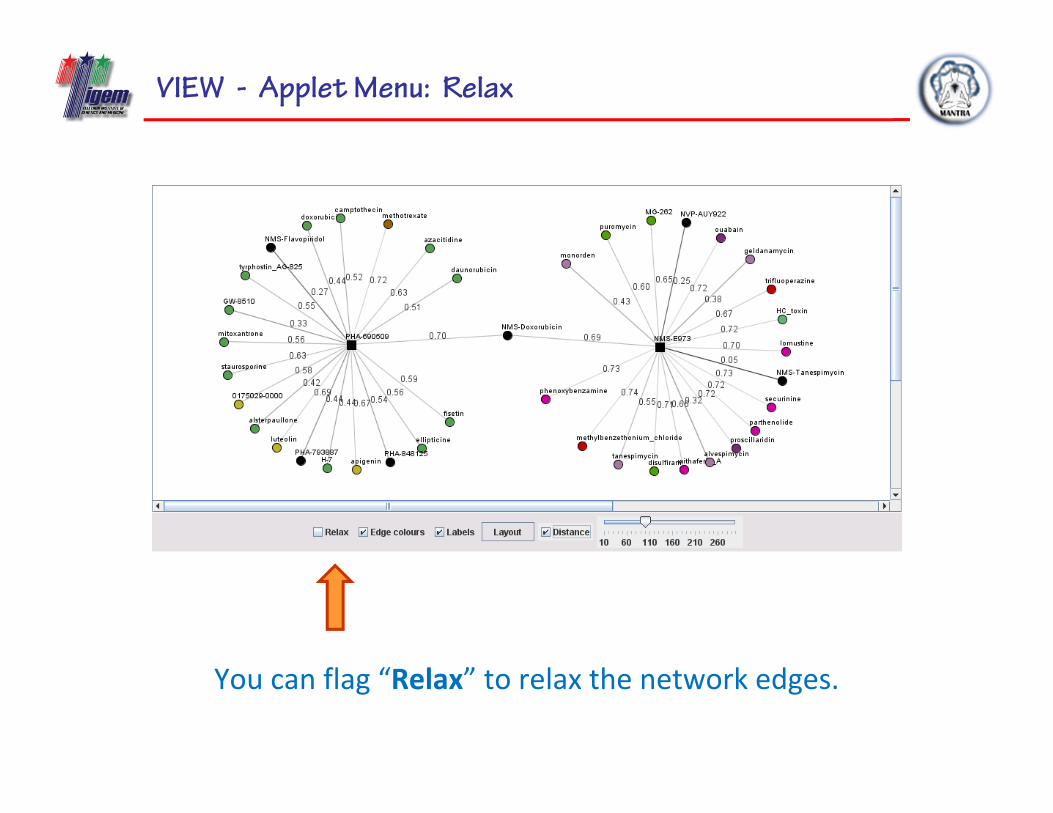
VIEW - Applet Menu: Relax
You can flag “Relax” to relax the network edges.
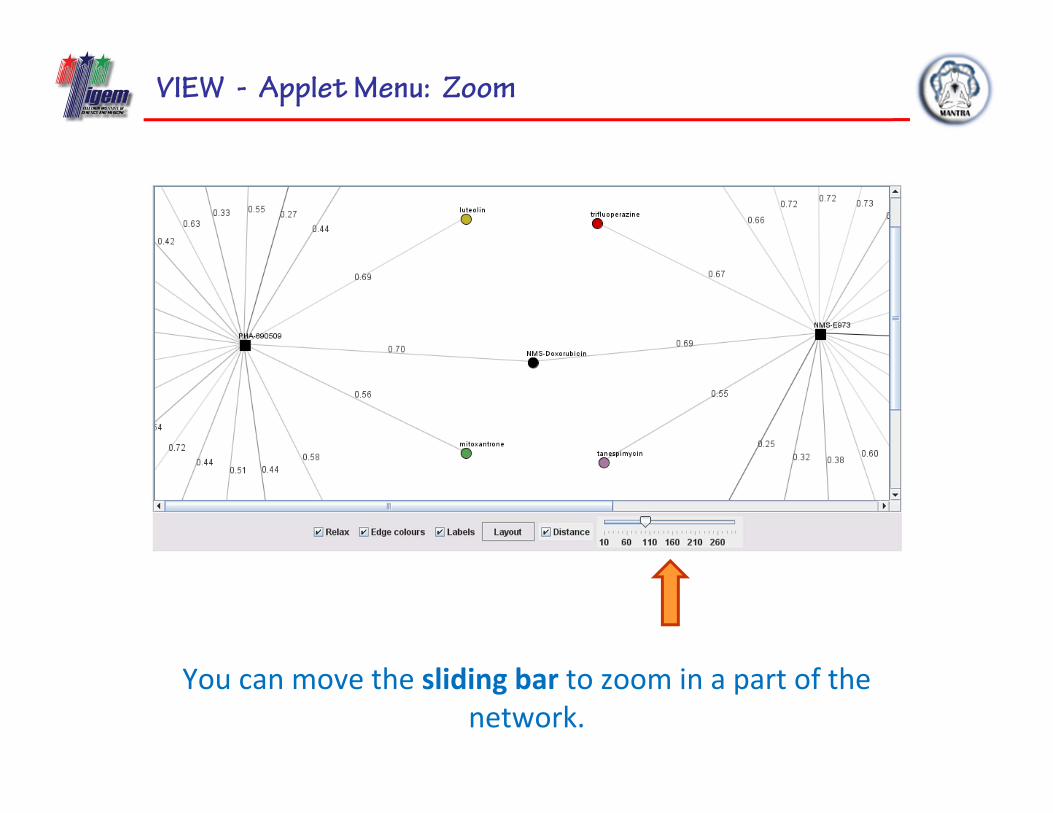
VIEW - Applet Menu: Zoom
You can move the sliding bar to zoom in a part of the network.
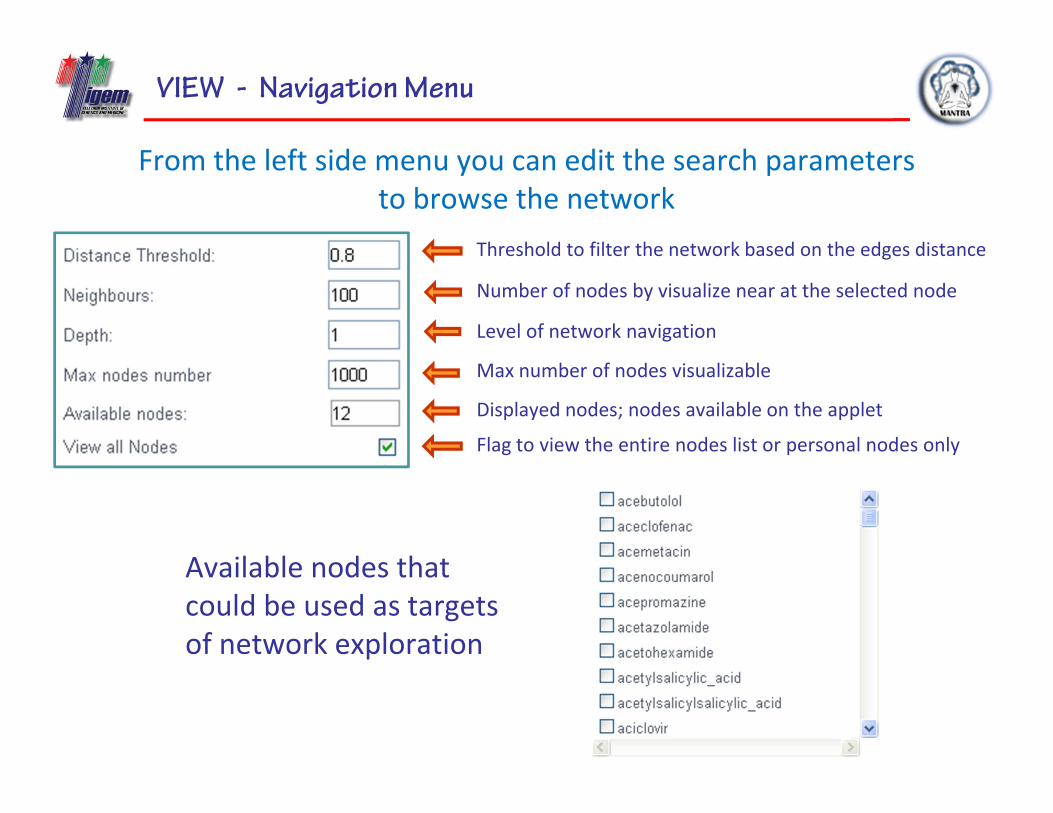
VIEW - Navigation Menu
From the left side menu you can edit the search parameters to browse the network
Threshold to filter the network based on the edges distance
Number of nodes by visualize near at the selected node
Level of network navigation
Max number of nodes visualizable
Displayed nodes; nodes available on the applet
Flag to view the entire nodes list or personal nodes only
Available nodes that could be used as targets of network exploration
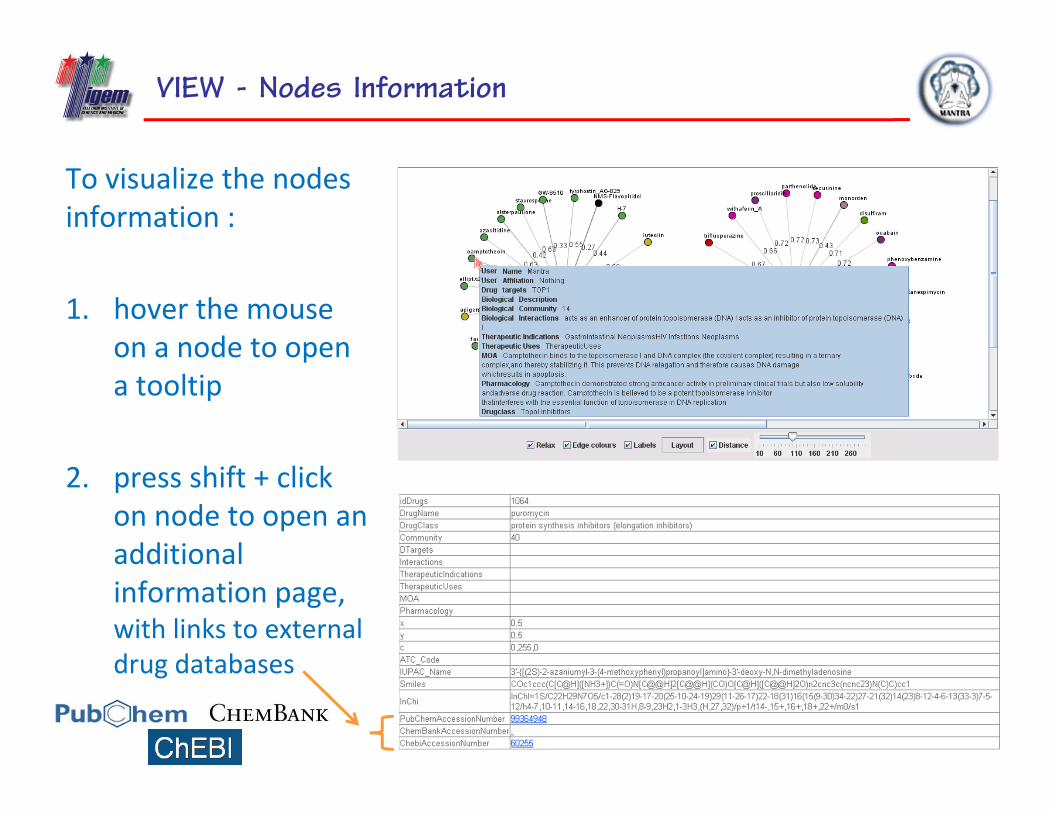
VIEW - Nodes Information
To visualize the nodes information :
1. hover the mouse on a node to open a tooltip
2. press shift + click on node to open an additional information page,with links to external drug databases
OUTLINE
1. MANTRA Web Tool2. Analysis
a) New Experimentb) New Nodec) GSEA
3. Networka) Viewb) Button Panel
4. Search5. In Summary6. Conclusion
BUTTON PANEL
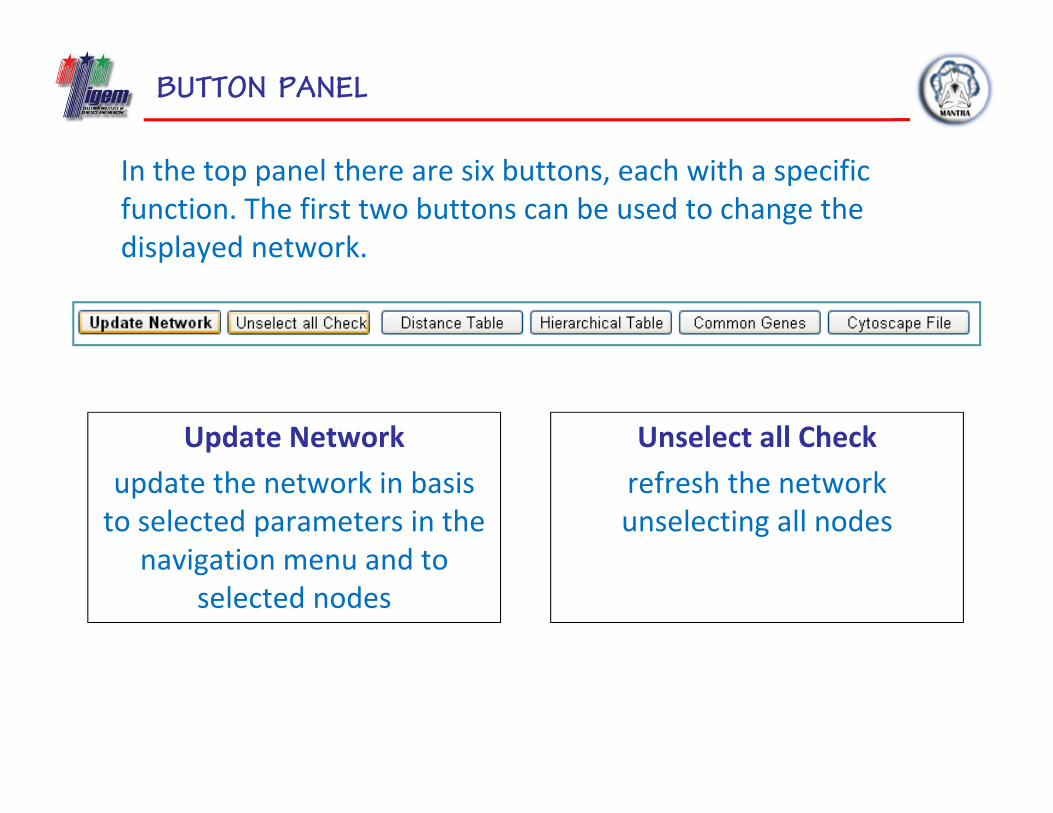
In the top panel there are six buttons, each with a specific function. The first two buttons can be used to change the displayed network.
Update Networkupdate the network in basis to selected parameters in the
navigation menu and to selected nodes
Unselect all Checkrefresh the network unselecting all nodes
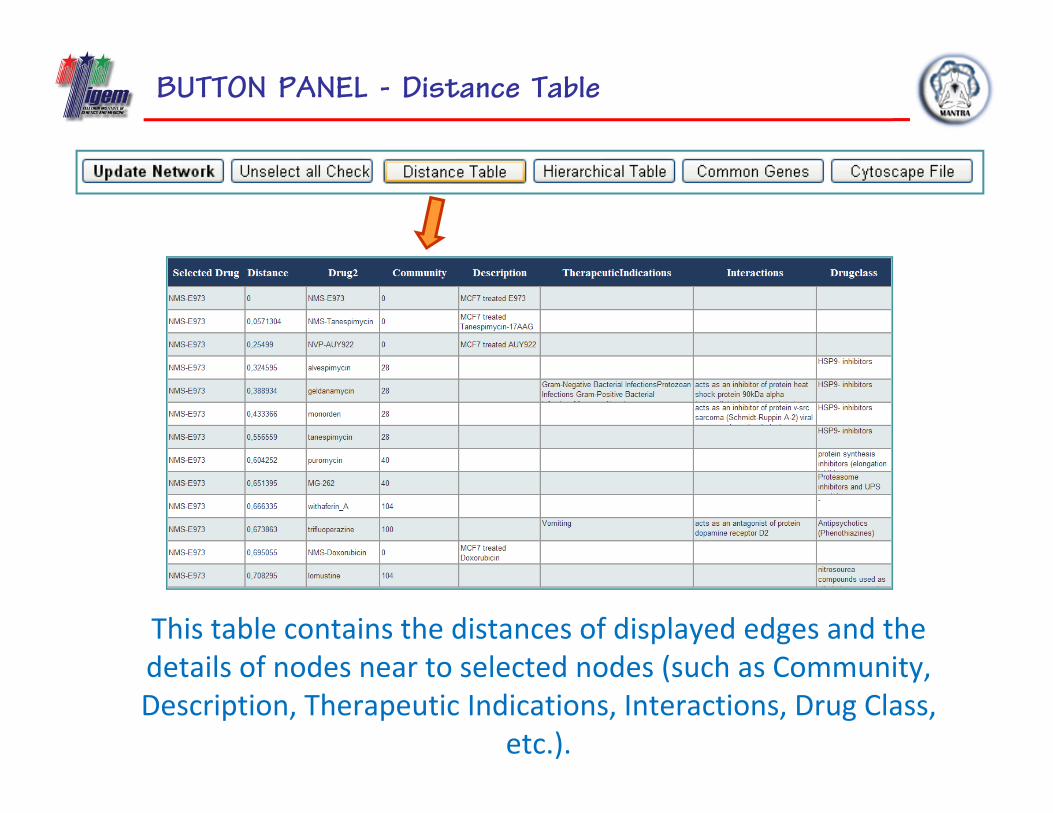
BUTTON PANEL - Distance Table
This table contains the distances of displayed edges and the details of nodes near to selected nodes (such as Community, Description, Therapeutic Indications, Interactions, Drug Class,
etc.).
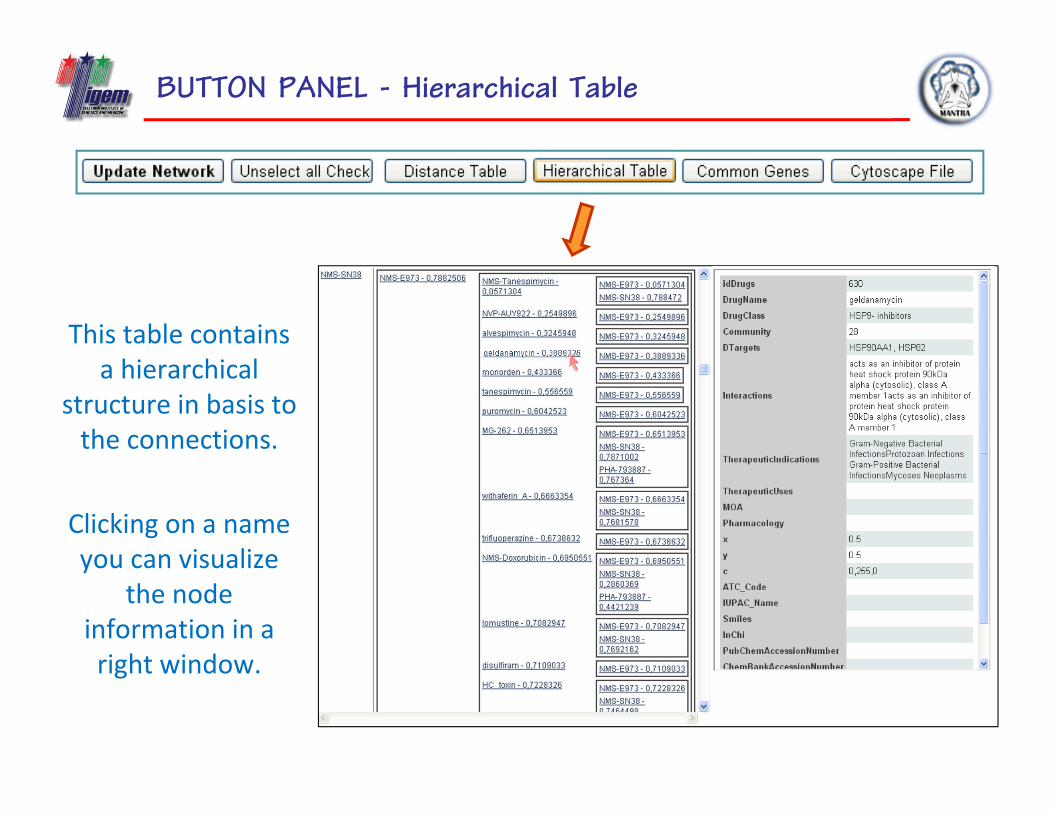
BUTTON PANEL - Hierarchical Table
This table contains a hierarchical
structure in basis to the connections.
Clicking on a name you can visualize
the node information in a right window.
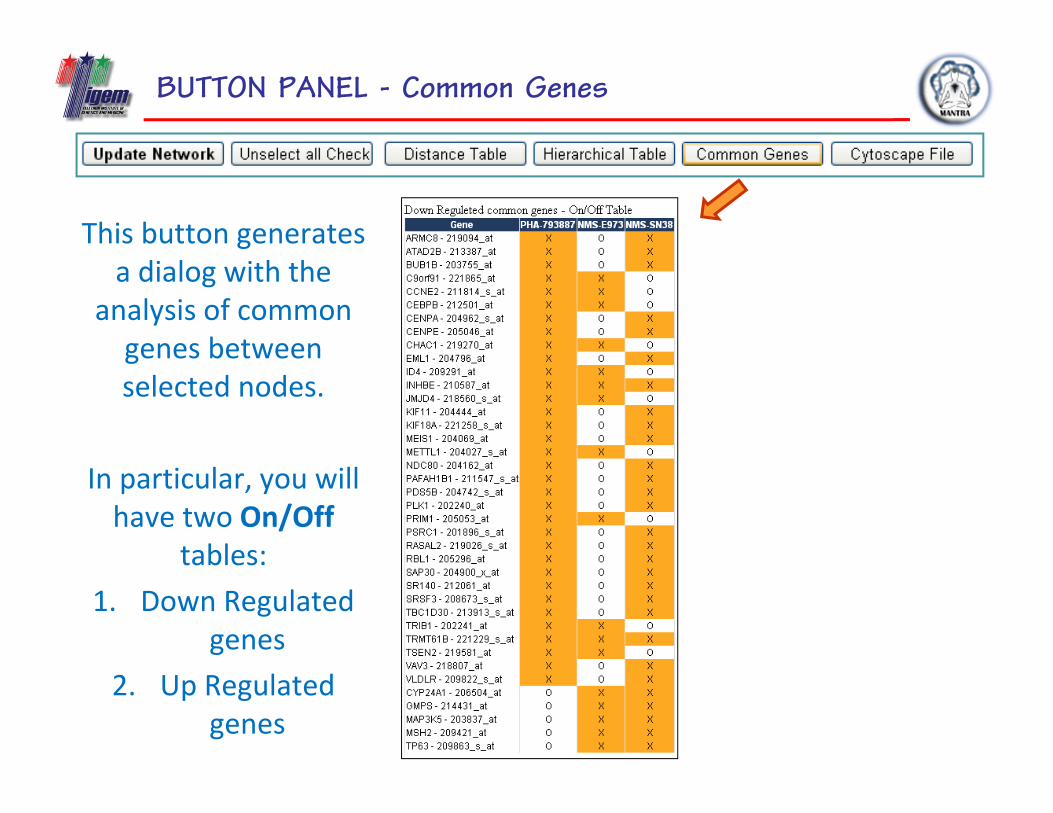
BUTTON PANEL - Common Genes
This button generates a dialog with the
analysis of common genes between selected nodes.
In particular, you will have two On/Off
tables:1. Down Regulated
genes2. Up Regulated
genes
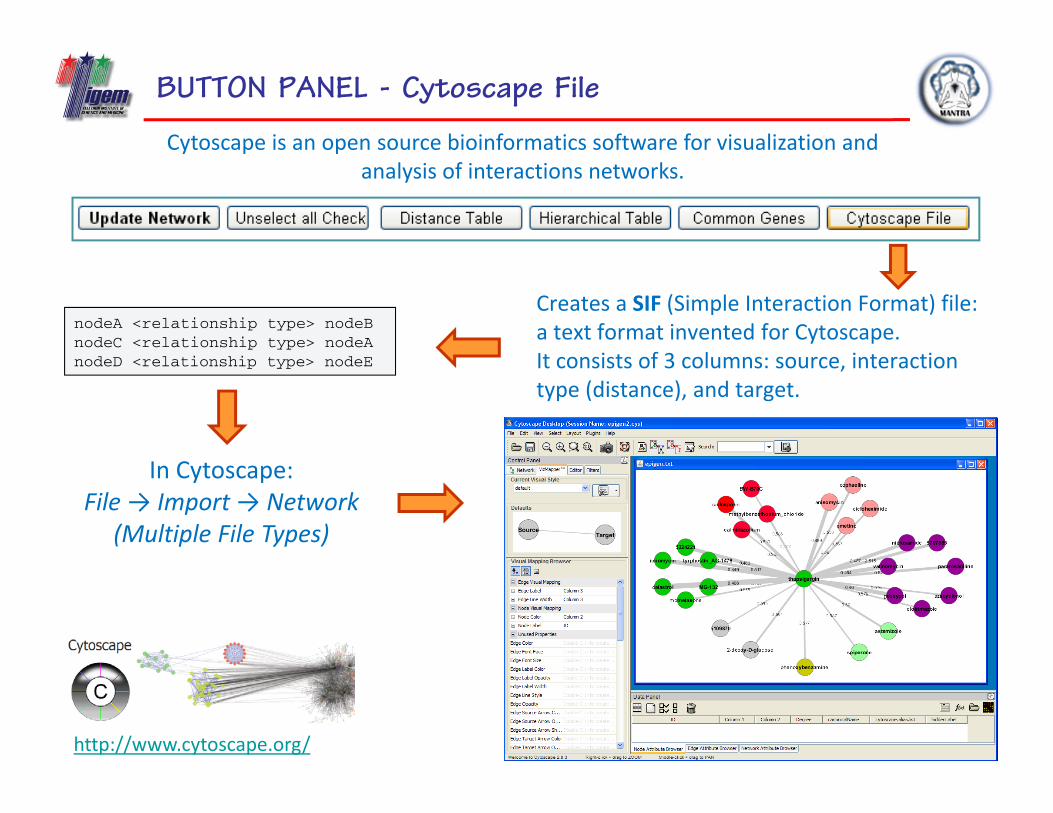
BUTTON PANEL - Cytoscape File
http://www.cytoscape.org/
nodeA <relationship type> nodeBnodeC <relationship type> nodeAnodeD <relationship type> nodeE
Creates a SIF (Simple Interaction Format) file: a text format invented for Cytoscape. It consists of 3 columns: source, interaction type (distance), and target.
In Cytoscape:File → Import → Network
(Multiple File Types)
Cytoscape is an open source bioinformatics software for visualization and analysis of interactions networks.
OUTLINE
1. MANTRA Web Tool2. Analysis
a) New Experimentb) New Nodec) GSEA
3. Networka) Viewb) Button Panel
4. Search5. In Summary6. Conclusion
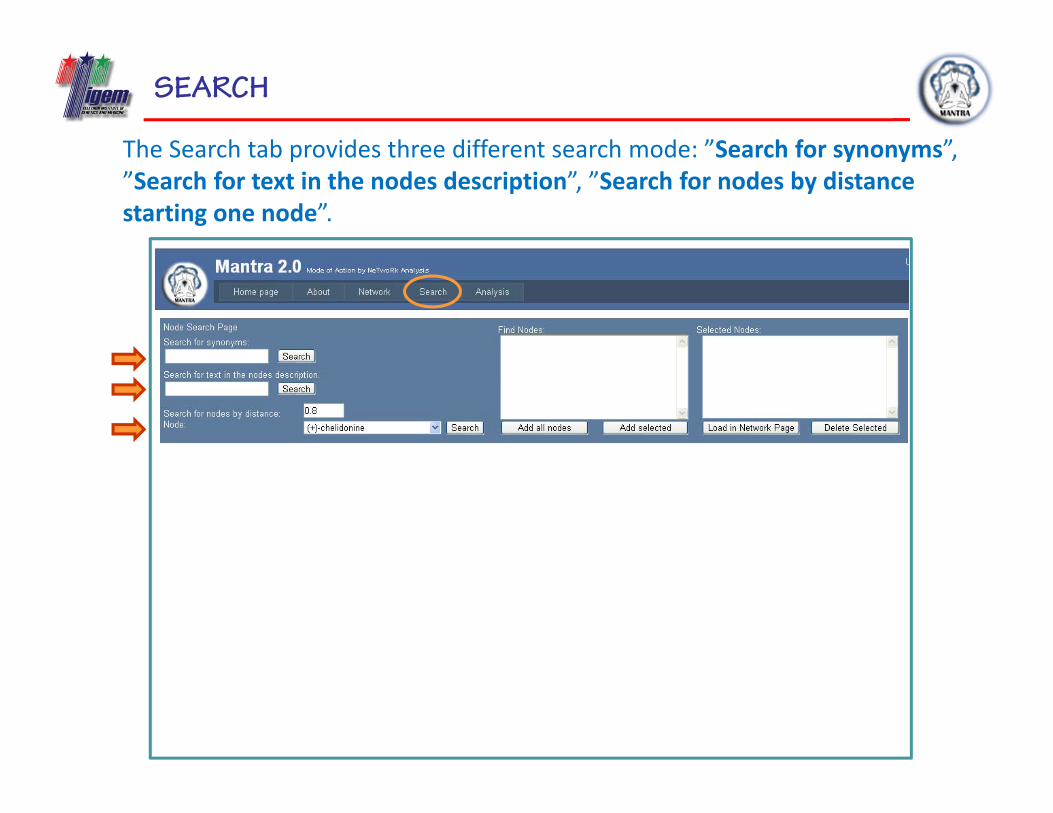
SEARCH
The Search tab provides three different search mode: ”Search for synonyms”, ”Search for text in the nodes description”, ”Search for nodes by distance starting one node”.
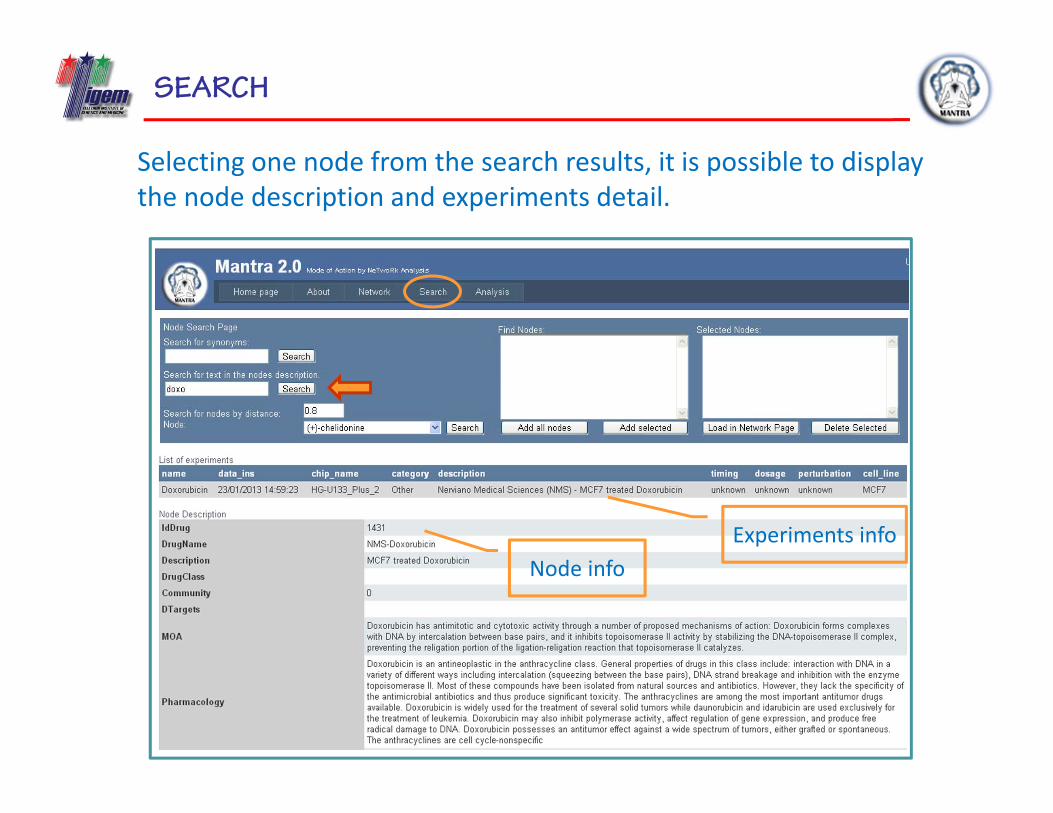
SEARCH
Selecting one node from the search results, it is possible to display the node description and experiments detail.
Experiments infoNode info
SEARCH
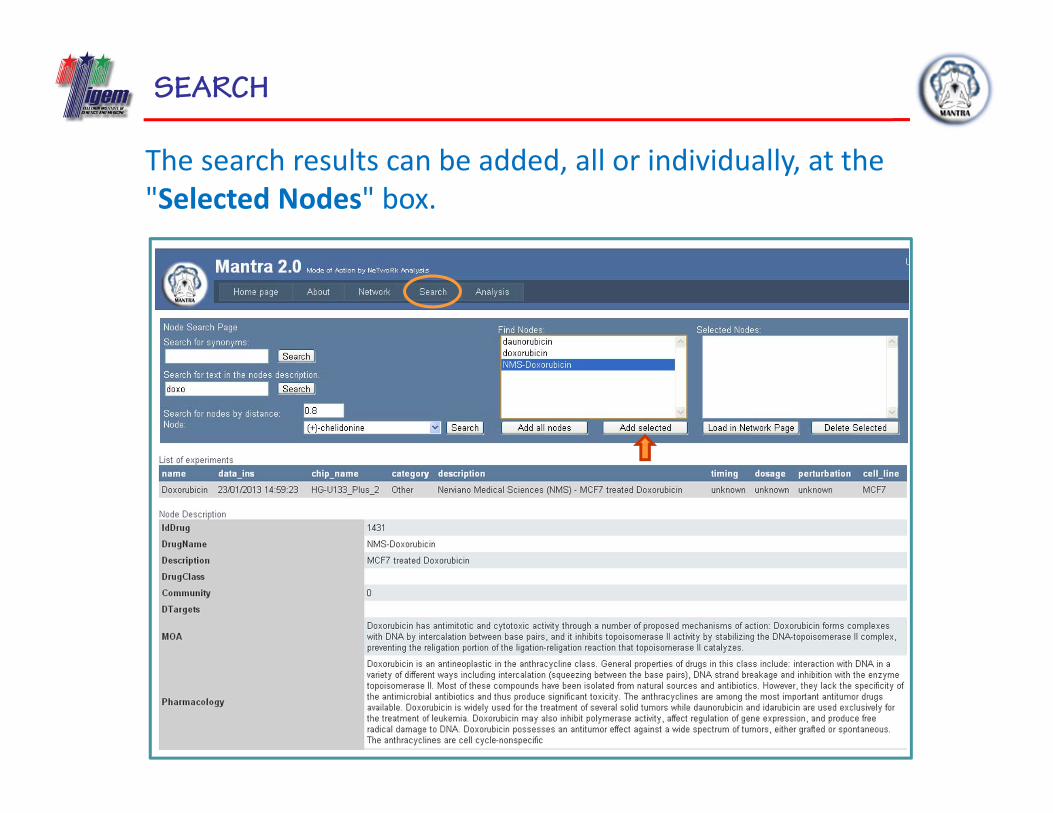
The search results can be added, all or individually, at the "Selected Nodes" box.
SEARCH
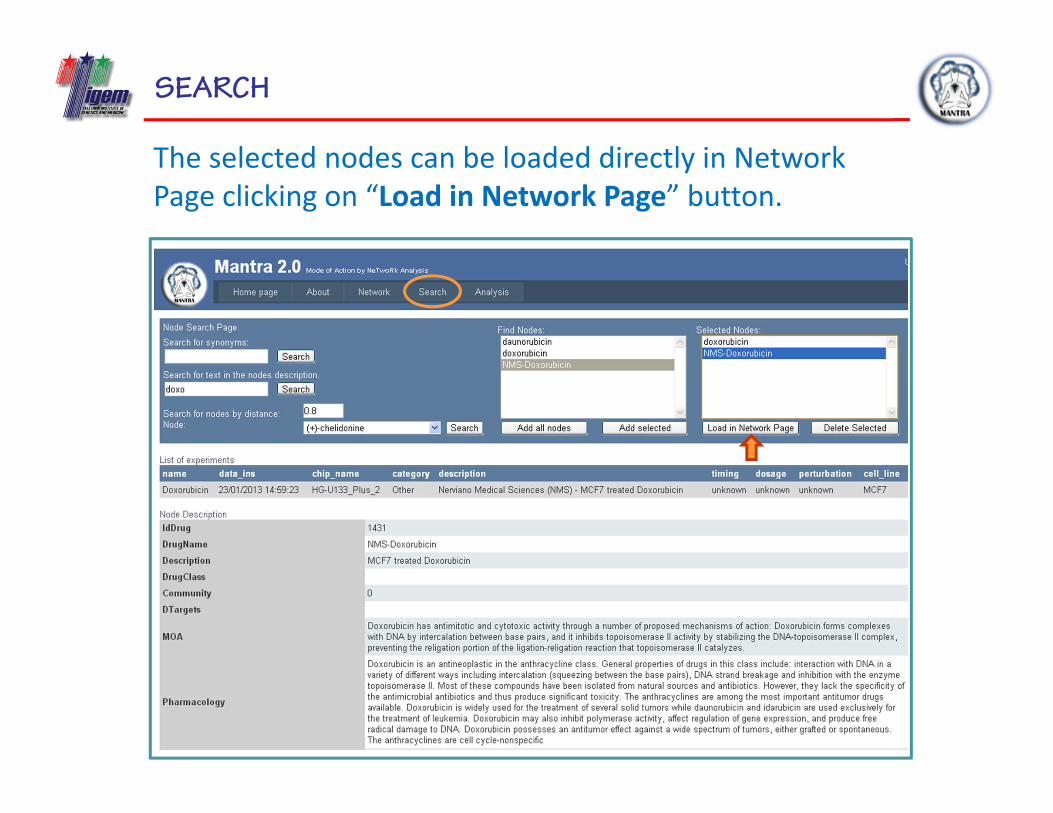
The selected nodes can be loaded directly in Network Page clicking on “Load in Network Page” button.
SEARCH
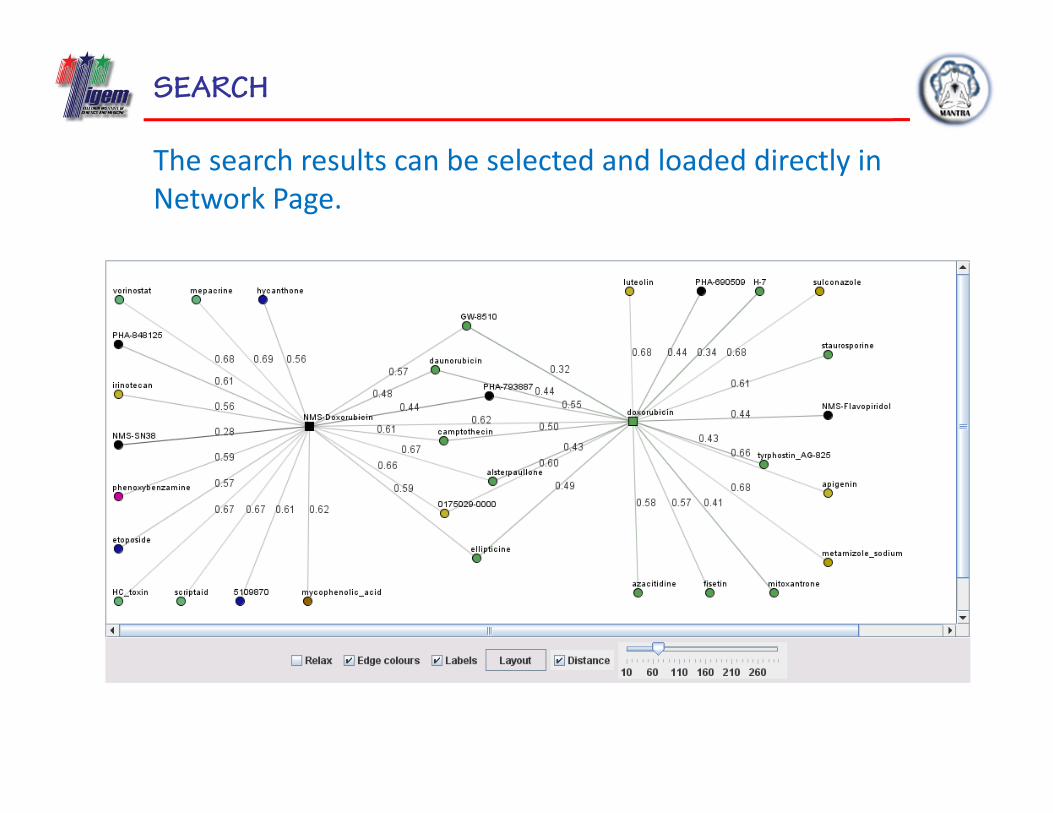
The search results can be selected and loaded directly in Network Page.
OUTLINE
1. MANTRA Web Tool2. Analysis
a) New Experimentb) New Nodec) GSEA
3. Networka) Viewb) Button Panel
4. Search5. In Summary6. Conclusion
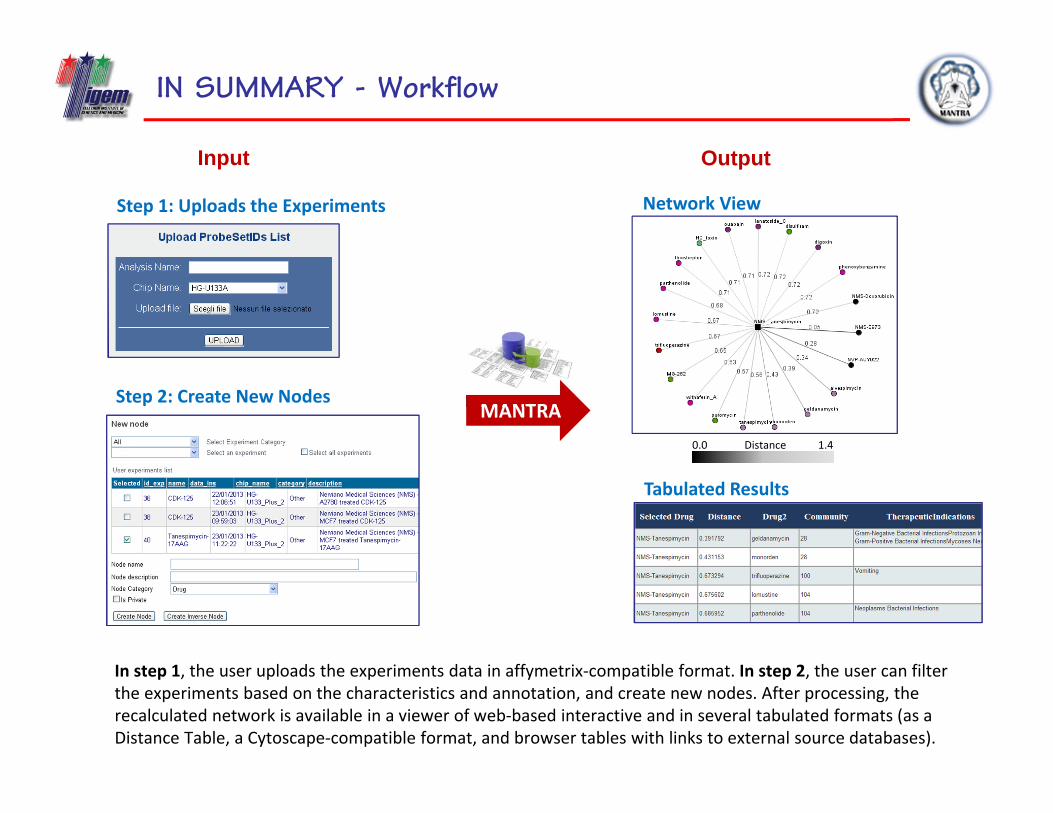
IN SUMMARY - Workflow
In step 1, the user uploads the experiments data in affymetrix‐compatible format. In step 2, the user can filter the experiments based on the characteristics and annotation, and create new nodes. After processing, the recalculated network is available in a viewer of web‐based interactive and in several tabulated formats (as a Distance Table, a Cytoscape‐compatible format, and browser tables with links to external source databases).
Input Output
Step 1: Uploads the Experiments
Step 2: Create New NodesMANTRA
0.0 Distance 1.4
Tabulated Results
Network View
OUTLINE
1. MANTRA Web Tool2. Analysis
a) New Experimentb) New Nodec) GSEA
3. Networka) Viewb) Button Panel
4. Search5. In Summary6. Conclusion
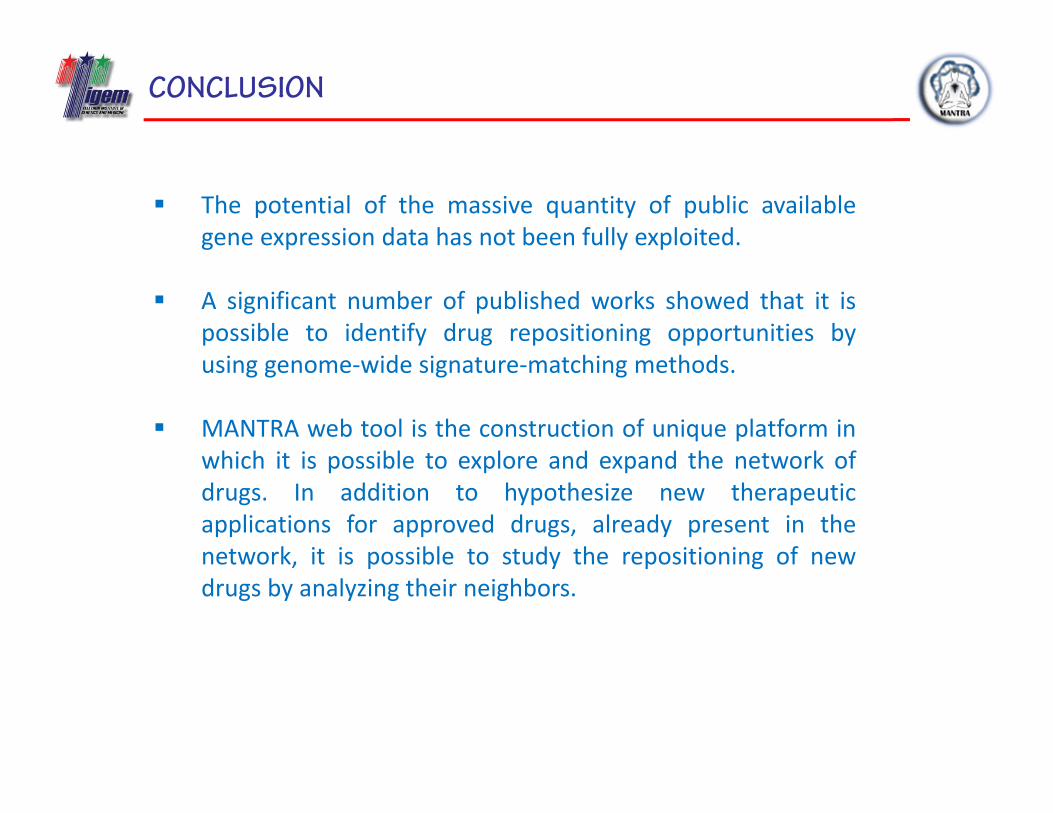
CONCLUSION
The potential of the massive quantity of public availablegene expression data has not been fully exploited.
A significant number of published works showed that it ispossible to identify drug repositioning opportunities byusing genome‐wide signature‐matching methods.
MANTRA web tool is the construction of unique platform inwhich it is possible to explore and expand the network ofdrugs. In addition to hypothesize new therapeuticapplications for approved drugs, already present in thenetwork, it is possible to study the repositioning of newdrugs by analyzing their neighbors.