Manpasand Beverages - Rakesh...
36
Juicing it up Manpasand Beverages Initiating Coverage | 24 June 2016 Sector: Consumer Investors are advised to refer through important disclosures made at the last page of the Research Report. Motilal Oswal research is available on www.motilaloswal.com/Institutional-Equities, Bloomberg, Thomson Reuters, Factset and S&P Capital. Chintan Modi ([email protected]); +9122 39825422 / Kaustubh Kale Niket Shah ([email protected]); +91 22 3982 5426
Transcript of Manpasand Beverages - Rakesh...

Juicing it up
Manpasand Beverages
Initiating Coverage | 24 June 2016Sector: Consumer
Investors are advised to refer through important disclosures made at the last page of the Research Report.Motilal Oswal research is available on www.motilaloswal.com/Institutional-Equities, Bloomberg, Thomson Reuters, Factset and S&P Capital.
Chintan Modi ([email protected]); +9122 39825422 / Kaustubh KaleNiket Shah ([email protected]); +91 22 3982 5426

Manpasand Beverages
24 June 2016 2
Contents: Manpasand Beverages | Juicing it up
Summary ................................................................... ..........................................3
Company overview ............................................................................................... 5
Fruits Up and Coco Sip to reduce seasonality and improve utilization .................... 7
Expanding capacities by 80% over FY16-18 .......................................................... 12
Distribution thrust to enhance brand visibility .................................................... 14
Earnings to post 63% CAGR over FY16–18 ........................................................... 18
Valuation and view............................................................................................. 20
Bull & Bear case ................................................................................................. 22
Industry overview .............................................................................................. 24
Key risks ............................................................................................................. 31
Management overview ....................................................................................... 32
Financials and Valuation s.................................................................................... 33

Manpasand Beverages
24 June 2016 3
Manpasand Beverages (MANB) is leading player in beverages segment through its flagship product Mango Sip, a mango-based fruit drink launched in 1997. The product contributed 80% to revenues in FY16 (97% in FY14). To diversify the portfolio, MANB launched Fruits Up in FY15, a premium fruit drink (Carbonated and non-carbonated) in mango, litchi, guava, apple, orange and mixed fruit flavors. It recently launched its natural coconut water through brand Coco Sip in May 2016. In 2015, it raised INR 4b through IPO to set up a manufacturing facility in Haryana (INR.1.5b), modernization of existing plants and repay the entire long-term debt (INR1b).
Juicing it up Expanding capacity by 80% over FY16-18 to bolster growth
MANB is expected to improve its market share from 5% in 2016 and 7.5% in 2018in INR 132bn fruit juice market.
Low penetration of 30% and per capita annual consumption of soft drinks in Indiaat 16 ltrs v/s 166 ltrs in the US, provide significant market opportunities forgrowth.
Mango sip has been able to gain significant market share over last few years onback of its strategy to focus on rural India which contributes 55% of revenues.
MANB expanded the product portfolio by launching Fruits Up (Carbonated andnon-carbonated) in FY15 which now contributes 20% to revenues in FY16. Itrecently launched natural coconut water under brand Coco Sip.
It has 200,000 retailers, 2,000 distributors, 200+ super stockists, and plans to add500–1000 distributors in the medium term with a special focus on south Indiawhere it has a low penetration.
Strategically expanding its capacities by 80% over FY16-18 (capex of INR3.2b) intonorth and south India will not only address the supply side issues but also help toreduce logistics cost and improve working capital cycle going forward.
MANB to clock 49% revenue CAGR and 63% PAT CAGR over FY16-18E. We valuethe stock at PE of 28x FY18 EPS (~0.3x PEG v/s ~ 1.6x of consumer peers). Weinitiate coverage with a ‘Buy’ with TP of INR750 (~44% upside).
Set to gain market share in INR 132b fruit juice market Within overall soft drink market size of INR524b (as on 2015), MANB participates in fruit juice category, an INR132b size market with expected growth of 19% CAGR over 2015-18. We expect MANB to grow at 49% CAGR driven by new product launches, increased distribution reach and increased capacities leading to increase its market share from 5% in 2016 to 7.5% by 2018. With 70% of the market being untapped and per capita consumption of soft drinks in India is just 16 ltrs v/s 166 ltrs in the US, opportunities is very significant. Gestation in the beverages space is long as brands take longer time to develop and withstand competition, resulting in the survival of few players.
Initiating Coverage | Sector: Consumer
Manpasand Beverages CMP: INR520 TP: INR750 (+44%) Buy BSE Sensex S&P CNX
26,398 8,089
Stock Info Bloomberg MANB IN Equity Shares (m) 50.1 52-Week Range (INR) 588/286 M.Cap. (INR b) 26.1 M.Cap. (USD b) 0.4 1, 6, 12 Rel. Per (%) -3/16/-Avg Val, (INR m) 31 Free float (%) 49.6
Financial Snapshot (INR b) Y/E Mar 2016 2017E 2018E Sales 5.6 8.4 12.3 EBITDA 1.1 1.7 2.5 NP 0.5 0.8 1.3 EPS (Rs) 10.1 16.7 26.8 EPS Gr. (%) 26.7 65.0 60.6 BV/Sh. (INR) 120.2 135.2 159.3 RoE (%) 11.4 11.6 16.2 RoCE (%) 12.2 13.1 18.2 P/E (x) 51.5 31.2 19.4 P/BV (x) 4.3 3.8 3.3
Shareholding pattern (%) As On Mar-16 Dec-15 Sep-15
Promoter 50.4 50.4 50.4
Public 49.6 49.6 49.6
Others - - -
Manpasand Beverages Juicing it up
Please click here for Video Link

Manpasand Beverages
24 June 2016 4
Ramp up of new products to drive utilization, beat seasonality After stellar success of Mango Sip with a view to diversify its product portfolio MANB launched Fruits Up (Carbonated and non-Carbonated) in FY15, a premium fruit drink (pulp content of 16–17%) in multiple flavors. We believe Fruits Up will move from urban to rural vis a vis Mango Sip which will move from rural to urban over the medium to long term. We believe Fruits Up is positioned to tap the shift in consumption pattern from artificial flavor based drinks (Coke and Pepsi) to natural fruit based drink providing huge opportunity. MANB recently launched Coco Sip first of its kind natural coconut water in May 2016 for non-south markets to be manufactured through outsourcing model. The company derives ~70% of revenues during 1Q and 4Q owing to seasonality of Mango Sip. With expansion of product portfolio over last 2 years we expect capacity utilization to inch up from 55% in FY16 to ~58% in FY18 on expanded capacity as Fruits Up and Coco Sip would be marketed as a year round product. MANB has a strong product pipeline of newer product launches over next few years in the funnel which will help MANB further diversify its product concentration and reduce seasonality.
Expanding capacities by 80% over FY16–18 to address supply side issues MANB has planned to increase its capacity by 80% over FY16–18 (58% increase for fruit drinks and 300% for carbonated fruit drinks) increasing capacity from 125,000 in FY16 to 225,000 cases per day in FY18. New facilities in Haryana, Dehradun and existing Varanasi plant, would cater to north and north east, while facilities in Vadodara would cater to west and south. It also plans to set up new capacities in south India in FY18. Capacity constraints and preference for geographical diversity vis-à-vis regional concentration led to stock out situation for both Mango Sip and Fruits Up over last few years. We believe MANB strategy to open new facilities in north and south India will not only address the supply side issues but also reduce logistics cost and improve working capital cycle going forward.
Increased focus on distribution to result in higher visibility MANB’s key differentiator vis-à-vis global MNCs is presence at a lower price point through wide range of SKUS of 80–100 ml tetra packs (INR10) and pet bottle of 250 ml (INR15) and strong rural focus. In addition, MANB offers higher margins of 30–35% vis-à-vis 20–22% for global MNCs. MANB has a strong presence in railways, which accounts for ~20% of revenues and enhances visibility. It has 200,000 retailers, 2,000 distributors, 200+ super stockists, and expects to add 500–1000 distributors in the medium term with higher focus on less penetrated south India market. Leaders in the space like Coca Cola and Pepsico have reach of 2.6m and 2.5m retails outlets respectively. Recently MANB has started tapping urban markets by offering its products through modern trade and on-trade channels.
Valuation and view; At an inflexion point, Growth set to accelerate MANB is on the cusp of a high growth cycle, led by capacity expansion, new product launches and increase in distribution network, which should lead to market share gains from 5% in 2016 to 7.5% in 2018. Launch of Fruits Up and Coco Sip is expected to beat seasonality and ramp up capacity utilization thereby driving margins higher. We expect sales and PAT CAGR of 49% and 63% respectively. The stock trades at PE of 31x/19x FY17/18E EPS. We value the stock at PE of 28x FY18 EPS (~0.3x PEG v/s ~ 1.6x of consumer peers). We initiate coverage with a ‘Buy’ with TP of INR750 (~44% upside).
400 1,080 2,327 3,623
170
123
65
FY15 FY16 FY17E FY18E
Fruits up Growth %
72.5 125 177.5 225.0
55 55 56
58
FY15 FY16 FY17E FY18E
Capacity (cases/day,'000)Utilisation (%)
Rural, 55%
Urban, 45%
Stock Performance (one-year)

Manpasand Beverages
24 June 2016 5
Company overview
Sole beverage player listed in India MANB has the unique distinction of being the sole listed company in the beverages sector. The company’s revenue expanded at a CAGR of 60% over FY12–16, while net profit grew 70% during the same period.
India’s leading beverage manufacturer MANB primarily focuses on mango-based drinks. Mango Sip, launched in 1997, is the company’s flagship product, contributing 80% to revenues in FY16 (97% in FY14). Mango Sip is strategically focused on semi-urban and rural markets; MANB derives ~55% of revenues from rural areas, 20–22% through railways and the remaining from urban areas.
Exhibit 1: MANB’s brands
Source: Company, MOSL
To diversify the portfolio, the company launched Fruits Up and Manpasand ORS as well as commenced the marketing of Pure Sip bottled water in July 2014. Under Fruits Up, MANB offers premium fruit and carbonated drinks in various flavors; through Manpasand ORS, the company provides fruit drinks (apple and orange flavors) with energy-replenishing qualities across northeast India. Fruits Up is currently available in mango, apple, guava, litchi, orange and mixed fruit flavors; the packaging of Fruits Up carbonated fruit drinks, available in grape, orange and lemon flavors, is similar to Thums Up, Mirinda and Sprite.
Five manufacturing facilities by FY18 MANB had three manufacturing facilities at the end of FY16: two at Vadodara and one in Varanasi; the second unit at Vadodara commenced production in April 2015. The company is also setting up a facility in Haryana (expected to be commissioned by June FY17) to cater to markets in north and northeast India. Another facility in Dehradun is scheduled to start production by Q4FY17. Management has highlighted plans to commission a facility in South India as well towards end of FY18.

Manpasand Beverages
24 June 2016 6
IPO proceeds to be primarily utilized for Haryana facility and paring debt In 2015, MANB raised INR4b through an IPO, primarily to set up a manufacturing facility at Haryana (INR1.5b) and pare long-term debt (totaling INR1b). The Haryana facility has a production capacity of 10,000 tetra pack cases (TPC) and 20,000 pet bottle cases (PBC) per day of fruit drinks and 20,000 PBC per day of carbonated fruit drinks. MANB turned debt-free in 4QFY16 by repaying the long-term debt of INR1b from IPO proceeds. The balance proceeds are expected to be utilized for modernization of facilities at Vadodara and Varanasi (INR0.4b), and setting up a corporate office at Vadodara (INR0.2b). Going forward, management expects working capital-related borrowings to be the only debt.
Exhibit 2: Summary of utilization of IPO proceeds INR m
IPO proceeds 4,000
New manufacturing facility – Ambala, Haryana (1,523)
Paring debt (1,009)
Modernization of existing manufacturing facilities – Vadodara I and Varanasi (389)
New corporate office at Vadodara (221)
General corporate expenses (857)
Source: MOSL, Company

Manpasand Beverages
24 June 2016 7
Fruits Up and Coco Sip to reduce seasonality and improve utilization Additions to product portfolio for enhancing market presence
Mango Sip has been the company’s flagship product since the launch in 1997 in UttarPradesh, and slowly extended to other parts of India (24 states).
Revenues from Mango Sip registered a robust CAGR of 51% over FY12–16, led by the4.5x increase in capacity and increased distribution network.
MANB launched Fruits Up range of premium fruit drinks (pulp content of 16–17%) andfruit-based carbonate drinks in 2015 that expand opportunity size.
While Mango Sip was targeted as a rural product, Fruits Up with premium flavors(such as guava and litchi) and fruit-based carbonates are considered more urban innature.
As capacities are fungible, addition of products would help beat seasonality and rampup utilization from 55% in FY16 to ~58% in FY18, along with expanded capacities infruit drinks, and carbonates.
Expansion of the product portfolio lowers risks related to seasonality, since Fruits Upwill be marketed as a year round product compared to Mango Sip.
Mango Sip – an existing money spinner with strong presence in rural India MANB launched Mango Sip, a mango-based drink, in 1997. The product was initially introduced in Uttar Pradesh, and then gradually diversified across the north and other parts of India, such that it is now available in 24 states. Mango Sip was largely targeted at Tier II and Tier III cities and has a strong rural presence (55–56% of sales from this channel). Besides, IRCTC comprises 20–22% of revenues, with urban areas accounting for the rest. A strong rural focus reduces competition as Tier II and Tier III cities are not focus areas for Maaza and Slice that are more urban-centric.
Exhibit 3: SKU-wise comparison of Mango Sip with peers (INR) SKU (ml) Mango Sip Frooti Tropicana Slice Maaza
80–100 5 5 Not present Not present
160 10 10 Not present Not present
200 14 14 14 17
500–600 35 34 32 33
1200 60 62 64 64
Pulp content 14% 16% 13.6% 19%
Source: Company, MOSL
Key reasons for Mango Sip gaining market share as per our channel checks are as follows: 1) Company has around 75 SKUs for Mango Sip and Fruits Up put together, highest
by any player in the market.2) MANB derives 40% of revenues from below 200ml size of SKUs, an area where
competition like Maaza and Slice is not present.3) MANB provides higher distributor and retail margins to the tune of 35% v/s 22%
for MNC players.4) MANB keeps the channel starving for products thereby generating pricing
power.

Manpasand Beverages
24 June 2016 8
Exhibit 4: Mango Sip revenues to post 34% CAGR over FY16–18
Source: Company, MOSL
Differentiated product strategy in affordable small packs MANB offers fruit drinks in small packs—small tetra packs (also known as tetra classic aseptic) of 80–100 ml, and pet bottle and tetra pack of 160 ml—where global competitors are not present. The segmental margins are inferior due to lower prices and proportionately higher costs, such as packaging, which discourages global giants like Coca Cola (Maaza) and Pepsico (Tropicana Slice). With Mango Sip, largely a rural focused drink, MANB’s offering at affordable prices (INR5 for 80–100 ml and INR10 for 160 ml) helps in acquiring customers and retaining them at a lower price point.
Exhibit 5: Small packs a key differentiator SKU (ml) Mango Sip Frooti Tropicana Slice Maaza
80–100 5 5 Not present Not present
160 10 10 Not present Not present
Source: Company, MOSL
Exhibit 6: Various SKUs of Mango Sip: From 80 ml small tetra classic pack to 1200 ml PET bottle
Source: Company, MOSL
857 2,345 2,850 3,069
4,487 5,983
8,053 174%
22% 8%
46% 33% 35%
FY12
FY13
FY14
FY15
FY16
FY17
E
FY18
E
Mango SIP Growth %

Manpasand Beverages
24 June 2016 9
Fruits Up – Positioned to capitalize on shift from flavored based drinks MANB intends to capitalize on the gradual shift in consumer preferences from flavored based drinks (Coke and Pepsi) to natural fruit based drinks, including carbonated fruit drinks, and thereby expand market share and products. Accordingly, the company launched Fruits Up, a premium fruit drink under various flavors, including versions of carbonated beverages in FY15. Fruits Up is available in mango, apple, guava, litchi, orange and mixed fruit flavors, while Fruits Up carbonated fruit drinks are available in grape, orange and lemon flavors.
In 2 years of its launch, the company has registered a turnover of INR 1.1bn (70% from non-carbonates and 30% from carbonates) in FY16 without any pan India marketing campaign. Also the company has set up separate dedicated distribution network for Fruits Up which will help individual teams to focus on scaling up the brand. We believe Fruits Up will move from urban to rural vis a vis Mango Sip which will move from rural to urban over the medium to long term.
Exhibit 7: SKUs for Fruits Up fruit drinks
Source: Company, MOSL
Packaging for carbonated drinks resembles famous brands such as Thums Up, Mirinda and Sprite. The product is expected to draw good response from health-conscious consumers seeking alternatives to cola drinks.
Exhibit 8: Comparison of Fruits Up carbonates with peers (INR) SKU MANB Pepsi Coke Thums up
250 ml PET 15 10 10 10
600 ml PET 40 34 30 34
250 ml CAN 30 25 25 25
Source: MOSL, Company

Manpasand Beverages
24 June 2016 10
Exhibit 9: Fruits Up carbonates
Source: Company, MOSL
Exhibit 10: Fruits Up to post 83% CAGR over FY16–18E
Source: Company, MOSL
Coco Sip- Virgin market with huge opportunity MANB in May 2016 launched its new product Coco Sip targeted for non-south markets. Coco Sip will be first of its kind natural coconut water without having any preservatives in it. The product will be available across SKUs size at affordable pricing starting INR 10 and will be manufactured through outsourcing model. Our channel checks suggest fresh coconut (water) in non-south markets are sold at INR 30-40 per coconut water and most of them are very small in size. It roughly costs around INR80k per truck to bring coconut water from south India to North India. Hence we believe there is a huge opportunity for MANB to launch natural coconut water at INR10 and grand the entire non-south market. We believe Coco Sip will clock revenues of INR 500mn in FY18 with margins of 20 %.
Pure Sip – Bottled water MANB commenced the marketing of Pure Sip bottled water in July 2014. The product is currently manufactured through a third-party in Vadodara. As of date, Pure Sip is being used as a trade incentive: as a combined offer with fruit drinks to distributors and retailers. Based on our discussion with management, we understand this initiative is for a longer term horizon of 4–5 years, and the company aims to diversify the product base and gradually gain visibility.
400 1,080 2,327 3,623
170%
115%
56%
FY15
FY16
FY17
E
FY18
E
Fruits up Growth %
Manpasand Beverages
24 June 2016 11
Exhibit 11: Pricing for Pure Sip vs. peers Brand MRP (INR) SKU (ml)
Pure Sip 20 1,000
Bisleri 20 1,000
Bailey 20 1,000
Aquafina 20 1,000
Kinley 20 1,000
Source: MOSL, Company
Manpasand ORS – An energy replenishing drink targeting the northeast The company launched Manpasand ORS fruit drinks with energy-replenishing qualities (apple and orange flavors) in July 2014. It is targeted at the northeastern markets. The product contributed 3.8% to total revenues in FY15. Mary Kom is the brand ambassador for Manpasand ORS. Management highlights the market size for ORS drinks is about INR2b, expanding at a CAGR of 10%. However, management has commented it is primarily focusing on Mango Sip and Fruits Up.
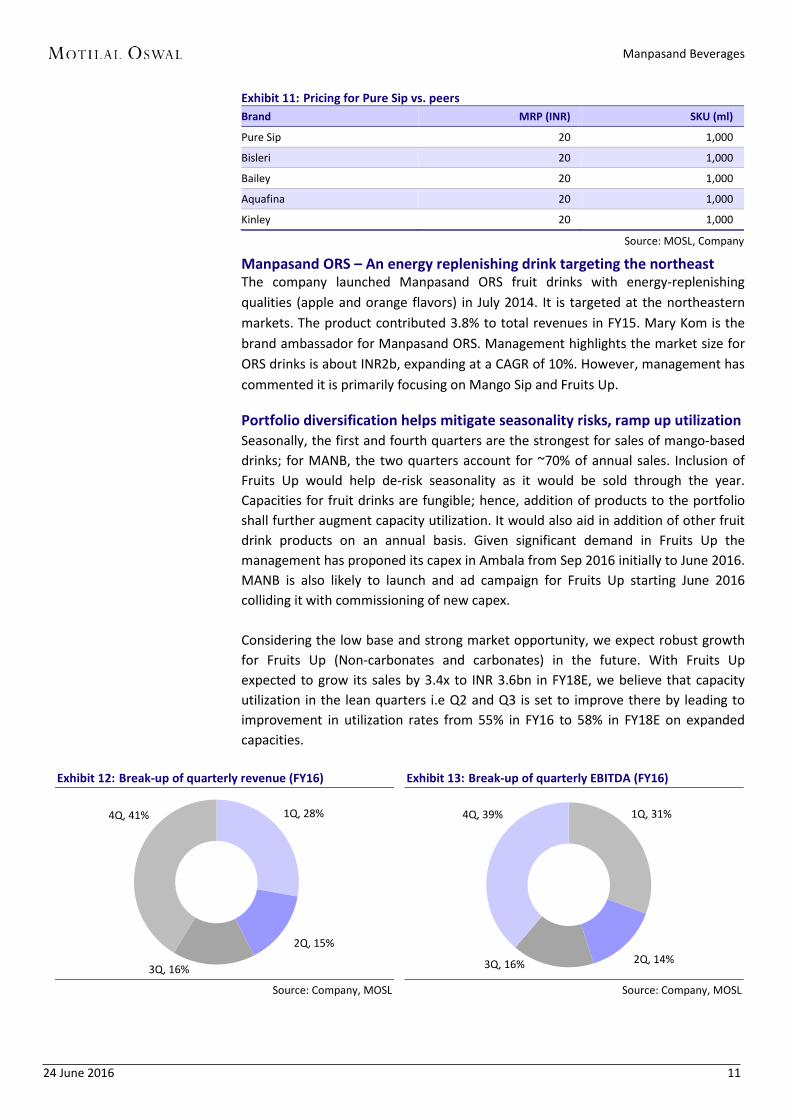
Portfolio diversification helps mitigate seasonality risks, ramp up utilization Seasonally, the first and fourth quarters are the strongest for sales of mango-based drinks; for MANB, the two quarters account for ~70% of annual sales. Inclusion of Fruits Up would help de-risk seasonality as it would be sold through the year. Capacities for fruit drinks are fungible; hence, addition of products to the portfolio shall further augment capacity utilization. It would also aid in addition of other fruit drink products on an annual basis. Given significant demand in Fruits Up the management has proponed its capex in Ambala from Sep 2016 initially to June 2016. MANB is also likely to launch and ad campaign for Fruits Up starting June 2016 colliding it with commissioning of new capex.
Considering the low base and strong market opportunity, we expect robust growth for Fruits Up (Non-carbonates and carbonates) in the future. With Fruits Up expected to grow its sales by 3.4x to INR 3.6bn in FY18E, we believe that capacity utilization in the lean quarters i.e Q2 and Q3 is set to improve there by leading to improvement in utilization rates from 55% in FY16 to 58% in FY18E on expanded capacities.
Exhibit 12: Break-up of quarterly revenue (FY16)
Source: Company, MOSL
Exhibit 13: Break-up of quarterly EBITDA (FY16)
Source: Company, MOSL
1Q, 28%
2Q, 15%
3Q, 16%
4Q, 41% 1Q, 31%
2Q, 14% 3Q, 16%
4Q, 39%

Manpasand Beverages
24 June 2016 12
Expanding capacities by 80% over FY16-18 Expect CAGR of 49% in revenue, supply side issues to get addressed
MANB plans to aggressive expand its capacities by 80% over FY16–18. Fruit drinks andcarbonate capacity is expected to increase 58% and ~300%, respectively, which shouldaddress supply side constraints to match up to increasing demand.
MANB’s existing capacities are situated in Varanasi and Vadodara. New capacities tocome in Haryana and Dehradun which would aid geographical diversification. It alsoplans to set up new capacity in south India in FY18.
We believe MANB strategy to open new facilities in north and south India will not onlyaddress the supply side issues but also help to reduce logistics cost and improveworking capital cycle going forward
Due to the lack of capacities in the past, there were MANB has been facing stock outsituation for its products last few years. With an increase in capacities and ramping upof production, MANB is on the cusp of a strong supply-led growth.
Capacity to increase by 80% over FY16–18 to drive growth MANB plans to aggressive expand its capacities by 80% over FY16–18. The company aims to increase capacity from 1,25,000 cases per day in FY16 to 2,25,000 cases per day in FY18. Fruit drink and carbonated fruit drink capacities are projected to increase 58% and 300%, respectively, during the same period. The company had existing facility in Vadodara and Varanasi and commenced another facility in Vadodara in April 2015, yet continued to face stock out situation for its products. Given the huge demand, it has now proponed its capex in Ambala, Haryana, by Sep 2016 to June 2016 to cater to north and northeastern India. The facility is expected to produce the entire range of fruit as well as carbonated drinks: Mango Sip and Fruits Up. It plans to expand in south India in FY18.
Exhibit 14: Utilizations to inch up on expanded capacity
Source: Company, MOSL
We expect capacity expansion to aid robust growth in supply, with revenue increasing at a CAGR of 49% over FY16–18. The company’s preference for geographical diversity (presence in 24 states) over regional concentration led to product shortage in the past. We believe MANB strategy to open new facilities in north and south India will not only address the supply side issues but also help to reduce logistics cost and improve working capital cycle going forward.
24,000 35,000 56,667 72,500 125,000
177,500 225,000
49%
63% 53% 55% 55% 56% 58%
FY12 FY13 FY14 FY15 FY16 FY17E FY18E
Capacity (cases per day) Utilisation (%)

Manpasand Beverages
24 June 2016 13
Exhibit 15: MANB’s Vadodara-II plant
Source: Company, MOSL
Capacity expansion strategically geared toward geographical diversification MANB intends to set up manufacturing facilities across India; among the existing facilities, Vadodara caters to western and southern India, while Varanasi supplies to northern and eastern parts of the country. Vadodara and Varanasi contributed ~60% and ~40% to volumes, respectively, in FY16. Capacity expansion would aid geographical diversification, since the facility in Haryana is strategically located to cater to the north and northeastern markets. The facility at Dehradun, with a relatively smaller capacity of 5,000 PBC per day, would supply to Uttarakhand and Himachal Pradesh. The company has also planned to set up a facility in southern India in FY18.
FMCG products require dispersed and geographically diversified manufacturing to decrease transportation costs. Logistics costs, as a percentage of revenues, averaged ~4% over FY12–16. With expansion in north India and south India we believe that MANB will not only be able to save logistics cost but would be able to supply to market much quicker thereby improving turnaround time leading to higher growth .
Considerable benefits in direct and indirect taxes MANB enjoys considerable advantages in direct and indirect taxes as it operates in the food processing industry. Under the Income Tax Act (Section 80IB 11A), the company receives 100% exemption on profits from a new facility for first five years, followed by 30% for the next five years. Accordingly, Vadodara-I facility would have an income-tax exemption on 30% of profits over FY16–20, while Vadodara-II will have 100% exemption until FY20 and 30% until FY25. The Varanasi facility is entitled to 100% exemption until FY16 and 30% until FY21. The facility in Haryana, expected to commence operations in FY17, shall be exempt from tax for the first five years and 30% thereafter. In terms of indirect taxes, the excise duty stands at 2%, while blended VAT is 5%, which are low as the company operates in the food processing industry. Exhibit 16: Facility wise direct tax benefits – Exemptions from profits
FY11 FY12 FY13 FY14 FY15 FY16E FY17E FY18E FY19E FY20E Vadodara I 100% 100% 100% 100% 100% 30% 30% 30% 30% 30% Vadodara II N.A N.A N.A N.A N.A 100% 100% 100% 100% 100%Varanasi N.A 100% 100% 100% 100% 100% 30% 30% 30% 30% Haryana N.A N.A N.A N.A N.A N.A 100% 100% 100% 100%
Source: MOSL, Company

Manpasand Beverages
24 June 2016 14
Distribution thrust to enhance brand visibility Focus on expanding newer channels like modern retail and on trade tieups
MANB has over 200,000 retailers, 2000 distributors, and 200+ super stockists. Thecompany plans to add 500–1000 distributors in the near to medium term withsignificant focus to expand in South India.
MANB offers higher margins of 30–35% compared to 20–22% by global MNCs such asPepsi and Coca Cola.
The company has entered into tie-ups with IRCTC’s vendors for the supply of productsin trains and railway stations, and derives ~20–22% of sales through this channel. Inour opinion, the channel not only has a significant share in sales, but also acts as aneffective mode of communication and increases brand visibility.
It has set up separate distribution network for fruits Up and Coco Sip. It plans toenhance the network to ~200–250 with a supply of ~2000 vans in the medium term
Focus on tapping urban markets through inclusion of fruit flavors such as guava andlitchi in Fruits Up, and strengthening presence in modern trade and on-trade throughtie-ups with Metro Cash & Carry, Havmor as well as Baskin & Robbins shall augur wellfor urban presence, as MANB focused on rural areas, Tier II and Tier III cities earlier.
We believe expansion in capacity and distribution would lead to higher visibility andbrand building, thereby indicating sales would be gradually led by brand pull thansupply push.
MANB viewed as a pan-India player with brand pull vis-à-vis supply push Initially, the company focused on rural areas for the sale of beverages, with Mango Sip marketed in Uttar Pradesh, and thereafter across north India. Gradually, the company moved to rural areas, Tier II and Tier III cities, and non-metros across the country. MANB is now looking to strengthen presence in urban areas, as highlighted earlier, through additional tie-ups in modern trade, on-trade, launch of Fruits Up, raising ad spends and promotions as well as expanding the distributor base. Moreover, it is undertaking specific steps such as introducing large-size family pack for Mango Sip and Fruits Up in guava and litchi flavors (considered more urban in nature). In our opinion, an increase in supply and distributorship could result in higher visibility and brand building that, in turn, would drive long-term sales through brand pull than supply push.
Distributor-led strategy with higher margins and incentives MANB’s distribution network is spread across 24 states in India. The company offers higher margins (15% distributor and 20% retailer margins) to distributors compared to peers. It also provides incentives like selling the ‘Pure Sip’ brand of bottled water in conjunction with fruit drinks and carbonates. MANB also offers certain free packs of Mango Sip and Fruits Up, and combo offers in retail to increase volumes. Management reiterated plans to focus on topline growth through higher channel margins, even if it is at the cost of restricting profitability.
MANB currently has over 200,000 retailers, 2000 distributors, and 200+ super stockists. The company plans to add 500–1000 distributors in the near to medium term. For Mango Sip, it adopted a unique strategy of penetrating Tier II and Tier III cities initially, and thereafter strengthening presence in urban markets. MANB plans to operate across all 29 states in next 5 years. It also plans to achieve 100% penetration in existing 24 states where it operates in next 2-3 years

Manpasand Beverages
24 June 2016 15
Exhibit 17: Highest channel margins vs. peers (approx.) Distributor margin Retailer margin
Pepsi 7% 15%
Coca Cola 7% 15%
Parle Agro 10% 16%
Manpasand Beverages 15% 20%
Source: MOSL, Company
Exhibit 18: Distribution reach vs. peers offers scope for growth Retail outlets (mn)
Pepsi 2.5
Coca Cola 2.6
Manpasand Beverages 0.2
Source: MOSL, Company
Dedicated distribution for Fruits Up and Coco Sip MANB has adopted a dedicated distribution strategy for Fruits Up; the company’s ~40–50 distributors are actively engaged in supply through vans. MANB plans to enhance the distributorship to ~200–250 with a supply of ~2000 vans in the medium term. Similarly the company has already appointed multiple distributor in north India before launching the product and plans to expand its distributorship by around 100 distributors in the near term.
Sales through railways aids higher penetration Currently, Indian Railways contributes ~20–22% to total revenues and rural areas account for 52–56%. MANB is empaneled with the IRCTC for direct selling to vendors approved by the former. Apart from being an additional sales channel, we believe this strategy would also help the company cater to a wider audience. Given the penetration of Indian Railways, it is as an effective communication mode to enhance visibility. Furthermore, this tie-up is expected to bolster sales of Mango Sip in Tier II and Tier III cities, which are prime focus areas for the product. MANB’s products have high visibility at railway stations and in trains.
Exhibit 19: Renowned celebrities as ambassadors
Source: Company, MOSL

Manpasand Beverages
24 June 2016 16
Spends on brand building and business promotion set to increase MANB spends around 3.5-4% of its sales on advertisement. The company plans to launch ad campaign for Fruits Up in June 2016 as new capacities are commissioned. Though rural and smaller cities would continue to be the prime focus areas, management plans to aggressively tap urban markets and metro cities through Fruits Up and Coco Sip. The company has roped in Bollywood actor Sunny Deol for promoting the Mango Sip brand and would be unveiling the advertising campaign for Fruits Up in June 2016.
Exhibit 20: Sales promotion expenses to remain between ~15%
Source: Company, MOSL
Tapping on-trade channel to gain traction While the on-trade channel for fruit drinks is low at 31%, it is significantly higher for carbonated beverages (~59%). MANB strives to use the existing outlets of several branded products by entering into contracts. The company is tapping the on-trade channel through tie-ups with QSRs such as Baskin & Robbins, Costa Coffee, Barista, Havmor and Goli Vadapav. MANB’s products – Mango Sip and Fruits Up – are available at Havmor’s 209 food outlets in Gujarat (164), Mumbai (28) and Punjab (17). MANB plans to extend the tie-up with Havmor’s other food outlets in Rajasthan, Madhya Pradesh and rest of Maharashtra in the future. Also, the company entered into a contract with Baskin & Robbins (Graviss Foods Pvt. Ltd.) to sell Mango Sip and Fruits Up at the latter’s outlets.
Growing presence in modern trade MANB seeks to tap newer modern trade channels, which account for a higher revenue share in the packaged juice segment vis-à-vis the overall FMCG market in urban India. This channel would be an effective way to gain ground in urban areas. The company recently tied up with Germany-based wholesale major, Metro Cash & Carry, to tap urban markets—this is MANB’s first major tie up with an international retail brand. Metro Cash & Carry works on an exclusive business-to-business wholesale concept, where MANB will supply Mango Sip and Fruits Up in varied sizes to the former’s outlets.
Multiple suppliers de-risk raw material requirements Of the total raw material cost, packaging material (35%) accounts for a major share, followed by mango pulp (23%) and sugar (21%). The normal industry trend is to use Totapuri variety of mangoes as pulp for fruit drinks. Totapuri is grown in southern and western India, and MANB procures the fruit from Jain Irrigation, Capricorn Group, Mother Dairy and few other suppliers in Andhra Pradesh, Karnataka and
7% 8%
14% 15%
FY12 FY13 FY14 FY15
Sales promotion to revenues (%)

Manpasand Beverages
24 June 2016 17
Maharashtra. For other fruit juices, the company procures concentrates from various suppliers in Maharashtra. Mango pulp, which has a shelf life of more than 12–18 months, is supplied in frozen sterilized aseptic bags or cans. Sugar is procured from multiple sugar co-operatives and wholesale distributors in Gujarat and Uttar Pradesh. The principal packaging materials are tetra packs, PET bottles and caps. The packaging material for aseptic tetra packs is procured from Tetra Pak India Private Limited, while PET bottles and caps are bought from some suppliers in Gujarat and Uttar Pradesh. Exhibit 21: Break-up of total raw material cost
Source: Company, MOSL
SWOT Analysis
12% 18% 23% 22% 21% 21% 18% 17% 16% 23% 22% 20%
26% 22% 20%
FY13 FY14 FY15
Mango pulp Sugar Preform Laminates Others
Strong rural presence(55–56% of revenues)
Effective tapping ofrailways channel (20–22% of revenues)
Presence in small packs segment: keyfocus where MNCsare not present
Fruit-basedcarbonates ahealthier alternative
Lack of presence inurban areas
Lack of resources andmuscle powercompared to MNCs
Seasonality in revenues
Higher channel margins andincreased promotionspends
Large market worthINR524b with growthrates upward of 11%
Tapping the fruit-basedcarbonates segment
Shifting of consumerpreferences from global MNC fruit drinks andcolas to locallymanufactured drinks
Increasing consumerspends
Per capita consumptionin India just 16 liters vis-à-vis 160 in the US
Competitive intensitywith MNCs launchingsmaller packs and lowerfruit content
Rising competition fromunorganized andregional companies
Concentration ofrevenues with Railways

Manpasand Beverages
24 June 2016 18
Earnings to post 63% CAGR over FY16–18
Capacity expansion to lead topline growth; margin expansion and deleveraging to drive PAT We expect PAT to post a CAGR of 63% over FY16–18, led by the 49% CAGR in revenue due to capacity expansions. Revenue growth will be driven by 34% revenue CAGR in Mango SIP while Fruits Up to post higher revenue CAGR of 83% over the same period. Accordingly, we expect Fruits Up to increase its share from 19% in FY16 to 31% in FY18E. Seasonally, the first and fourth quarters are the strongest for sales of mango-based drinks; for MANB, the two quarters account for ~70% of annual sales. Inclusion of Fruits Up would help de-risk seasonality as it would be sold through the year. Capacities for fruit drinks are fungible; hence, addition of products to the portfolio shall further augment capacity utilization. It would also aid in addition of other fruit drink products on an annual basis.
Exhibit 22: Revenues to post 49% CAGR over FY16–18
Source: Company, MOSL
Exhibit 23: Diversification into new products (% share)
Source: Company, MOSL
We expect EBITDA margins to largely remain unchanged over FY16-18E as company is likely to pass on the benefits of higher utilization towards promotional spends. The PAT margins will expand from 9.1% in FY16 to 10.9% in FY18 on account of deleveraging of balance sheet as company has retired its debt through IPO proceeds in FY16. Additionally, the company will continue to enjoy lower tax rate of 11% due to tax benefits under Income Tax Act (section 80IB 11A) and lower indirect taxes.
Exhibit 24: EBITDA to register a CAGR of 49% over FY16–18
Source: Company, MOSL
Exhibit 25: PAT to record a CAGR of 63% during FY16–18
Source: Company, MOSL
857 2,398 2,943 3,598 5,567
8,380
12,336
180.0%
22.7% 22.2%
54.7% 50.5% 47.2%
FY12 FY13 FY14 FY15 FY16 FY17E FY18E
Revenues (INR m) Growth (%)
100 100 100 88 81 72 69
12 19 28 31
FY12 FY13 FY14 FY15 FY16 FY17E FY18E
Mango SIP Fruits up
140 387 457 641 1,104
1,651 2,467
16.3% 16.1% 15.5% 17.8%
19.8% 19.7% 20.0%
FY12 FY13 FY14 FY15 FY16 FY17E FY18E
EBITDA (INR m) Margins (%)
61 224 205 300 506 834
1,340
268.1%
-8.5%
46.2% 68.8% 65.0% 60.6%
FY12 FY13 FY14 FY15 FY16 FY17E FY18E
PAT (INR m) Growth (%)

Manpasand Beverages
24 June 2016 19
Exhibit 26: Continue to remain debt free
Source: Company, MOSL
Exhibit 27: Cash flow from operations set to increase
Source: Company, MOSL
High topline growth will be supported by expansion of capacities by 80% over FY16-18. It aims to increase capacity from 125,000 cases per day in FY16 to 225,000 casesper day in FY18. The new capacities will come up in Ambala (Haryana) with 50,000cases per day in FY17 and another 10,000 cases per day in FY18. Remainingcapacities to come up in Vadodara unit 2 and Varanasi.
Exhibit 28: Utilization to grow on expanded capacities
Source: Company, MOSL
Exhibit 29: Asset turnover to improve to 1.5x in FY18
Source: Company, MOSL
Exhibit 30: Management to focus on reducing WC
Source: Company, MOSL
Exhibit 31: Higher utilization to improve return ratios
Source: Company, MOSL
-277-492
-696-1,136
928 914 1,229
0.4
0.6 0.7
0.6
(0.2) (0.1) (0.2)
FY12
FY13
FY14
FY15
FY16
FY17
E
FY18
E
Net Cash (INR mn) Net Debt to Equity (x)
-142
314 17
521
865
1,390
1,818
FY12 FY13 FY14 FY15 FY16 FY17E FY18E
CFO (INR m)
24 35 57 73 125 178 225
49%
63% 53% 55% 55% 56% 58%
FY12 FY13 FY14 FY15 FY16 FY17E FY18E
Capacity (cases/day,'000) Utilisation (%)
1.0
1.8 1.7
1.2 0.9
1.2
1.5
FY12 FY13 FY14 FY15 FY16 FY17E FY18E
Asset Turnover (x)
151
48
91 89 69
53 50
FY12 FY13 FY14 FY15 FY16 FY17E FY18E
Working Cap. Turnover (Days)
20
32
21 19
11 12
16
22 26
19 23
18 18
24
FY12 FY13 FY14 FY15 FY16 FY17E FY18E
RoE RoIC

Manpasand Beverages
24 June 2016 20
Valuation and view Initiate with a Buy
Compelling story of India’s booming consumer spends and beverages market MANB is expected to improve in market share from 5% in 2016 to 7.5% in 2018
in INR 132bn fruit juice market. Low penetration of 30% and per capita annual consumption of soft drinks in
India at 16 liters v/s 166 in the US, provide significant market opportunities forgrowth.
MANB has planned to increase its capacity by 80% over FY16–18 (58% increasefor fruit drinks and 300% for carbonated fruit drinks) which should drive growthby reducing supply side constraints.
MANB expanded the product portfolio by launching Fruits Up (Carbonated andnon-carbonated) in FY15 which now contributes 19% to revenues in FY16. Itrecently launched natural coconut water under brand Coco Sip.
It has 200,000 retailers, 2,000 distributors, 200+ super stockists, and plans toadd 500–1000 distributors in the medium term with a special focus on southIndia.
Focus on urban areas through Fruits Up, increase in distributors (50% additionsin the medium term), and modern trade and on-trade tie-ups would strengthenpresence in urban areas, thereby enabling MANB to be a pan-India player.
The company’s three-pronged strategy: (i) increase available capacity; and (ii)enhance penetration and distribution in its present 24 states, sets the stage fora multi-year growth story (iii) Launch of new products.
We believe, margins will remain resilient at 20% as the contribution of highmargin Fruits Up business will increase from 19% in FY16 to 31% in FY18E.Additionally, company has also recently increased prices of its products toneutralize the impact of increase in raw material prices and inspite of it thecompany continues to face stock out situation at many instances. This alsosignifies pricing power and company will be in a situation to pass on any furtherincrease in raw material prices.
The RoIC for the company will increase from 18% in FY16 to 24% in FY18E whichhas further scope of expansion as the capacities will get fully utilized over next3-4 years as the contribution of Fruits Up will increase. Higher contribution fromFruits Up over a period of time will help to reduce the seasonality attached toutilization. Over FY16-18E, utilization will increase from 55% to 58% on anincreased capacity from 125,000 cases per day to 225,000 cases per day overFY16-18.
We expect sales and PAT CAGR of 49% and 63% respectively over FY16-18translating into improvement of post tax ROIC/ ROE from 18%/11% in FY16 to24%/16% respectively in FY18. At current levels, the stock trades at PE of31x/19x FY17/18E EPS. We value the stock at PE of 28x FY18 EPS of INR26.8which is justified based on low PEG ratio of 0.3x compared average PEG ratio of1.6x of peer companies, debt free status and strong CFO generation ofINR1.4b/1.8b in FY17/18. We initiate coverage with a ‘Buy’ arriving at a pricetarget of INR750, implying 44% upside from current levels

Manpasand Beverages
24 June 2016 21
Exhibit 32: Assumption sheet FY12 FY13 FY14 FY15 FY16 FY17E FY18E
Installed Capacity per day Tetra Pak Case - Fruit Drinks 12,000 19,750 26,667 30,000 40,000 50,000 50,000 Pet Bottle Case - Fruit Drinks 12,000 15,250 30,000 32,500 67,500 85,000 120,000 Pet Bottle Case - Carbonates - - - 10,000 17,500 42,500 55,000
Revenues (INR m) 857 2,396 2,932 3,622 5,567 8,380 12,336 Fruit Drinks 857 2,345 2,850 3,332 5,243 7,437 10,724 Carbonates - - - 137 324 960 1,358 Others - 52 81 153 - 150 500
Revenue Growth (%) 180% 22% 24% 54% 54% 47% Fruit Drinks 174% 22% 17% 57% 40% 40% Carbonates 136% 196% 41%
Source: Company, MOSL
(One tetra pack case contains 27 pieces of 200 ml or 160 ml each or 64 cases of 100 ml each, while one PET bottle case contains: a) six PET bottles of two liters each, or b) 12 PET bottles of 1,200 ml each, or c) 24 PET bottles of 160/200/250/500/600 mleach, or d) 50 PET bottles of 125 ml each.)
Exhibit 33: Peer valuation
Company Name
PE EV/EBITDA RoE % RoCE % EV/Sales PEG Sales CAGR FY16-18E
PAT CAGR FY16-18E
FY17E FY18E FY17E FY18E FY17E FY18E FY17E FY18E FY17E FY18E FY17E FY18E
Dabur India Ltd 36 31 30 26 31 30 29 28 5 5 2.3 2.1 13 15
Britannia Industries Ltd 34 29 23 20 46 42 42 37 3 3 2.5 1.4 13 17
Hindustan Unilever Ltd 39 34 27 23 114 129 177 209 5 4 3.1 2.1 11 14
Jubilant Foodworks Ltd 47 34 20 15 20 23 22 26 2 2 1.2 0.9 22 38
Manpasand Beverages Ltd* 31 19 15 10 12 16 13 18 3 2 0.5 0.3 49 63 *MOSL Estimates

Manpasand Beverages
24 June 2016 22
Bull & Bear case
Bull case Our bull case assumptions have positive impact on sales growth and operating
margins. We assume higher capacity utilization on account strong traction inFruits Up. Additionally, we assume prices of critical raw material like mango pulpand sugar decrease for FY17E and FY18E.
Instead of assuming a flattish EBITDA margins over FY16-18E in the base casedue to raw material prices remaining steady, we are assuming 100bps YoYimprovement each for FY17E and FY18E and 5% increase in sales each year overbase case. In the base case we are expecting over 20 bps increase in EBITDAmargin over FY16-18E.
In the bull case we are assuming that company will not pass on benefit on lowerraw material prices and thus enjoy higher margins. Company has recently takenprice increases to neutral the impact of recent price increase in raw material.
There is an increase of 16% in FY17E EPS and 24% in FY18E EPS over the basecase EPS to INR19.3 and INR33.2 respectively.
Assuming the same 28x target multiple that we have taken for the base case, weget a bull case target price of INR929 (upside of 79% to CMP) based on FY18 EPSinstead of the base case target price of INR750, upside of 44%.
Exhibit 34: Bull case scenario FY16 FY17E FY18E
Sales (INR m) 5,567 8,691 12,972 Sales growth (%) 54.7 56.1 49.3 EBITDA (INR m) 1,104 1,799 2,828 EBITDA Margin (%) 19.8 20.7 21.8 EBITDA growth (%) 72.2 62.9 57.2 PAT (INR m) 506 966 1,661 PAT Margin (%) 9.1 11.1 12.8 PAT growth (%) 68.8 91.1 71.9 EPS (INR) 10.1 19.3 33.2 Target multiple (x) 28 Target price (INR) 929 Upside/downside (%) 79
Source: Company, MOSL
Bear case Our bear case assumptions mainly have a negative impact on both sales growth
and operating margins for FY17E and FY18E. We are assuming a EBITDA margin decline of 140bp over FY16-18E in the bear
case and sales decline of 14%/20% in FY17E/FY18E over our base case. In our bear case, we assume that new capacities get delayed which has a
negative impact of sales volume growth and also impacts the growth of highmargin Fruits Up business. Additionally, we assume the company is unable topass on the increase in raw material prices and the benefits of operatingleverage will also get delayed.
This will lead to decrease of 33% in FY17E EPS and 43% decrease in FY18E EPSover the base case to INR11.3 and INR15.2 respectively.

Manpasand Beverages
24 June 2016 23
Assuming the same 28x target multiple that we have taken for the base case, weget a bear case target price of INR424 (downside of 18% to CMP) based on FY18EPS instead of the base case target price of INR750, upside of 44%.
Exhibit 35: Bear case scenario FY16 FY17E FY18E
Sales (INR m) 5,567 7,197 9,856 Sales growth (%) 54.7 29.3 36.9 EBITDA (INR m) 1,104 1,346 1,814 EBITDA Margin (%) 19.8 18.7 18.4 EBITDA growth (%) 72.2 21.9 34.7 PAT (INR m) 506 563 758 PAT Margin (%) 9.1 7.8 7.7 PAT growth (%) 68.8 11.4 34.7 EPS (INR) 10.1 11.3 15.2 Target multiple (x) 28 Target price (INR) 424 Upside/downside (%) -18
Source: Company, MOSL

Manpasand Beverages
24 June 2016 24
Industry overview Beverages market presents a huge opportunity with rising consumer spends
Soft drinks represent significant market opportunity The Indian soft drinks market was pegged at 12b liters in volume terms and INR524b in value terms in 2015, implying a CAGR of 17.9% and 18.7%, respectively, over 2010–15. Per capita consumption of soft drinks stood at ~10 liters per annum compared to ~160 liters in the US, indicating significant growth potential.
Exhibit 36: Soft drinks volume trend (bn litres)
Source: Euromonitor International March 2016
Exhibit 37: Soft drinks value trend (INR bn)
Source: Euromonitor International March 2016
Exhibit 38: Soft drinks volume mix (%) - 2015
Source: Euromonitor International March 2016
Exhibit 39: Soft drinks value mix (%) - 2015
Source: Euromonitor International March 2016
5.3 6.4
7.6 8.9
10.4 12.1
2010 2011 2012 2013 2014 2015
223 264
315 375
447
524
2010 2011 2012 2013 2014 2015
Bottled Water, 46.4
Carbonates, 37.9
Juice, 14.9 Others, 0.8 Bottled
Water, 23.1
Carbonates, 47.9
Juice, 25.1
Others, 3.9
17.9% CAGR 18.7% CAGR
India Soft Drinks Industry (2015) Volume: 12.1b liters
Bottled water Volume: 5.6b liters
Value: INR121b
Juice Volume: 1.8b liters
Value: INR132b
Others Volume: 0.1b liters
Value: INR20b
Fruits Up carbonates
Mango Sip Fruits Up Manpasand Brands
Carbonates Volume: 4.6b liters
Value: INR251b

Manpasand Beverages
24 June 2016 25
In terms of distribution channels, the soft drinks market is divided into off-trade and on-trade. Off-trade sales refer to those undertaken at retail outlets such as grocery stores, hypermarkets, supermarkets etc. On-trade sales consist of sales at food service outlets, restaurants, bars, and clubs, among others. The distinction between off-trade and on-trade channels is significant as the latter generally takes place at higher sales prices, and hence, impacts the break-up in value terms.
Exhibit 40: Off-trade vs On-trade volume mix
Source: Euromonitor International March 2016
Exhibit 41: Off-trade vs On-trade value mix
Source: Euromonitor International March 2016
As per Euromonitor International March 2016 International March 2016, the soft drinks market is expected to post a CAGR of 10.8% over 2015–20 and reach INR874b, with on-trade rising 8.2% and off-trade growing 12.8%. Overall, volume CAGR is estimated at 22%.
Exhibit 42: Soft drinks market to post 11% CAGR over 2015-20
Source: Euromonitor International March 2016
Juice market pegged at INR132b The Indian juice industry was pegged at INR132b in 2015, with 77% being off-trade (INR101b) and the remaining on-trade. The juice market is divided into three categories: 100% juice, nectars and Juice drinks.
67% 68% 68% 68% 68% 69%
33% 32% 32% 32% 32% 31%
2010 2011 2012 2013 2014 2015
Off-trade On-trade
51% 51% 52% 53% 53% 54%
49% 49% 48% 47% 47% 46%
2010 2011 2012 2013 2014 2015
Off-trade On-trade
524 580
642 711
788 874
2015 2016E 2017E 2018E 2019E 2020E

Manpasand Beverages
24 June 2016 26
Exhibit 43: Juice consists of three categories Category Fruit content Target income segment Off-trade value CAGR 2010–15
100% juice 100% High 31%
Nectars 25% and above Mid-high 26%
Juice drinks Up to 24% Low-mid 27%
Source: Euromonitor International March 2016
Under off-trade, the juice drink market was the largest segment at 71% in value terms and 81% in volume terms in 2015. Juice drinks posted a value CAGR of 27.2% and volume CAGR of 22.4% over 2010–15.
Exhibit 44: Summary of the juice market (2015) INR b
On trade 30 Off-trade 101 100% Juice 10 Juice Drinks 72 Nectars 20 Total 132
Source: Euromonitor International March 2016
Mango is the largest selling flavor in the juice drink category, contributing 85% to off-trade volumes. MANB is a player in this segment, which was estimated at INR72b (off-trade) as of 2015 and is expected to reach INR191b by 2020.
Exhibit 45: Juice drinks account for 71% market share
Source: Euromonitor International March 2016
Exhibit 46: Mango contributes 85% to off-trade volumes
Source: Euromonitor International March 2016
Maaza leads the juice drinks market In value terms, Maaza by Coca Cola led the off-trade market with a 22% share in 2015, followed by Slice by Pepsico (15%). MANB, along with other smaller players, accounted for 20%.
100% Juice, 10%
Juice Drinks ,
71%
Nectars, 20%
Apple, 1%
Lemon, 5%
Mango, 85%
Orange, 5% Other
flavours, 5%
Manpasand is present in Juice drinks market through
its brands Mango SIP and Fruits Up

Manpasand Beverages
24 June 2016 27
Exhibit 47: Brandwise value market share change (%) – Off-trade
Source: Euromonitor International March 2016
Indian off-trade juice drink market expected to reach INR192b by 2020 The off-trade juice drink market (71% of the total off-trade juice market in 2015 in value terms) is expected to reach INR192b by 2020. MANB’s target category (juice drinks) is projected to increase 23.6% in volume and 21.8% in value. Consumers are expected to shift from carbonated drinks to juices due to rising health awareness and changing food habits. Growth in nectars and juice drinks is estimated to be at a faster pace, vis-à-vis 100% juice, as higher prices and stressful lifestyles may restrict demand for the latter.
Exhibit 48: Category-wise breakdown of expected growth rates in the off-trade market over 2015–20 Product Volume CAGR Value CAGR
100% juice 19.0% 18.5%
Juice drinks 23.6% 21.8%
Nectars 11.2% 9.8%
Overall juice market 22.0% 19.4%
Source: Euromonitor International March 2016
Exhibit 49: Off-trade Juice drinks market to post value CAGR of 21.8% (2015-20)
Source: Euromonitor International March 2016
Indian carbonates market pegged at INR251b The carbonates market was worth INR251b in 2015, with volumes aggregating 4.6b liters growing at 10.7% CAGR on volume terms and 12.5%in value terms.
22 22 23 22
14 16 17 15 15 16 15 14 16 14 14 12
34 33 31 37
2012 2013 2014 2015
Maaza (Coca Cola) Slice (Pepsico) Réal (Dabur) Frooti (Parle Agro) Others
21.5 26.8 34.2 43.7 55.7 71.5
86.5 104.8
127.8 156.3
191.5
2010 2011 2012 2013 2014 2015 2016E 2017E 2018E 2019E 2020E

Manpasand Beverages
24 June 2016 28
Exhibit 50: Carbonates volume trend (bn litres)
Source: Euromonitor International March 2016
Exhibit 51: Carbonates value trend (INR bn)
Source: Euromonitor International March 2016
The off-trade channel contributed 60.6% by volume, but just 41.6% by value. Consequently, on-trade accounted for majority of sales owing to higher prices in QSRs, multiplexes, clubs, etc. The consumption trend in such places is greater for a segment like carbonates.
Exhibit 52: Carbonates off-trade vs on-trade mix (Volume)
Source: Euromonitor International March 2016
Exhibit 53: Carbonates off-trade vs on-trade mix (INR bn)
Source: Euromonitor International March 2016
Cola-based carbonates contributed 40%, while lemonade/lime-based carbonates accounted for 37% of the off-trade carbonate volume; a similar pattern was visible in value terms.
Exhibit 54: Off-trade volume break up
Source: Euromonitor International March 2016
Exhibit 55: Off-trade value break up
Source: Euromonitor International March 2016
2.8 3.1
3.5 3.9
4.2 4.6
2010 2011 2012 2013 2014 2015
140 159
180 201
226 251
2010 2011 2012 2013 2014 2015
Off-trade, 60.6%
On-trade, 39.4% Off-trade,
41.6%
On-trade, 58.4%
Cola , 40%
Lemonade, 37%
Orange , 11%
Others, 12%
Cola , 40%
Lemonade, 37%
Orange , 11%
Others, 11%

Manpasand Beverages
24 June 2016 29
Carbonates market dominated by Coca Cola and Pepsi The carbonates market in India is duopolistic in nature; in terms of volume, Coca Cola and Pepsi accounted for 95% of the total off-trade market in 2015. Coca Cola contributed 60%, with a strong product portfolio including Sprite, Thums Up, Coca-Cola, Limca and Fanta, while Pepsi (34%) was the second largest player.
Exhibit 56: Off-trade value share (2015)
Source: Euromonitor International March 2016
Exhibit 57: Off-trade volume share (2015)
Source: Euromonitor International March 2016
Exhibit 58: Brand-wise value market share (2015) Brand Market share Sprite (Coca-Cola) 20% Thums Up (Coca-Cola) 16% Pepsi 14% Limca (Coca-Cola) 9% Coca-Cola 9% Mountain Dew (Pepsi) 7% 7-Up (Pepsi) 6% Mirinda (Pepsi) 5% Fanta (Coca-Cola) 5% Others 9%
Source: Euromonitor International March 2016
Off-trade carbonates market expected to reach INR125b in 2020 In the off-trade market, carbonates posted a CAGR of 12.8% in value terms and 10.9% in volume terms during 2010–15. Lemonades registered a strong growth of 17.5% during the same period, while cola carbonates rose 11.4%. Going forward, growth is expected to normalize, with volumes expanding at a CAGR of 7.7% over 2010–15, resulting in a value CAGR of 3.8%. Lemonade/lime-based carbonate volume is forecast to register a CAGR of 11% (6.4% in value) and cola-based carbonates at 5.6% (2.1% in value).
Exhibit 59: Expected growth in off-trade carbonates over FY14–19 Product Volume CAGR Value CAGR
Cola 5.6% 2.1%
Lime/Lemonade 11.0% 6.4%
Orange 1.9% -1.7%
Carbonates overall 7.7% 3.8%
Source: Euromonitor International March 2016
Coca-Cola, 60%
Pepsico, 34%
Others, 5%
Coca-Cola, 62%
Pepsico, 34%
Others, 4%
Manpasand has a differentiated offering in
the category with fruit based carbonates under
brand Fruits Up

Manpasand Beverages
24 June 2016 30
Growth in lemonade/lime-based carbonates is expected to outpace that in cola and the overall carbonates market as they are perceived to be healthier options. The shift in preferences to healthier alternatives shall augur well for brands offering carbonates with fruit contents.
Exhibit 60: Off-trade carbonates market to grow at CAGR of 4% over 2015-20 (INR b)
Source: Euromonitor International March 2016
104.3 108.7 112.9 117.1 121.6 125.5
2015 2016 2017 2018 2019 2020

Manpasand Beverages
24 June 2016 31
Key risks
Competitive intensity MANB competes with global multinationals such as Coca Cola and Pepsico as well as large-sized Indian companies like Parle, Dabur, etc. Competitors are larger in scale and have significant resources at their disposal.
Product concentration Mango Sip contributed 97% to revenues in FY14 and 80% in FY16. MANB was largely a single product entity until FY14, wherein the company launched Fruits Up and Manpasand ORS. Though we are optimistic about the prospects of a ramp-up in new products, Mango Sip would continue to remain the major revenue contributor.
Channel concentration MANB gains 20–22% of revenues from IRCTC’s empaneled vendors. In the past, IRCTC shifted to its brand of bottled water from other brands. While we believe such a step in fruit drinks is less likely, any such policy change can impact MANB’s revenues. However, there exists sufficient alternate sales channels.
Slowdown in economy The company’s products are a part of discretionary spending and might have tepid demand in the event of an economic slowdown.
Seasonality and weather impact MANB’s sales are subject to seasonal variations, where sales in the first and fourth quarters comprise ~68–69% of revenues due to the summer season. However, the weather also has an impact on demand, which is generally lower at times of a cooler summer, strong monsoon and winter.

Manpasand Beverages
24 June 2016 32
Management overview
Mr Dhirendra Singh, Chairman & Managing Director Mr Singh, promoter and founder of the company, serves as Chairman and Managing Director. He holds a BA degree and was previously employed at ONGC and Petrofils Limited. He has 15+ years of experience in the food and beverages industry.
Mr Abhishek Singh, Whole-time Director Mr Abhishek Singh, son of Dhirendra Singh and a Whole-time Director, has been associated with MANB since incorporation. He holds a Bachelor of Engineering degree in Food Technology and has three years of experience in the food & beverages industry. He oversees operations, with a special focus on marketing.
Mr Dharmendra Singh, Whole-time Director Mr Dharmendra Singh, brother of Dhirendra Singh, is a Whole-time Director and has been associated with the company since November 2011. He holds a Bachelor of Arts degree.
Mr Dhruv Agrawal, Director – Finance and Investor Relations Mr Agrawal serves as a Non-executive, Non-independent Director of MANB. He is a Chartered Accountant and is responsible for investor relations.
Mr Paresh Thakkar, Chief Financial Officer Mr Thakkar holds the position of Chief Financial Officer in the company.

Manpasand Beverages
24 June 2016 33
Financials and Valuation
Standalone - Income Statement (INR Million) Y/E March FY12 FY13 FY14 FY15 FY16 FY17E FY18E Total Income from Operations 857 2,398 2,943 3,598 5,567 8,380 12,336 Change (%) 180.0 22.7 22.2 54.7 50.5 47.2 Total Expenditure 717 2,011 2,486 2,956 4,463 6,729 9,869
% of Sales 83.7 83.9 84.5 82.2 80.2 80.3 80.0 EBITDA 140 387 457 641 1,104 1,651 2,467 Margin (%) 16.3 16.1 15.5 17.8 19.8 19.7 20.0 Depreciation 46 102 149 205 571 823 1,093 EBIT 94 286 308 436 533 828 1,374 Int. and Finance Charges 30 43 77 107 57 0 0 Other Income 4 3 1 4 91 110 131 PBT 68 246 231 334 567 938 1,506 Current Tax 7 25 24 36 62 103 166 Deferred Tax 0 -2 2 -2 0 0 0 Tax Rate (%) 10.7 9.1 11.5 10.2 10.9 11.0 11.0 PAT 61 224 205 300 506 834 1,340 Change (%) 268.1 -8.5 46.2 68.8 65.0 60.6 Margin (%) 7.1 9.3 7.0 8.3 9.1 10.0 10.9
Standalone - Balance Sheet (INR Million) Y/E March FY12 FY13 FY14 FY15 FY16 FY17E FY18E Equity Share Capital 25 25 25 376 501 501 501 Total Reserves 502 722 923 1,534 5,515 6,266 7,472 Net Worth 536 756 957 1,909 6,016 6,767 7,973 Deferred Tax Liabilities 1 0 1 0 0 0 0 Total Loans 318 548 743 1,179 0 0 0 Capital Employed 855 1,304 1,701 3,088 6,016 6,766 7,973
Gross Block 399 927 1,213 1,345 3,573 5,323 6,823 Less: Accum. Deprn. 0 0 294 499 1,070 1,892 2,986 Net Fixed Assets 399 927 919 847 2,503 3,430 3,837 Capital WIP 0 0 0 1,316 1,520 1,200 1,200 Total Investments 60 2 2 0 6 6 6
Curr. Assets, Loans & Adv. 528 707 1,036 1,341 2,579 3,205 4,555 Inventory 160 207 416 424 704 1,106 1,649 Account Receivables 204 326 478 593 677 849 1,183 Cash and Bank Balance 41 56 47 43 928 914 1,229 Loans and Advances 123 118 95 280 270 335 493 Curr. Liability & Prov. 133 334 257 417 593 1,076 1,627 Account Payables 79 184 176 225 450 701 1,082 Other Current Liabilities 38 95 56 95 130 251 370 Provisions 16 56 26 98 13 124 175 Net Current Assets 395 373 779 924 1,986 2,129 2,928 Deferred Tax assets 1 2 1 1 1 1 1 Appl. of Funds 855 1,304 1,701 3,088 6,016 6,766 7,973 E: MOSL Estimates

Manpasand Beverages
24 June 2016 34
Financials and Valuation
Ratios Y/E March FY12 FY13 FY14 FY15 FY16 FY17E FY18E Basic (INR) EPS 1.6 6.0 5.5 8.0 10.1 16.7 26.8 Cash EPS 2.8 8.7 9.4 13.4 21.5 33.1 48.6 BV/Share 14.3 20.1 25.5 50.8 120.2 135.2 159.3 DPS 0.0 0.1 0.1 1.3 1.0 1.7 2.7 Payout (%) 0.0 1.7 1.9 19.7 9.9 10.0 10.0 Valuation (x) P/E 65.2 51.5 31.2 19.4 P/BV 10.2 4.3 3.8 3.3 EV/Sales 5.7 4.5 3.0 2.0 EV/EBITDA 32.2 22.7 15.2 10.1 Dividend Yield (%) 0.3 0.2 0.3 0.5 FCF per share -28.2 -38.3 -0.8 6.4 Return Ratios (%) RoE 20.3 31.5 21.2 18.8 11.4 11.6 16.2 RoCE 20.5 24.3 18.2 16.5 12.2 13.1 18.2 RoIC 22.3 26.0 18.8 23.2 18.0 18.0 24.0 Working Capital Ratios Asset Turnover (x) 1.0 1.8 1.7 1.2 0.9 1.2 1.5 Inventory (Days) 68 32 52 43 46 48 49 Debtor (Days) 86 49 58 59 44 36 34 Creditor (Days) 34 28 22 23 30 31 32 Working Cap. Turnover (Days) 151 48 91 89 69 53 50 Leverage Ratio (x) Debt/Equity 0.6 0.7 0.8 0.6 0.0 0.0 0.0
Standalone - Cash Flow Statement (INR Million) Y/E March FY12 FY13 FY14 FY15 FY16 FY17E FY18E OP/(Loss) before Tax 68 247 232 333 567 938 1,506 Depreciation 46 102 149 205 571 823 1,093 Interest & Finance Charges 27 40 77 102 -34 -110 -131Direct Taxes Paid -3 -61 -28 -55 -62 -103 -166(Inc)/Dec in WC -279 -13 -412 -65 -177 -157 -484CF from Operations -142 314 17 521 865 1,390 1,818 Others 2 5 6 6 -349 0 0 CF from Operating incl EO -140 319 23 527 516 1,390 1,818 (Inc)/Dec in FA -521 -553 -147 -1,586 -2,431 -1,430 -1,500Free Cash Flow -660 -234 -124 -1,059 -1,915 -40 318 CF from Investments -577 -492 -146 -1,582 -2,346 -1,320 -1,369Issue of Shares 475 0 0 263 4,000 0 0 Inc/(Dec) in Debt 318 230 195 436 -1,179 0 0 Interest Paid -30 -43 -77 -101 -57 0 0 Dividend Paid 0 0 0 -4 -50 -83 -134Others -29 0 -4 458 0 0 0 CF from Fin. Activity 734 187 114 1,051 2,714 -83 -134Inc/Dec of Cash 18 15 -9 -4 884 -13 315 Opening Balance 23 41 56 47 43 927 914 Closing Balance 41 56 47 43 927 914 1,229 E: MOSL Estimates

RECENT INITIATING COVERAGE REPORTS
REPORT GALLERY

Manpasand Beverages
24 June 2016 36
Disclosures
This document has been prepared by Motilal Oswal Securities Limited (hereinafter referred to as Most) to provide information about the company (ies) and/sector(s), if any, covered in the report and may be distributed by it and/or its affiliated company(ies). This report is for personal information of the selected recipient/s and does not construe to be any investment, legal or taxation advice to you. This research report does not constitute an offer, invitation or inducement to invest in securities or other investments and Motilal Oswal Securities Limited (hereinafter referred as MOSt) is not soliciting any action based upon it. This report is not for public distribution and has been furnished to you solely for your general information and should not be reproduced or redistributed to any other person in any form. This report does not constitute a personal recommendation or take into account the particular investment objectives, financial situations, or needs of individual clients. Before acting on any advice or recommendation in this material, investors should consider whether it is suitable for their particular circumstances and, if necessary, seek professional advice. The price and value of the investments referred to in this material and the income from them may go down as well as up, and investors may realize losses on any investments. Past performance is not a guide for future performance, future returns are not guaranteed and a loss of original capital may occur.
MOSt and its affiliates are a full-service, integrated investment banking, investment management, brokerage and financing group. We and our affiliates have investment banking and other business relationships with a some companies covered by our Research Department. Our research professionals may provide input into our investment banking and other business selection processes. Investors should assume that MOSt and/or its affiliates are seeking or will seek investment banking or other business from the company or companies that are the subject of this material and that the research professionals who were involved in preparing this material may educate investors on investments in such business . The research professionals responsible for the preparation of this document may interact with trading desk personnel, sales personnel and other parties for the purpose of gathering, applying and interpreting information. Our research professionals are paid on twin parameters of performance & profitability of MOSt. MOSt generally prohibits its analysts, persons reporting to analysts, and members of their households from maintaining a financial interest in the securities or derivatives of any companies that the analysts cover. Additionally, MOSt generally prohibits its analysts and persons reporting to analysts from serving as an officer, director, or advisory board member of any companies that the analysts cover. Our salespeople, traders, and other professionals or affiliates may provide oral or written market commentary or trading strategies to our clients that reflect opinions that are contrary to the opinions expressed herein, and our proprietary trading and investing businesses may make investment decisions that are inconsistent with the recommendations expressed herein. In reviewing these materials, you should be aware that any or all of the foregoing among other things, may give rise to real or potential conflicts of interest. MOSt and its affiliated company(ies), their directors and employees and their relatives may; (a) from time to time, have a long or short position in, act as principal in, and buy or sell the securities or derivatives thereof of companies mentioned herein. (b) be engaged in any other transaction involving such securities and earn brokerage or other compensation or act as a market maker in the financial instruments of the company(ies) discussed herein or act as an advisor or lender/borrower to such company(ies) or may have any other potential conflict of interests with respect to any recommendation and other related information and opinions.; however the same shall have no bearing whatsoever on the specific recommendations made by the analyst(s), as the recommendations made by the analyst(s) are completely independent of the views of the affiliates of MOSt even though there might exist an inherent conflict of interest in some of the stocks mentioned in the research report Reports based on technical and derivative analysis center on studying charts company's price movement, outstanding positions and trading volume, as opposed to focusing on a company's fundamentals and, as such, may not match with a report on a company's fundamental analysis. In addition MOST has different business segments / Divisions with independent research separated by Chinese walls catering to different set of customers having various objectives, risk profiles, investment horizon, etc, and therefore may at times have different contrary views on stocks sectors and markets.
Unauthorized disclosure, use, dissemination or copying (either whole or partial) of this information, is prohibited. The person accessing this information specifically agrees to exempt MOSt or any of its affiliates or employees from, any and all responsibility/liability arising from such misuse and agrees not to hold MOSt or any of its affiliates or employees responsible for any such misuse and further agrees to hold MOSt or any of its affiliates or employees free and harmless from all losses, costs, damages, expenses that may be suffered by the person accessing this information due to any errors and delays. The information contained herein is based on publicly available data or other sources believed to be reliable. Any statements contained in this report attributed to a third party represent MOSt’s interpretation of the data, information and/or opinions provided by that third party either publicly or through a subscription service, and such use and interpretation have not been reviewed by the third party. This Report is not intended to be a complete statement or summary of the securities, markets or developments referred to in the document. While we would endeavor to update the information herein on reasonable basis, MOSt and/or its affiliates are under no obligation to update the information. Also there may be regulatory, compliance, or other reasons that may prevent MOSt and/or its affiliates from doing so. MOSt or any of its affiliates or employees shall not be in any way responsible and liable for any loss or damage that may arise to any person from any inadvertent error in the information contained in this report. MOSt or any of its affiliates or employees do not provide, at any time, any express or implied warranty of any kind, regarding any matter pertaining to this report, including without limitation the implied warranties of merchantability, fitness for a particular purpose, and non-infringement. The recipients of this report should rely on their own investigations.
This report is intended for distribution to institutional investors. Recipients who are not institutional investors should seek advice of their independent financial advisor prior to taking any investment decision based on this report or for any necessary explanation of its contents.
Most and it’s associates may have managed or co-managed public offering of securities, may have received compensation for investment banking or merchant banking or brokerage services, may have received any compensation for products or services other than investment banking or merchant banking or brokerage services from the subject company in the past 12 months. Most and it’s associates have not received any compensation or other benefits from the subject company or third party in connection with the research report. Subject Company may have been a client of Most or its associates during twelve months preceding the date of distribution of the research report
MOSt and/or its affiliates and/or employees may have interests/positions, financial or otherwise of over 1 % at the end of the month immediately preceding the date of publication of the research in the securities mentioned in this report. To enhance transparency, MOSt has incorporated a Disclosure of Interest Statement in this document. This should, however, not be treated as endorsement of the views expressed in the report.
Motilal Oswal Securities Limited is registered as a Research Analyst under SEBI (Research Analyst) Regulations, 2014. SEBI Reg. No. INH000000412
Pending Regulatory inspections against Motilal Oswal Securities Limited: SEBI pursuant to a complaint from client Shri C.R. Mohanraj alleging unauthorized trading, issued a letter dated 29th April 2014 to MOSL notifying appointment of an Adjudicating Officer as per SEBI regulations to hold inquiry and adjudge violation of SEBI Regulations; MOSL replied to the Show Cause Notice whereby SEBI granted us an opportunity of Inspection of Documents. Since all the documents requested by us were not covered we have requested to SEBI vide our letter dated June 23, 2015 to provide pending list of documents for inspection.
List of associate companies of Motilal Oswal Securities Limited -Click here to access detailed report
Analyst Certification The views expressed in this research report accurately reflect the personal views of the analyst(s) about the subject securities or issues, and no part of the compensation of the research analyst(s) was, is, or will be directly or indirectly related to the specific recommendations and views expressed by research analyst(s) in this report. The research analysts, strategists, or research associates principally responsible for preparation of MOSt research receive compensation based upon various factors, including quality of research, investor client feedback, stock picking, competitive factors and firm revenues Disclosure of Interest Statement MANPASAND BEVERAGES Analyst ownership of the stock No Served as an officer, director or employee No
A graph of daily closing prices of securities is available at www.nseindia.com and http://economictimes.indiatimes.com/markets/stocks/stock-quotes
Regional Disclosures (outside India) This report is not directed or intended for distribution to or use by any person or entity resident in a state, country or any jurisdiction, where such distribution, publication, availability or use would be contrary to law, regulation or which would subject MOSt & its group companies to registration or licensing requirements within such jurisdictions.
For Hong Kong: This report is distributed in Hong Kong by Motilal Oswal capital Markets (Hong Kong) Private Limited, a licensed corporation (CE AYY-301) licensed and regulated by the Hong Kong Securities and Futures Commission (SFC) pursuant to the Securities and Futures Ordinance (Chapter 571 of the Laws of Hong Kong) “SFO”. As per SEBI (Research Analyst Regulations) 2014 Motilal Oswal Securities (SEBI Reg No. INH000000412) has an agreement with Motilal Oswal capital Markets (Hong Kong) Private Limited for distribution of research report in Kong Kong. This report is intended for distribution only to “Professional Investors” as defined in Part I of Schedule 1 to SFO. Any investment or investment activity to which this document relates is only available to professional investor and will be engaged only with professional investors.” Nothing here is an offer or solicitation of these securities, products and services in any jurisdiction where their offer or sale is not qualified or exempt from registration. The Indian Analyst(s) who compile this report is/are not located in Hong Kong & are not conducting Research Analysis in Hong Kong.
For U.S Motilal Oswal Securities Limited (MOSL) is not a registered broker - dealer under the U.S. Securities Exchange Act of 1934, as amended (the"1934 act") and under applicable state laws in the United States. In addition MOSL is not a registered investment adviser under the U.S. Investment Advisers Act of 1940, as amended (the "Advisers Act" and together with the 1934 Act, the "Acts), and under applicable state laws in the United States. Accordingly, in the absence of specific exemption under the Acts, any brokerage and investment services provided by MOSL, including the products and services described herein are not available to or intended for U.S. persons.
This report is intended for distribution only to "Major Institutional Investors" as defined by Rule 15a-6(b)(4) of the Exchange Act and interpretations thereof by SEC (henceforth referred to as "major institutional investors"). This document must not be acted on or relied on by persons who are not major institutional investors. Any investment or investment activity to which this document relates is only available to major institutional investors and will be engaged in only with major institutional investors. In reliance on the exemption from registration provided by Rule 15a-6 of the U.S. Securities Exchange Act of 1934, as amended (the "Exchange Act") and interpretations thereof by the U.S. Securities and Exchange Commission ("SEC") in order to conduct business with Institutional Investors based in the U.S., MOSL has entered into a chaperoning agreement with a U.S. registered broker-dealer, Motilal Oswal Securities International Private Limited. ("MOSIPL"). Any business interaction pursuant to this report will have to be executed within the provisions of this chaperoning agreement.
The Research Analysts contributing to the report may not be registered /qualified as research analyst with FINRA. Such research analyst may not be associated persons of the U.S. registered broker-dealer, MOSIPL, and therefore, may not be subject to NASD rule 2711 and NYSE Rule 472 restrictions on communication with a subject company, public appearances and trading securities held by a research analyst account.
For Singapore Motilal Oswal Capital Markets Singapore Pte Limited is acting as an exempt financial advisor under section 23(1)(f) of the Financial Advisers Act(FAA) read with regulation 17(1)(d) of the Financial Advisors Regulations and is a subsidiary of Motilal Oswal Securities Limited in India. This research is distributed in Singapore by Motilal Oswal Capital Markets Singapore Pte Limited and it is only directed in Singapore to accredited investors, as defined in the Financial Advisers Regulations and the Securities and Futures Act (Chapter 289), as amended from time to time.
In respect of any matter arising from or in connection with the research you could contact the following representatives of Motilal Oswal Capital Markets Singapore Pte Limited: Varun Kumar Kadambari Balachandran [email protected] [email protected] Contact : (+65) 68189232 (+65) 68189233 / 65249115 Office Address:21 (Suite 31),16 Collyer Quay,Singapore 04931
Motilal Oswal Securities Ltd Motilal Oswal Tower, Level 9, Sayani Road, Prabhadevi, Mumbai 400 025
Phone: +91 22 3982 5500 E-mail: [email protected]