Manoj Reddy Medapati - mspace.lib.umanitoba.ca
113
Extracellular S100A4 induces human thyroid cancer cell migration By Manoj Reddy Medapati A Thesis submitted to the Faculty of Graduate Studies of The University of Manitoba in partial fulfilment of the requirements of the degree of MASTER OF SCIENCE Department of Human Anatomy & Cell Science University of Manitoba Winnipeg Copyright © 2013 by Manoj Reddy Medapati
Transcript of Manoj Reddy Medapati - mspace.lib.umanitoba.ca

Extracellular S100A4 induces human thyroid cancer cell migration
By
Manoj Reddy Medapati
A Thesis submitted to the Faculty of Graduate Studies of
The University of Manitoba
in partial fulfilment of the requirements of the degree of
MASTER OF SCIENCE
Department of Human Anatomy & Cell Science
University of Manitoba
Winnipeg
Copyright © 2013 by Manoj Reddy Medapati

i
Abstract
Human thyroid cancer is the most commonly occurring cancer of the endocrine gland
having good survival rate, but some patients show recurrence with an invasive phenotype
and treatment failures. The mechanisms behind this invasive phenotype are not well
understood in TC. Previously our group has identified a pro-migratory role of relaxin-like
peptides in thyroid cancer that is mediated by S100A4. We have observed in human TC
cells that extracellular S100A4 induces migration and activates ERK1/2, JNK/SAPK and
NFkB signaling pathways. Employing immunohistochemistry and immunofluorescence
we have identified the expression of RAGE in human TC primary cells, cell lines, and in
tumor tissues but not in normal thyroid tissues. We showed that S100A4 binds to RAGE
in TC cells and that RAGE and its cytoplasmic partner Dia-1 mediate the S100A4-
induced migration of TC cells. This study identified a crucial role of RAGE in TC cell
migration induced by S100A4.

ii
ACKNOWLEDGEMENTS
I would like to thank my parents for their support during my masters program.
I am very much thankful to my family members M.V. Rama Reddy, Sai Kiran, Kalpana,
my little sisters Sujitha and Srujana for encouraging me throughout the work and for their
emotional and financial support which made my abroad studies successful. I am thankful
to my grandfathers M. Muni Reddy and M. Nagi Reddy for their blessings.
I am grateful to my supervisor Dr. Sabine Hombach-Klonisch for giving me the
opportunity to work in the lab and helping me master the techniques in research and in
scientific writing. Also, I want to thank my committee members, Dr. Thomas Klonisch
and Dr. Richard Keijzer for their innovative ideas in my project.
I appreciate Dr. Kumar Alok Pathak, Dr. Lydia Lucman and pathology assistant Mr. Ron
Brereton for their help in the project.
I am thankful to all the lab members and the department for their support.
I would like to thank my friend Anjali who helped me to finish the thesis and also all the
other Winnipeg friends.
The financial support for this project was provided by NSERC, MICH, Department of
Surgery Research Fund.

iii
DEDICATION
I would like to dedicate my thesis to my mother who played an important role in my
career success.

iv
TABLE OF CONTENTS
LIST OF ABBREVIATIONS………………………………………………..………....vii
LIST OF TABLES……………………………………………………………….….…...xi
LIST OF FIGURES………………………………………………………………..........xii
CHAPTER 1: INTRODUCTION……………………………………………………..…1
1.1 Thyroid cancer (TC)................................................................................................1
1.1.1 Types of Thyroid cancer…………………………………………………….……1
1.1.2 Histological appearance of thyroid cancer derived from thyroid follicular
epithelial cells…………………………………………………………………….2
1.1.3 Factors influencing prognosis in thyroid cancer…………………………………3
1.2 Molecules and processes involved in thyroid cancer growth and migration…….5
1.2.1 Relaxin family peptides………………………………………………..………...6
1.2.2 Physiological role of relaxin……………………………………………………..6
1.2.3 Role of RLN family peptides (RLN2 & INSL3) in thyroid cancer……………...6
1.3 S100 proteins and their role in cancer…………………………………….……...7
1.3.1 S100 protein family…………………………………………………………..…..7
1.3.2 Structure of S100A4……………………………………………………………..9
1.3.3 S100A4 expression, localization and prognostic significance……………….…10
1.3.4 S100A4 in tumor cell migration………………………………………….……..11
1.3.5 S100A4 in thyroid cancer…………………………………………………….....12
1.4 Intracellular cytoskeletal binding partners for S100A4………………………...13
1.4.1 Non muscle myosin II (NMII)………………………………………….……....13

v
1.4.2 Tropomyosin……………………………………………………………….…...13
1.4.3 p53……………………………………………………………………………...13
1.5 S100A4 binding with cell surface receptors…………………………………....14
1.5.1 Annexin II………………………………………………………………………14
1.5.2 Receptor for advanced glycation end products (RAGE)…………………….....14
1.5.3 Discovery and expression of RAGE…………………………………………...15
1.5.4 Structure of RAGE……………………………………………………………..15
1.5.5 Isoforms of RAGE……………………………………………………………...15
1.5.6 Cellular signaling pathways activated by RAGE and its ligands……………….17
1.5.7 Physiological role of RAGE……………………………………………………18
1.5.8 Role of RAGE in cancer………………………………………………………..18
1.6 Rationale of the study……………………………………………………..........19
1.7 Hypothesis and objectives………………………………………………............20
1.7.1 Hypothesis………………………………………………………………………20
1.7.2 Objectives……………………………………………………………………….20
CHAPTER 2: MATERIAL & METHODS……………………………………………..21
CHAPTER 3: RESULTS………………………………………………………………..35
3.1 RAGE and S100A4 transcripts are expressed in primary human thyroid cancer
cells and in human thyroid cancer cell lines……………….……………………35
3.2 RAGE protein is present in primary human TC cells and in human TC cell lines
with cytoplasmic and nuclear localization…………………………...................38
3.3 RAGE is expressed in thyroid cancer patient tissues, but not in normal thyroid
tissues……………………………………………………………………………43
vi
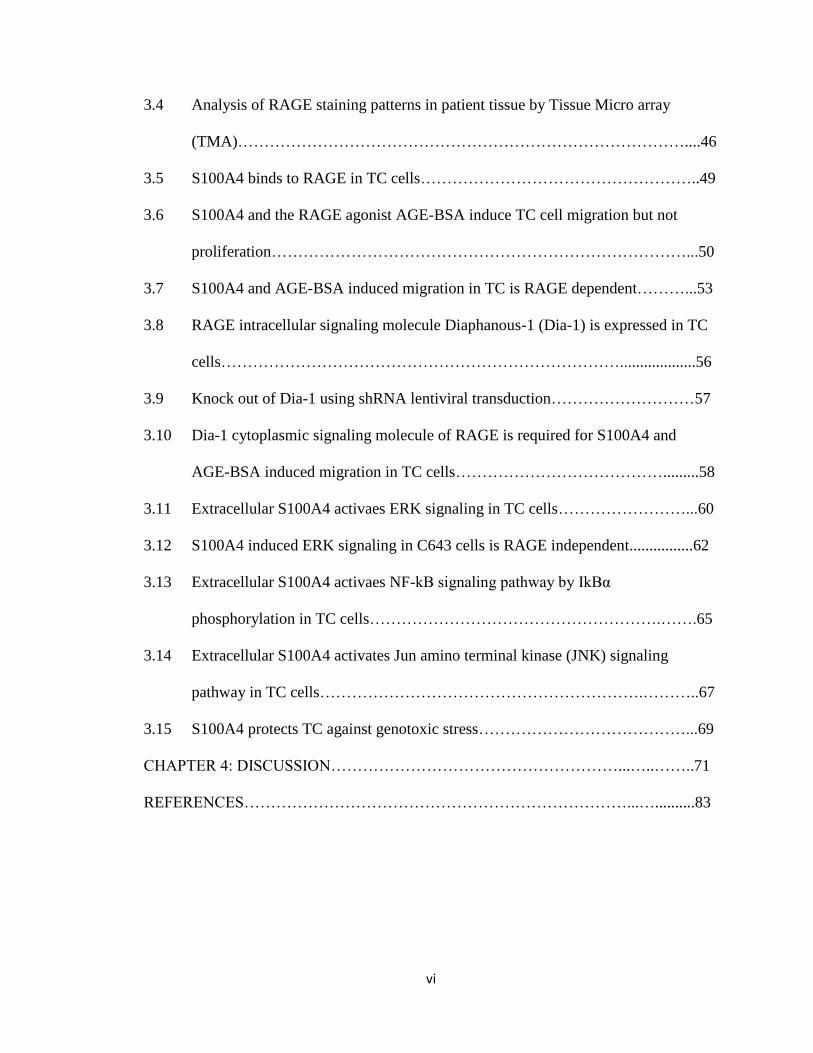
3.4 Analysis of RAGE staining patterns in patient tissue by Tissue Micro array
(TMA)…………………………………………………………………………....46
3.5 S100A4 binds to RAGE in TC cells……………………………………………..49
3.6 S100A4 and the RAGE agonist AGE-BSA induce TC cell migration but not
proliferation……………………………………………………………………...50
3.7 S100A4 and AGE-BSA induced migration in TC is RAGE dependent………...53
3.8 RAGE intracellular signaling molecule Diaphanous-1 (Dia-1) is expressed in TC
cells…………………………………………………………………...................56
3.9 Knock out of Dia-1 using shRNA lentiviral transduction………………………57
3.10 Dia-1 cytoplasmic signaling molecule of RAGE is required for S100A4 and
AGE-BSA induced migration in TC cells………………………………….........58
3.11 Extracellular S100A4 activaes ERK signaling in TC cells……………………...60
3.12 S100A4 induced ERK signaling in C643 cells is RAGE independent................62
3.13 Extracellular S100A4 activaes NF-kB signaling pathway by IkBα
phosphorylation in TC cells……………………………………………….…….65
3.14 Extracellular S100A4 activates Jun amino terminal kinase (JNK) signaling
pathway in TC cells…………………………………………………….………..67
3.15 S100A4 protects TC against genotoxic stress…………………………………...69
CHAPTER 4: DISCUSSION………………………………………………...…..……..71
REFERENCES………………………………………………………………...…..........83

vii
LIST OF ABBREVIATIONS
AGE: Advanced glycation end product
AGE-BSA: Advanced glycation end product- coupled to bovine serum albumin
Ab: Antibody
BPH: Benign prostate hyperplasia
BrdU: Bromodeoxyuridine
BSA: bovine serum albumin
CTGF: Connective tissue growth factor
CV: Columnar variant
DAB: 3,3'-Diaminobenzidine substrate
DAPI: 4',6'-diamidino-2-phenylindole
Dia-1: Diaphanous-1
DM: Distant metastases
DMEM: Dulbecco’s Modified Eagle’s medium
DN-RAGE: Dominant negative RAGE
dNTP: deoxynucleotide triphosphate
DSS: Disease specific survival
DTC: Differentiated thyroid cancer
ECM: Extracellular matrix
EGF: Epidermal growth factor
EGFR: Epidermal growth factor receptor

viii
EMT: Epithelial mesenchymal transition
ERK: Extracellular activated protein kinase
FBS: Fetal bovine serum
FSP: Fibroblast specific protein
FTC: Follicular thyroid cancer
FVPTC: Follicular variant of PTC
GAPDH: Glyceraldehyde 3-phosphate dehydrogenase
GC: Gastric cancer
GPCR’s: G- protein coupled receptors
HBx-IP: Hepatitis Bx- interacting protein
HCEC: Human cerebromicrovascular endothelial cells
HMF: Human mammary fibroblast cells
H2O2 : Hydrogen peroxide
IgG: Immunoglobulin G
INSL3: Insulin Like-3
IP: Immunoprecipitation
IPMNS: Invasive intraductal papillary mucinous of pancreas
JNK- Jun amino terminal kinase
KD: Knock down
kDa: Kilo Dalton
KO: Knock out

ix
LN: Lymph node
Ley I-L: leydig insulin-like
MAPK: Mitogen activated protein kinase
MEF: Mouse embryonic fibroblast
MHC: Major histocompatability complex
MMP: Matrix metalloproteinase
MOI: Multiplicity of infections
MP: Micro particles
MTC: Medullary thyroid cancer
Mts1: Metastasin
NF-kB-α: Nuclear factor of kappa light chain polypeptide gene enhancer in B-cells
inhibitor, alpha
NGS: Normal goat serum
NMII: Non muscle myosin II
OA : Osteoarthritis
OS: Overall survival
PBS: Phosphate buffered saline
PCR: Polymerase chain reaction
PMA: Phorbol 12-Myristate 13-Acetate
PTC: papillary thyroid cancer
qPCR: Quantitative PCR

x
RAGE: Receptor for advanced glycation end product
rhu: Recombinant human
RLN: Relaxin
rpm: rotations per minute
RT: Room temperature
rRNA: Ribosomal RNA
sh: Small hairpin
si: Small interference
sRAGE: Soluble RAGE
TBS: Tris buffered saline
TBST: Tris buffered saline – tween
TC: Thyroid cancer
TCV: Tall cell variant
TG2: Tissue Transglutaminase 2
TIF: Tumor interstitial fluid
TMA: Tissue Micro Array
TN: Thyroid nodule
UTC: Undifferentiated thyroid cancer
VEGF: Vascular endothelial growth factor
3D: Three dimension

xi
LIST OF TABLES
Table 1: Reagents for PCR……………………………………………………………...24
Table 2: Primer sequences used in PCR amplification reaction………………………...25
Table 3: Primary antibodies used in western blotting……………………………………….………….28
Table 4: Secondary antibodies used in western blotting……………………………………………….28
Table 5: Primary antibodies used in immunofluorescence…………………………………………...30
Table 6: Secondary antibodies used in immunofluorescence………………………………………..30
Table 7: Primary antibodies used in immunohistochemistry…………………………………........32
Table 8: Secondary antibodies used in immunofluorescence…………………………………….….32
Table 9: Analysis of RAGE & S100A4 expression in human primary thyroid cancer and
Follicular adenoma cells isolated from patient tissue…………………………………...36
xii
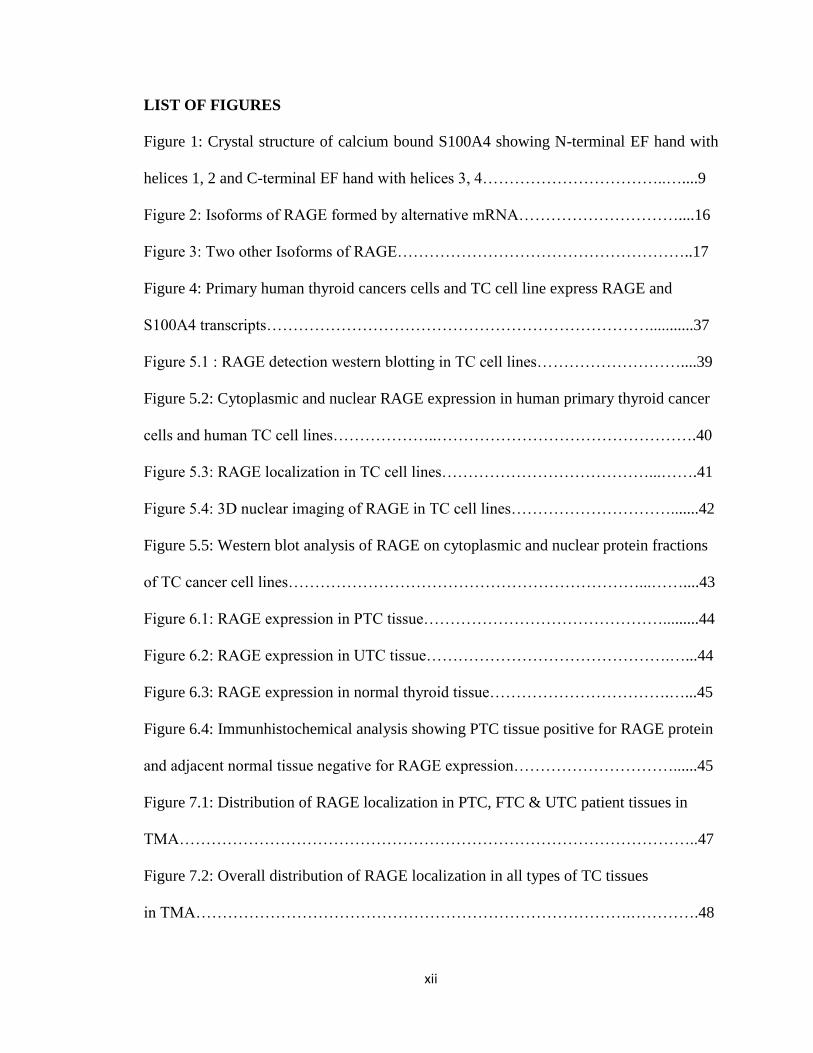
LIST OF FIGURES
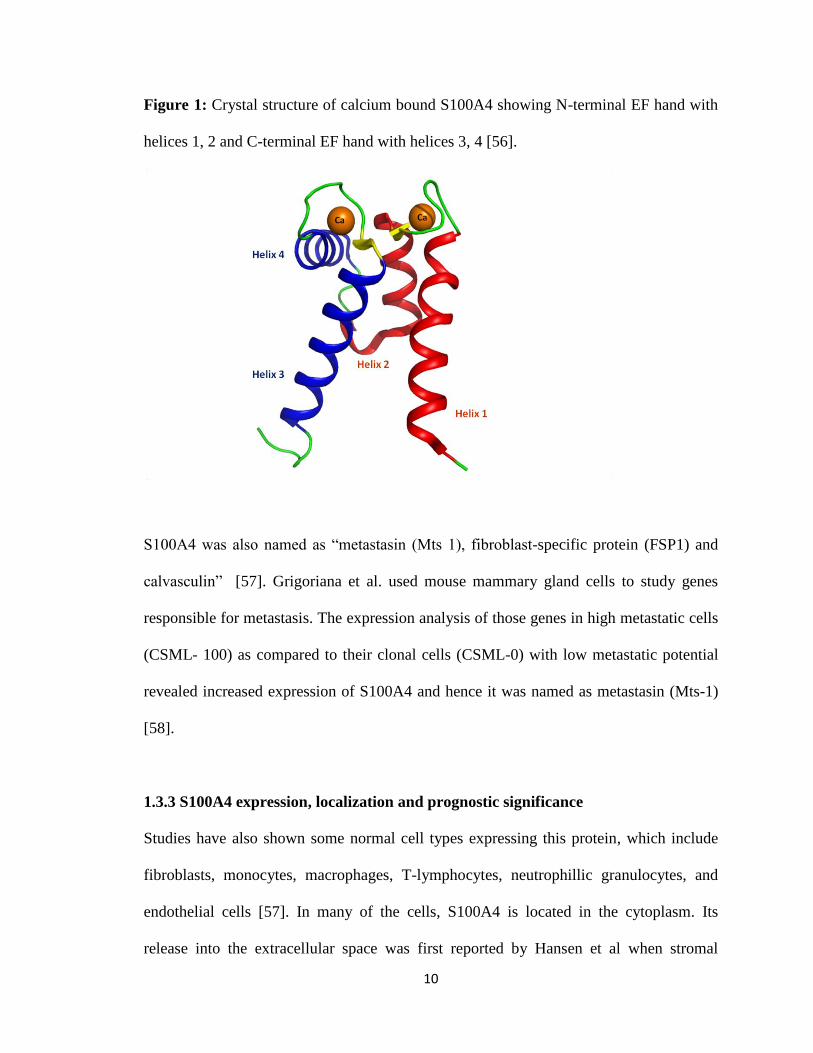
Figure 1: Crystal structure of calcium bound S100A4 showing N-terminal EF hand with
helices 1, 2 and C-terminal EF hand with helices 3, 4……………………………..…....9
Figure 2: Isoforms of RAGE formed by alternative mRNA…………………………....16
Figure 3: Two other Isoforms of RAGE………………………………………………..17
Figure 4: Primary human thyroid cancers cells and TC cell line express RAGE and
S100A4 transcripts………………………………………………………………...........37
Figure 5.1 : RAGE detection western blotting in TC cell lines………………………....39
Figure 5.2: Cytoplasmic and nuclear RAGE expression in human primary thyroid cancer
cells and human TC cell lines………………..………………………………………….40
Figure 5.3: RAGE localization in TC cell lines…………………………………...…….41
Figure 5.4: 3D nuclear imaging of RAGE in TC cell lines………………………….......42
Figure 5.5: Western blot analysis of RAGE on cytoplasmic and nuclear protein fractions
of TC cancer cell lines…………………………………………………………...……....43
Figure 6.1: RAGE expression in PTC tissue……………………………………….........44
Figure 6.2: RAGE expression in UTC tissue……………………………………….…...44
Figure 6.3: RAGE expression in normal thyroid tissue…………………………….…...45
Figure 6.4: Immunhistochemical analysis showing PTC tissue positive for RAGE protein
and adjacent normal tissue negative for RAGE expression…………………………......45
Figure 7.1: Distribution of RAGE localization in PTC, FTC & UTC patient tissues in
TMA……………………………………………………………………………………..47
Figure 7.2: Overall distribution of RAGE localization in all types of TC tissues
in TMA……………………………………………………………………….………….48

xiii
Figure 8: Co- Immunoprecipitation of RAGE with S100A4 in TC cells……………….49
Figure 9.1: S100A4 and AGE-BSA induce migration in TC cells………………….......51
Figure 9.2: No effects of S100A4 on cell viability and cell proliferation………………52
Figure 10.1: Knock down of RAGE in FTC 236 cells using small interference RNA
(siRNA)……………………………………………………………………..…………..54
Figure 10.2: Migration assay in FTC 236 cells after RAGE knock down…………..54-55
Figure 11.1 : Expression of RAGE cytoplasmic signaling molecule Diaphanous-1 (Dia-1)
in TC cell lines…………………………………………………………………………..56
Figure 11.2 : Localization of Dia-1 in the cytoplasm of TC cell line……………...........57
Figure 12.1 : Knock out of Dia-1 in Dia-1 shRNA stable clones………………………58
Figure 12.2: Migration assay in Dia-1 knock out FTC 236 cells……………………….59
Figure 13 : Extracellular S100A4 activaes ERK signaling in TC cells……………........61
Figure 14.1: ERK signaling in RAGE knock down C643 cells……………………........63
Figure 14.2 : Delayed ERK signaling in Dia-1 knock down C643 cells………………..64
Figure 15 : Phosphorylation of IKBα by extracellular S100A4, AGE-BSA and PMA in
Ftc 236 cells………………………………………………………………...……………66
Figure 16 : Phosphorylation of JNK by extracellular S100A4, HMGB1 in Ftc 236 cells
and by S100A4 in C643 cells……………………………………………………………68
Figure 17: WST assay analysis of cells treated with DNA damaging agent
etposide………………………………………………………………………………….70
1
CHAPTER 1: INTRODUCTION
The thyroid gland is an endocrine gland consisting of two lobes situated in the neck
adjacent to the trachea. It produces the thyroid hormones T3 and T4as well as calcitonin
and is essential in the regulation of body temperature and energy homeostasis. The
synthesis and secretion of thyroid hormones is regulated by the pituitary thyroid
stimulating hormone (TSH).
1.1 Thyroid cancer (TC)
Thyroid cancer (TC) is the most commonly occurring cancer of the endocrine gland and
usually appears as a mass of cells within the normal thyroid known as thyroid nodule
(TN). Most of the TN’s are benign but 5% of TN’s are observed to be malignant [1].
Frequent exposure to radiation and also low iodine in diet may contribute to TCs and
women are at higher risk in acquiring TC when compared to men (ratio 3:1) [2].
1.1.1 Types of Thyroid cancer
Thyroid cancer arises from follicular epithelial cells lining the thyroid follicle and para-
follicular cells or C-cells. Based on their histopathology, there are mainly four types of
thyroid cancers: Differentiated thyroid cancers (DTC) such as, papillary thyroid cancer
(PTC), follicular thyroid cancer (FTC), undifferentiated thyroid cancer (UTC) or
anaplastic thyroid cancer arising from follicular epithelial cells and medullary thyroid
cancer (MTC) arising from para-follicular cells or C- cells [3].

2
1.1.2 Histological appearance of thyroid cancer derived from thyroid follicular
epithelial cells
Papillary thyroid Cancer (PTC)
PTC is the most commonly occurring TC arising from follicular epithelial cells. It is
observed with greater incidence in women as compared to men, usually between the age
groups of 20-50 [4][5][6]. The histopathological analysis of PTC tissue reveals distinctive
features such as “nuclear crowding, enlargement and grooving with irregular nuclear
membrane and intranuclear cytoplasmic inclusions, chromatin clearing or orphan annie
nuclei” which are so called since they appear to be devoid of chromatin material. PTC is
further subclassified based on their histopathology into a follicular variant, tall cell
variant, columnar variant or clear cell variant, which also play an important role in
prognosis [3].
Follicular thyroid cancer (FTC)
It accounts for 5-15% of the TC’s in the US alone and its incidence is more in women
and people with a low iodine diet [7]. FTC is divided into two main types: widely
invasive FTC and minimally invasive FTC. Widely invasive FTCs present as solid mass
with high cellular content and intense “microfollicular and trabecular growth” with
“vascular and capsular penetrations” [8]. Minimally invasive FTCs on the other hand, are
solitary tumors in a nodule that are encapsulated in a thick fibrous capsule [9]. These
solitary tumors form foci that are seen connected with the fibrous capsule [10].
Anaplastic thyroid Cancer or Undifferentiated Thyroid cancer (UTC)
UTC is the most aggressive form of TC which accounts for only 2% of the TC’s. UTC
occurs most commonly in the age group above 60 years presenting with distant
3
metastases and poor survival rate [11]. The three histological patterns often found in UTC
are spindle, giant and squamoid cell variants having equal prognostic importance [12].
These UTC tumors contain numerously dividing cells, necrotic areas and vascular
invasions [12, 13].
1.1.3 Factors influencing prognosis in thyroid cancer
The prognosis in DTC depends on age, with 90% survival in patients up to 45 years
declining steadily after 65 years (personal communication Dr. A. Pathak, Dept. of
Surgery). There are several other factors that play an important role in determining the
prognosis of TC.
Histology:
PTC has a fairly good prognosis with 90% of the patients surviving for 10 years with
treatment [14] as compared to FTC and UTC which are 75% and 14 % respectively [15].
A recent study on 10 year survival rates in patients of all age groups in PTC and its
variant- Follicular variant of papillary thyroid cancer (FVPTC), did not observe any
significant difference [16]. Unlike FVPTC, the tall cell variant (TCV) was shown to have
low survival rates as compared to PTC. The five year survival rate in TCV patients was
found to be 81% with higher mortality rate as compared to PTC [17].
Tumor size:
A recent study involving PTC patients has identified tumor size as an important
prognostic factor. The occurrence of distant metastases (DM), LN recurrence and
mortality rate was also observed to be higher in patients having large tumor (size > 4 cm)
as compared to the patients having small tumors (size<1 cm) [18]. Similarly, studies done
on FTC have identified poor 10 year survival rates in patients with tumor size (> 4 cm),
4
and these patients also showed metastasis at the time of initial diagnosis [19]. A
comparative analysis on PTC and FTC revealed increased extrathyroidal growth, LN and
DM corresponding with an increase in the tumor size (>2 cm) [20].
Lymph node metastases:
The effects of lymph node metastasis on survival has long been under scrutiny in TC
patients [21]. LN metastasis at the time of initial diagnosis coincided with increased
chance of recurrent DM in PTC patients [22]. Some studies have identified LN
metastases as having no effect on the survival of patient, instead studies have shown that
LN metastases in higher age groups resulted in an increased tumor recurrence [23]. Other
studies have also shown that PTC and FTC patients diagnosed with LN metastasis at
initial stages did not respond well to treatment with radioactive iodine and developed DM
and aggressive tumors in the later stages [23]. None of these studies have described LN
metastasis as a lone prognostic factor affecting patient survival. Instead a study involving
patients older than 45 years with LN metastases has demonstrated a decreased survival
rate than their younger counter parts (age 20-40) in both PTC and FTC [24].
Distant metastases [DM]:
Although LN metastasis has been described to play an important role in recurrent TC,
DM is suggested to be an important prognostic factor in determining the patient’s
survival. The main cause of deaths in TC is due to DM, but only 5-10 % of the patients
present with DM at the initial stages [21]. The sites for DM include lung, bone,
mediastinum, skin and very rarely brain [25, 26]. In DTC the percentage of lung
metastasis varied within different types (71% in PTC, and 35% in FTC) however, 12%
patients presented with bone metastases in PTC and 36% in FTC [26, 27]. The overall
5
survival rate was 50% in patients with DM at initial presentation of disease and the
prognosis was poorer in high risk patients (age > 45, initial extrathyroidal tumor
extension and DM in lungs); notably however, younger population with pulmonary DM
were found responsive to treatments [28]. Thus, the prognostic factors such as LN and
DM were identified to be involved in recurrence and as affecting TC patient survival.
Since the above two processes involve cancer cell migration which are common in DTC
and are responsible for poor prognosis in patients with UTC is necessary to study the
molecules and processes involved in migration of thyroid cancer cells.
1.2 Molecules and processes involved in thyroid cancer growth and migration
The process of cancer cell migration includes several steps: detachment of cancer cells
from the primary tumor which are then carried through lymph or blood into a new organ
leading to the formation of secondary tumors [29]. Recent studies on PTC tissues have
shown increased expression of the epithelial mesenchymal transition (EMT) marker
vimentin and also transforming growth factor β (TGFβ) at the invading fronts indicating
the role of EMT in thyroid cancer cell migration [30]. Moreover the TGFβ is known to
induce SMAD phosphorylation and induce EMT via MAPK pathway in PTC cells [31].
The TC cell migration was also shown to be induced by EGF, transcriptional coactivator
with PDZ-binding motif (TAZ) and Runt related transcription factor 2 (Runx2) via
upregulation of EMT molecules vimentin, fibronectin-1, Snail1,23 and Twist1, and these
actions were mediated via RAS, RAF and MEK pathways [32-34]. Other molecules
identified to be involved in thyroid cancer cell migration are the relaxin family peptides
[35, 36].

6
1.2.1 Relaxin family peptides.
Relaxin was the first member to be discovered in 1920 in gopher and in guinea pig.
Recombinant DNA studies using porcine and rat ovarian cDNA have identified the
structure and expression of relaxin in mammals [37, 38]. Relaxin (RLN) family peptides
consists of RLN1, RLN2, RLN3 and insulin like (INSL) 3, 4, 5, 6 [39, 40]. The RLN
active peptides are heterodimeric molecules consisting of a B-chain and an A-chain that
connected by two inter-chain disulphide bonds and two intra-chain disulphide bonds [41].
1.2.2 Physiological role of relaxin
RLN is known as a pregnancy hormone. RLN is associated with the growth and
development of cervical stromal cells during pregnancy, development of nipples and also
in increasing the elasticity and flexibility of pubic symphysis during parturition [42].
Apart from the reproductive system, RLN has other physiological roles which include
vasodilatation of arteries, capillaries, and venules in the heart and liver [41].
1.2.3 Role of RLN family peptides (RLN2 & INSL3) in thyroid cancer
RLN2 was expressed in PTC, FTC and UTC but not in normal and hyperplastic tissues
[38]. The TC cells expressing RLN2 conferred increased potential for growth, migration
and invasion through elastin matix. These invasive capabilities were shown to be
dependent on elastin degrading enzymes capthesins- L and D and also on collagen
degrading proteins MMP-2 and MT1-MMP [35, 43]. Another RLN family peptide
molecule INSL3 also increased TC cell migration and invasiveness via upregulating
lysosomal hydrolyzing enzymes like capthesins –L & D [36]. RLN2& INSL3 induced

7
growth and migration of TC cells were found to be dependent on calcium binding protein
S100A4 whose expression and extracellular secretion was shown to be increased upon
treatment with recombinant peptides [44, 45]. Both the RLN family peptide molecules
were involved in S100A4 dependent TC cell migration, hence it is important to study the
role of S100A4 in TC cell migration as it is a known molecule for inducing migration in
many cancers.
1.3 S100 proteins and their role in cancer
1.3.1 S100 protein family
The family of S100 proteins consists of 21 members and many of these are calcium
binding proteins with a molecular weight of 10-12 kilo Daltons (kDa) [46]. S100 proteins
are highly conserved and show some key structural similarities. The polypeptide contains
a C-terminal EF-hand containing a Ca2+
binding domain with a 12 amino acid sequence
(aa) followed by two helices H3 and H4. The N-terminal EF-hand Ca2+
binding domain
has 14 aa sequence, followed by helices H1 and H2 termed as pseudo EF hand. Upon
Ca2+
binding, a conformational change occurs in the C-terminal EF hand exposing the
hydrophobic pockets in H3 of C-terminus. This C-terminal region is important for many
of the S100 proteins to target other molecules. The pseudo EF hand has a minor role in
Ca2+
mediated binding [47]. Many of these S100 proteins are involved in diverse
physiological functions such as regulation of Ca2+
levels, and cytoskeletal reorganization
[47]. They are also well studied molecules in the context of neurodegenerative disorders,
inflammatory diseases, various cardiomyopathies and tumorigenesis.

8
S100A2, A3, A4, A5, A6, A8, A9, A10, S100P, and S100B are members of the S100
family involved in many types of cancers.
S100A2
A TMA analysis of lymphoma tissues demonstrated an increased expression of S100A2
suggesting its role in lymphoma development[48], similarly cDNA microarray analysis
screening of 47,650 transcripts of human breast and non-small cell lung cancer
demonstrated an increase in S100A2 expression, which was further supported by protein
expression analysis [49]. A gene expression analysis on normal and gastric cancer (GC)
epithelial cells also revealed a 90% over expression of S100A2 by Quantitative real time
PCR (qPCR) [50].
S100B
S100B expression has long been evaluated as a marker in melanoma and its increased
serum levels are believed to correlate with reduced survival in melanoma patients[51].
S100A7
Moog-Lutz et al. demonstrated an increased expression of S100A7 transcripts in breast
cancer cells but not in normal cells. Its expression was also noted to be up regulated in
bladder and skin cancers [52]. The expression of S100A7 has long been associated with
poor prognosis and an increased invasion, angiogenesis and tumor growth in high grade
ductal breast carcinoma cells via regulation of matrix metalloproteinase (MMP) and
vascular endothelial growth factor (VEGF) [53].
S100A8 and A9
S100A8 and A9 form heterodimers and are known to promote metastases, they have been
shown to be up regulated in gastric, prostrate, colorectal breast cancers [52]. In lung

9
cancers, they function to increase tumor cell migration by the formation of pseudopodia
and by activating p38 MAPK signaling [54].
S100A11
Studies on S100A11 have demonstrated that higher S100A11 expression is linked with
advanced pathologic state in prostate cancer. It has also been observed that the
localization of S100A11 shifts from nuclear to cytoplasm in tumor cells due to a possible
defect in phosphorylation of the protein [55].
1.3.2 Structure of S100A4
S100A4 is a homodimer containing two subunits. The subunit structure of S100A4
contains two EF-hands in a helix pattern connected by a loop. Out of two EF- hands, one
EF- hand is involved in binding to Ca2+
and the other is pseudo EF- hand with a weaker
affinity towards Ca2+
(Fig 1) [56]. The classification and specific interaction partners for
S100 proteins are based on the differences in amino acid sequence at the C-terminus of
helix 4, which is long and basic for S100A4. Upon Ca2+
binding S100A4 utilizes this C-
terminal hinge region for binding with a wide variety of proteins and exerting different
biological responses depending on the target molecule [56, 57].
10
Figure 1: Crystal structure of calcium bound S100A4 showing N-terminal EF hand with
helices 1, 2 and C-terminal EF hand with helices 3, 4 [56].
S100A4 was also named as “metastasin (Mts 1), fibroblast-specific protein (FSP1) and
calvasculin” [57]. Grigoriana et al. used mouse mammary gland cells to study genes
responsible for metastasis. The expression analysis of those genes in high metastatic cells
(CSML- 100) as compared to their clonal cells (CSML-0) with low metastatic potential
revealed increased expression of S100A4 and hence it was named as metastasin (Mts-1)
[58].
1.3.3 S100A4 expression, localization and prognostic significance
Studies have also shown some normal cell types expressing this protein, which include
fibroblasts, monocytes, macrophages, T-lymphocytes, neutrophillic granulocytes, and
endothelial cells [57]. In many of the cells, S100A4 is located in the cytoplasm. Its
release into the extracellular space was first reported by Hansen et al when stromal

11
fibroblasts in culture were stimulated with human adenocarcinoma cells [57, 59]. Nuclear
expression of S100A4 was observed in colon cancer, and PTC. Nuclear expression was
observed to be a marker for advanced tumor stage and DM [60, 61]. Increased S100A4
expression was first observed in a panel of patients with the onset of breast cancer [62]
with poorer 10 year survival rates as compared to patients negative in S100A4 expression
[63, 64]. In TC, RT-PCR and immunohistochemical studies involving PTC tissues with
and without LN metastases have shown an increased expression of S100A4 whereas
normal tissues were found to be negative for the same indicating its role in TC
aggressiveness and prognosis [61, 65].
1.3.4 S100A4 in tumor cell migration
Metastasis is the phenomenon of spreading of tumor cells from a primary site and
establishing a secondary growth at a different organ.
Breast cancer tissues and cells expressing S100A4 were shown to have increased
metastatic capability to lung, LN, muscle and adipose tissues [66-70]. Similar studies
using breast cancer cell lines in co culture with S100A4 expressing mammary fibroblasts
demonstrated the role of extracellular S100A4 in increasing invasive capabilities in vitro
and in vivo [70]. The expression of S100A4 correlated with higher tumor grades and
increased lung metastasis in prostate adenocarcinoma tissues and cell lines,
demonstrating its role in tumor development [71]. However, its expression was found to
be very weak in benign prostate hyperplasia (BPH) and prostatitis [72]. The gene array
analysis revealed increased expression of S100A4 in pancreatic tumor tissues and cells
compared to normal pancreatic ductal epithelial cells [73], and this increase in expression

12
was also responsible for increased liver metastasis of pancreatic cancer cells [74]. These
studies have identified the ability of several molecules like connective tissue growth
factor (CTGF) [75], porcine RLN [76] and cells in tumor microenvironment to induce the
expression and secretion of S100A4 and thereby increasing in vitro invasiveness in breast
cancer [77]. The mechanisms of S100A4 induced migration involved EMT induced by
TGF-β and EGF signaling leading to decreased expression of E-cadherin, and increased
expression of collagen degrading protein MMP’s in prostate and pancreatic cancers [78-
81]. The migration in colon cancer cells was also shown to be dependent on S100A4,
whose transcription is up regulated by Wnt/β-catenin pathway upon phosphorylation of
β-catenin and its proteasomal degradation [82].
1.3.5 S100A4 in thyroid cancer
Microarray analysis has identified S100A4 over expression in metastatic PTC tissues as
compared to normal tissues. Moreover, S100A4 expression was observed to be intense at
the invading front of the tumor and secondary tumor sites [61]. Recently, our group has
identified relaxin like family peptides (RLN2 and INSL3) to be involved in migration of
human thyroid cancer cells via up regulation of S100A4 mRNA, protein and by its
increased secretion into the culture medium [44, 45]. Other studies using S100A4
transfected PTC, FTC and UTC demonstrated an increase in migration via VEGF and
MMP-9 proteins [83]. Moreover S100A4 expression was only found in advanced thyroid
tumors and in LN metastatic tissues but absent in normal and benign tissues [65]
suggesting its role in thyroid tumor cell migration and aggressiveness. Thus, it is

13
imperative to study the molecular interaction partners of S100A4 associated with
migration and tumor invasiveness.
1.4 Intracellular cytoskeletal binding partners for S100A4
1.4.1 Non muscle myosin II (NMII)
NMII is a motor family protein involved in the formation of myosin filaments that cross
link with actin, thereby affecting cytoskeleton reorganization and migration [84].
Sedimentation and co-immunoprecipitation studies revealed binding of S100A4 to non-
muscle myosin in human pro-myelocytic leukemia cells, breast and cervical carcinoma
cells leading to increased invasive behavior [85-87].
1.4.2 Tropomyosin
Tropomyosins are actin binding proteins; they bind to actin microfilaments and aid in
cell protrusions [88]. Recent immunoprecipitation and co-sedimentation studies revealed
interaction of GST tagged tropomyosin with S100A4 in NIH 3T3 cells [89].
1.4.3 p53
P53 is a transcriptional regulator that binds to several molecules and effects cellular
processes in tumor suppression. S100A4 was observed to bind with C-terminal regulatory
region of p53 and inhibit its binding to DNA and thereby protecting the tumor cells from
apoptosis [90].
Apart from intracellular targets, studies have shown binding of extracellular S100A4 with
cell surface receptors in different physiological conditions.

14
1.5 S100A4 binding with cell surface receptors
1.5.1 Annexin II
Annexins are calcium binding proteins located on the plasma membrane and are involved
in cell surface receptor regulation, and inhibition of phospholipase activity [91]. Recent
studies on primary human cerebro-microvascular endothelial cells (HCEC) have
identified extracellular S100A4 binding and co localizing with cell surface annexin, to
further induce the convertion of plasminogen to plasmin, leading to angiogenesis [92].
1.5.2 Receptor for advanced glycation end products (RAGE)
RAGE is a mutli-ligand receptor which has the ability to bind with wide variety of
molecules like AGE’s, HMGB1, Amyloid β and S100 proteins. The ability of this pattern
recognition is due to highly positive charged V1 and C1 domains of extracellular surface
that were able to bind negatively charged molecules [93]. A recent study on chondrocyte
cells from osteoarthritis (OA) identified extracellular S100A4 and RAGE interaction,
resulting in MMP-13 production. This interaction led to degradation of cartilage in OA
patients via activation of NFkB, ERK and JNK signaling pathway activation [94]. Apart
from S100A4, several other S100 proteins (S100A12, S100B, and S100P) were also
shown to interact via RAGE. Pancreatic cancer cells stimulated with S100P have shown
RAGE dependent cell growth and migration. RAGE was observed to be highly expressed
in prostate, colon, pancreatic, breast and gastric cancers [95] .
15
1.5.3 Discovery and expression of RAGE
RAGE was first identified in the late 1990s as a cell surface receptor for advanced
glycation end products (AGE’s) in bovine lung tissues. The cloning of RAGE cDNA in
293 cells demonstrated its cell surface expression, and also displayed binding with radio
labelled AGE and hence is suggested to be an ideal receptor for the latter [96]. RAGE
was found to be expressed in vasculature, endothelium, and smooth muscle cells. At the
cellular level bovine and rat cardiac myocytes, bovine mononuclear cells and alveolar
macrophages expressed RAGE. In humans, in situ hybridization analysis demonstrated
RAGE expression in lung, heart, and skeletal muscles [97].
1.5.4 Structure of RAGE
The RAGE gene is located on chromosome 6 in the major histocompatibility complex
region (MHC) III. It has 11 exons interlaced by 10 introns, and the length of the gene
with its promoter was observed to be 1400 base pairs. The mRNA of RAGE is translated
into mature protein and is expressed as a cell surface receptor. The RAGE receptor
consists of 3 regions: the extracellular region, transmembrane region and intracellular
carboxy- terminal cytoplasmic tail. The extracellular region consists of three domains: N-
terminal variable domain (V1) followed by two constant domains C1 and C2 [96].
1.5.5 Isoforms of RAGE
There are three main isoforms of RAGE so far reported in biological system as a result of
alternative splicing. The first form is, the full length RAGE consisting of all the three
regions, the second isoform that secrets the extracellular domains known as endogenous
secretory RAGE (ENRAGE) acting as a decoy receptor binding to RAGE ligands in

16
extracellular medium. The third isoform lacks the V-domain and is known as N-terminal
truncated RAGE (NT-RAGE) [90]. Apart from these naturally occurring variants there
are two other variants produced known as dominant negative RAGE (DN RAGE) lacking
the intracellular cytoplasmic tail, and soluble RAGE (sRAGE) that is the cleaved
extracellular part of RAGE secreted in several pathological conditions [98].
Figure 2: Isoforms of RAGE formed by alternative mRNA
RAGE structure depicting extracellular ligand binding domains V1, C1 and C2 followed
by trans-membrane region and intracellular cytoplasmic signaling tail, secreted variant
EN-RAGE and N- terminal truncated isoform lacking the V1 domain.

17
Figure 3: Two other isoforms of RAGE
The extracellular cellular region cleaved in pathological conditions producing a soluble
RAGE (sRAGE) (A), whereas the cytoplasmic signaling molecule is not present in
another designed isoform which is termed as dominant negative RAGE (DN RAGE) (B).
1.5.6 Cellular signaling pathways activated by RAGE and its ligands
The ability of RAGE to bind with diverse ligands results in generation of several
signaling pathways in the cells. The NFkB pathway is the common pathway activated by
RAGE in inflammatory cells and in endothelial cells, upon stimulation with AGE’s and
S100 proteins [99, 100]. In glioma and neuroblastoma cells, RAGE association with
HMGB1 is known to induce cell proliferation, neurite outgrowth and migration via
activation of p44/42, p38, NFkB, and small GTPases (Rac& cdc42), which was observed
to be mediated via the cytoplasmic tail of RAGE [101]. However the cytoplasmic
interaction partners for RAGE were least known until recent studies using yeast two
hydrid systems demonstrated diaphanous-1 (Dia-1) as cytoplasmic binding partner of
RAGE involved in activation of rac-1 and cdc42 pathways and inducing migration [102].
ERK1/2 are also observed to bind to C-terminal region of RAGE in human fibrosarcoma
18
cells, and this interaction was observed in the presence a RAGE ligand [103], this
demonstrated MAPK as one of the many downstream signaling molecules of RAGE.
1.5.7 Physiological role of RAGE
The role of RAGE has been extensively studied in the process of neuronal development.
A recent study on rat embryonic cortical neurons and embryonic day 17 neuronal cells
has demonstrated high RAGE protein and mRNA levels. Moreover, these neurons
exhibited enhanced neuronal development upon stimulation with physiological RAGE
ligand HMGB1, which was abolished by using RAGE blocking antibody and soluble
RAGE (sRAGE) [104]. In vivo studies involving dominant negative (DN) RAGE
(lacking cytoplasmic domain) have shown decreased macrophage infiltration and
neuronal regeneration at the site of injury [105] . RAGE is also expressed in human lung,
liver, endothelial cells, and monocytes, playing an important role in recruiting immune
cells in response to immune reactions [106].
1.5.8 Role of RAGE in cancer
The expression of RAGE has been identified in breast, prostate, pancreatic and colon
cancer tissues and cell lines [48, 107]. RAGE is shown to increase the breast cancer cell
proliferation, survival and associated with aggressiveness [108]. Moreover, S100
(S100A4 and S100A6) and RAGE protein co-localization was observed in MDA-MB
231 breast cancer cells [48]. Studies have identified RAGE as an important factor in
prostate cancer progression [109] whose decreased expression resulted in decreased
prostate cancer cell proliferation, and induction of caspase mediated apoptosis [110]. A
recent study involving RAGE agonist AGE-BSA showed increased migration in prostate
19
cancer cells via activation of MAPK signaling pathway and MMP - 2, 9 [107], explaining
the involvement of RAGE in cancer cell migration. In pancreatic and colonic cancer cells
RAGE played an important role in inducing proliferation, cell survival and migration,
upon stimulation with its ligands S100P, S100A8/A9. Moreover, these interactions led to
activation of several signaling pathways like NFkB, SAPK/JNK and ERK 1/2 [111-113].
All these studies reflect the general role of RAGE and ligands in promoting cancer cell
growth, migration, survival and aggressiveness.
1.6 Rationale of the study
Thyroid cancer is the most commonly occurring cancer of endocrine glands with good
prognosis and survival rates. However, the prognosis in some patients with recurrence,
local invasion and distant metastasis is poor often leading to decreased survival. The
molecular mechanisms behind these phenomena are not well studied. S100A4 was found
to be expressed in metastatic thyroid cancer tissues and was also suggested to increase
tumor cell migration. However, the influence of extracellular S100A4 and its interaction
with RAGE in thyroid cancer is not studied. This will be the first study utilizing human
TC cell lines, primary human thyroid cancer cells, and cancer tissues to observe the
expression of RAGE. Our main aim was to investigate the potential interaction of
S100A4 with RAGE and its role in the migration of TC cells. Identifying RAGE as an
interaction partner for S100A4 mediating the pro-migratory effects in thyroid cancer will
be helpful in elucidating possible mechanisms involved in cancer cell migration. This
study might also help design efficient strategies to control the metastasis of thyroid
tumors and improve the survival of TC patients.

20
1.7Hypothesis and objectives
1.7.1 Hypothesis
S100A4 induces thyroid cancer cell migration through activation of the receptor for
advanced glycation end products (RAGE).
1.7.2 Objectives
1. To determine the expression of RAGE transcripts and protein in TC cell lines,
primary TC cells, and tissues.
2. To identify a potential interaction between extracellular S100A4 and RAGE in
TC cells.
3. To determine the role of RAGE in mediating the S100A4-induced increased
motility of TC cells.
4. To identify signaling pathways activated by extracellular S100A4.
21
CHAPTER 2: Materials & Methods
2.1 Cell Culture:
2.1.1 Cell lines
Human thyroid cancer (TC) cell lines FTC 236, FTC 236 Dia-1 KO, C643, C643 Dia-1
KO,TPC-1, Bc-Pap cells were cultured in Dulbecco’s Modified Eagle’s medium/Nutrient
F-12 Ham 1:1(DME/F12, Hyclone, Thermo Scientific, Waltham, MA, USA) with 10%
Fetal Bovine Serum (FBS, Invitrogen, ON, CANADA). Cells were maintained in a
humidified incubator with 95% air and 5% CO2 at 37˚C and were passaged once every 2
to 3 days.
2.1.2 Productions of stable Diaphanous-1 (Dia-1) knock out (KO) TC cell lines
Human TC cell lines FTC 236 and C643 were seeded at a density of 5x10⁴ cells/ well in
12 well plates and cultured in DME/F12 1:1, 10% FBS for 24 hours. After 24 h cells
treated with 30µg/ml polybrene for 2 h are transduced with lentiviral particle containing
shRNA for Dia-1, scrambled control (kind gift from Dr. Ghavami, Dept of Physiology,
University of Manitoba, Winnipeg, Canada) containing a puromycin resistance gene. The
cells were transduced at 4, 8 and 12 multiplicity of infections (MOI) for 24 h, followed
by recovery for 10 h. After the recovery, cells that incorporated the shRNA plasmid were
selected using puromycin (4µg/ml) (#P9620, Sigma-Aldrich Co, USA) containing
medium. Cells that activated the puromycin resistance gene survived the selection and
clones were isolated. The protein expression was later checked by Western blotting using
parental and mock transfected cells as controls.

22
2.1.3 RAGE knock down in TC cells through transient transfection
Human TC cell lines FTC 236 and C643 were seeded at a density of 1x10⁵
cells/ well in 6
well plates and cultured in DME/F12 1:1, 10% FBS for 24 hours. After 24 h cells were
treated with small interference RNA (siRNA) for RAGE (#sc-36374, Santa Cruz, CA,
USA) and scrambled siRNA (#sc-37007, Santa Cruz, CA, USA) at a concentration of
80nM. Lipid based reagent-silentfect (#170-3361, BIO-RAD, ON, CANADA) was used
at a volume of 2µl/ 2 ml of medium to encapsulate the siRNA and to deliver it into the
cells. The transfection was carried out for 24, 48 and 72 h, after 24 h lipid containing
medium was replaced with fresh medium to avoid toxicity. At each time point RNA and
proteins samples were collected to check both transcript and protein levels of RAGE.
2.1.4 Primary human thyroid cell culture
Human thyroid primary cells were isolated from tissues obtained after surgery from St.
Boniface general hospital. Human ethics was approved by the University of Manitoba
Human Ethics Board; protocol number: H2010:056. The tissues were washed in
Phosphate buffered saline (PBS) containing antibiotics 1x penicillin/streptomycin
(Gibco/BRL, Grand lsland, NY, USA), minced and the pieces were digested with
prewarmed collagenase (Conc. 500µg/ml) and 10 µg/ml DNAse (both Sigma, St Louis,
MO, USA) for 30-60 min at 37˚C in DME/F12 medium under frequent shaking. The
enzymatic digestion was stopped by adding DME/F12 1:1, 10%FBS and the digested
tissue was filtered through 40µm pore size nylon filter (BD bioscience, San Diego, CA,
USA). The filtrate containing isolated cells was washed with culture medium and
centrifuged at 800 rpm for 5 min. The cell pellet was incubated with red blood cell lysis

23
buffer (NH4Cl, KHCO3, and EDTA-NA2) to lyse the erythrocytes for 5 min at room
temperature (RT). After 5min the lysis was stopped by adding PBS and cells were
centrifuged at 800 rpm for 5 min. The supernatant was discarded and the cell pellet was
resuspended and seeded in 6-well plates. Tumor cells were grown in DME/F12 1:1,
10%FBS supplemented with 1x penicillin/streptomycin (Gibco, Grand Island, NY, USA),
normal cells in Coons medium containing thyroid hormones (1mU/ml TSH, 3.6 ng/ml
hydrocortisone, 10µg/ml insulin, 5µg/ml transferring, 10ng/ml somatostatin and 20ng/ml
glycyl-histidyl-lysine, Sigma-Aldrich Co, USA) and cultured in humidified chamber with
5% CO2 and 95% air. The digested tissues pieces were also cultured for two days to
remove the left over cells after extraction.
2.2 Total RNA extraction
Total RNA from human TC cell lines and primary TC cells was extracted using trizol
(Invitrogen, Burlington, ON, CANADA) and by RNeasy mini kit (Qiagen) and the
concentration of total RNA extracted was measured spectrophometrically at 260nm and
280nm using a Nanovue spectrophotometer (GE Health care, ON, Canada). The extracted
total RNA was separated on 1% agarose gel made in 1x Tris-acetate-EDTA (TAE) buffer
containing 1µg/ml ethidium bromide. The samples that show clear separation of 18s and
28s ribosomalRNA (rRNA) were used for cDNA synthesis.
2.3 cDNA synthesis
Total RNA obtained from TC cell lines and primary TC cells was used at a concentration
of 1µg/µl in 10µl of double distilled water (ddH2O), followed by addition of 50ng/µl

24
random primer (#C118, Promega, Madison, WI, USA), and 10µmol/L deoxynucleotide
triphosphate (dNTP) (Invitrogen, ON, Canada). The mixture was incubated at 65˚C for
10 min, chilled on ice water and quickly centrifuged. cDNA synthesis was performed by
adding reverse transcription master mix containing 5x first strand buffer, 0.1M DTT, and
200 unit/µl SuperscriptII reverse transcriptase. The reaction mixture was incubated at
25˚C for 3min and reverse transcription reaction was carried out in a programmed thermo
cycler using a pre set conditions: 25˚C for 10 min, 42˚C for 50 min, and 72˚C for 15 min.
After synthesis all the cDNA’s were stored at -20˚C.
2.3.1 Polymerase Chain reaction (PCR)
cDNA’s generated using random primers were used for PCR and all the PCR reactions
were carried out in 25µl of PCR master mix solution.
Table 1: Reagents for PCR
Reagent Reaction mixture volume / vial (µl)
Double distilled water (ddH20) 18.8
10x PCR buffer, -Mg 2.5
50mM Magnesium chloride (Mg) 1.0
100umol/L dNTPs 0.5
20nM Forward primer 0.5
20nM Reverse primer 0.5
(5U/µl) Taq DNA polymerase 0.2
cDNA 1

25
Transcripts were amplified from selected TC cell lines and primary TC cells. The PCR
cycle consisted of an initial denaturation step at 95˚C for 3 min, a denaturation step at
95˚C for 1 min, annealing at specific temperature for 1 min, and finally elongation step at
72˚C for 2 min. The annealing temperature was selected based upon the GC and AT
content in each primer pair. Glyceraldehyde 3-phosphate dehydrogenase (GAPDH) was
used as a control to assess the quality of cDNA. The amplified transcripts were run on a
1% agarose gel prepared in 1x TAE buffer with 1µg/ml ethidium bromide. The bands
were visualized using a gel documentation system Fluorchem-8900 gel imager (Alpha
Innotech Corp, San Leandro, CA, USA).
Table 2: Primer sequences used in PCR amplification reaction
Gene Primer Primer sequence -(5' to 3') Tm Base pairs
No. of PCR
cycles
S100A4 Forward
Reverse
GAAGGCCCTGGATGTGATGGTG
CATTTCTTCCTGGGCTGCTTATC
60 289 35
RAGE Forward
Reverse
TCCCCGTCCCACCTTCTCCTG
CTCCTCTTCCTCCTGGTTTTCTG
63 540 40
TLR4 Forward
Reverse
CCTTCCTCTCCTGCGTGAGAC
TTCACACCTGGATAAATCCAG
60 280 35
GAPDH Forward
Reverse
CATCACCATCTTCCAGGAGCG
TGACCTTGCCCACAGCCTTG
60 340 20

26
2.4 Recombinant proteins, peptides and inhibitors used in the study
1) Recombinant human S100A4 (rhu S100A4) (Genway biotech, #GWB-P1718B) is
produced in E.coli, N-terminal His-tagged and 1- 101 amino acids in length.
S100A4 Amino acid sequence:
MGSSHHHHHHSSGLVPRGSHMACPLEKALDVMVSTFHKYSGKEGDKFKLNKSE
LKELLTRELPSFLGKRTDEAAFQKLMSNLDSNRDNEVDFQEYCVFLSCIAMMCN
EFFEGFPDKQPRKK
2) High mobility group box 1 peptide (HMGB1) (Abcam, #ab18650) is a synthetic
peptide derived from residues 150- 215 [114] .
3) Advanced Glycation End Product –BSA (AGE-BSA) was purchase from Biovision,
CA, USA).
4) Phorbol 12-myristate 13-acetate (PMA) was purchased from Sigma-Aldrich Co, USA).
5) MEK inhibitor (#PD98059) was purchased from Cedarlane, Canada was used
(Conc.10mM) as a control for to block ERK phosphorylation in TC cells treated
stimulated with rhu S100A4 and AGE-BSA.
2.5 Western Blotting
Cells were cultured in DME/F12 1:1, 10% FBS and serum starved for 24 h. After
starvation cells were treated with rhuS100A4 (250nM, 500nM), HMGB1 (5µg/ml), AGE-
BSA (10µg/ml) and lysed using 1x laemmli extraction buffer under reducing conditions
(125 mmol/ L Tris-Hcl, pH 6.8, 4%SDS, 20% glycerol, 10% mercaptoethanol (ME), 2%
bromophenol blue. The nuclear and cytoplasmic fraction proteins were obtained by kit
based method (NE-PER Nuclear & Cytoplasmic extraction kit, #PI78833, Thermo
27
scientific, Canada). Protease and phosphatase inhibitors (both Sigma, ON, Canada) were
added to the lysis buffer and samples were stored at -80˚C until used for western blotting.
For electrophoresis samples were heated at 90˚C for 5 min and 15-20 µl of sample was
loaded on a 10-12% polyacrylamide gel based on the molecular weight of the protein, 5µl
of precision plus protein were used as marker standard (Thermo Fischer Scientific, ON,
Canada). After electrophoresis separated proteins were transferred onto a nitrocellulose
membrane (GE Healthcare) or PVDF membrane (Millipore,) in transfer buffer (500nM
glycine, 50mM tris-HCl, and 20% methanol) for 1 h, RT at 100 volts. The membranes
were incubated in Ponceau solution to visualize the efficiency of transfer. The
membranes were then blocked with 5% milk for RAGE antibody and 3% Bovine Serum
Albumin (BSA) for S100A4 antibody in 1x Tris-buffered saline containing Tween
(TBS/0.01% tween 20; TBST) at RT for 1 h. After blocking, membranes were incubated
at 4˚C overnight with appropriate primary antibodies (see Table 3) in 5% milk for RAGE
antibody, and 5% BSA for S100A4 antibody (Bovine serum albumin) in 1x TBST. After
overnight incubation membranes were washed with 1xTBST 3x5 min and incubated with
appropriate horseradish peroxidase (HRP) coupled secondary antibodies (see Table 4) for
1 h at RT. Membranes were washed 3x5 min and incubated with ECL reagent (Pierce,
ON, Canada) for 2-3 min. The signals were visualized by autoradiography. For re-
probing of membranes with different primary antibody, blots were stripped with stripping
solution (200nM glycine, pH 2.5, 0.005 Tween20) for 15 min.

28
Table 3: Primary antibodies used in western blotting
Primary Antibody Dilution Source Molecular size
(kDa)
RAGE – Against N-
terminus
1:1000 Santa cruz, #SC-5563, USA 55
Diaphanous-1
(Dia-1)
1:700 Santa cruz, #SC-373807,
USA
140
Phospho ERK1/2,
Phospho p44/42
(T202/Y204)
1:1000 Cell signaling, #9160 44,42
Total ERK1/2,
P44/42
1:1000 Cell signaling, #9107 44,42
Phospho JNK/SAPK
T183/Y185)
1:1000 Cell signaling, #9251 55,46
Total JNK/SAPK 1:1000 Cell signaling, #9252 55,46
PhosphoIkB- alpha
(α) (ser 32/ 36)
1:1000 Cell signaling, #9246 44
Total Ikb-α 1:1000 Cell signaling, #4814 43
Beta(β)- Actin 1:15,000 Sigma, #A5441 43
Table 4: Secondary antibodies used in western blotting
Secondary Antibody-HRP
conjugate
Dilution Source
Goat anti rabbit secondary 1:2000
1:3000
#7074
Cell signaling technology
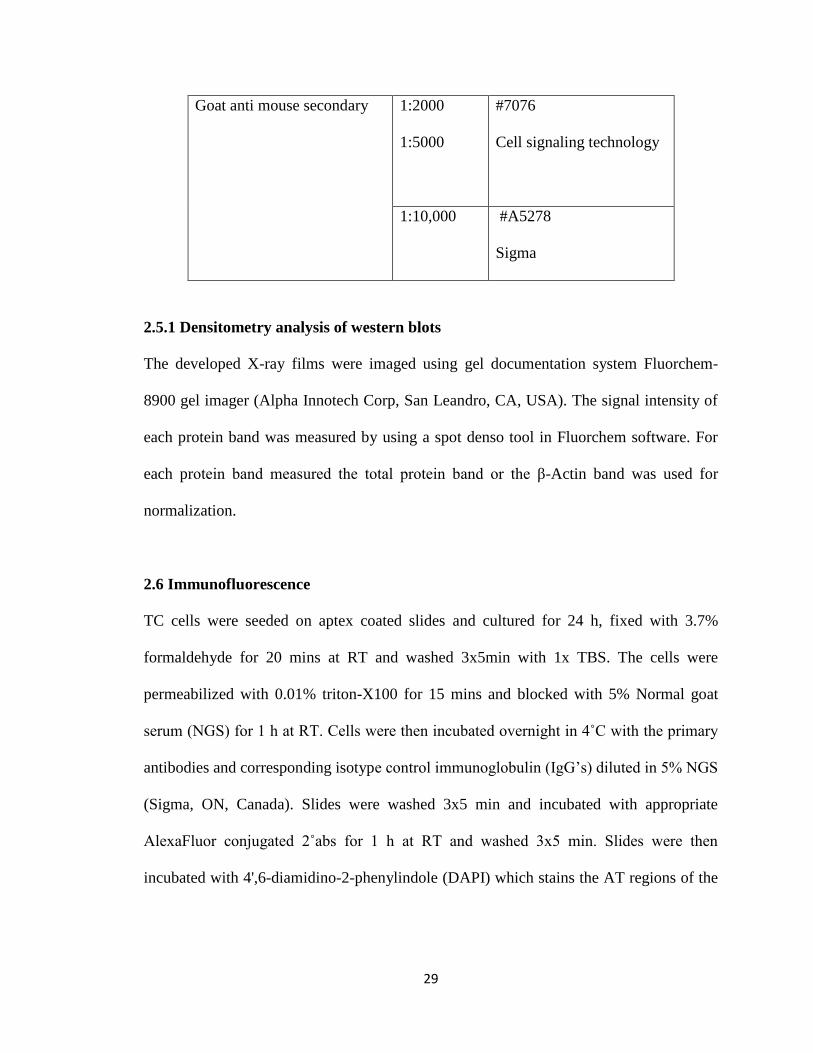
29
Goat anti mouse secondary 1:2000
1:5000
#7076
Cell signaling technology
1:10,000 #A5278
Sigma
2.5.1 Densitometry analysis of western blots
The developed X-ray films were imaged using gel documentation system Fluorchem-
8900 gel imager (Alpha Innotech Corp, San Leandro, CA, USA). The signal intensity of
each protein band was measured by using a spot denso tool in Fluorchem software. For
each protein band measured the total protein band or the β-Actin band was used for
normalization.
2.6 Immunofluorescence
TC cells were seeded on aptex coated slides and cultured for 24 h, fixed with 3.7%
formaldehyde for 20 mins at RT and washed 3x5min with 1x TBS. The cells were
permeabilized with 0.01% triton-X100 for 15 mins and blocked with 5% Normal goat
serum (NGS) for 1 h at RT. Cells were then incubated overnight in 4˚C with the primary
antibodies and corresponding isotype control immunoglobulin (IgG’s) diluted in 5% NGS
(Sigma, ON, Canada). Slides were washed 3x5 min and incubated with appropriate
AlexaFluor conjugated 2˚abs for 1 h at RT and washed 3x5 min. Slides were then
incubated with 4',6-diamidino-2-phenylindole (DAPI) which stains the AT regions of the

30
DNA, washed 3x5 min and cover slipped in anti-fade mounting medium
(Life Technologies Inc, ON, CANADA) and stored at -20˚C until imaged.
2.6.1 Image acquisition
Slides were imaged using the Axioimager Z1 microscope, AxiocamMR3 camera and a
63x/1.40 oil immersion DIC M27 lens (Carl Zeiss, Canada). The 3D nuclear optical
sectioning was done by taking 80 stacks (Z stacks) along the X, Y and Z axis of the cell
nucleus with a distance of 200nM between each Z stack and then rendering the sections
using a deconvultion algorithm in Axiovision 4.8 software (Carl Zeiss, Canada) . The
exposure time was set at 1000 milli seconds (ms) for the alexa 594 as this time did not
show any background from IgG control.
Table 5: Primary antibodies used in immunofluorescence
Primary Antibody Dilution/ Conc. Source
RAGE (Rabbit polyclonal) 1: 1000 #SC-5563, Santa cruz, USA
Dia-1 (Mouse monoclonal) 1: 500 #SC-373807, Santa cruz, USA
Rabbit IgG 0.2 µg/ml #X0930, DAKO, Canada
Mouse IgG 0.4 µg/ml #M5284, Sigma, Canada
Table 6: Secondary antibodies used in immunofluorescence
Secondary Antibody
AlexaFluor (AF) conjugated
Dilution Source
Goat anti rabbit – AF 594 1:2000 Invitrogen,#A11012, Canada
Goat anti mouse – AF 594 1:2000 Invitrogen,#A11005, Canada
31
2.7 Immunohistochemistry
Paraffin embedded tissues of human TC and normal thyroid obtained in collaboration
with Dr. Hoang Vu, Martin-Luther University Halle-Wittenberg, Germany were used to
determine the expression and localization of RAGE protein. Tissue Micro Array (TMA)
of TC tissue from different patients (US Biomax, TH208 Human Thyroid Cancer Tissue
Microarray) was used to determine the expression and localization of RAGE in general to
TC. The TMA slide consisted of 3 cores per patient located at different positions on the
slide. The paraffin embedded tissue on slides were incubated at 60˚C for 2-3 h and de
waxed in xylene 2x10 min at RT followed by 3 min rehydration in each descending ethyl
alcoholic baths: 100%, 90%, 70%, 60%, and 50%. The slides were then equilibrated in 1x
TBS buffer containing Tween-20 for 10 min at RT and endogenous peroxidase was
blocked using 3% hydrogen peroxide (H2O2) in methanol. After blocking peroxidase
activity slides were washed 3x5 min in 1xTBST and antigen retrieval was done in 10mM
citrate buffer (pH 6.0) at 90˚c for 30 min. The slides were cooled for 20 min at RT and
washed 3x5 in 1x TBS and tissues were blocked with 5% Normal goat serum (NGS) for
1h. Tissues were incubated overnight with 5%NGS in 1xTBST containing anti-RAGE
primary antibody (1:1000 dilution,Santa cruz, USA) and rabbit IgGisotype control
antibody. Slides were then washed 3x5 min and incubated with biotin-conjugated goat
anti-rabbit antibody in 1x TBS buffer for 1h at RT and washed 3x5 min. An enhancement
step was done at RT for 30 min using ABC kit (Vectstain ABC kit, #PK-6105) before
starting the reaction with 3, 3’-Diaminobenzidine substrate (DAB). After developing with
DAB the slides were counter stained with freshly filtered harris haematoxylin, dehydrated
in ethyl alcohol and cover slipped using PermountTM
.
32
2.7.1 Image acquisition
Slides were stored at RT and imaged using an Axioimager A1 microscope and an
Axiocam ICc3 camera (Carl Zeiss, Canada).
Table 7: Primary antibodies used in immunohistochemistry
Primary Antibody Dilution Source
RAGE (Rabbit polyclonal) 1:100 (Abcam, #3611, USA)
Rabbit IgG 2 µg/ml #X0930, DAKO, Canada
Table 8: Secondary antibodies used in immunofluorescence
Goat anti rabbit 1:250 (Vector Labs, #BA-1000,)
2.8 BrdU Assay
Human TC cell were seeded at a density of 5x10³ cells/ well in DME/F12 1:1, 10% FBS
in 96–well tissue culture plates and are cultured for 24 h until they reach 60 – 70%
confluence. After 24 hours cells were serum starved for 24 hrs in DME/F12 1:1 and
treated with rhuS100A4 (250nM, 500nM), HMGB1 (5µg/ml) for 24 h. After 24 hrs of
treatment calorimetric ELISA was done using BrdU cell proliferation kit (Roche
diagnostics, Canada). 10µl of BrdU reagent was added to each well of cells at a dilution
of (1: 20,000) and incubated for 3 hours at 37˚C. After incubation the unbound BrdU is
removed and the bound BrdU is fixed with 100µl of fix Denat solution for 30 mins. Thus
fixed cells were incubated with 100µl anti–BrdU secondary antibody per each well for 1
hour at RT and washed with 1x PBS. The washed cells were incubated with 100µl of

33
substrate solution per well for 10 min at RT or until light green colour was developed and
the reaction was stopped using 25µl of 1M H2SO4. The absorbance was measured within
5 min at 450 nm using an ELISA reader (Perkin Elmer, Boston, USA).
2.9 Cell viability (WST assay)
Human TC cells were seeded at a density of 5x10³ cells/ well in DMEM/F12 1:1 and are
cultured in 96 well plates for 24 hours until 60 – 70% confluence. After 24 hours cells
were serum starved for 24 h in DME/F12 1:1 and the then treated with
rhuS100A4(250nM, 500nM), HMGB1(5µg/ml) for 24 hrs. After 24 hours of treatment
WST reagent was added to the cells and incubated in 5%CO2, 37˚C for 2 hrs. After 2 hrs
the WST reagent containing the water soluble tetrazolium compound is converted into
soluble yellow coloured formazan which then is measured qualitatively at 450 nm in
ELISA plate reader (Perkin Elmer, Boston, USA).
2.10 Migration assay
Before the day of migration the cells were cultured under reduced serum condition
DME/F12 1:1, 1% FBS. Assay was performed in 24- well Transwell chambers (Costar,
Corning, NY) separated by a 8-µm pore size polycarbonate filter, and the cells were
seeded at a density of 1x10⁴ on top ofthe filter in DME/F12 1:1, 1% FBS. The cells were
treated with rhuS100A4 (250nM, 500nM) on the filters for 24 hrs to migrate. Untreated
cells were used as control. After 24 hrs of migration filters were rinsed in 1x PBS,
followed by fixing for 5 min with 1:1 PBS: Methanol (EMD, Quebec, Canada) and 10
min in 100% methanol. Fixed cells were stained by 0.1% toulidine blue in 2.5 % sodium

34
carbonate (both Sigma, ON, Canada) for 30 min and dried for 15 min. The remaining
cells on top of the filter were removed by using a wet cotton swab and filters were cover
slipped on to a slide.
2.10.1 Image acquisition and cell counting
Five fields per filter were imaged under light microscope connected to a camera at 10x
magnification (Olympus, Markham, ON, Canada). After imaging the numbers of cells in
each field were counted and added using automation tool on ZEN software (Carl Zeiss,
Canada). The total number of cells migrated were calculated using triplicates.
2.11 Induction of DNA damage
C643 parental cells and C643-S100A4 expressing cells were seeded on 96 wells at a
density of 5x10⁴ cells/ well. The cells were serum starved overnight and then incubated
with apoptosis inducing agent etoposide (#APT 800, Millipore, USA) at concentrations
50µM and 100µM for 24, 48 and 72 h. After each time point the viability of the cells was
determined by WST assay.
2.12 Statistical analysis
The statistical analyses were done using Graph pad prism software. The differences
between the groups were calculated using one way Anova analysis and the confidence
interval in each analyses was set at 95% so the comparisons having a p<0.05 value were
considered significant.

35
CHAPTER 3: RESULTS
3.1 RAGE and S100A4 transcripts are expressed in primary human thyroid cancer
cells and in human thyroid cancer cell lines.
In collaboration with the Department of Surgery, Faculty of Medicine, we have
established a primary thyroid cell repository from 84 patients. 14 of these cases with
thyroid nodules of confirmed TC were selected for transcript analysis. As per our
observation, 80 % of the patients with confirmed histology reports of TC expressed
RAGE transcripts and all the patients expressed S100A4 transcripts (Fig 4A). We have
also observed RAGE and S100A4 expression in a panel of Follicular adenoma (FA)
patients. Apart from primary TC cells (Fig 4A) we have also detected the expression of
RAGE transcript but not S100A4 in human TC cell lines of FTC (FTC236), UTC (C643)
and PTC (TPC-1) (Fig 4B).

36
Table 9: Analysis of RAGE & S100A4 expression in human primary thyroid cancer
and Follicular adenoma cells isolated from patient tissue.
Patient ID Tumor type RAGE expression S100A4 expression
THY-1 PTC * *
THY-7 PTC * *
THY-11 PTC * *
THY-13 PTC * *
THY-17 FTC * *
THY-23 PTC no *
THY-24 PTC * *
THY-26 PTC-LN metastasis * *
THY-28 PTC no *
THY-32 PTC-Metastatic no *
THY-34 PTC * *
THY-42 FTC no *
THY-65 FVPTC no *
THY-72 PTC * *
THY-66 Follicular adenoma
(FA)
* *
THY-67 FA * *
THY-68 FA * no
THY-69 FA * *
THY-70 FA * *

37
Figure 4: Primary human thyroid cancers cells and TC cell line express RAGE and
S100A4 transcripts.
RT-PCR analysis was performed to detect the expression of S100A4 and RAGE in
primary human TC cells (A) and TC cell lines FTC (FTC 236), UTC (C643) and PTC
(TPC-1) (B). GAPDH was used as a control to assess the quality of cDNA synthesized.

38
3.2 RAGE protein is present in primary human TC cells and in human TC cell lines
with cytoplasmic and nuclear localization.
We have shown the expression of RAGE protein in TC cell lines FTC 236, C643 and
TPC-1 and in TC primary cells using western blot (Fig 5.1) and immunofluorescence (Fig
5.2). This demonstrates that RAGE transcript is being translated into protein in thyroid
cancer cells.
RAGE is localized in cytoplasm and the nucleus of TC cell lines.
The TC cell lines grown for 24 hours on cover slips were fixed using formaldehyde and
incubated with anti-RAGE antibody and a corresponding secondary antibody Alexafluor
594. RAGE protein was detected in all TC cell lines. We observed granular cytoplasmic
localization of RAGE in all the TC cells (Fig 5.3). We also observed clustered granular
localization of RAGE in the nuclei of all TC cells. To further confirm the nuclear
localization of RAGE, we performed optical Z-stacks and 3D fluorescence imaging.
Images were taken in optical slices of the nucleus (80 stacks/ nucleus) along the Z-axis of
the entire nucleus using multi dimensional acquisition. After deconvolution and 3D
rendering of the stacked images a granulated staining of RAGE inside the nucleus of all
39
TC cell lines was observed (Fig 5.4). Western blot analysis of nuclear and cytoplasmic
protein fractions in TC cell lines showed nuclear localization of RAGE in all the TC cells
(Fig 5.5) in addition to the cytoplasmic localization.
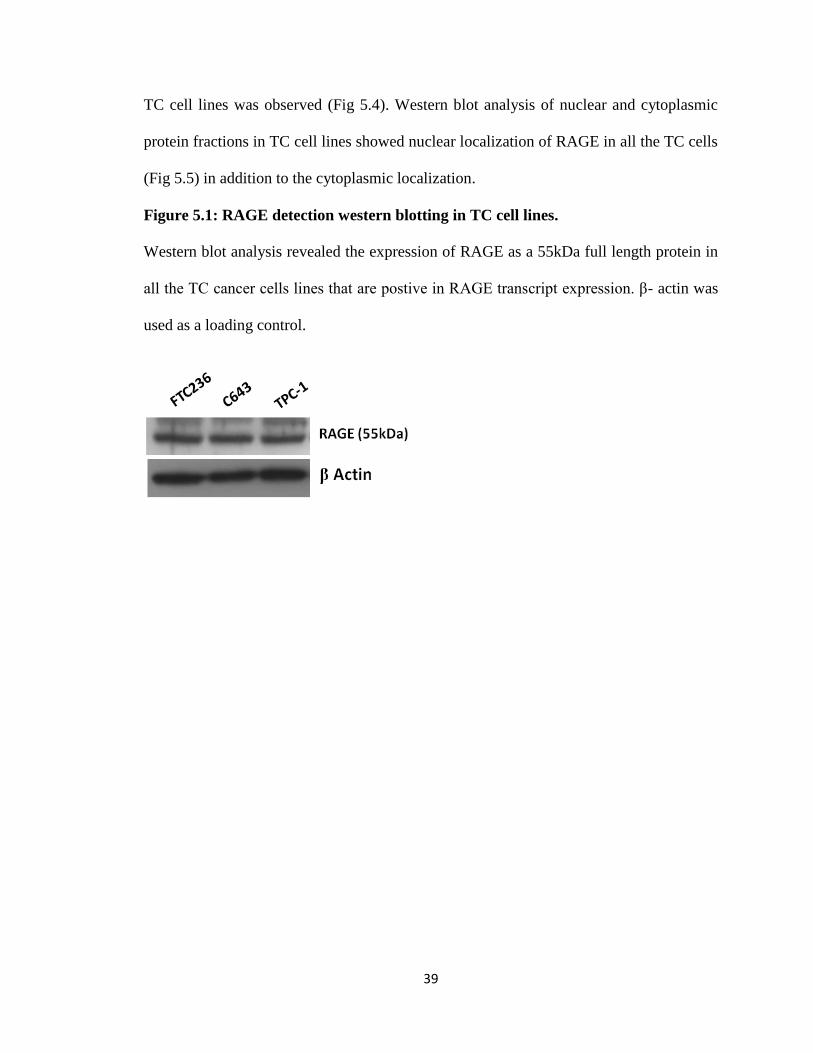
Figure 5.1: RAGE detection western blotting in TC cell lines.
Western blot analysis revealed the expression of RAGE as a 55kDa full length protein in
all the TC cancer cells lines that are postive in RAGE transcript expression. β- actin was
used as a loading control.

40
Figure 5.2: Cytoplasmic and nuclear RAGE expression in human primary thyroid
cancer cells and human TC cell lines.
The human primary thyroid cancer cells PTC (A, B, C) and FTC (E, F, and G) from
different patients’ demonstrated cytoplasmic and nuclear expression of RAGE. Cells
incubated with the corresponding IgG control did not show RAGE staining (D, H).
41
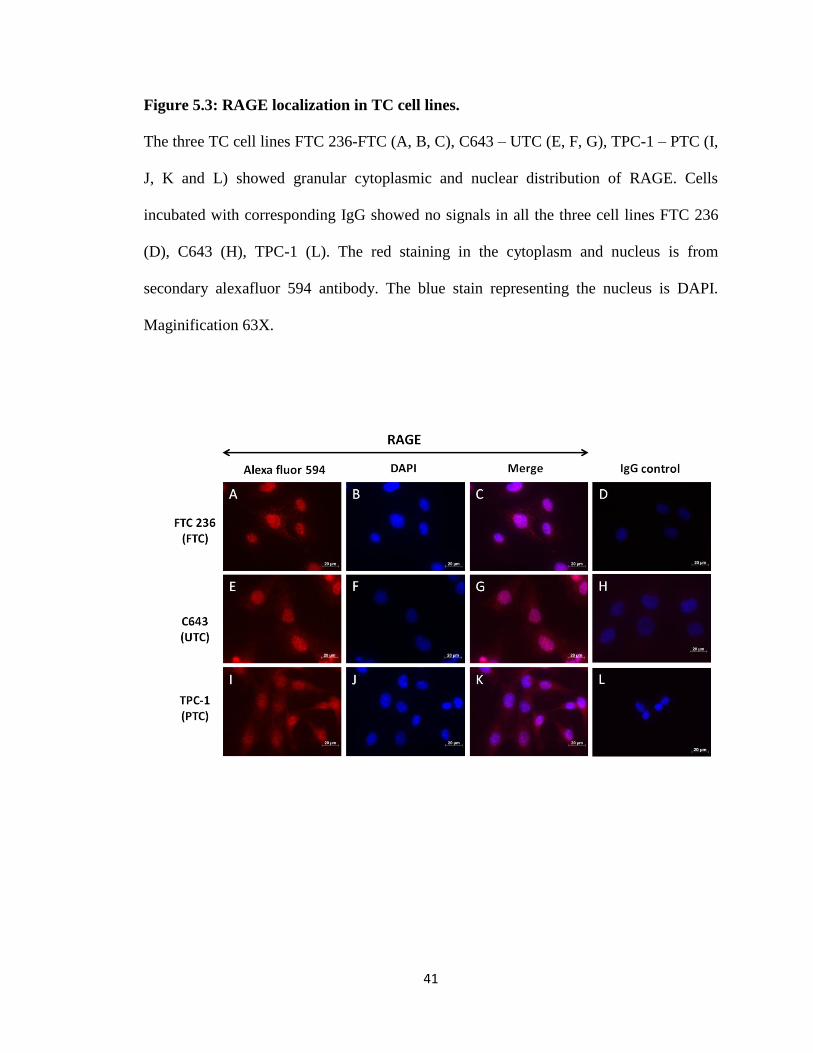
Figure 5.3: RAGE localization in TC cell lines.
The three TC cell lines FTC 236-FTC (A, B, C), C643 – UTC (E, F, G), TPC-1 – PTC (I,
J, K and L) showed granular cytoplasmic and nuclear distribution of RAGE. Cells
incubated with corresponding IgG showed no signals in all the three cell lines FTC 236
(D), C643 (H), TPC-1 (L). The red staining in the cytoplasm and nucleus is from
secondary alexafluor 594 antibody. The blue stain representing the nucleus is DAPI.
Maginification 63X.

42
Figure 5.4: 3D nuclear imaging of RAGE in TC cell lines.
The 3D reconstructed image of the nucleus in three TC cell lines FTC 236 (A), C643
(B), TPC-1 revealed distinct nuclear localization of RAGE. An Alexafluor 549 secondary
antibody was used (red staining). DAPI was used for nuclear counterstain (blue stain).
43
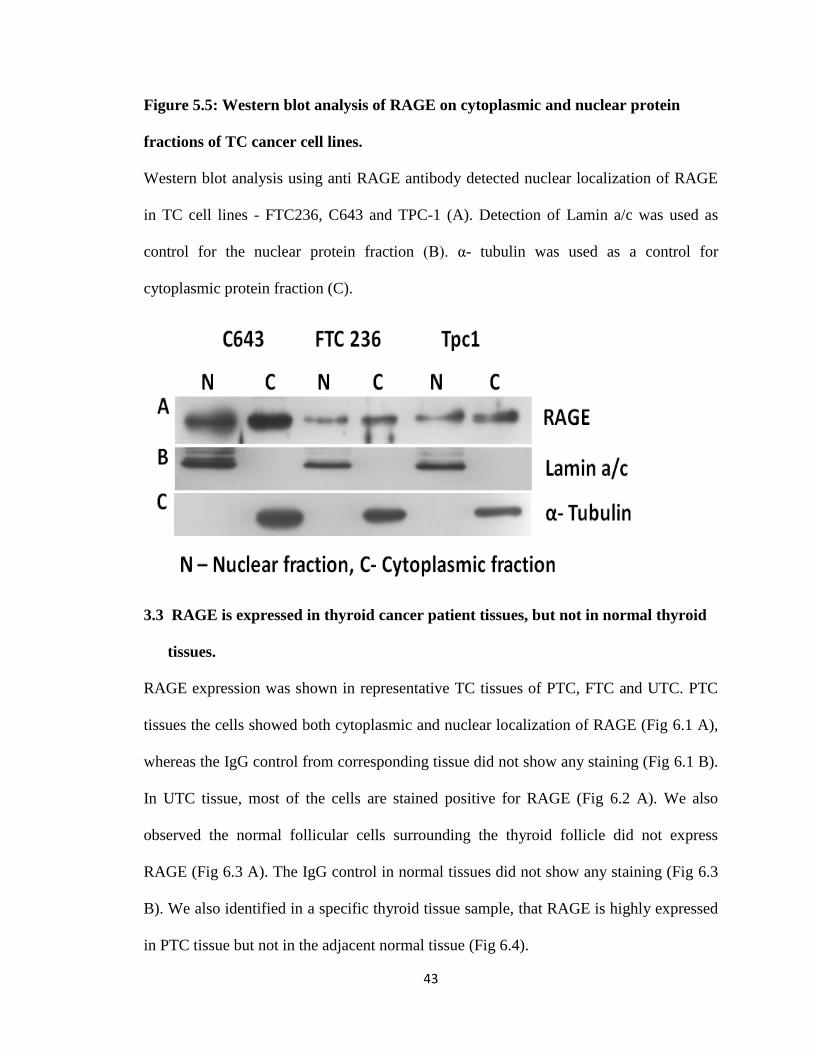
Figure 5.5: Western blot analysis of RAGE on cytoplasmic and nuclear protein
fractions of TC cancer cell lines.
Western blot analysis using anti RAGE antibody detected nuclear localization of RAGE
in TC cell lines - FTC236, C643 and TPC-1 (A). Detection of Lamin a/c was used as
control for the nuclear protein fraction (B). α- tubulin was used as a control for
cytoplasmic protein fraction (C).
3.3 RAGE is expressed in thyroid cancer patient tissues, but not in normal thyroid
tissues.
RAGE expression was shown in representative TC tissues of PTC, FTC and UTC. PTC
tissues the cells showed both cytoplasmic and nuclear localization of RAGE (Fig 6.1 A),
whereas the IgG control from corresponding tissue did not show any staining (Fig 6.1 B).
In UTC tissue, most of the cells are stained positive for RAGE (Fig 6.2 A). We also
observed the normal follicular cells surrounding the thyroid follicle did not express
RAGE (Fig 6.3 A). The IgG control in normal tissues did not show any staining (Fig 6.3
B). We also identified in a specific thyroid tissue sample, that RAGE is highly expressed
in PTC tissue but not in the adjacent normal tissue (Fig 6.4).

44
Figure 6.1: RAGE expression in PTC tissue.
Immunostaining for RAGE on paraffin embedded PTC tissues revealed intense staining
of RAGE in TC cells (A). The corresponding IgG control did not show any staining (B).
Magnification 40X (A, B).
Figure 6.2: RAGE expression in UTC tissue.
Immunostaining for RAGE in UTC tissues (A) demonstrated staining of RAGE in cancer
cells, staining in the corresponding IgG control was negative (B).Magnification40X.

45
Figure 6.3: RAGE expression in normal thyroid tissue.
Normal follicular cells lining the thyroid follicle did not show any RAGE staining (A).
IHC using the corresponding IgG control is devoid of staining (B). Magnification 40X.
Figure 6.4: Immunohistochemical analysis showing PTC tissue positive for RAGE
protein and adjacent normal tissue negative for RAGE expression.

46
3.4 Analysis of RAGE staining patterns in patient tissue by Tissue Micro array
(TMA).
In this study we have used TMA cores of thyroid patient biopsies to determine the
presence of RAGE and characterize the localization of RAGE expression in TC. The
analysis of TMA revealed differences in the localization of RAGE within individual
patient samples in all 3 types of TC’s. The RAGE localization was observed in four
categories based on its cellular location i.e.(Cytoplasm, Nucleus, Cytoplasm + Nucleus
(C+N), negative). The percentages of patients that fall under each category were
calculated by the total number of patients in each type of TC. In PTC patients (n=22),
most of the patients had RAGE localized either in the cytoplasm (31.8%) or in cytoplasm
and nucleus (36.3%) followed by nuclear staining (18.1%). 13% of the patients were
negative for RAGE expression (Fig. 7.1A). In FTC (n=20), most of the patients had
cytoplasmic location of RAGE (45%), and had a equal localization either in
nucleus(15%) or both cytoplasm and nucleus (15%). 25% of the patients were negative
for RAGE (Fig. 7.1B). From a panel of 10 UTC patients the distribution of RAGE was
equal in all the groups. 20% of patients demonstrated cytoplasmic localization of RAGE,
30% only in the nucleus and 20% both in cytoplasm and nucleus. 30% of the population
under study was negative for RAGE expression (Fig 7.1C). This TMA analysis suggests
that overall, most of the patients with TC demonstrate cytoplasmic localization of
RAGE (36.5%), followed by both cytoplasmic and nuclear localization (25%). Nuclear
localization was alone seen in only 10% of the patients and 25% of the patients were
negative for RAGE expression (Fig. 7.2D). The TMA core slide consisted of 3 cores per

47
patient situated at different locations on the slide (PTC = 22 cases, FTC = 20 cases, UTC
= 10 cases). Normal thyroid control tissues (n= 6) were negative for RAGE.
Figure 7.1: Distribution of RAGE localization in PTC, FTC & UTC patient tissues
in TMA.
TMA analysis of RAGE expression and localizationin different cellular compartments in
PTC (A), FTC (B) and UTC (C) patient tissues. The localization in each category denoted
as percentage in the distribution analysis.

48
Figure 7.2: Overrall distribution of RAGE localization in all types of TC tissues
in TMA.
Pie chart analysis of the distribution of RAGE in all types of TC. Most patients
demonstrated cytoplasmic localization of RAGE, followed by staining in both cytoplasm
and nucleus. The number of patients expressing RAGE in nucleus was observed to be the
least. The localization in each category was denoted as percentage in the distribution
analysis.

49
3.5 S100A4 binds to RAGE in TC cells.
Pull down assay using S100A4 coupled agarose beads revealed S100A4 binding to
RAGE in TC cells. BSA coupled beads used as control did not show any RAGE binding.
Cells incubated with the RAGE blocking antibody directed to the extracellular epitopes
of RAGE were unable to bind with S100A4 in these cells. This Co-IP suggested that
extracellular S100A4 binds to RAGE in TC cells.
Figure 8: Co- Immunoprecipitation of RAGE with S100A4 in TC cells.
Bc- pap protein lysate incubated with recombinant S100A4 coupled beads has shown
RAGE immunoprecipitation, BSA coupled beads or Bc- pap cells treated with RAGE N-
terminal blocking antibody used as controls were unable to immunoprecipitate with
RAGE. Total protein extract from Bc- pap was used as a postive control.
Data are provided by our collaboration partner Dr. Ulrike Stein, Max Delbrueck Centre
of Molecular Medicine, Berlin, Germany.

50
3.6 S100A4 and the RAGE agonist AGE-BSA induce TC cell migration but not
proliferation.
Migration assays were performed with FTC 236 cells on transwell chambers containing
8µm pores. Cells starved in 1% FBS-medium for 24 hours were seeded on transwell
chambers and treated with 1µM S100A4 and 10µg/ml AGE-BSA (RAGE agonist) for 24
hours. The treated cells demonstrated a 50 % increase in migration as compared to
untreated control cells (Fig 9.1A). The treated cells also however, displayed some
spindled shaped phenotypic changes in cell morphology (Fig 9.1B). To rule out the
possibility of cell proliferation during the 24 h migration, cell proliferation and viability
analyses were performed using variable concentrations of S100A4. No significant
changes were observed in either cell proliferation or cell viability in S100A4 treated cells
(Fig 9.2). The results shown were obtained from three independent experiments and
significance was calculated using Anova (*P < 0.05, ** P < 0.01).

51
Figure 9.1: S100A4 and AGE-BSA induce motility in TC cells.
FTC 236 cells treated with S100A4 and a RAGE agonist, AGE-BSA, on transwell
migration chambers demonstrated increased migration as compared with untreated
control cells (A). Images taken using a light microscope after 24 h of migration displayed
increased cell density in the lower chamber and change in cell morphology in treatment
groups (B).

52
Figure 9.2: No effect of S100A4 on cell viability and cell proliferation.
FTC 236 cells starved in 1% FBS and treated with increasing concentrations of S100A4
did not have any effect on the viability as determined by WST assay (A) also, a BrdU
incorporation assay did not display a significant increase in proliferation (B). The results
shown were obtained from two independent experiments consisting of triplets and Anova
analysis showed no significant difference between the controls and treatment groups
(S100A4 treated) in both the assays (P > 0.05).

53
3.7 S100A4 and AGE-BSA induced migration in TC cells is RAGE dependent.
FTC 236 cells transiently transfected with RAGE siRNA (Conc. 80nM) demonstrated a
significant knock down in RAGE expression; however, the scrambled siRNA (Conc.
80nM) treated cells did not show any effect on RAGE expression (Fig 10.1 A). The cells
treated with the RAGE siRNA and scrambled siRNA were serum starved and allowed to
migrate for 24h on a transwell migration chamber. The cells on the upper chamber treated
with 1µM S100A4 and RAGE agonist AGE-BSA (10µg/ml) did not show an increase in
migration upon RAGE knock down (Fig 10.2 A), whereas, the cells treated with
scrambled siRNA responded to S100A4 and AGE-BSA treatments and have
demonstrated an increase in migration (Fig 10.2 A). These results identified that RAGE
is involved in S100A4 and AGE-BSA induced TC cell migration. The results shown were
obtained from three independent experiments consisting of triplets for each sample group.
Statistical significance was calculated using Anova (*P < 0.05).

54
Figure 10.1: Knock down of RAGE in FTC 236 cells using small interference RNA
(siRNA).
RT-PCR analysis demonstrated significant knock down of RAGE expression in FTC 236
cells transiently transfected with 80nM of RAGE siRNA. The non-silencing scrambled
siRNA however, did not show any effect on RAGE at transcriptional level, GAPDH was
used as a loading control (A).
Figure 10.2: Migration assay in FTC 236 cells after RAGE knock down.
RAGE knocked down FTC 236 cells did not migrate in response to 1µM S100A4 and
10µg/ml AGE-BSA (RAGE agonist) stimulation, whereas cells treated with scrambled
siRNA displayed an increase in migration with the same concentrations of S100A4 and
AGE-BSA (A). Images of the migrated cells stained in toluidine blue after 24 h of
migration (B).

55

56
3.8 RAGE intracellular signaling molecule Diaphanous-1 (Dia-1) is expressed in TC
cells.
Western blot analysis using anti Dia-1 antibody in TC cell lines, revealed the expression
of RAGE cytoplasmic signaling moclecule Dia-1 inTC cell lines (FTC 236, C643 &
TPC-1). The protein lysate from HEK 293 cells when used as negative control, did not
show Dia-1 expression; however, the protein lysate from Hela cells, which was used as a
control demonstrated a significant expression of Dia-1 (Fig 11.1). We also observed a
cytoplasmic localization of Dia-1 in FTC 236 cells by immunofluorescence. The nucleus
of the cells is devoid of Dia-1 expression. The IgG control-treated cells stained negative
for Dia-1 (Fig 11.2).
Figure 11.1 : Expression of RAGE cytoplasmic signaling molecule Diaphanous-1
(Dia-1) in TC cell lines.
Western blot analysis of proteins isolated from TC cell lines (FTC236, C643, TPC-1)
showed expression of Dia-1 at 135 kDa. HEK 293 cells used as negative control, and
Hela cells were used as positive control for Dia-1. β Actin was used as a loading control.

57
Figure 11.2 : Localization of Dia-1 in the cytoplasm of TC cell line.
Immunofluorescent image taken using an epifluroscent microscope demonstrated
granulated cytoplasmic staining of Dia-1 in formaldehyde fixed FTC 236 thyroid cancer
cells. The red staining in the cytoplasm is from the secondary AlexaFluor 549 antibody.
The blue stain representing the nucleus is DAPI. Maginification 63X.
3.9 Knock out of Dia-1 using shRNA lentiviral transduction.
FTC 236 cells were transduced with lenti virus at 12 MOI containing shRNA plasmid for
Dia-1, and non silencing shRNA plasmid (Mock). Proteins were isolated from the clones
selected in puroycin di-hydrochloride (4µg/ml) medium. The proteins isolated from
puromycin resistant clones were probed in Western blot using an anti-Dia-1 antibody.
The Western blot analysis displayed knock down of the Dia-1 protein (Fig 12.1) in
clones transduced with shDia-1 whereas mock clones expressing non silencing shRNA
did not show any effect on Dia-1 protein expression (Fig 12.1). By using lentiviral shDia-
1 constructs we were able to generate stable Dia-1 knock down clones in FTC 236 cells.

58
Figure 12.1 : Knock out of Dia-1 in Dia-1 shRNA stable clones.
Western blotting analysis of proteins isolated from clones diplayed a knock down in Dia-
1 expression, whereas the cells transduced with control sh vector did not have any effect
on Dia-1 expression and show a strong band for Dia-1 protein in the Western blot.
3.10 Dia-1 cytoplasmic signaling molecule of RAGE is required for S100A4 and
AGE-BSA induced migration in TC cells.
FTC236 Dia-1 knock out clones and Dia-1 expressing cells are seeded on transwell
migration chambers for 24 h migration. Dia-1 knock out cells treated with 1µM S100A4
and 10µg/ml AGE-BSA on migration chambers did not show increased migration (Fig
12.2), whereas the Dia-1 expressing cells responded to S100A4 and AGE-BSA
treatments and displayed a 50% increase in cell migration as compared to the control
untreated cells (Fig 12.2). The results shown were obtained from three independent
experiments consisting of triplets for each sample group. Statistical significance was
calculated using Anova (*P < 0.05, **P < 0.01).

59
Figure 12.2: Migration assay in Dia-1 knock out FTC 236 cells.
The migration analysis revealed that Dia- 1 knock out clones did not respond to S100A4
(conc. 1µM S100A4) and AGE-BSA (10µg/ml AGE-BSA) treatments and hence they
migrated similar to the untreated control group; Whereas the Dia-1 +ve cells responded to
S100A4 and AGE-BSA treatments and migrated more than the control untreated cells.

60
3.11Extracellular S100A4 activaes ERK signaling in TC cells.
ERK is an extracellular regulated kinase and a downstream target of the mitogen
activated protein kinase kinase (MAPKK) MEK1/2. The activation of ERK elicits various
signalling responses in the cell, which include proliferation, differentiation, survival and
migration. The TC cells lines FTC 236 (Fig 13A) and C643 cells (Fig 13B), incubated
with nM concentrations of extracellular recombinant human S100A4 (Conc. 500nM,
250nM) demonstrated increased levels of ERK phosphorylation (Fig 13A), (Fig 13 B).
The maximal level of ERK phosphorylation was observed after 10' and 15' S100A4
incubation as compared to the untreated control cells. The level of total ERK protein
remained equal at all time points in both the FTC 236, and C643 cells. Protein lysates
collected from C643 cells treated with 10 mM MAPK inhibitor were used as controls for
ERK activation in Western blot analysis (Fig 13C). The MAPK inhibitor inhibited the
upstream signaling molecule MEK1/2 and there by abolished the phosphorylation of
ERK (Fig 13C).The results shown were obtained from three independent experiments and
statistical significance was calculated using Anova (*P<0.05, **P<0.01).

61
Figure 13 : Extracellular S100A4 activaes ERK signaling in TC cells.
TC cells FTC 236 (A) and C643 (B) treated with nM concentrations of extracellular
recombinant S100A4 (Conc. 500nM, 250nM) demonstrated increased levels of ERK
phosphorylation as compared to control- untreated cells. C643 cells treated with MEK1/2
(PD98059) (Conc. 10mM) abolished ERK1/2 signalling (C). β-Actin was used as a
control.

62
3.12 S100A4 induced ERK signaling in C643 cells is RAGE independent.
We have demonstrated that extracellular S100A4 stimulates ERK phosphorylation in
C643 cells, and a RAGE dependent migration in Ftc 236 cells. In this experiment, we
have observed that, by knocking out RAGE by siRNA (Fig 14.1A) S100A4 was still able
to induce ERK phosphorylation in C643 cells (Fig 14.1B); Whereas AGE-BSA (RAGE
agonist) induced ERK phosphorylation decreased in RAGE siRNA treated C643 cells
(Fig 14.1C). Scrambled siRNA treated cells have shown ERK phosphorylation both in
S100A4 (Conc. 250nM) (Fig 14.1B) and AGE-BSA (Conc. 10µg/ml) treated cells (Fig
14.1C). The phosphorylation of ERK was observed at 5', 10', 15' time points in S100A4
and AGE-BSA treated cells. We also demonstated that functional knock down of RAGE
i.e., knock down of Dia-1 (Fig 14.2A, ) the cytoplasmic signalling molecule of RAGE,
did not effect S100A4 induced signaling in C643 cells. In addition, we observed a delay
in the phosphorylation of ERK in Dia-1 knock down clones (Fig 14.2B) as compared to
the Dia-1 expressing cells (Fig 14.2C). The phosphorylation in Dia-1 knock down clones
was observed at 10' and 15', whereas the phosphorylation in Dia-1 expressing cells was
observed at 5', 10' amd 15' time points. These results suggest that RAGE is not involved
in S100A4 induced ERK signaling, but it is possible that another signaling pathway
involving Dia-1 may initiate downstream signaling of extracellular S100A4.

63
Figure 14.1: ERK signaling in RAGE knock down C643 cells.
RAGE was knocked down in C643 cells using siRNA and scrambled siRNA treated cells
did not show knock down of RAGE (A). RAGE knock down cells stimulated with
250nM S100A4 induced ERK phosphorylation (B) and AGE-BSA (10µg/ml) treated
cells showed low levels of ERK phosphorylation(C). Cells treated with scrambled siRNA
demonstrated ERK phosphorylation with S100A4 and AGE-BSA. Total ERK levels
remained equal at all time points. β-Actin was used as a loading control.

64
Figure 14.2 : Delayed ERK signaling in Dia-1 knock down C643 cells.
Dia-1 knock down (A) and Dia-1 expressing C643 cells (A) stimulated with 250nM
S100A4 induced ERK phosphorylation. Dia-1 knock down cells demonstrated a delayed
ERK phosphorylation (B) and Dia-1 expressing cells displayed an early phosphorylation
of ERK (C) when stimulated with S100A4. Total ERK levels remained equal at all time
points and β-Actin was used as a loading control.

65
3.13 Extracellular S100A4 activates NF-kB signaling pathway by IkBα
phosphorylation in TC cells.
Nuclear factor of kappa light chain polypeptide gene enhancer in B-cells inhibitor alpha
or NF-kB-α signaling pathway is resposible for tumor cell proliferation, cancer cell
survival and differention. The activation of NF- kB is dependent on phosphoryation of
inhibitory kB unit (IkB unit) and transport of active NF-kB into nucleus thereby causing
transcriptonal regulation of several genes. FTC 236 cells incubated with 500nM
extracellular recombinant S100A4 for several time points, have shown phosphorylation
of IkB-α at 15' time point (Fig 15A). The phosphorylated IkB-α was identified by
Western blotting analysis using a anti-phospho IkB-α antibody, which was detected as a
40 kDa band. FTC 236 cells incubated with 10µg/ml AGE-BSA (RAGE agonist) also
phosphorylated IkB-α at 10’ and 15' time point (Fig 15B). Phorbol 12-Myristate 13-
Acetate (PMA) was used as a positive control for induced IkB-α phosphorylation in FTC
236 cells (Fig 15C). The total IkB-α remained equal at all time points.
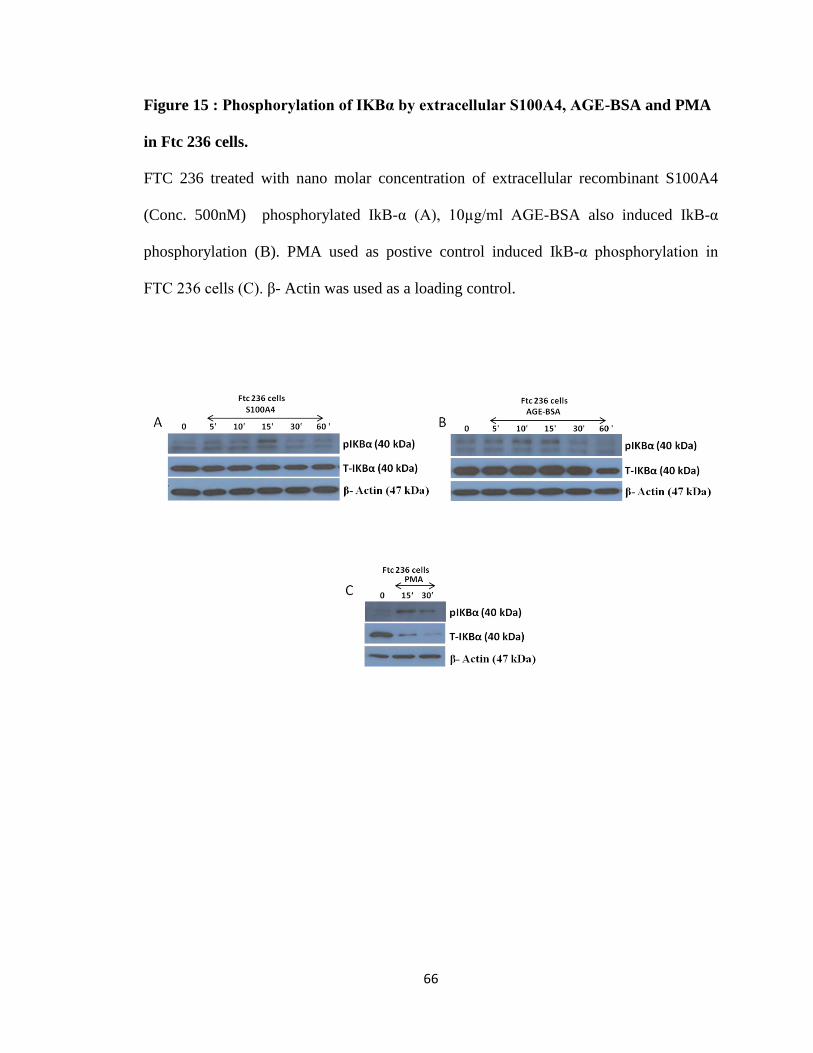
66
Figure 15 : Phosphorylation of IKBα by extracellular S100A4, AGE-BSA and PMA
in Ftc 236 cells.
FTC 236 treated with nano molar concentration of extracellular recombinant S100A4
(Conc. 500nM) phosphorylated IkB-α (A), 10µg/ml AGE-BSA also induced IkB-α
phosphorylation (B). PMA used as postive control induced IkB-α phosphorylation in
FTC 236 cells (C). β- Actin was used as a loading control.
67
3.14 Extracellular S100A4 activates Jun amino terminal kinase (JNK) signaling
pathway in TC cells.
JNK is a member of MAPK family activated by stress, inflammatory cytokines and
different growth factors. The JNK signaling responses include cell survial, differentiation
and inflammaotry responses. We detected an increase in the phosphorylation of JNK in
FTC 236 cells upon treatment with nano molar concentration of extracellular
recombinant S100A4 (Conc. 500nM) (Fig 16A). The physiological ligand of RAGE,
High mobility group box-1 protein (HMGB1) also induced the phosphorylation of JNK in
FTC 236 cells (Fig 16B). The phosphorylation of JNK was identified using an anti-
phospho JNK antibody by Western blot analysis of protein, that are collected from
FTC236 cells incubated with S100A4 and HMGB1 at various time points. The
phosphorylated JNK was observed at 5’, 10’ and 15' time points in the treatment cells.
We also observed the phosphorylation of JNK at 10’ and 15' time points in UTC cell line
C643 upon S100A4 stimulation (Fig 16C).

68
Figure 16 : Phosphorylation of JNK by extracellular S100A4, HMGB1 in Ftc 236
cells and by S100A4 in C643 cells.
TC cells FTC 236 treated with nano molar concentration of extracellular recombinant
S100A4 (Conc. 500nM) showed phosphorylation of JNK (A), Physiological RAGE
ligand HMGB1 (Conc. 10µg/ml) induced JNK phosphorylation (B). Extracellular
S100A4 (Conc. 250nM) induced JNK phosphorylation in C643 cells (C). β- Actin was
used as a loading control.

69
3.15 S100A4 protects TC against genotoxic stress.
C643 parental cells and C643-S100A4 expressing cells were seeded on 96-wee plates and
treated with 50µM and 100 µM etoposide (DNA damaging agent). We have observed
decreased viability in both etoposide concentrations (50µM and 100µM) in C643 parental
cells after 48 and 72 h, but C643-S100A4 expressing cells showed greater viability than
C643 non S100A4 expressing cells (Fig 17). The viability of the cells was measured
using WST assay and values obtained in the treatment groups were averaged by the value
obtained from cells treated with Dimethyl sulfoxide (DMSO), as the apoptosis inducer
was dissolved in DMSO. The values were demonstrated as absorbance at 450nM on the
graph. The values were obtained from three individual experiments each consisting of
triplicate. Statistical significance was calculated using anova analysis (*P < 0.05, **P <
0.01, ***P<0.0001).

70
Figure 17: WST assay analysis of cells treated with DNA damaging agent etposide.
C643 parental and C643-S100A4 expressing cells are treated with etoposide (conc. 50µM
and 100µM) for 24, 48, and 72 h. WST analysis of C643 parental cells showed decreased
cell viability after 48 and 72 h treatment, whereas C643-S100A4 expressing cells have
greater cell viability when compared to parental cells.

71
CHAPTER 4: DISCUSSION
The Hombach lab has shown previously that relaxin-like peptides are increased in human
thyroid cancer and that the small calcium-binding protein S100A4 mediates the enhanced
cancer cell migration induced by relaxin and INSL3 and their G protein-coupled
receptors RXFP1 and RXFP2, respectively (Bialek et al, MCR 2011; Radestock et al.,
MCR 2010; Hombach-Klonisch et al., Int J Cancer 2010; Bialek et al., ANYAS 2009;
Hombach-Klonisch et al., AJP 2006). S100A4 is secreted by thyroid carcinoma cells. We
hypothesize that S100A4 enhances migration in TC cells via RAGE. The main objective
of this study was to determine whether RAGE is expressed in TC cells and TC tissues
and to investigate whether S100A4 functionally interacts with RAGE to enhance cell
migration.
In this study, we have identified RAGE expression at both, the transcript and protein
levels in all types of TC cell lines and in human primary thyroid cancer cells. In the TC
cells lines belonging to three histological types PTC, FTC and UTC we have shown the
expression of RAGE protein as a 55 kDa full length protein. These findings correlate
with the previous studies, where RAGE was been shown to be expressed as a 55 kDa
protein full length protein [115].
We have identified that RAGE is exclusively expressed in PTC, FTC and UTC tissues
but not in follicular cells of normal thyroid tissue. We considered that the weak staining
within the colloid as nonspecific staining as we have previously seen the follicular colloid
reacting unspecifically in IHC staining. Previous studies have shown an increased
expression of RAGE protein and transcripts in pancreatic tumor tissues as compared to
that from the normal tissue [109]. Increased RAGE expression has also been identified in

72
high grade adenocarcinomas of prostate cancer, but its expression was found to be very
weak in benign tissues [116]. The TMA analysis revealed increased expression of RAGE
in colonic cancer tissues but its expression was even higher in breast cancer tissue [48].
In PTC patient tissue, the staining of RAGE was observed at the invading part of the
tumor but not in the adjacent normal tissue which points to the idea of involvement of
RAGE in tumor formation and invasion. Our data correlates with the recent findings of
high level RAGE expression in hepatocellular carcinoma, colorectal carcinoma and its
absence in normal hepatocytes and colonic epithelial cells [117].
TMA analysis of TC tumor tissues has identified 80% of the patients positive for RAGE
expression, whereas many of the normal patient tissues showed very weak or no RAGE
staining. Similar analyses using cancer tissues demonstrated an increased expression of
RAGE in breast adenocarcinoma (67%) and non-small lung cancer tissues (47%) [48].
The cellular distribution of RAGE was described as membrane anchored or cytoplasmic
in tumor cells. In our study, we have identified granular cytoplasmic staining of RAGE in
PTC, FTC, UTC cell lines, and primary thyroid cancer cells. Membrane localization of
RAGE was first identified in the early 1990’s, when RAGE cDNA from endothelial cells
was cloned in 293 cells [96]. A recent study on human endothelial cells has identified
cytoplasmic and membrane localization of RAGE upon stimulation with its physiological
ligand HMGB1 [118]. In another study on pancreatic tumor cells, RAGE was found to be
translocated to mitochondria and cytoplasm upon stimulation with HMGB1 [119];
whereas, RAGE was found to be localized only in the cytoplasm of non-small lung
carcinoma and breast adenocarcinoma cells lines [48]. Thus, our findings correlate with
those from the previous studies in other cancer.

73
Interestingly, we have also observed RAGE localization in the nucleus of TC cells by
immunofluorescence and 3D nuclear imaging and cellular fractionation studies. RAGE
distribution was observed to be localized at distinct regions in the nucleus of TC cells.
Although there are some studies showing the presence of nuclear RAGE by
immunofluorescence [48] so far, they were unable to explain the role of its nuclear
expression. Recent crystallographic studies have shown a direct binding of the RAGE
ectodomain to DNA and RNA in agarose gel shift assays [120] and a study done by one
other group has demonstrated ectodomain shedding of RAGE by ɣ-secretase [121]. We
can say that RAGE ectodomain translocation after its shedding might be the cause for
nuclear localization in TC cells because the RAGE antibody used in IF detects only the
extracellular domain, but more investigation is required to understand its role. Apart from
the nuclear RAGE, our work is focused primarily on cytoplasmic RAGE which is known
to bind to a variety of intracellular and extracellular molecules.
In this study, we have focused on the role of S100A4 induced migration via RAGE in TC
cells. Previously, our group demonstrated that the migration of relaxin (RLN2) and
INSL3 treated TC cells was dependent on S100A4. Human TC cell lines treated with
RLN2 or INSL3 showed an increase in S100A4 protein expression and secretion [44, 45].
These findings prompted us to investigate if extracellular S100A4 mediated increased
cancer cell migration is via a cell surface receptor. Many members of the S100 protein
family are known to signal through cell surface receptors, specifically via RAGE and are
known to cause migration, proliferation and apoptosis in different types of cancers [122].
However, it is currently not known if S100A4 acts through RAGE in TC to increase cell
migration. By using co-immunoprecipitation studies, we have observed an interaction of

74
recombinant human (rhu) S100A4 and RAGE protein in the human PTC cell line
BCPAP. So far, there are no published studies on the interaction between S100A4 and
RAGE in the context of cancer. However, a recent study involving human chondrocytes
in osteoarthritis (OA) has shown an interaction between extracellular rhu S100A4 and
RAGE leading to increased expression of MMP-13 [94]. ERK signaling induced by
S100A4 has been shown to be dependent on RAGE in vascular smooth muscle cells
[123]. Our study will be the first to address in detail about the mechanisms involved in
S100A4 and RAGE interaction in TC. Apart from S100A4, other S100 proteins are also
known to interact with RAGE in different types of cancers. Studies in neuroblastoma cell
lines have shown that S100B protein can interact with RAGE even at nano and micro-
molar concentrations [124]. Similarly, S100A6 at micro-molar concentrations interacted
with C1 and C2 extracellular domains of RAGE in the neuroblastoma cell line (SH-
SY5Y cell line) [125]. S100P protein also interacted with RAGE in pancreatic and
colonic cancer cells and this interaction is abolished when the cells were treated with
RAGE blocking agents [111, 112]. Our results have shown a similar interaction between
S100A4 and RAGE in TC cells indicating RAGE to mediate the pro-migratory effects of
S100A4 in TC. We also confirmed S100A4 binding to RAGE in TC cells, which was
abolished by using a RAGE antibody that blocks the extracellular V domain. RAGE
activation has been reported to evoke several responses in a cancer cells, such as,
proliferation and migration, however, it may also serve to be anti-apoptotic [108, 126,
127].
To test the functional role of S100A4 in TC we used extracellular rhuS100A4 to
stimulate FTC 236, C643 and TPC-1 cells. These TC cell lines did not show any
75
endogenous S100A4 and were positive for RAGE expression and were considered ideal
cell models for testing the extracellular effects of S100A4 without any background effect
of endogenously produced protein. Previous studies on FTC 133 cells treated with INSL3
peptide have demonstrated an increased expression of S100A4 and release into the cell
culture medium. This extracellular S100A4 might interact with RAGE and have an effect
on thyroid tumor cells growth and migration. Although, the TC cell lines used in this
study do not express S100A4, one should consider the heterogeneous population of cells
in a thyroid tumor that expresses S100A4 like the tumor associated macrophages that are
reported to influence the TC cells migration, thyroid endothelial cells and fibroblasts
[128-130] . Studies on differentiated thyroid cancers have shown lymphocyte infiltration,
which points to the role of T and B cells that are positive in RAGE expression [128, 131]
. Recent studies on lymphocytes and fibroblasts in breast cancer tumor microenvironment
identified S100A4 secreted into tumor interstitial fluid [77]. Similar effects can be
attributed to TC cells exposed to fibroblasts, lymphocytes and endothelial cells secreting
S100A4 in thyroid tumor microenvironment. Thus, the use of extracellular S100A4 in
RAGE binding and RAGE functional studies in TC will be useful in mimicking thyroid
tumor microenvironment and in observing the behavior of TC cells.
The TC cells treated with 1µM of rhuS100A4 for 24 hours in a transwell migration
chamber demonstrated an increase in migration compared to the untreated cells. The
RAGE agonist Advanced Glycation End product coupled to a carrier protein Bovine
Serum Albumin (AGE-BSA) also showed an increase in migration of TC cells. S100A4
treated TC cells, however did not show any significant increase in proliferation or
viability as determined by BrdU and WST assays, thereby, providing conclusive evidence

76
that the increased number of migrated cells reflected a true migration response and not an
increase in cells. Although the mode of S100A4 induced TC cell motility was not
addressed in this study, other studies have identified S100A4 to be involved in EMT of
renal proximal tubular cells, alveolar type 2 (AT II), and in biliary cancer cells [132-134].
The results we observed with extracellular S100A4 in TC cell migration reflected
previous studies where, the exogenous S100A4 increased cell motility in human glioma
cells [135] and in mouse mammary tumor cells [136]. A recent study on mouse
embryonic fibroblast cells (MEF) has shown that S100A4 secreted from plasma
membrane increased the migration of these cells (MEF’s) in wound healing assays [137].
None of these studies addressed the involvement of RAGE in migration, but instead
focused on other molecules like Tissue Transglutaminase 2 (TG2), [136] small Rho-
GTPases and their signaling molecules Dia-1 and actin binding proteins [135].
We are the first group to demonstrate S100A4 induced RAGE dependent migration in the
context of thyroid cancer.
RAGE Ko was successfully performed by transiently transfecting FTC 236 cells with
RAGE siRNA. Previous attempts to create stable RAGE Ko clones using lentiviral
shRAGE constructs were unsuccessful. As of yet, we are unable to explain, if there is any
selection mechanism in TC cells to cleave the transduced shRAGE and hence, we relied
on transiently transfected RAGE cells for all in vitro migration experiments in the study.
The RAGE Ko cells when stimulated with rhu S100A4 (1µM) for 24 hours did not show
any increase in migration when compared to the untreated control cells.
To further evaluate the effectiveness of RAGE Ko we used the RAGE agonist AGE-BSA
and this failed to induce migration in RAGE Ko cells. Indeed, both ligands (S100A4 and

77
AGE-BSA) contributed to the increase in migration in the scrambled siRNA treated cells.
Although RAGE mediated S100A4-induced migration was not studied in other cancers,
there are studies on other S100 proteins specifically S100P, whose extracellular
interaction with RAGE induced migration and proliferation in colon cancer cells [112] .
S100A8 & 9 induced migration and co-localization with RAGE molecule in prostate
cancer cells [138]. The fact that S100 molecules were able to bind and activate RAGE
can be explained by their ability to form oligomers. These oligomeric ligands have been
shown to activate RAGE with greater intensity [122]. This is in line with our studies, in
which we have used S100A4 concentrations of 1 µM to best induce a pro-migratory
effect.
RAGE mediated migration responses have been associated with the diaphanous-1 (Dia-
1), which has recently been shown to bind to the cytoplasmic domain of RAGE to induce
migration [102]. We found Dia-1 to be one of the downstream cytoplasmic signaling
molecules in RAGE dependent migration of TC cells. Diaphanous-1 or Dia-1 is a
member of the formin protein family and is an effector of Rho proteins that are highly
conserved in vertebrates and is involved to help in the cytoskeletal reorganization [139].
We have observed by Western blot analysis that all the TC cells expressed the 135 kDa
Dia-1t. This was further confirmed by using protein lysate from Hela cell line as a
positive control and that from HEK293 cells as a negative control. Dia-1 is expressed
only in the cytoplasm of the TC cells which is in agreement with previous observations
that it functions as a cytoskeletal organizing protein and also as a partner for cytosolic
RAGE [102]. In this study, we were able to achieve functional knock down of RAGE by
knocking down Dia-1. We confirmed the importance of RAGE signaling in the S100A4-
78
induced migration response as Dia-1 Ko clones did not show an increase in migration
when stimulated either with S100A4 or the RAGE agonist AGE-BSA and these
observations in TC cells reveal that RAGE and Dia-1 are essential for S100A4-induced
migration. Studies have identified activation of small Rho GTPases by binding to Rho
binding domain of Dia-1 leading to actin polymerization, actin myosin stress fiber
formation, and lamellapodia formation which are known to be involved in cytoskeletal
rearrangements and cell migration [139].
We investigated several intermediate signaling pathways activated in response to
stimulation of TC cells with rhu S100A4. In TC cells, we predominantly observed
phosphorylation of ERK1/2 upon S100A4 stimulation. The phosphorylation in both FTC
and UTC cell lines was immediate and was observed to be short, which indicated
receptor mediated activation by S100A4. ERK is an extracellular regulated kinase and is
activated by growth factors, cytokines and ligands of G-protein coupled receptors
(GPCRs). The ERK pathway plays a major role in generating diverse physiological
responses in a wide variety of cancers and in inflammatory reactions. S100A4 dependent
RAGE activation resulted in ERK signaling which further led to increase in MMP-13
expression and degeneration of cartilage in osteoarthritis [94]. Apart from S100A4,
several other S100 proteins are known to activate ERK signaling in cancer. In esophageal
squamous cell carcinoma, S100A14 induced cell proliferation via RAGE involved the
activation of ERK signaling [140]. S100P and RAGE interaction in colonic cancer cells
was responsible for cell proliferation and migration via activation of the ERK signaling
cascade [112]. In TC cells however, we found that S100A4 induced ERK signaling
occurred independent of RAGE as RAGE Ko clones were still able to induce ERK

79
signaling when stimulated with S100A4. In Dia-1 clones we have observed a delay in
ERK phosphorylation as compared to Dia-1 +ve cells indicating that there might be other
receptors involved in S100A4 induced ERK signaling.
The other signaling pathway we investigated is the NF-kB pathway, which is activated by
phosphorylation and proteosomal degradation of cytoplasmic molecule IkB-α. IkB-α
belongs to a family of proteins that inhibit NF-kB induced activation of nuclear
transcription factors. The phosphorylation of IkB-α activates NF-kB which then
translocates to the nucleus and causes transcription leading to diverse cellular responses
[141]. We identified an IkB-α phosphorylation upon S100A4 stimulation in TC cells.
RAGE agonist AGE-BSA also induced phosphorylation of IkB-α. However, the levels of
phosphorylated IkB-α were observed to be insignificant in TC cells. Other studies have
shown that S100A4 and other S100 proteins activate NF-kB pathway. In human
osteosarcoma cells higher concentration of S100A4 activated NF-kB signaling and was
also observed to be independent on RAGE [142]. RAGE dependent NF-kB signaling was
observed in colonic cancer cells treated with S100A8/A9 [113]. S100A9 in fetal lung
fibroblasts activated NF-kB pathway via RAGE and subsequently increased the
expression of inflammatory cytokines [143]. In all the above studies the NF-kB pathway
was activated in response to higher concentration of extracellular recombinant S100
proteins incubated for a longer period (24 hours). In our study, we used lower
concentration of S100A4, which would probably explain the lower levels of pIkB-α.
The JNK [Janus Kinase] belongs to MAPK family of proteins and is activated upon
environmental or physiological stress. In JNK pathway, Activator protein (AP-1) is
activated by phosphorylation of JNK which then regulates gene transcription [144]. We
80
observed the activation of JNK in TC cells stimulated with S100A4 and the with known
RAGE ligand HMGB1. The activation of JNK by HMGB1 is intense and prolonged as
compared to S100A4. Recent studies have shown that S100B was able to activate JNK
pathway via RAGE and this activation leads to tumor growth and cell survival. This
study also identified that this activation can be inhibited by using a RAGE antagonist i.e.
RAGE V1 soluble endogenous receptor [145]. In our TC cell model we speculate that
S100A4 activated JNK signaling might be involved in pro-survival function as we failed
to detect a proliferative response of TC cells to S100A4.
The pro-survival function of S100A4 was tested by treating TC cells with DNA
damaging agent etoposide. Etoposide is a apoptosis inducing agent that acts by creating
single and double strand DNA breaks through inhibition of topoisomerase II [146]. We
observed that UTC cells stably expressing S100A4 showed greater survival than the
S100A4 –ve cells. This pro-survival effect might be induced by S100A4 activated JNK
pathway. In human cervical cancer cells JNK pathway activated by EGF was responsible
for cell survival upon treatment with apoptosis inducer [147] and c-jun the downstream
molecule of JNK was shown to be involved in embryonic stem cell growth and
development in mouse [148] .
Although this study had shown several signaling pathways activated by S100A4, we were
unable to explain which of these pathways are involved in S100A4 induced RAGE
dependent migration. Migration of TC cells is only one of the physiological responses
induced by S100A4 and is RAGE dependent. The pro-survival and potential anti-
apoptotic effect induced by S100A4 expressing cells should be further investigated.

81
In this study, we have identified RAGE and its cytoplasmic signaling partner Dia-1 to be
involved in S100A4-induced migration. A recent study has shown Dia-1 interaction with
RAGE under S100B stimulatory conditions, to evoke the signaling of Rho GTPase such
as Cdc42 and Rac1 [102]. A recent study involving astrocytic tumor cells explained the
role of mDia-1 and it effectors RhoA, Cdc42 and Rac1 in S100A4 induced migration
[135]. Hence, it is important to study the activation of these GTPase signaling molecules
in S100A4 induced TC cell motility.
CONCLUSION:
We report here the expression of RAGE in human thyroid cancer cell lines, primary cells
and tissues. RAGE is localized in the cytoplasm and the nucleus of TC cells. We also
identified S100A4 as a ligand of RAGE in TC mediating increased TC cell migration.
This work has also defined the role of Dia-1 as an essential cytoplasmic mediator for
RAGE ligand induced migration in TC. Further, we have identified ERK1/2, NFkB and
JNK signaling pathways being activated by S100A4 in TC cells. More studies are
required to assess their role in TC growth and cell survival. Overall, S100A4, RAGE and
Dia-1 were shown to be potential targets to control TC cell migration. Our findings
involving RAGE will be clinically important as ligands of RAGE other than S100A4 may
determine TC cell migration and survival in patients. There is also a need to target the
signaling pathways this complex might activate to control TC cell migration and
viability. Further studies should involve xenograft models to study the role of RAGE in
TC local spreading and metastasis, this can be done by using RAGE KO cells or by
injecting RAGE molecular inhibitors into xenografts to test their ability to block or
decrease TC cell migration.

82
REFERENCES
1. http://www.slideshare.net/roger961/thyroid-cancer-i-introduction
2. Pathology and Classification of Thyroid Tumors, Gretchen E. Galliano and David
P. Frishberg
3. Gimm, O., Thyroid cancer. Cancer Lett, 2001. 163(2): p. 143-56.
4. Gilliland FD, Hunt WC, Morris DM, Key CR.Prognostic factors for thyroid
carcinoma: a populationbased study of 15, 698 cases from the
surveillance,epidemiology, and end results (SEER) program 1973–1991.
Cancer.1997;79:564–73.
5. DeLellis RA, Lloyd RV, Heitz PU, Eng C. Pathology and genetics: tumors of
endocrine organs. Lyon: IARC Press; 2004.
6. DeLillis RA. Pathology and genetics of thyroid carcinoma.J Surg Oncol.
2006;94:662–9.
7. Baloch, Z.W. and V.A. LiVolsi, Our approach to follicular-patterned lesions of
the thyroid. J Clin Pathol, 2007. 60(3): p. 244-50.
8. Ashfaq, R., et al., Papillary and follicular thyroid carcinomas with an insular
component. Cancer, 1994. 73(2): p. 416-23.
9. Baloch, Z.W. and V.A. Livolsi, Follicular-patterned lesions of the thyroid: the
bane of the pathologist. Am J Clin Pathol, 2002. 117(1): p. 143-50.
10. Gilliland, F.D., et al., Prognostic factors for thyroid carcinoma. A population-
based study of 15,698 cases from the Surveillance, Epidemiology and End Results
(SEER) program 1973-1991. Cancer, 1997. 79(3): p. 564-73.
11. Pasieka, J.L., Anaplastic thyroid cancer. Curr Opin Oncol, 2003. 15(1): p. 78-83.

83
12. Patel, K.N. and A.R. Shaha, Poorly differentiated and anaplastic thyroid cancer.
Cancer Control, 2006. 13(2): p. 119-28.
13. Pasieka, J.L., Anaplastic cancer, lymphoma, and metastases of the thyroid gland.
Surg Oncol Clin N Am, 1998. 7(4): p. 707-20.
14. Pelizzo, M.R., et al., Diagnosis, treatment, prognostic factors and long-term
outcome in papillary thyroid carcinoma. Minerva Endocrinol, 2008. 33(4): p.
359-79.
15. Hundahl, S.A., et al., A National Cancer Data Base report on 53,856 cases of
thyroid carcinoma treated in the U.S., 1985-1995 [see commetns]. Cancer, 1998.
83(12): p. 2638-48.
16. Zidan, J., et al., Pure versus follicular variant of papillary thyroid carcinoma:
clinical features, prognostic factors, treatment, and survival. Cancer, 2003. 97(5):
p. 1181-5.
17. Morris, L.G., et al., Tall-cell variant of papillary thyroid carcinoma: a matched-
pair analysis of survival. Thyroid, 2010. 20(2): p. 153-8.
18. Ito, Y., et al., Investigation of the prognosis of patients with papillary thyroid
carcinoma by tumor size. Endocr J, 2012. 59(6): p. 457-64.
19. Ito, Y., et al., Distant metastasis at diagnosis and large tumor size are significant
prognostic factors of widely invasive follicular thyroid carcinoma. Endocr J,
2013.
20. Machens, A., H.J. Holzhausen, and H. Dralle, The prognostic value of primary
tumor size in papillary and follicular thyroid carcinoma. Cancer, 2005. 103(11):
p. 2269-73.
84
21. Sipos, J.A. and E.L. Mazzaferri, Thyroid cancer epidemiology and prognostic
variables. Clin Oncol (R Coll Radiol), 2010. 22(6): p. 395-404.
22. Scheumann, G.F., et al., Prognostic significance and surgical management of
locoregional lymph node metastases in papillary thyroid cancer. World J Surg,
1994. 18(4): p. 559-67; discussion 567-8.
23. Lin, J.D., et al., Prognostic variables of papillary and follicular thyroid
carcinoma patients with lymph node metastases and without distant metastases.
Endocr Relat Cancer, 1999. 6(1): p. 109-15.
24. Zaydfudim, V., et al., The impact of lymph node involvement on survival in
patients with papillary and follicular thyroid carcinoma. Surgery, 2008. 144(6):
p. 1070-7; discussion 1077-8.
25. Nixon, I.J., et al., The impact of distant metastases at presentation on prognosis in
patients with differentiated carcinoma of the thyroid gland. Thyroid, 2012. 22(9):
p. 884-9.
26. Lee, J. and E.Y. Soh, Differentiated thyroid carcinoma presenting with distant
metastasis at initial diagnosis clinical outcomes and prognostic factors. Ann
Surg, 2010. 251(1): p. 114-9.
27. Durante, C., et al., Long-term outcome of 444 patients with distant metastases
from papillary and follicular thyroid carcinoma: benefits and limits of
radioiodine therapy. J Clin Endocrinol Metab, 2006. 91(8): p. 2892-9.
28. Shaha, A.R., A. Ferlito, and A. Rinaldo, Distant metastases from thyroid and
parathyroid cancer. ORL J Otorhinolaryngol Relat Spec, 2001. 63(4): p. 243-9.

85
29. Vasko, V.V. and M. Saji, Molecular mechanisms involved in differentiated
thyroid cancer invasion and metastasis. Curr Opin Oncol, 2007. 19(1): p. 11-7.
30. Vasko, V., et al., Gene expression and functional evidence of epithelial-to-
mesenchymal transition in papillary thyroid carcinoma invasion. Proc Natl Acad
Sci U S A, 2007. 104(8): p. 2803-8.
31. Knauf, J.A., et al., Progression of BRAF-induced thyroid cancer is associated
with epithelial-mesenchymal transition requiring concomitant MAP kinase and
TGFbeta signaling. Oncogene, 2011. 30(28): p. 3153-62.
32. Zhang, Z., et al., The miR-200 family regulates the epithelial-mesenchymal
transition induced by EGF/EGFR in anaplastic thyroid cancer cells. Int J Mol
Med, 2012. 30(4): p. 856-62.
33. Niu, D.F., et al., Transcription factor Runx2 is a regulator of epithelial-
mesenchymal transition and invasion in thyroid carcinomas. Lab Invest, 2012.
92(8): p. 1181-90.
34. de Cristofaro, T., et al., TAZ/WWTR1 is overexpressed in papillary thyroid
carcinoma. Eur J Cancer, 2011. 47(6): p. 926-33.
35. Bialek, J., et al., Relaxin enhances the collagenolytic activity and in vitro
invasiveness by upregulating matrix metalloproteinases in human thyroid
carcinoma cells. Mol Cancer Res, 2011. 9(6): p. 673-87.
36. Bialek, J., et al., Lysosomal acid hydrolases of the cathepsin family are novel
targets of INSL3 in human thyroid carcinoma cells. Ann N Y Acad Sci, 2009.
1160: p. 361-6.
86
37. Haley, J., et al., Porcine relaxin: molecular cloning and cDNA structure. DNA,
1982. 1(2): p. 155-62.
38. Hudson, P., et al., Molecular cloning and characterization of cDNA sequences
coding for rat relaxin. Nature, 1981. 291(5811): p. 127-31.
39. Hudson, P., et al., Structure of a genomic clone encoding biologically active
human relaxin. Nature, 1983. 301(5901): p. 628-31.
40. Hudson, P., et al., Relaxin gene expression in human ovaries and the predicted
structure of a human preprorelaxin by analysis of cDNA clones. EMBO J, 1984.
3(10): p. 2333-9.
41. Bathgate, R.A., et al., Relaxin family peptides and their receptors. Physiol Rev,
2013. 93(1): p. 405-80.
42. Sherwood, O.D., Relaxin's physiological roles and other diverse actions. Endocr
Rev, 2004. 25(2): p. 205-34.
43. Hombach-Klonisch, S., et al., Relaxin enhances the oncogenic potential of human
thyroid carcinoma cells. Am J Pathol, 2006. 169(2): p. 617-32.
44. Radestock, Y., et al., Relaxin enhances S100A4 and promotes growth of human
thyroid carcinoma cell xenografts. Mol Cancer Res, 2010. 8(4): p. 494-506.
45. Hombach-Klonisch, S., et al., INSL3 has tumor-promoting activity in thyroid
cancer. Int J Cancer, 2010. 127(3): p. 521-31.
46. Marenholz, I., R.C. Lovering, and C.W. Heizmann, An update of the S100
nomenclature. Biochim Biophys Acta, 2006. 1763(11): p. 1282-3.

87
47. Marenholz, I., C.W. Heizmann, and G. Fritz, S100 proteins in mouse and man:
from evolution to function and pathology (including an update of the
nomenclature). Biochem Biophys Res Commun, 2004. 322(4): p. 1111-22.
48. Hsieh, H.L., et al., Expression analysis of S100 proteins and RAGE in human
tumors using tissue microarrays. Biochem Biophys Res Commun, 2003. 307(2):
p. 375-81.
49. Heighway, J., et al., Expression profiling of primary non-small cell lung cancer
for target identification. Oncogene, 2002. 21(50): p. 7749-63.
50. El-Rifai, W., et al., Gastric cancers overexpress S100A calcium-binding proteins.
Cancer Res, 2002. 62(23): p. 6823-6.
51. Harpio, R. and R. Einarsson, S100 proteins as cancer biomarkers with focus on
S100B in malignant melanoma. Clin Biochem, 2004. 37(7): p. 512-8.
52. Salama, I., et al., A review of the S100 proteins in cancer. Eur J Surg Oncol, 2008.
34(4): p. 357-64.
53. Krop, I., et al., A putative role for psoriasin in breast tumor progression. Cancer
Res, 2005. 65(24): p. 11326-34.
54. Hiratsuka, S., et al., Tumour-mediated upregulation of chemoattractants and
recruitment of myeloid cells predetermines lung metastasis. Nat Cell Biol, 2006.
8(12): p. 1369-75.
55. Rehman, I., et al., Dysregulated expression of S100A11 (calgizzarin) in prostate
cancer and precursor lesions. Hum Pathol, 2004. 35(11): p. 1385-91.

88
56. Gingras, A.R., et al., Crystal structure of the Ca(2+)-form and Ca(2+)-binding
kinetics of metastasis-associated protein, S100A4. FEBS Lett, 2008. 582(12): p.
1651-6.
57. Garrett, S.C., et al., S100A4, a mediator of metastasis. J Biol Chem, 2006. 281(2):
p. 677-80.
58. Georgiev, G.P. and E.M. Lukanidin, [Mts1 protein and control of tumor
metastasis]. Mol Biol (Mosk), 2000. 34(5): p. 727-30.
59. Schmidt-Hansen, B., et al., Functional significance of metastasis-inducing
S100A4(Mts1) in tumor-stroma interplay. J Biol Chem, 2004. 279(23): p. 24498-
504.
60. Flatmark, K., et al., Nuclear localization of the metastasis-related protein S100A4
correlates with tumour stage in colorectal cancer. J Pathol, 2003. 200(5): p. 589-
95.
61. Zou, M., et al., S100A4 (Mts1) gene overexpression is associated with invasion
and metastasis of papillary thyroid carcinoma. Br J Cancer, 2005. 93(11): p.
1277-84.
62. Helfman, D.M., et al., The metastasis associated protein S100A4: role in tumour
progression and metastasis. Br J Cancer, 2005. 92(11): p. 1955-8.
63. Rudland, P.S., et al., Prognostic significance of the metastasis-inducing protein
S100A4 (p9Ka) in human breast cancer. Cancer Res, 2000. 60(6): p. 1595-603.
64. Lee, W.Y., et al., Expression of S100A4 and Met: potential predictors for
metastasis and survival in early-stage breast cancer. Oncology, 2004. 66(6): p.
429-38.

89
65. Zou, M., et al., Microarray analysis of metastasis-associated gene expression
profiling in a murine model of thyroid carcinoma pulmonary metastasis:
identification of S100A4 (Mts1) gene overexpression as a poor prognostic marker
for thyroid carcinoma. J Clin Endocrinol Metab, 2004. 89(12): p. 6146-54.
66. Davies, B.R., et al., Production of the metastatic phenotype by DNA transfection
in a rat mammary model. Cell Biol Int, 1993. 17(9): p. 871-9.
67. Zhang, S., et al., The C-terminal region of S100A4 is important for its metastasis-
inducing properties. Oncogene, 2005. 24(27): p. 4401-11.
68. Grigorian, M., et al., Effect of mts1 (S100A4) expression on the progression of
human breast cancer cells. Int J Cancer, 1996. 67(6): p. 831-41.
69. Wang, L., et al., S100A4 promotes invasion and angiogenesis in breast cancer
MDA-MB-231 cells by upregulating matrix metalloproteinase-13. Acta Biochim
Pol, 2012. 59(4): p. 593-8.
70. Olsen, C.J., et al., Human mammary fibroblasts stimulate invasion of breast
cancer cells in a three-dimensional culture and increase stroma development in
mouse xenografts. BMC Cancer, 2010. 10: p. 444.
71. Ke, Y., et al., Elevated expression of calcium-binding protein p9Ka is associated
with increasing malignant characteristics of rat prostate carcinoma cells. Int J
Cancer, 1997. 71(5): p. 832-7.
72. Gupta, S., et al., Differential expression of S100A2 and S100A4 during
progression of human prostate adenocarcinoma. J Clin Oncol, 2003. 21(1): p.
106-12.

90
73. Jury, R.P., et al., Gene expression changes associated with the progression of
intraductal papillary mucinous neoplasms. Pancreas, 2012. 41(4): p. 611-8.
74. Suemizu, H., et al., Identification of a key molecular regulator of liver metastasis
in human pancreatic carcinoma using a novel quantitative model of metastasis in
NOD/SCID/gammacnull (NOG) mice. Int J Oncol, 2007. 31(4): p. 741-51.
75. Chen, P.S., et al., CTGF enhances the motility of breast cancer cells via an
integrin-alphavbeta3-ERK1/2-dependent S100A4-upregulated pathway. J Cell
Sci, 2007. 120(Pt 12): p. 2053-65.
76. Cao, W.H., et al., Relaxin enhances in-vitro invasiveness of breast cancer cell
lines by upregulation of S100A4/MMPs signaling. Eur Rev Med Pharmacol Sci,
2013. 17(5): p. 609-17.
77. Cabezon, T., et al., Expression of S100A4 by a variety of cell types present in the
tumor microenvironment of human breast cancer. Int J Cancer, 2007. 121(7): p.
1433-44.
78. Amatangelo, M.D., et al., c-Myc expression and MEK1-induced Erk2 nuclear
localization are required for TGF-beta induced epithelial-mesenchymal transition
and invasion in prostate cancer. Carcinogenesis, 2012. 33(10): p. 1965-75.
79. Li, N., et al., S100A4 siRNA inhibits human pancreatic cancer cell invasion in
vitro. Biomed Environ Sci, 2012. 25(4): p. 465-70.
80. Tarbe, N., et al., Identification of rat pancreatic carcinoma genes associated with
lymphogenous metastasis. Anticancer Res, 2002. 22(4): p. 2015-27.

91
81. Chaturvedi, P., et al., MUC4 mucin potentiates pancreatic tumor cell
proliferation, survival, and invasive properties and interferes with its interaction
to extracellular matrix proteins. Mol Cancer Res, 2007. 5(4): p. 309-20.
82. Sack, U., et al., S100A4-induced cell motility and metastasis is restricted by the
Wnt/beta-catenin pathway inhibitor calcimycin in colon cancer cells. Mol Biol
Cell, 2011. 22(18): p. 3344-54.
83. Jia, W., et al., S100A4 silencing suppresses proliferation, angiogenesis and
invasion of thyroid cancer cells through downregulation of MMP-9 and VEGF.
Eur Rev Med Pharmacol Sci, 2013. 17(11): p. 1495-508.
84. Vicente-Manzanares, M., et al., Non-muscle myosin II takes centre stage in cell
adhesion and migration. Nat Rev Mol Cell Biol, 2009. 10(11): p. 778-90.
85. Ford, H.L., et al., Effect of Mts1 on the structure and activity of nonmuscle myosin
II. Biochemistry, 1997. 36(51): p. 16321-7.
86. Kim, E.J. and D.M. Helfman, Characterization of the metastasis-associated
protein, S100A4. Roles of calcium binding and dimerization in cellular
localization and interaction with myosin. J Biol Chem, 2003. 278(32): p. 30063-
73.
87. Zhang, S., et al., Interaction of metastasis-inducing S100A4 protein in vivo by
fluorescence lifetime imaging microscopy. Eur Biophys J, 2005. 34(1): p. 19-27.
88. Hitchcock-DeGregori, S.E., Tropomyosin: function follows structure. Adv Exp
Med Biol, 2008. 644: p. 60-72.
89. Takenaga, K., et al., Binding of pEL98 protein, an S100-related calcium-binding
protein, to nonmuscle tropomyosin. J Cell Biol, 1994. 124(5): p. 757-68.
92
90. Grigorian, M., et al., Tumor suppressor p53 protein is a new target for the
metastasis-associated Mts1/S100A4 protein: functional consequences of their
interaction. J Biol Chem, 2001. 276(25): p. 22699-708.
91. Burgoyne, R.D. and M.J. Geisow, The annexin family of calcium-binding
proteins. Review article. Cell Calcium, 1989. 10(1): p. 1-10.
92. Semov, A., et al., Metastasis-associated protein S100A4 induces angiogenesis
through interaction with Annexin II and accelerated plasmin formation. J Biol
Chem, 2005. 280(21): p. 20833-41.
93. Rouhiainen, A., et al., RAGE-mediated cell signaling. Methods Mol Biol, 2013.
963: p. 239-63.
94. Yammani, R.R., et al., Increase in production of matrix metalloproteinase 13 by
human articular chondrocytes due to stimulation with S100A4: Role of the
receptor for advanced glycation end products. Arthritis Rheum, 2006. 54(9): p.
2901-11.
95. Logsdon, C.D., et al., RAGE and RAGE ligands in cancer. Curr Mol Med, 2007.
7(8): p. 777-89.
96. Neeper, M., et al., Cloning and expression of a cell surface receptor for advanced
glycosylation end products of proteins. J Biol Chem, 1992. 267(21): p. 14998-
5004.
97. Brett, J., et al., Survey of the distribution of a newly characterized receptor for
advanced glycation end products in tissues. Am J Pathol, 1993. 143(6): p. 1699-
712.
93
98. Sterenczak, K.A., I. Nolte, and H. Murua Escobar, RAGE splicing variants in
mammals. Methods Mol Biol, 2013. 963: p. 265-76.
99. Kislinger, T., et al., N(epsilon)-(carboxymethyl)lysine adducts of proteins are
ligands for receptor for advanced glycation end products that activate cell
signaling pathways and modulate gene expression. J Biol Chem, 1999. 274(44):
p. 31740-9.
100. Hofmann, M.A., et al., RAGE mediates a novel proinflammatory axis: a central
cell surface receptor for S100/calgranulin polypeptides. Cell, 1999. 97(7): p. 889-
901.
101. Taguchi, A., et al., Blockade of RAGE-amphoterin signalling suppresses tumour
growth and metastases. Nature, 2000. 405(6784): p. 354-60.
102. Hudson, B.I., et al., Interaction of the RAGE cytoplasmic domain with
diaphanous-1 is required for ligand-stimulated cellular migration through
activation of Rac1 and Cdc42. J Biol Chem, 2008. 283(49): p. 34457-68.
103. Ishihara, K., et al., The receptor for advanced glycation end-products (RAGE)
directly binds to ERK by a D-domain-like docking site. FEBS Lett, 2003. 550(1-
3): p. 107-13.
104. Hori, O., et al., The receptor for advanced glycation end products (RAGE) is a
cellular binding site for amphoterin. Mediation of neurite outgrowth and co-
expression of rage and amphoterin in the developing nervous system. J Biol
Chem, 1995. 270(43): p. 25752-61.
94
105. Rong, L.L., et al., RAGE modulates peripheral nerve regeneration via recruitment
of both inflammatory and axonal outgrowth pathways. FASEB J, 2004. 18(15): p.
1818-25.
106. Lin, L., S. Park, and E.G. Lakatta, RAGE signaling in inflammation and arterial
aging. Front Biosci, 2009. 14: p. 1403-13.
107. Ishiguro, H., et al., Receptor for advanced glycation end products (RAGE) and its
ligand, amphoterin are overexpressed and associated with prostate cancer
development. Prostate, 2005. 64(1): p. 92-100.
108. Radia, A.M., et al., Specific siRNA Targeting Receptor for Advanced Glycation
End Products (RAGE) Decreases Proliferation in Human Breast Cancer Cell
Lines. Int J Mol Sci, 2013. 14(4): p. 7959-78.
109. Lu, B., et al., [Differential expressions of the receptor for advanced glycation end
products in prostate cancer and normal prostate]. Zhonghua Nan Ke Xue, 2010.
16(5): p. 405-9.
110. Elangovan, I., et al., Targeting receptor for advanced glycation end products
(RAGE) expression induces apoptosis and inhibits prostate tumor growth.
Biochem Biophys Res Commun, 2012. 417(4): p. 1133-8.
111. Arumugam, T., et al., S100P promotes pancreatic cancer growth, survival, and
invasion. Clin Cancer Res, 2005. 11(15): p. 5356-64.
112. Fuentes, M.K., et al., RAGE activation by S100P in colon cancer stimulates
growth, migration, and cell signaling pathways. Dis Colon Rectum, 2007. 50(8):
p. 1230-40.

95
113. Ichikawa, M., et al., S100A8/A9 activate key genes and pathways in colon tumor
progression. Mol Cancer Res, 2011. 9(2): p. 133-48.
114. Vezzoli, M., et al., High-mobility group box 1 release and redox regulation
accompany regeneration and remodeling of skeletal muscle. Antioxid Redox
Signal, 2011. 15(8): p. 2161-74.
115. Zong, H., et al., Homodimerization is essential for the receptor for advanced
glycation end products (RAGE)-mediated signal transduction. J Biol Chem, 2010.
285(30): p. 23137-46.
116. Hermani, A., et al., Calcium-binding proteins S100A8 and S100A9 as novel
diagnostic markers in human prostate cancer. Clin Cancer Res, 2005. 11(14): p.
5146-52.
117. Kostova, N., et al., The expression of HMGB1 protein and its receptor RAGE in
human malignant tumors. Mol Cell Biochem, 2010. 337(1-2): p. 251-8.
118. Luan, Z.G., et al., HMGB1 activates nuclear factor-kappaB signaling by RAGE
and increases the production of TNF-alpha in human umbilical vein endothelial
cells. Immunobiology, 2010. 215(12): p. 956-62.
119. Kang, R., et al., The HMGB1/RAGE inflammatory pathway promotes pancreatic
tumor growth by regulating mitochondrial bioenergetics. Oncogene, 2013.
120. Park, H., F.G. Adsit, and J.C. Boyington, The 1.5 A crystal structure of human
receptor for advanced glycation endproducts (RAGE) ectodomains reveals unique
features determining ligand binding. J Biol Chem, 2010. 285(52): p. 40762-70.

96
121. Zhang, L., et al., Receptor for advanced glycation end products is subjected to
protein ectodomain shedding by metalloproteinases. J Biol Chem, 2008. 283(51):
p. 35507-16.
122. Leclerc, E., et al., Binding of S100 proteins to RAGE: an update. Biochim
Biophys Acta, 2009. 1793(6): p. 993-1007.
123. Spiekerkoetter, E., et al., S100A4 and bone morphogenetic protein-2
codependently induce vascular smooth muscle cell migration via phospho-
extracellular signal-regulated kinase and chloride intracellular channel 4. Circ
Res, 2009. 105(7): p. 639-47, 13 p following 647.
124. Businaro, R., et al., S100B protects LAN-5 neuroblastoma cells against Abeta
amyloid-induced neurotoxicity via RAGE engagement at low doses but increases
Abeta amyloid neurotoxicity at high doses. J Neurosci Res, 2006. 83(5): p. 897-
906.
125. Leclerc, E., et al., S100B and S100A6 differentially modulate cell survival by
interacting with distinct RAGE (receptor for advanced glycation end products)
immunoglobulin domains. J Biol Chem, 2007. 282(43): p. 31317-31.
126. Liang, H., et al., Knockdown of RAGE expression inhibits colorectal cancer cell
invasion and suppresses angiogenesis in vitro and in vivo. Cancer Lett, 2011.
313(1): p. 91-8.
127. Kang, R., et al., The receptor for advanced glycation end products (RAGE)
sustains autophagy and limits apoptosis, promoting pancreatic tumor cell
survival. Cell Death Differ, 2010. 17(4): p. 666-76.
97
128. Ryder, M., et al., Increased density of tumor-associated macrophages is
associated with decreased survival in advanced thyroid cancer. Endocr Relat
Cancer, 2008. 15(4): p. 1069-74.
129. Patel, V.A., et al., Isolation and characterization of human thyroid endothelial
cells. Am J Physiol Endocrinol Metab, 2003. 284(1): p. E168-76.
130. Boye, K. and G.M. Maelandsmo, S100A4 and metastasis: a small actor playing
many roles. Am J Pathol, 2010. 176(2): p. 528-35.
131. Filipovic, A., I. Paunovic, and L. Vuckovic, [Influence of lymphocitic thyroiditis
on prognostic outcome differentiated thyroid carcinoma]. Acta Chir Iugosl, 2010.
57(2): p. 85-94.
132. Okada, H., et al., Early role of Fsp1 in epithelial-mesenchymal transformation.
Am J Physiol, 1997. 273(4 Pt 2): p. F563-74.
133. Alipio, Z.A., et al., Epithelial to mesenchymal transition (EMT) induced by
bleomycin or TFG(b1)/EGF in murine induced pluripotent stem cell-derived
alveolar Type II-like cells. Differentiation, 2011. 82(2): p. 89-98.
134. Claperon, A., et al., Loss of EBP50 stimulates EGFR activity to induce EMT
phenotypic features in biliary cancer cells. Oncogene, 2012. 31(11): p. 1376-88.
135. Belot, N., et al., Extracellular S100A4 stimulates the migration rate of astrocytic
tumor cells by modifying the organization of their actin cytoskeleton. Biochim
Biophys Acta, 2002. 1600(1-2): p. 74-83.
136. Wang, Z. and M. Griffin, The role of TG2 in regulating S100A4-mediated
mammary tumour cell migration. PLoS One, 2013. 8(3): p. e57017.

98
137. Forst, B., et al., Metastasis-inducing S100A4 and RANTES cooperate in
promoting tumor progression in mice. PLoS One, 2010. 5(4): p. e10374.
138. Hermani, A., et al., S100A8 and S100A9 activate MAP kinase and NF-kappaB
signaling pathways and trigger translocation of RAGE in human prostate cancer
cells. Exp Cell Res, 2006. 312(2): p. 184-97.
139. Young, K.G. and J.W. Copeland, Formins in cell signaling. Biochim Biophys
Acta, 2010. 1803(2): p. 183-90.
140. Jin, Q., et al., S100A14 stimulates cell proliferation and induces cell apoptosis at
different concentrations via receptor for advanced glycation end products
(RAGE). PLoS One, 2011. 6(4): p. e19375.
141. Sun, X.F. and H. Zhang, NFKB and NFKBI polymorphisms in relation to
susceptibility of tumour and other diseases. Histol Histopathol, 2007. 22(12): p.
1387-98.
142. Grotterod, I., G.M. Maelandsmo, and K. Boye, Signal transduction mechanisms
involved in S100A4-induced activation of the transcription factor NF-kappaB.
BMC Cancer, 2010. 10: p. 241.
143. Xu, X., et al., S100A9 promotes human lung fibroblast cells activation through
RAGE mediated ERK1/2 MAP-kinase and NF-kappaB dependent pathways. Clin
Exp Immunol, 2013.
144. Weston, C.R. and R.J. Davis, The JNK signal transduction pathway. Curr Opin
Genet Dev, 2002. 12(1): p. 14-21.
145. Kalea, A.Z., et al., Alternatively spliced RAGEv1 inhibits tumorigenesis through
suppression of JNK signaling. Cancer Res, 2010. 70(13): p. 5628-38.

99
146. Hande, K.R., Etoposide: four decades of development of a topoisomerase II
inhibitor. Eur J Cancer, 1998. 34(10): p. 1514-21.
147. Liu, B., et al., Involvement of JNK-mediated pathway in EGF-mediated protection
against paclitaxel-induced apoptosis in SiHa human cervical cancer cells. Br J
Cancer, 2001. 85(2): p. 303-11.
148. Hilberg, F., et al., c-jun is essential for normal mouse development and
hepatogenesis. Nature, 1993. 365(6442): p. 179-81.


![Publications - Shodhgangashodhganga.inflibnet.ac.in/.../14/14_publications.pdf · Publications [142] 1. Manoj Kumar, Puja Kumari, Vishal Gupta, P.A. Anisha, C.R.K. Reddy and Bhavanath](https://static.fdocuments.us/doc/165x107/5ed238ca26ecc358d13eb40c/publications-publications-142-1-manoj-kumar-puja-kumari-vishal-gupta-pa.jpg)
![BOMBAY CHARTERED ACCOUNTANTS’ SOCIETY … · IDS Software Solutions ... Manoj Kumar Reddy, [2011] ... • Social Security and Pension • ESOP • Medical Insurance, ...](https://static.fdocuments.us/doc/165x107/5af34ae07f8b9a190c8b6805/bombay-chartered-accountants-society-software-solutions-manoj-kumar-reddy.jpg)