MANIFESTATION OF THE OPTICAL STARK EFFECT IN … · MANIFESTATION OF THE OPTICAL STARK EFFECT IN...
8
Lithuanian Journal of Physics, Vol. 48, No. 2, pp. 155–162 (2008) MANIFESTATION OF THE OPTICAL STARK EFFECT IN DIFFERENTIAL TRANSMISSION SPECTRA A. Savickas and E. Gaižauskas Department of Quantum Electronics, Vilnius University, Saul˙ etekio 9, LT-10222 Vilnius, Lithuania E-mail: [email protected] Received 14 February 2008; revised 3 April 2008; accepted 9 June 2008 The two-level quantum system is applied in theoretical modelling of the angle-resolved differential absorption spectra induced by the strong near-resonant laser field in quantum dots. The simulations of induced polarization waves at appropriate directions have been performed by means of the density matrix formalism, without using perturbation theory. An interpretation of the differential spectra is provided referring to representation of the dressed states, with their energies experiencing Stark shifts due to the action of the laser field. The feasibility of the light and matter interaction strength characterization via observed Mollow spectrum at the different (from the probe beam) direction is demonstrated. Keywords: femtosecond spectroscopy, differential spectra, quantum dots, Stark effect, four-wave mixing, Mollow spectrum, dressed states PACS: 78.20.Jq, 78.47.+p, 78.67.Hc 1. Introduction Progress in constructing optical switches, logical el- ements, as well as entries for quantum computing [1–3] increases demand for characterization of strong-field affected electronic states in quantum wells, quantum wires, and quantum dots (QD). In particular, there has been considerable interest in the investigation of the op- tical Stark effect (OSE), i. e. light-induced shift of en- ergy levels in the presence of non-resonant laser fields in nanoscale materials [4]. Optical spectroscopy meth- ods count among the most versatile and routine ones for characterizing strong-field limit of light–matter in- teraction in such kind of quantum systems. Among a number of experimental and theoretical studies of such kind, analysis of the strong-coupling regime between confined excitons and micro-cavity photons [5], dy- namics of basic laser-induced coherences (that can be observed, e. g., in quantum beat spectroscopy), as well as Rabi oscillations in pump-probe spectroscopy [6, 7] should be noted. The last technique is known as standard one for investigating both transient and stationary response of medium to the pump-induced perturbation. This method implicitly assumes weak probe beam, which measures induced absorption (transmission) changes. However, it should be stressed that, to reduce the com- plexity of the problem, the description of the technique discussed here is based on two different kinds of ap- proximations, even for the relatively strong pump field. In the time-resolved case, negligible excited state pop- ulation is approached, allowing perturbative treatment of system evolution [9, 8]. On the other hand, countin- uous wave (cw) approximation and appropriate to this case representation of the dressed states is used to con- sider OSE in the strong-field (high Rabi frequency) limit [10]. Because our interest in this work is the OSE man- ifestation in differential absorption spectra observable in the limit of strong pulsed excitation, none of the mentioned above approximations is suitable for our purposes. Therefore numerical integration of the Bloch equations is performed when obtaining the main re- sults in this work, which is performed in the manner of angle- and time-resolved pump-probe spectroscopy de- veloped for description of the coherent effects in fem- tosecond pump-probe spectroscopy [11–16]. In this paper we stress the peculiarities of the dif- ferential pump-probe spectra resulting from the strong- field induced OSE in QD, owing to the fact that both long phase relaxation time and huge strength of opti- cal transitions are characteristic of confined excitons. Because of the discrete atom-like lines of the excitonic spectra, here we restrict our consideration to two-level quantum system. c Lithuanian Physical Society, 2008 c Lithuanian Academy of Sciences, 2008 ISSN 1648-8504
Transcript of MANIFESTATION OF THE OPTICAL STARK EFFECT IN … · MANIFESTATION OF THE OPTICAL STARK EFFECT IN...

Lithuanian Journal of Physics, Vol. 48, No. 2, pp. 155–162 (2008)
MANIFESTATION OF THE OPTICAL STARK EFFECT INDIFFERENTIAL TRANSMISSION SPECTRA
A. Savickas and E. GaižauskasDepartment of Quantum Electronics, Vilnius University, Sauletekio 9, LT-10222 Vilnius, Lithuania
E-mail: [email protected]
Received 14 February 2008; revised 3 April 2008; accepted 9 June 2008
The two-level quantum system is applied in theoretical modelling of the angle-resolved differential absorption spectrainduced by the strong near-resonant laser field in quantum dots. The simulations of induced polarization waves at appropriatedirections have been performed by means of the density matrix formalism, without using perturbation theory. An interpretationof the differential spectra is provided referring to representation of the dressed states, with their energies experiencing Starkshifts due to the action of the laser field. The feasibility of the light and matter interaction strength characterization via observedMollow spectrum at the different (from the probe beam) direction is demonstrated.Keywords: femtosecond spectroscopy, differential spectra, quantum dots, Stark effect, four-wave mixing, Mollow spectrum,dressed states
PACS: 78.20.Jq, 78.47.+p, 78.67.Hc
1. Introduction
Progress in constructing optical switches, logical el-ements, as well as entries for quantum computing [1–3]increases demand for characterization of strong-fieldaffected electronic states in quantum wells, quantumwires, and quantum dots (QD). In particular, there hasbeen considerable interest in the investigation of the op-tical Stark effect (OSE), i. e. light-induced shift of en-ergy levels in the presence of non-resonant laser fieldsin nanoscale materials [4]. Optical spectroscopy meth-ods count among the most versatile and routine onesfor characterizing strong-field limit of light–matter in-teraction in such kind of quantum systems. Among anumber of experimental and theoretical studies of suchkind, analysis of the strong-coupling regime betweenconfined excitons and micro-cavity photons [5], dy-namics of basic laser-induced coherences (that can beobserved, e. g., in quantum beat spectroscopy), as wellas Rabi oscillations in pump-probe spectroscopy [6, 7]should be noted.
The last technique is known as standard one forinvestigating both transient and stationary responseof medium to the pump-induced perturbation. Thismethod implicitly assumes weak probe beam, whichmeasures induced absorption (transmission) changes.However, it should be stressed that, to reduce the com-plexity of the problem, the description of the technique
discussed here is based on two different kinds of ap-proximations, even for the relatively strong pump field.In the time-resolved case, negligible excited state pop-ulation is approached, allowing perturbative treatmentof system evolution [9, 8]. On the other hand, countin-uous wave (cw) approximation and appropriate to thiscase representation of the dressed states is used to con-sider OSE in the strong-field (high Rabi frequency)limit [10].
Because our interest in this work is the OSE man-ifestation in differential absorption spectra observablein the limit of strong pulsed excitation, none of thementioned above approximations is suitable for ourpurposes. Therefore numerical integration of the Blochequations is performed when obtaining the main re-sults in this work, which is performed in the manner ofangle- and time-resolved pump-probe spectroscopy de-veloped for description of the coherent effects in fem-tosecond pump-probe spectroscopy [11–16].
In this paper we stress the peculiarities of the dif-ferential pump-probe spectra resulting from the strong-field induced OSE in QD, owing to the fact that bothlong phase relaxation time and huge strength of opti-cal transitions are characteristic of confined excitons.Because of the discrete atom-like lines of the excitonicspectra, here we restrict our consideration to two-levelquantum system.
c© Lithuanian Physical Society, 2008c© Lithuanian Academy of Sciences, 2008 ISSN 1648-8504

156 A. Savickas and E. Gaižauskas / Lithuanian J. Phys. 48, 155–162 (2008)
The paper is organized as follows. Section 2 pro-vides our approach and main equation appropriate forthe analysis of the angle-resolved pump-probe mea-surements. Section 3 presents the numerical modellingresults and interpretations based on the dressed statepicture. We conclude with discussion of expected ben-efits of using angle-resolved pump-probe configurationanalysis of the OSE implemented peculiarities in dif-ferential absorption spectra in Sec. 4.
2. Theoretical model and calculation procedure
2.1. Pump-probe spectroscopy in two-levelapproximation
Consider a two-level system with a transition fre-quency ω21 subjected to the strong pump, which hascarrying frequency ωL and wave vector kL, and aweaker probe, characterized by frequency ωP and wavevector kP, accordingly. Total electric field can bewritten as superposition of two quasi-monochromaticplane-wave pulses:
E(t) =1
2[εL(t) ei[kLr−ωL(t−τL)]
+ εP(t) ei[kPr−ωP(t−τP)] + c. c.] , (1)
where εL(t) and εP(t) are slowly varying envelopesof electric field, c. c. means complex conjugate. Bothelectric fields are assumed to be linearly polarized inthe same direction. Delay times τP and τL for probeand pump pulses, respectively, are introduced to en-sure the time-invariance in final equations. Further onthrough this paper the pump field arrival time will betaken as reference one, therefore: τL = 0 in all cal-culations. Field frequencies are assumed to be near tothe optical transition of the system, in the sense thatabsolute values of frequency detunings for pump andprobe pulses from resonance are considerably less incomparison to corresponding resonance frequency ofthe two-level system.
Non-perturbed Hamiltonian of the two-level systemis defined as
H0 =1
2
[0 00 ~ω21
], (2)
whereas perturbation due to electric field dipole inter-action with the laser field is written as follows:
H1 = −E(t)
[0 µµ∗ 0
], (3)
where matrix element µ stands for the dipole transitionin two-level system. Dynamics of the system underconsideration now is given by evolution of Liouvilleequation of the density matrix, as follows:
∂
∂tρ =
[ρ , H0 + H1
]. (4)
Here we may recall some points of the well-knownpump-probe spectroscopy. Specifically, in such mea-surements pump beam induces population and polar-ization in the sample, whereas weak probe pulse isused to test these changes. Usually, fields are directedto the sample at different angles, and two polariza-tion waves interfere to produce a grating with periodh = |kL − kP| in k-space. Diffraction on this gratingresults in energy transfer from the pump beam to theprobe one. In our simulations it is assumed that mod-uli of wave vectors |kL|, |kP| are equal and modulationof the refraction index is quite small. Therefore, werestrict ourselves to the first order of diffraction only,by defining polarization amplitudes QL, QP, and QL2P
(propagating at directions kL, kP, and 2kL − kP, re-spectively), and expanding polarization ρ12 and popu-lation n = ρ22 − ρ11 in the following manner [15]:
ρ12 =QL eikLr +QP eikPr +QL2P ei2kLr−kPr ,
n= n0 + n1 eiHr + n−1 e−iHr . (5)
(Note that n−1 = n∗1.) After substituting expressions(5) into Liouville equations one gets the followingequations describing evolution of this two-level sys-tem:
∂
∂tn0 = iΛ∗
LQL − iΛLQ∗
L + iΛ∗
PQP − iΛPQ∗
P
− n0 − n0(0)
T1, (6)
∂
∂tn1 = iΛ∗
LQP − iΛPQ∗
L + iΛLQL2P − n1
T1, (7)
∂
∂tQL = iω12QL +
i
2ΛLn0 +
i
2ΛPn−1 −
QL
T2, (8)
∂
∂tQP = iω12QP +
i
2ΛLn1 +
i
2ΛPn0 −
QP
T2, (9)
∂
∂tQL2P = iω12QL2P +
i
2ΛLn1 −
QL2P
T2, (10)

A. Savickas and E. Gaižauskas / Lithuanian J. Phys. 48, 155–162 (2008) 157
where terms with characteristic constants T1 and T2
are introduced to account for population and polar-ization relaxation, respectively. n0(0) is initial pop-ulation of the system (in our simulations n0(0) =−1, as the system is assumed to be in ground state),ΛL,P = µ εL,P(t)/~ corresponds to the Rabi frequen-cies of pump and probe fields.
To exclude the dominant “fast” oscillations at fre-quencies ωL and ωP from polarization QL, QL2P, andQP, those are replaced with QL = Qs
L ei[−ωL(t−τL)],QL2P = Qs
L2P ei[−2ωL(t−τL)+ωP(t−τP)], and QP =Qs
P ei[−ωP(t−τP)]. Then, using rotating wave approxi-mation, equations for material variables (polarizationand population) can be written as
∂
∂tn0 = iΛLQ
sL − iΛ∗
LQs∗L + iΛPQ
sP − iΛ∗
PQs∗P
− n0 − n0(0)
T1, (11)
∂
∂tn1 = i(−∆P12 + ∆L12)n1 + iΛLQ
sP − iΛPQ
s∗L
− iΛLQsL2P − n1
T1, (12)
∂
∂tQs
L = −i∆L12QsL+
i
2ΛLn0+
i
2ΛPn−1−
QsL
T2, (13)
∂
∂tQs
P = −i∆P12QsP+
i
2ΛLn1+
i
2ΛPn0−
QsP
T2, (14)
∂
∂tQs
L2P = −i(2∆L12 − ∆P12)QsL2P +
i
2ΛLn1
− QsL2P
T2, (15)
where ∆L12 = ωL −ω12 and ∆P12 = ωP −ω12 are de-tunings of the pump and probe pulses from resonance.In our simulations they are assumed to be equal in dis-persed pump-probe measurement (see below), whenspectrum of the probe pulse is considered as supercon-tinuum. In this case the detuning of the probe pulseis not crucial, provided probe spectrum is taken suffi-ciently broad.
Two kinds of pump-probe experiments are known –these are dispersed and two-colour pump-probe exper-iments. In the latter case both pulses are of the sameduration. Transmission differences can be calculated atvarious delay times between probe and pump beams,
also when pump and probe are off resonance. Differ-ence spectrum in this case reads:
∆A(τ) ∼∫
|ΛP(τ)|2 dt−∫ ∣∣∣Λ0
P(τ)∣∣∣2dt . (16)
Here τ denotes the delay time between pump and probefields. ΛP and Λ0
P stand for the cases when pump pulseis turned on and off, respectively. (In fact, due to calcu-lation problems, Λ0
P is evaluated for the long delay ofthe pump pulse.)
The evolution of probe field is expressed usingMaxwell equation:
∂
∂zΛP ∼ −iQs
P(ΛL 6= 0,ΛP, τ) , (17)
∂
∂zΛ0
P ∼ −iQsP(ΛL = 0,ΛP, τ) . (18)
When dispersed pump-probe experiment is investi-gated, one calculates differential transmission spectrumof the probe field. It can be written as follows:
∆A(ω, τ) ∼∣∣∣∣∫
ΛP(τ)e−iωtdt
∣∣∣∣2
−∣∣∣∣∫
Λ0P(τ)e−iωtdt
∣∣∣∣2
.
(19)Runge–Kutta method of fourth order is used to sim-
ulate the Eqs. (11)–(15).
2.2. Two-level system in the representation of“dressed” states
Before presenting results of the Stark effect manifes-tation in differential absorption spectra, it is instructiveto have a look at physics of the two-level system in astrong near-resonant cw laser field. It is well knownthat Rabi oscillations, i. e. sinusoidal time evolution ofthe material variables (population and polarization) re-sults in the splitting of the quantum states of compositelight–matter system in the dressed-state representation(see e. g. [10, 17, 18] and references therein).
Due to strong interaction between field and two-level quantum system, the superposition of field andquantum system is approached. In this case Schrödingerequation
i~∂
∂tψ(r, t) = Hψ(r, t) (20)
for stationary system Hamiltonian H can be solved ex-pressing the wave function ψ(r, t) as superposition:
ψ(r, t) = C1(t)|g〉 e−iω1t + C2(t)|e〉 e−iω2t , (21)
where Cj(t) represents probability amplitude to findsystem in state |j〉, j = (g, e). Assuming that mod-ulus of coefficient Cj(t) is constant, |Cj(t)| = const,

158 A. Savickas and E. Gaižauskas / Lithuanian J. Phys. 48, 155–162 (2008)
and using appropriate boundary conditions (details ofthe full solution of this problem see in [18]) the wavevectors |g〉± and |e〉± describing superposition of thecompound field and matter system are found. Proba-bilities to find the system in “dressed” states reads:
|〈ψ|g〉±|2 =|Λ|2
2Λ′(Λ′∓∆), |〈ψ|e〉±|2 =
Λ′∓∆
2Λ′. (22)
Here Λ′ =√
Λ2 + ∆2 is a generalized Rabi frequency.
Fig. 1. Dressed atomic states in the cases of weak and strong in-teraction, corresponding to the case ∆ > 0. Grey circles mark the
population of quantum state.
Schematic representation of the “dressed” by theelectromagnetic field two-level system is drawn inFig. 1 for weak- and strong-field cases. Possible dipoletransitions at three frequencies ω, ω + Λ′, and ω − Λ′
are marked here by arrows.Differential absorption spectra corresponding to the
transition to “dressed” states can be easily calculatedfrom Eqs. (11)–(15). In stationary case a linear set ofequations for separate Fourier components reads as fol-lows:(ωP − ω12 −
i
T2
)QP = ΛPn(0) + ΛLn(ωP − ωL) ,
(23)
(ωP−ω12)n(ωP−ωL) = 2(Λ∗
LQP−ΛPQ∗
L−ΛLQ∗
L2P) ,(24)
(2ωL − ωP − ω12 +
i
T2
)Q∗
L2P = −2Λ∗
Ln(ωP−ωL) .
(25)The solutions for polarization at directions kP and
2kL − kP are:
QP =
=ΛPn0
D
[(2ωL − ωP − ω12 +
i
T2
)(ωP − ωL − i
T1
)
+ 2Λ2L
(1 − 2ωL − ωP − ω12 + i/T2
ωL − ω12 + i/T2
)], (26)
Q∗
L2P =2Λ2
LΛPn0
D
(1 − ωP − ω12 − i/T2
ωL − ω12 + i/T2
), (27)
where D is denominator expressed as
D = (ωP − ωL)
×[−(ωP−ωL)2+(ω12−ωL)2+ 4Λ2
L+1
T 22
+2
T2T1
]
+i
T2
[2(ωP − ωL)2 + 4Λ2
L
]
+i
T1
[(ωP − ω12)(ωP − 2ωL + ω12) +
1
T 22
]. (28)
Differential absorption spectrum probed at kP, calcu-lated using these expressions, is drawn in the Fig. 2(a).This spectrum has well-known Mollow resonances [19]at frequencies which exactly match the transitions be-tween “dressed” states:
ωP = ωL , ωP = ωL ± ∆ , (29)
where ∆=√
(ωL−ω12)2+4Λ2L+1/T 2
2 +2/(T2T1).
Fig. 2. Spectra in the limit of steady states: (a) differential absorp-tion directed at kP, (b) modulus of the polarization wave directed
at 2kL − kP.
Additionally, negative dip at the resonance fre-quency ω12 is observed in Fig. 2(a) and it correspondsto reduced absorption from the ground to excited statedue to the perturbation.
On the other hand, it should be stressed that Starkshifts can be examined at the direction 2kL − kP, towhich some part of the induced polarization is scattereddue to the induced polarization grating. In Fig. 2(b)we plot the modulus of polarization scattered in this

A. Savickas and E. Gaižauskas / Lithuanian J. Phys. 48, 155–162 (2008) 159
direction. In comparison to Fig. 2(a), absence of thenegative dip at unperturbed resonance frequency ω12
should be stressed here.
3. Results of numerical modelling and discussions
Before we begin discussing results of numericalmodelling, we will make some remarks on the param-eters which will be used further throughout this paper.Firstly, as a population relaxation at the femtosecondto picosecond scale is negligible in the system we areinterested in (QD), it has been excluded from simula-tions (i. e. T1 is set to infinity). Phase relaxation timeT2 was varied in the region of 0.1–1 ps. In the case ofdispersed pump-probe experiment probe pulse has tobe wide enough to cover the whole line width, whichis conditioned both by phase relaxation time and Rabifrequency. The latter parameter ΛL was raised up to60 ps−1 (corresponding to the maximal used “area”ΘL =
∫∞
−∞ΛL(t) dt of the pump pulse). Therefore
probe pulse duration was set to 0.001 ps. As mentionedabove, weak probe beam is used to probe induced ab-sorption (transmission) changes, therefore its energyhas to be weak and probe pulse area ΘP =
∫ΛP(t) dt
has been set to 0.0001. All spectra were calculated atzero delay – when pump and probe pulse coincided intime τP = 0.
3.1. Dispersed pump-probe experiment
Usually the broad-band probe for the dispersedpump-probe experiment is created by using supercon-tinuum generation in wide-band dielectrics: water, op-tical glass, and fibres. The part of the pump pulse isused for these purposes. Therefore, analysing this caseit is reasonable to use the same carrier frequency bothfor the pump and probe pulses (ωL = ωP). We startour analysis with the spectra, which are depicted forthe fixed pump pulse area ΘL =70, while changing de-tunings of the pump and probe pulses ∆L12 = ∆P12
gradually from 20 to 60 ps−1. Spectra calculated atthree different phase relaxation times (T2 = 0.1, 0.2,and 0.5 ps) are shown in Fig. 3(a–c). Due to the rel-atively short (as compared to the pump pulse) phaserelaxation time, only negligible signatures of the OSEmanifest here in the subfigures (a) and (b). Instead,these spectra are dominated by the broad-band dip dueto the reduced absorption at the two-level resonance.Nevertheless, increasing relaxation time T2 leads toclear manifestation of the OSE in the spectra, whichrecall some features of the spectra in cw case shown in
Fig. 3. Differential absorption spectra versus pump and probe pulsedetuning from resonance depicted for different phase relaxationtime: (a) T2 = 0.1 ps, (b) 0.2 ps, (c) 0.5 ps. Subfigure (d) showsmagnified spectra for frequencies above the system resonance. Thearrows mark frequencies ωL and ωL + ΛL, τL = 0.5 ps, ΘL = 70.
Fig. 2. In Fig. 3(b, c) these signatures become notice-able when Stark shift exceeds the width of the systemspectra (i. e. when generalized Rabi frequency of thepump pulse becomes larger than the reciprocal phaserelaxation time ΛL > T−1
2 ) and manifest in an absorp-tion increase in the low-energy side of the spectra. Notethat the energy side on which more pronounced OSE isobservable depends on the pump pulse frequency de-tuning from resonance. In our case pump pulse en-ergy exceeds the difference between the energy levelsin the two-level system. As a result OSE is clearly ob-served on the longer wavelength side with respect tosystem resonance, quite according to predictions madeby using representation of the “dressed” states. Thesame features, though inversely signed and of consider-ably smaller amplitude, also occur on the shorter wave-length side. Figure 3(d) shows enlarged spectra corre-sponding to this wavelength region and displays bothoscillations and an absorption decrease.
Fig. 4. Comparison of (a) absorption and (b) differential absorbtionspectra for weak (ΘL = 10, dashed line) and strong (ΘL = 50,
solid line) excitation cases. T2 = 0.5 ps, ∆ωL = 40 ps−1.
160 A. Savickas and E. Gaižauskas / Lithuanian J. Phys. 48, 155–162 (2008)
In addition to these observations, which are qualita-tively similar to the ones shown in Fig. 2(a) and dis-cussed in the subsection above, one aspect of the Starkshift spectroscopy should be mentioned here. Usu-ally, line shifts of perturbed systems are determinedby measuring positive peak of the “butterfly” featurein the differential absorption spectrum. It is notewor-thy that in the case under consideration strong-field af-fected probe absorption undergoes changes both in po-sition and shape (amplitude), as it is seen from Fig. 4.Specifically, a closer look at the (a) absorption and (b)differential absorption spectra shown in Fig. 4 revealsthat “butterfly” in differential transmission spectrum isobserved when Rabi frequency remains small. On theother hand, the “butterfly” splits into two peaks of op-posite signs when the pump pulse amplitude increases.The first maximum matches the system resonance atfrequency ω12 and the second one means the shiftedline due to Stark effect. Therefore, when Stark shiftexceeds the line width of the system, it can be mea-sured more exactly from the positive peak position inthe differential absorption spectrum unless direct mea-surement of the absorption spectrum is possible.
Fig. 5. Differential absorption spectra versus pump pulse “area”ΘL, depicted for phase relaxation time (a) T2 = 0.1 ps, (b) 0.2 ps,(c) 0.5 ps, (d) 1.0 ps. Pump field duration τL = 0.5 ps, its detuningfrom resonance ∆ωL = 40 ps−1. The arrows here mark frequen-
cies ωL and ωL + ΛL.
Concluding this subsection we consider changesin the diferential absorption spectra when increasingpump pulse area, while keeping constant frequency de-tuning ∆L12 = ∆P12 = 40 ps−1. The results at differ-ent phase relaxation time are shown in Fig. 5. Like inprevious case, phase relaxation time T2 has been cho-sen longer, equal, and shorter than pump pulse dura-tion. Pump pulse area has been varied in the regionΘ = 1 . . . 71. Other parameters have been left as in thecase shown in Fig. 3. It is seen that differential absorp-tion spectra for both cases depicted in Figs. 3–5 exhibit
very similar changes both with respect to frequency de-tunig and phase relaxation time: here again small os-cillations emerge on the shorter wavelength side forτL ≤ T2, and disappear when pump pulse duration isprolonged. The Stark shift in the differential absorp-tion spectrum is seen only when generalized Rabi fre-quency exceeds the line width of homogenously broad-ened system, that is, Λ
′
L > T−12 .
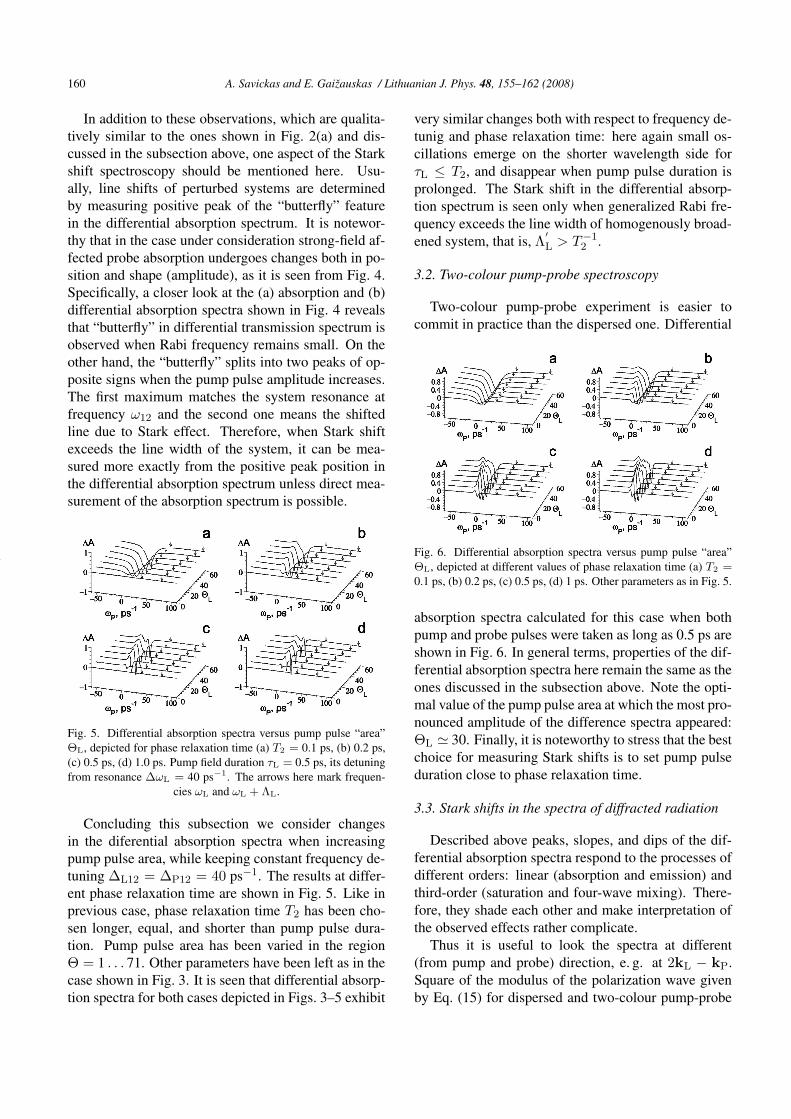
3.2. Two-colour pump-probe spectroscopy
Two-colour pump-probe experiment is easier tocommit in practice than the dispersed one. Differential
Fig. 6. Differential absorption spectra versus pump pulse “area”ΘL, depicted at different values of phase relaxation time (a) T2 =
0.1 ps, (b) 0.2 ps, (c) 0.5 ps, (d) 1 ps. Other parameters as in Fig. 5.
absorption spectra calculated for this case when bothpump and probe pulses were taken as long as 0.5 ps areshown in Fig. 6. In general terms, properties of the dif-ferential absorption spectra here remain the same as theones discussed in the subsection above. Note the opti-mal value of the pump pulse area at which the most pro-nounced amplitude of the difference spectra appeared:ΘL ' 30. Finally, it is noteworthy to stress that the bestchoice for measuring Stark shifts is to set pump pulseduration close to phase relaxation time.
3.3. Stark shifts in the spectra of diffracted radiation
Described above peaks, slopes, and dips of the dif-ferential absorption spectra respond to the processes ofdifferent orders: linear (absorption and emission) andthird-order (saturation and four-wave mixing). There-fore, they shade each other and make interpretation ofthe observed effects rather complicate.
Thus it is useful to look the spectra at different(from pump and probe) direction, e. g. at 2kL − kP.Square of the modulus of the polarization wave givenby Eq. (15) for dispersed and two-colour pump-probe

A. Savickas and E. Gaižauskas / Lithuanian J. Phys. 48, 155–162 (2008) 161
Fig. 7. Modulus spectra of polarization wave as obtained for dis-persed pump-probe measurements at direction 2kL − kP versuspump pulse “area” ΘL, depicted for phase relaxation time (a) T2 =
0.1 ps, (b) 0.2 ps, (c) 0.5 ps, (d) 1.0 ps. τL = 0.5 ps, ∆ωL =
40 ps−1.
Fig. 8. Modulus spectra of polarization wave as obtained for two-colour pump-probe measurements at direction 2kL − kP versuspump pulse “area” ΘL, depicted for phase relaxation time (a) T2 =
0.1 ps, (b) 0.2 ps, (c) 0.5 ps, (d) 1.0 ps. τL = 0.5 ps, ∆ωL =
40 ps−1.
measurement configurations are shown in Figs. 7 and8. In both cases Mollow triplet lines [19] are clearlyseen here. Four-wave mixing process is responsible forpolarization in this direction. It appears as the pumpand probe pulses interfere and is proportional to ΛPΛ2
L,as seen from steady state solution Eq. (27). Note thatRabi sidebands at frequencies ω12 and ωL + ∆ in-crease when increasing phase relaxation time (i. e. forstronger light–matter interaction case). Consequently,longer pulses, as compared to phase relaxation time,cause falling amplitudes of the Rabi sideband spectra,whereas distinct peak at the exciton resonance emergesin this case.
4. Conclusions
In this paper, we demonstrate the interference ef-fects of the strong pump and weak probe in angle-
resolved differential pump-probe spectroscopy. Thedressed atom approach in the frequency domain wasused to interpret our findings. Numerics for both dis-persed and two-colour configurations of pump-probemeasurements, in general terms, reveal the characteris-tics of the well-known Mollow triplet spectrum, thoughit is kept hidden to great extent by different mixingcontributions (four-wave mixing, bleaching due to thepopulation changes, induced polarization waves), whenmeasured in the direction of the probe beam. Neverthe-less, decreasing line width of the two-level system be-yond the generalized Rabi frequency of the pump pulseresults in a more clear manifestation of OSE in thedifferential absorption spectrum and can be estimatedfrom its positive peak position. On the other hand, clearMollow triplet, with characteristic of this spectra de-pendences on excitation strength and relaxation time ofcoherent polarization, can be observed in “pure” four-wave mixing direction 2kL − kP for measurements inboth (dispersed and two-colour) configurations.
We should recall that Stark effect is of instantaneousresponse, and dressed states and quantum level split-ting emerge only when system remains under excita-tion. This fact offers a possibility of all-optical fem-tosecond switch using two-photon absorption in three-level system: e. g., recently a technique has been sug-gested where strong femtosecond laser beam switchesoff another laser beam of different wavelength due tothe OSE in gases [21]. Our preliminary calculationsshow that extension of the model described above tothree-level system (specifically, by adding transitionfrom exciton to bi-exciton state) offers the same pos-sibility in semiconductor quantum dots, i. e. materialsmeeting the requirements of nanotechnology.
References
[1] E. Biolatti, R.C. Iotti, P. Zanardi, and F. Rossi,Quantum information processing with semiconduc-tor macroatoms, Phys. Rev. Lett. 85(26), 5647–5650(2000).
[2] P. Chen, C. Piermarocchi, and L.J. Sham, Control ofexciton dynamics in nanodots for quantum operations,Phys. Rev. Lett. 87(6), 067401 (2001).
[3] A. Nazir, B.W. Lovett, and G.A.D. Briggs, Creat-ing excitonic entanglement in quantum dots throughthe optical Stark effect, Phys. Rev. A 70(5), 052301(2004).
[4] A. Mysyrowicz, D. Hulin, A. Antonetti, A. Migus,W.T. Masselink, and H. Morkoc, “Dressed excitons”in a multiple-quantum-well structure: Evidence for an

162 A. Savickas and E. Gaižauskas / Lithuanian J. Phys. 48, 155–162 (2008)
optical Stark effect with femtosecond response time,Phys. Rev. Lett. 56(25), 2748–2751 (1986).
[5] C. Weisbuch, M. Nishioka, A. Ishikawa, andY. Arakawa, Observation of the coupled exciton-photon mode splitting in a semiconductor quantum mi-crocavity, Phys. Rev. Lett. 69(23), 3314–3317 (1992).
[6] H. Kamada, H. Gotoh, J. Temmyo, T. Takagahara, andH. Ando, Exciton Rabi oscillation in a single quantumdot, Phys. Rev. Lett. 87(24), 246401 (2001).
[7] T.H. Stievater, Xiaoqin Li, D.G. Steel, D. Gammon,D.S. Katzer, D. Park, C. Piermarocchi, and L.J. Sham,Rabi oscillations of excitons in single quantum dots,Phys. Rev. Lett. 87(13), 133603 (2001).
[8] M. Chachišvilis, H. Fidder, and V. Sundström, Elec-tronic coherence in pseudo two-collour pump-probespectroscopy, Chem. Phys. Lett. 234(1–3), 141–150(1995).
[9] P. Hamm, Coherent effects in femtosecond infraredspectroscopy, Chem. Phys. 200(3), 415–429 (1995).
[10] C. Cohen-Tannoudji, J. Dupont-Roc, and G. Grynberg,Atom-Photon Interactions: Basic Processes and Appli-cations (Wiley, New York, 1992).
[11] E. Gaižauskas and L. Valkunas, Coherent transients ofpump-probe spectroscopy in two-level approximation,Opt. Commun. 109(1–2), 75–80 (1994).
[12] L. Seider, G. Stock, and W. Domcke, Nonpertubativeapproach to femtosecond pump-probe spectroscopy:General theory and application to multidimensionalnonadiabatic photoisomerization processes, J. Chem.Phys. 103(10), 3998–4011 (1995).
[13] B. Wolfseder, L. Seider, G. Stock, and W. Domcke,Femtosecond pump-probe spectroscopy of electrontransfer systems: A nonpertubative approach, Chem.Phys. 217(2–3), 275–287 (1997).
[14] E. Gaižauskas and L. Valkunas, Femtosecond four-wave mixing spectroscopy of molecular aggregates,J. Phys. Chem. B, 101(37), 7321–7326 (1997).
[15] E. Gaižauskas, A. Beržanskis, and K.-H. Feller, Effectsof non-Markovian relaxation in the femtosecond dif-ferential absorption spectroscopy, Chem. Phys. 235(1–3), 123–130 (1998).
[16] J.-S. Park and T. Joo, Coherent interactions in fem-tosecond transient grating, J. Chem. Phys. 120(11),5269–5274 (2004).
[17] C. Cohen-Tannoudji and S. Reynaud, Dressed-atomdescription of resonance fluorescence and absorptionspectra of a multilevel atom in an intense laser beam,J. Phys. B 10(3), 345–363 (1977).
[18] R. Boyd, Nonlinear Optics (Academic Press, SanDiego, USA, 1992).
[19] B.R. Mollow, Stimulated emission and absorption nearresonance for driven systems, Phys. Rev. A 5(5), 2217–2222 (1972).
[20] F.Y. Wu, S. Ezekiel, M. Ducloy, and B.R. Mollow,Observation of amplification in a strongly driven two-level atomic system at optical frequencies, Phys. Rev.Lett. 38(19), 1077–1080 (1977).
[21] D.D. Yavuz, All-optical femtosecond switch usingtwo-photon absorption, Phys. Rev. A 74(5), 053804(2006).
ŠTARKO EFEKTO APRAIŠKOS SKIRTUMINES SUGERTIES SPEKTRUOSE
A. Savickas, E. Gaižauskas
Vilniaus universitetas, Vilnius, Lietuva
SantraukaTeoriškai tiriami skirtuminiai kvantiniu tašku, pasižyminciu
stipria saveika su rezonansiniu elektromagnetiniu (EM) lauku, skir-tumines sugerties spektrai. Modeliuojama dvieju lygmenu kvan-tine sistema, esanti nedideliu kampu susikertanciu dvieju (kaupi-nancio ir zonduojancio) lazeriniu pluoštu lauke. Kvantineje sis-temoje skirtingomis kryptimis indukuota poliarizacija ivertinta išLiuvilio (Liouville) lygties tankio matricai ir skaiciuojama netai-
kant iprastu žadinimo ir zondavimo spektroskopijai trikdžiu teori-jos artiniu. Apskaiciuoti skirtuminiai spektrai interpretuojami re-miantis žinomu apvilktuju busenu (angl. dressed states) modeliu,aprašanciu energijos lygmenu poslinkius stipriame EM lauke. Pa-rodyta, kad EM lauko ir kvantines sistemos saveikos stipri charak-terizuojanti spektra (Mollow tripleta) patogiausia stebeti ne zon-duojancio pluošto kryptimi.