Manhattan Market Report | Q1 2016
12
New York City Market Update First Quarter 2016 MANHATTAN BROKERAGES East Side | 38 East 61 st Street | t: 212.606.7660 Downtown | 149 Fifth Avenue, 4 th Floor | t: 212.431.2440 West Side | 2244 Broadway | t: 212.579.9300 34 East 74th Street | $24,000,000 | WEB: 00110712 sothebyshomes.com/nyc
-
Upload
sothebys-international-realty-inc -
Category
Documents
-
view
214 -
download
1
description
Â
Transcript of Manhattan Market Report | Q1 2016

New York City Market UpdateFirst Quarter 2016
MANHATTAN BROKERAGES
East Side | 38 East 61st Street | t: 212.606.7660
Downtown | 149 Fifth Avenue, 4th Floor | t: 212.431.2440
West Side | 2244 Broadway | t: 212.579.9300
34 East 74th Street | $24,000,000 | WEB: 00110712
sothebyshomes.com/nyc

sothebyshomes.com/nyc
$0
$500,000
$1,000,000
$1,500,000
$2,000,000
$2,500,000
Q2:14 Q3:14 Q4:14 Q1:15 Q2:15 Q3:15 Q4:15 Q1:16
Average Sales Price Median Sales Price
MANHATTAN MARKET | OVERVIEW
MANHATTAN OVERVIEW
UNDER $3M $3M TO $10M OVER $10M TOTAL
Q1 : 16 Q1 : 15 % Change Q1 : 16 Q1 : 15 % Change Q1 : 16 Q1 : 15 % Change Q1 : 16 Q1 : 15 % Change
Number of Closed Sales 2,255 2,466 -9% 453 372 22% 67 47 43% 2,775 2,885 -4%
Average Days on Market 82 83 -1%
Listing Discount 5% 6% -17%
Average Sales Price $1,155,000 $1,051,000 10% $4,919,000 $4,900,000 0% $15,788,000 $20,660,000 -24% $2,112,000 $1,816,000 16%
Median Sales Price $945,000 $835,000 13% $4,300,000 $4,350,000 -1% $14,500,000 $15,900,000 -9% $1,175,000 $970,000 21%
Listing Inventory Further detail on page 3 5464 5141 6%
Months of Supply 4.9 5.0 -1%
CONDOS & CO-OPS OVERVIEW The 1st Quarter of 2016 was much like the 4th Quarter of 2015 - market price measures were pushed to record high levels because of a heavy influence by closings at new construction condos. While the average and median prices have reached record high levels, there is a sense on the ground, that the market momentum upward may be stalling in some market segments. However, with overall inventory remaining at historic lows, the general market is poised to exhibit stability in the near term. With 2,775 closed sales in the 1st Quarter of 2016 (4% fewer than prior year), the overall average sale price was $2,112,000, a 16% increase over prior year. The overall median sale price also had a significant year-over-year increase of 21% to $1,175,000. In the analysis presented by three distinct price tiers – less than $3mil; $3mil to $10mil; and over $10 mil – the rising market price trend is evident in the lowest price bracket. For all properties sold under $3mil, the average sale price was up 10% and the median sale price was higher by 13% with 9% fewer closed sales in this price segment. Prices under $3mil accounted for approximately 81% of total market sales sampled this quarter. In the next price tier - $3mil to $10mil – the average and median sale price figures were essentially unchanged at $4,900,000 and $4,300,000, respectively. There were 22% more sales this quarter than last among units sold in this price tier, which accounted for approximately 16% of total sales. The top price tier segment of units sold over $10mil is where market price weakness remains evident given that this sector of the market has the highest months supply of inventory (see absorption section). With fewer record setting sale prices in the top 1% of the market, the average sale price for unit sold over $10mil fell 24% while the median sale price was lower by 9%.
The average sale price of all recorded Manhattan sales in the 1st Quarter of 2016 was $2,112,000 which
is 5% higher than prior quarter and 16% greater than one year ago. The median sale price gained
21% from prior year and 2% from prior quarter. Both the average sale price and the median sale price are record high measures for Manhattan overall prices.
AVERAGE and MEDIAN SALES PRICE
Fewer units for sale at the lower end of price spectrum, coupled with falling demand at the higher price tiers, led to a decline in the number of closed sales. The 2,775 closed sales this quarter was just 4% lower than prior year but 18% lower than last quarter. Total inventory remains far below normalized supply levels of 8,000-9,000+/- listings. The inventory measure has been well under 6,000 units for nearly 3 years.
NUMBER OF CLOSED SALES and INVENTORY
0
1000
2000
3000
4000
5000
6000
Q2:14 Q3:14 Q4:14 Q1:15 Q2:15 Q3:15 Q4:15 Q1:16
# of Closed Sales Inventory

sothebyshomes.com/nyc
MANHATTAN MARKET | ABSORPTION RATE
Less than $1M $1M - $2M $2M - $4M $4M - $6M $6M - $10M $10M - $20M $20M+ TOTAL
Active Listing Inventory 1,645 1,373 1,175 544 374 228 126 5,465
Average Closed Sales / Month 512 283 189 61 41 16 4 1,106
Months of Supply per Price Category 3.2 4.9 6.2 8.9 9.1 14.3 31.5 4.9
CONDOS & CO-OPS (based on 6 months of closed sales 09.01.2015 - 02.29.2016)
The overall Manhattan absorption rate stands at 4.9 months. However, properties valued $6mil continue to have much higher absorption rates. Inventory shortage persists in the lower price tiers with units under $1mil at 3.2 months supply and units under $2mil at 4.9 months supply. The top 3 price tiers have absorption rates signifying that buyers retain an advantage, particularly at the $20mil+ price segment where there is nearly a 2.5 year supply of inventory at the current pace of sales. Top market price tiers are where buyers have the most choice and the recent trend of price reductions and concessions at new developments is likely to continue. The historic range of equilibrium for the market area is 9+/- months. The absorption rate is calculated by taking the total number of currently active listings and dividing by the average number of closed sales over the 6 month period.
NUMBER OF ACTIVE LISTINGS
AVERAGE DAYS ON MARKET & LISTING DISCOUNT
AVERAGE DAYS ON MARKET
The total number of days a listing is on the active market before an offer is accepted. It is calculated by totaling the total days on market for every closed sale, and dividing the total days by the total number of closed sales.
LISTING DISCOUNT
The percent change between the original asking (listing) price of a home, and the final sales price of the home. It is calculated by subtracting the sales price from the original listing price, and dividing the result by the original listing price.
Q2 : 14 Q3 : 14 Q4 : 14 Q1 : 15 Q2 : 15 Q3 : 15 Q4 : 15 Q1 : 16
Average Days on Market 83 74 85 83 84 73 77 82
Listing Discount 3% 6% 7% 6% 4% 4% 6% 5%
ABSORPTION RATE
0
5
10
15
20
25
30
35
Less than$1M
$1M - 2M $2M - $4M $4M - $6M $6M -$10M
$10M -$20M
$20M+
Absorption Overall Absorption Rate
30%
25%
22%
10%
7%4%
2%
< $1mil$1mil - $2mil> $2mil - $4mil> $4mil - $6mil>$6mil - $10mil> $10mil < $20mil$20mil+
0%
1%
2%
3%
4%
5%
6%
7%
8%
6668707274767880828486
Q2:14 Q3:14 Q4:14 Q1:15 Q2:15 Q3:15 Q4:15 Q1:16Average Days on Market Listing Discount

sothebyshomes.com/nyc
THE ULTRA LUXURY MARKETCO-OPS, CONDOS & TOWNHOUSES OVER $10M
Over the 1st Quarter of 2016 there were 79 ultra-luxury sales, 25% more than prior quarter and nearly equal with prior year. The average sale price in this market sector was 6% less than prior quarter and 16% less than the prior year average of $22.138 mil. The highest posted sale price this quarter was $35.336 mil for a 9th floor unit at 101 Central Park West in the Upper West Side market area.
Q2 : 14 Q3 : 14 Q4 : 14 Q1 : 15 Q2 : 15 Q3 : 15 Q4 : 15 Q1 : 16
Number of Closed Sales 74 75 69 75 49 75 63 79
Average Sales Price $16,931,000 $17,912,000 $23,927,000 $22,138,000 $19,367,000 $18,733,000 $19,600,000 $18,500,000
Highest Sales Price $70,000,000 $71,300,000 $100,500,000 $91,500,000 $47,800,000 $37,940,000 $45,000,000 $35,336,000
*Due to client confidentiality the final sales price cannot be disclosed.
101 Central Park West, Apt 9BC
Last Asking: $38,000,000
Randall Gianopulos | 212.606.7622
Serena Boardman | 212.606.7611
NUMBER OF CLOSED SALES and AVERAGE SALES PRICE
SOTHEBY’S INTERNATIONAL REALTY - MANHATTAN SIGNIFICANT SALES
481 Greenwich Street, PHB
Last Asking: $9,975,000
Jeremy Stein | 212.431.2427
Robin Stein | 212.431.2446
293 Lafayette Street, PH II
Last Asking: $35,100,000
Nikki Field | 212.606.7669
Mara Flash Blum | 212.431.2447
$0
$5,000,000
$10,000,000
$15,000,000
$20,000,000
$25,000,000
$30,000,000
0
10
20
30
40
50
60
70
80
90
Q2:14 Q3:14 Q4:14 Q1:15 Q2:15 Q3:15 Q4:15 Q1:16
# of Closed Sales Average Sales Price
sothebyshomes.com/nyc
MANHATTAN MARKET | CO-OPS & CONDOS CO-OPS
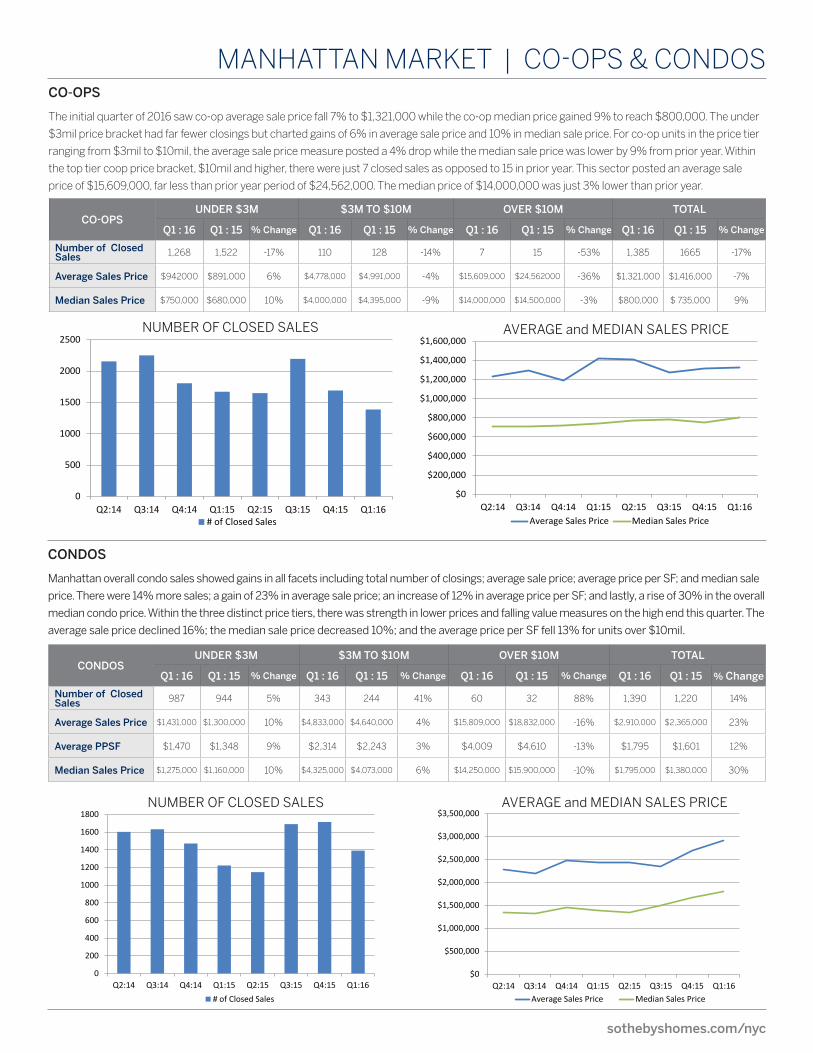
The initial quarter of 2016 saw co-op average sale price fall 7% to $1,321,000 while the co-op median price gained 9% to reach $800,000. The under
$3mil price bracket had far fewer closings but charted gains of 6% in average sale price and 10% in median sale price. For co-op units in the price tier
ranging from $3mil to $10mil, the average sale price measure posted a 4% drop while the median sale price was lower by 9% from prior year. Within
the top tier coop price bracket, $10mil and higher, there were just 7 closed sales as opposed to 15 in prior year. This sector posted an average sale
price of $15,609,000, far less than prior year period of $24,562,000. The median price of $14,000,000 was just 3% lower than prior year.
CONDOS
Manhattan overall condo sales showed gains in all facets including total number of closings; average sale price; average price per SF; and median sale
price. There were 14% more sales; a gain of 23% in average sale price; an increase of 12% in average price per SF; and lastly, a rise of 30% in the overall
median condo price. Within the three distinct price tiers, there was strength in lower prices and falling value measures on the high end this quarter. The
average sale price declined 16%; the median sale price decreased 10%; and the average price per SF fell 13% for units over $10mil.
CO-OPSUNDER $3M $3M TO $10M OVER $10M TOTAL
Q1 : 16 Q1 : 15 % Change Q1 : 16 Q1 : 15 % Change Q1 : 16 Q1 : 15 % Change Q1 : 16 Q1 : 15 % Change
Number of Closed Sales 1,268 1,522 -17% 110 128 -14% 7 15 -53% 1,385 1665 -17%
Average Sales Price $942000 $891,000 6% $4,778,000 $4,991,000 -4% $15,609,000 $24,562000 -36% $1,321,000 $1,416,000 -7%
Median Sales Price $750,000 $680,000 10% $4,000,000 $4,395,000 -9% $14,000,000 $14,500,000 -3% $800,000 $ 735,000 9%
CONDOSUNDER $3M $3M TO $10M OVER $10M TOTAL
Q1 : 16 Q1 : 15 % Change Q1 : 16 Q1 : 15 % Change Q1 : 16 Q1 : 15 % Change Q1 : 16 Q1 : 15 % Change
Number of Closed Sales 987 944 5% 343 244 41% 60 32 88% 1,390 1,220 14%
Average Sales Price $1,431,000 $1,300,000 10% $4,833,000 $4,640,000 4% $15,809,000 $18,832,000 -16% $2,910,000 $2,365,000 23%
Average PPSF $1,470 $1,348 9% $2,314 $2,243 3% $4,009 $4,610 -13% $1,795 $1,601 12%
Median Sales Price $1,275,000 $1,160,000 10% $4,325,000 $4,073,000 6% $14,250,000 $15,900,000 -10% $1,795,000 $1,380,000 30%
NUMBER OF CLOSED SALES AVERAGE and MEDIAN SALES PRICE
0
500
1000
1500
2000
2500
Q2:14 Q3:14 Q4:14 Q1:15 Q2:15 Q3:15 Q4:15 Q1:16# of Closed Sales
$0
$200,000
$400,000
$600,000
$800,000
$1,000,000
$1,200,000
$1,400,000
$1,600,000
Q2:14 Q3:14 Q4:14 Q1:15 Q2:15 Q3:15 Q4:15 Q1:16Average Sales Price Median Sales Price
0
200
400
600
800
1000
1200
1400
1600
1800
Q2:14 Q3:14 Q4:14 Q1:15 Q2:15 Q3:15 Q4:15 Q1:16# of Closed Sales
$0
$500,000
$1,000,000
$1,500,000
$2,000,000
$2,500,000
$3,000,000
$3,500,000
Q2:14 Q3:14 Q4:14 Q1:15 Q2:15 Q3:15 Q4:15 Q1:16Average Sales Price Median Sales Price
NUMBER OF CLOSED SALES AVERAGE and MEDIAN SALES PRICE
sothebyshomes.com/nyc
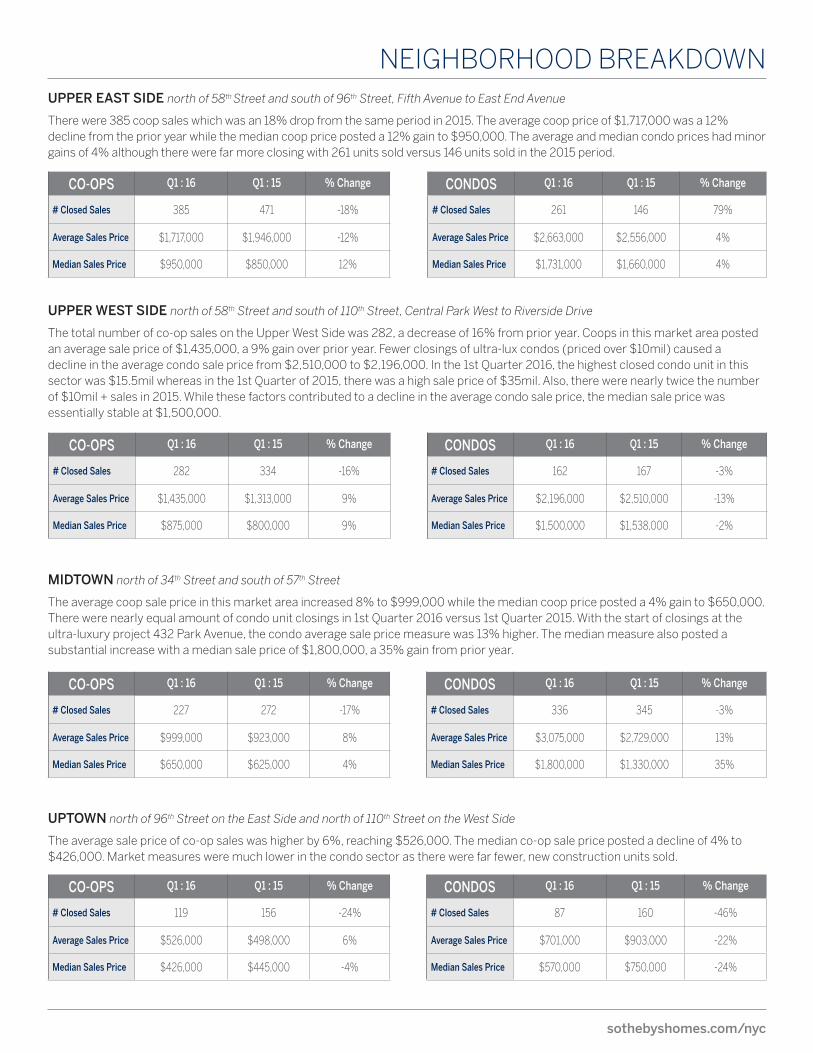
NEIGHBORHOOD BREAKDOWNUPPER EAST SIDE north of 58th Street and south of 96th Street, Fifth Avenue to East End Avenue
There were 385 coop sales which was an 18% drop from the same period in 2015. The average coop price of $1,717,000 was a 12% decline from the prior year while the median coop price posted a 12% gain to $950,000. The average and median condo prices had minor gains of 4% although there were far more closing with 261 units sold versus 146 units sold in the 2015 period.
CO-OPS Q1 : 16 Q1 : 15 % Change
# Closed Sales 385 471 -18%
Average Sales Price $1,717,000 $1,946,000 -12%
Median Sales Price $950,000 $850,000 12%
CONDOS Q1 : 16 Q1 : 15 % Change
# Closed Sales 261 146 79%
Average Sales Price $2,663,000 $2,556,000 4%
Median Sales Price $1,731,000 $1,660,000 4%
UPPER WEST SIDE north of 58th Street and south of 110th Street, Central Park West to Riverside Drive
The total number of co-op sales on the Upper West Side was 282, a decrease of 16% from prior year. Coops in this market area posted an average sale price of $1,435,000, a 9% gain over prior year. Fewer closings of ultra-lux condos (priced over $10mil) caused a decline in the average condo sale price from $2,510,000 to $2,196,000. In the 1st Quarter 2016, the highest closed condo unit in this sector was $15.5mil whereas in the 1st Quarter of 2015, there was a high sale price of $35mil. Also, there were nearly twice the number of $10mil + sales in 2015. While these factors contributed to a decline in the average condo sale price, the median sale price was essentially stable at $1,500,000.
CO-OPS Q1 : 16 Q1 : 15 % Change
# Closed Sales 282 334 -16%
Average Sales Price $1,435,000 $1,313,000 9%
Median Sales Price $875,000 $800,000 9%
CONDOS Q1 : 16 Q1 : 15 % Change
# Closed Sales 162 167 -3%
Average Sales Price $2,196,000 $2,510,000 -13%
Median Sales Price $1,500,000 $1,538,000 -2%
MIDTOWN north of 34th Street and south of 57th Street
The average coop sale price in this market area increased 8% to $999,000 while the median coop price posted a 4% gain to $650,000. There were nearly equal amount of condo unit closings in 1st Quarter 2016 versus 1st Quarter 2015. With the start of closings at the ultra-luxury project 432 Park Avenue, the condo average sale price measure was 13% higher. The median measure also posted a substantial increase with a median sale price of $1,800,000, a 35% gain from prior year.
CO-OPS Q1 : 16 Q1 : 15 % Change
# Closed Sales 227 272 -17%
Average Sales Price $999,000 $923,000 8%
Median Sales Price $650,000 $625,000 4%
CONDOS Q1 : 16 Q1 : 15 % Change
# Closed Sales 336 345 -3%
Average Sales Price $3,075,000 $2,729,000 13%
Median Sales Price $1,800,000 $1,330,000 35%
UPTOWN north of 96th Street on the East Side and north of 110th Street on the West Side
The average sale price of co-op sales was higher by 6%, reaching $526,000. The median co-op sale price posted a decline of 4% to $426,000. Market measures were much lower in the condo sector as there were far fewer, new construction units sold.
CO-OPS Q1 : 16 Q1 : 15 % Change
# Closed Sales 119 156 -24%
Average Sales Price $526,000 $498,000 6%
Median Sales Price $426,000 $445,000 -4%
CONDOS Q1 : 16 Q1 : 15 % Change
# Closed Sales 87 160 -46%
Average Sales Price $701,000 $903,000 -22%
Median Sales Price $570,000 $750,000 -24%
sothebyshomes.com/nyc
NEIGHBORHOOD BREAKDOWN
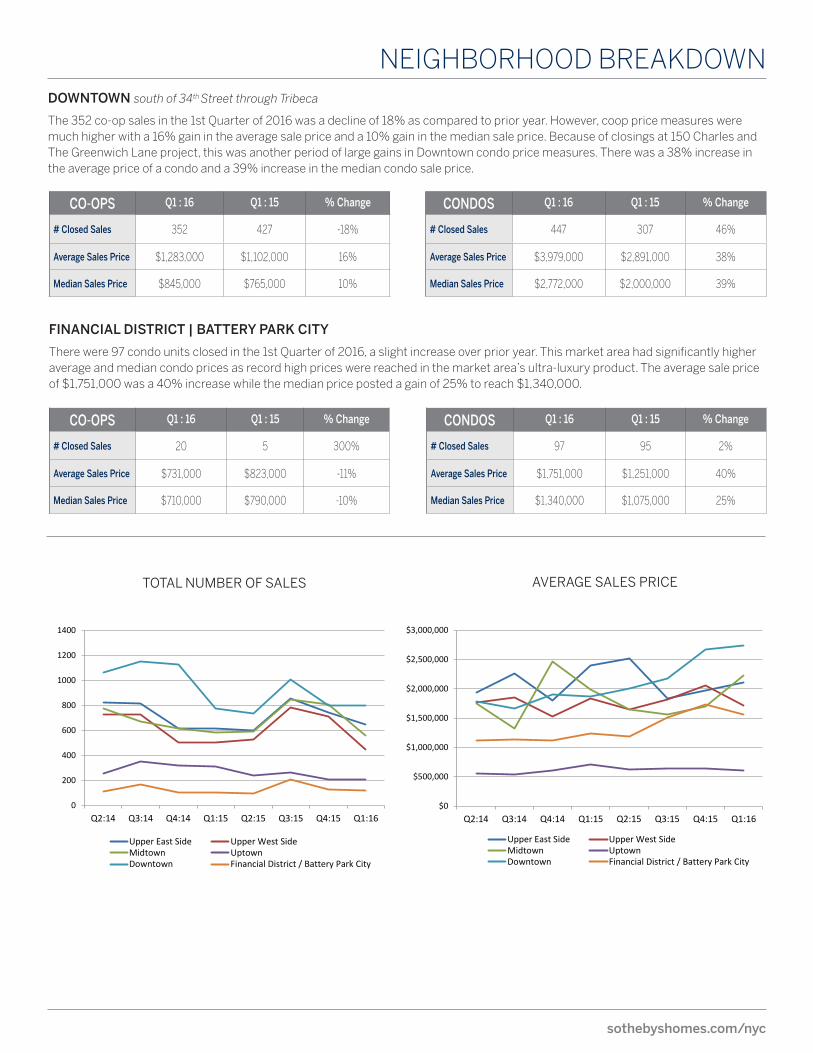
TOTAL NUMBER OF SALES AVERAGE SALES PRICE
DOWNTOWN south of 34th Street through Tribeca
The 352 co-op sales in the 1st Quarter of 2016 was a decline of 18% as compared to prior year. However, coop price measures were much higher with a 16% gain in the average sale price and a 10% gain in the median sale price. Because of closings at 150 Charles and The Greenwich Lane project, this was another period of large gains in Downtown condo price measures. There was a 38% increase in the average price of a condo and a 39% increase in the median condo sale price.
CO-OPS Q1 : 16 Q1 : 15 % Change
# Closed Sales 352 427 -18%
Average Sales Price $1,283,000 $1,102,000 16%
Median Sales Price $845,000 $765,000 10%
CONDOS Q1 : 16 Q1 : 15 % Change
# Closed Sales 447 307 46%
Average Sales Price $3,979,000 $2,891,000 38%
Median Sales Price $2,772,000 $2,000,000 39%
FINANCIAL DISTRICT | BATTERY PARK CITY
There were 97 condo units closed in the 1st Quarter of 2016, a slight increase over prior year. This market area had significantly higher average and median condo prices as record high prices were reached in the market area’s ultra-luxury product. The average sale price of $1,751,000 was a 40% increase while the median price posted a gain of 25% to reach $1,340,000.
CO-OPS Q1 : 16 Q1 : 15 % Change
# Closed Sales 20 5 300%
Average Sales Price $731,000 $823,000 -11%
Median Sales Price $710,000 $790,000 -10%
CONDOS Q1 : 16 Q1 : 15 % Change
# Closed Sales 97 95 2%
Average Sales Price $1,751,000 $1,251,000 40%
Median Sales Price $1,340,000 $1,075,000 25%
0
200
400
600
800
1000
1200
1400
Q3:13 Q4:13 Q1:14 Q2:14 Q3:14 Q4:14 Q1:15 Q2:15Upper East Side Upper West SideMidtown UptownDowntown Financial District / Battery Park City
0
200
400
600
800
1000
1200
1400
Q3:13 Q4:13 Q1:14 Q2:14 Q3:14 Q4:14 Q1:15 Q2:15Upper East Side Upper West SideMidtown UptownDowntown Financial District / Battery Park City
0
200
400
600
800
1000
1200
1400
Q3:13 Q4:13 Q1:14 Q2:14 Q3:14 Q4:14 Q1:15 Q2:15Upper East Side Upper West SideMidtown UptownDowntown Financial District / Battery Park City
0
200
400
600
800
1000
1200
1400
Q3:13 Q4:13 Q1:14 Q2:14 Q3:14 Q4:14 Q1:15 Q2:15Upper East Side Upper West SideMidtown UptownDowntown Financial District / Battery Park City
0
200
400
600
800
1000
1200
1400
Q2:14 Q3:14 Q4:14 Q1:15 Q2:15 Q3:15 Q4:15 Q1:16Upper East Side Upper West SideMidtown UptownDowntown Financial District / Battery Park City
$0
$500,000
$1,000,000
$1,500,000
$2,000,000
$2,500,000
$3,000,000
Q2:14 Q3:14 Q4:14 Q1:15 Q2:15 Q3:15 Q4:15 Q1:16
Upper East Side Upper West SideMidtown UptownDowntown Financial District / Battery Park City
sothebyshomes.com/nyc
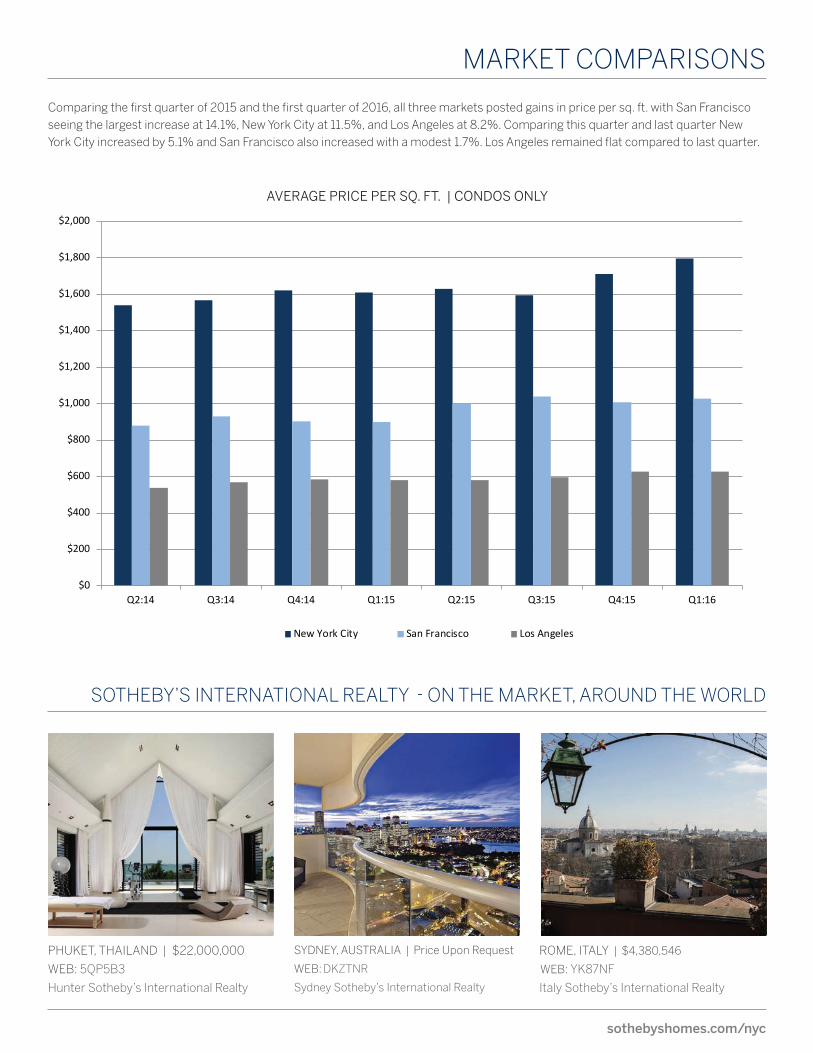
MARKET COMPARISONS
SOTHEBY’S INTERNATIONAL REALTY - ON THE MARKET, AROUND THE WORLD
Comparing the first quarter of 2015 and the first quarter of 2016, all three markets posted gains in price per sq. ft. with San Francisco seeing the largest increase at 14.1%, New York City at 11.5%, and Los Angeles at 8.2%. Comparing this quarter and last quarter New York City increased by 5.1% and San Francisco also increased with a modest 1.7%. Los Angeles remained flat compared to last quarter.
PHUKET, THAILAND | $22,000,000
WEB: 5QP5B3
Hunter Sotheby’s International Realty
SYDNEY, AUSTRALIA | Price Upon Request
WEB: DKZTNR
Sydney Sotheby’s International Realty
ROME, ITALY | $4,380,546
WEB: YK87NF
Italy Sotheby’s International Realty
AVERAGE PRICE PER SQ. FT. | CONDOS ONLY
$0
$200
$400
$600
$800
$1,000
$1,200
$1,400
$1,600
$1,800
$2,000
Q2:14 Q3:14 Q4:14 Q1:15 Q2:15 Q3:15 Q4:15 Q1:16
New York City San Francisco Los Angeles

sothebyshomes.com/nyc
FEATURED LISTINGS
230 WEST 10TH STREET | $14,500,000
Approx. 6,700 sq. ft. | WEB: 00110478
Martine D. Capdevielle | 212.400.8702
Vannessa A. Kaufman | 212.606.7639
1120 FIFTH AVENUE | $15,200,000
5 BR / 4.5 BA | WEB: 00110700
Lisa Maysonet | 212.606.7603
Gary Kabol | 212.606.7606
2 RIVER TERRACE | $12,000,000
5 BR / 7.5 BA | WEB: 00110619
Craig George | 212.400.8754
Nikki Field | 212.606.7669
820 PARK AVENUE | $9,500,000
4 BR / 4.5 BA | WEB: 00110665
Serena Boardman | 212.606.7611
59 FOURTH AVENUE, APT 7A | $2,250,000
2 BR / 2 BA | WEB: 0138336
Jeremy V. Stein | 212.431.2427
Jennifer Lanza | 212.810.4960
232 EAST 6TH STREET, 3B | $2,650,000
3 BR / 2 BA | WEB: 0138456
Sandra Cohen | 212.810.4973
Alain Azaria | 212.431.2472
250 WEST 82ND STREET | $3,500,000
4 BR / 2.5 BA | WEB: 0138340
Debra Pinto | 212.810.4975
170 SECOND AVENUE, 8A | $1,600,000
2 BR / 1 BA | WEB: 0138391
Janet Greenberg | 212.431.2466
Beverly Sonnenborn | 212.431.2453
416 WASHINGTON STREET | $2,200,000
1 BR / 1.5 BA | WEB: 0138466
Torsten Krines | 212.431.2471

sothebyshomes.com/nyc
A MESSAGE FROM OUR MANAGERS:
With the end of daylight savings time, the days are getting longer and the spring market is gaining its stride and we
anticipate an active spring market. With the continued excitement and desire to make New York City home, there
is still a shortage of inventory in the studio and one-bedroom markets. The new construction properties being
introduced to the market are anticipated to be larger-sized units with luxury price points above $4 million. We at
Sotheby’s International Realty are excited to have been appointed the exclusive sales and marketing agency for The
Woolworth Tower Residences, a collection of 33 condominium residences designed by Thierry W. Despont atop a
celebrated New York landmark.
At Sotheby’s International Realty, we ensure that every property marketed is shown in its best light and prepared for
an international debut. Let us put the power of the Sotheby’s International Realty brand to work for you. If you are
considering selling your property, we look forward to assisting you.
EAST SIDE MANHATTANEllie JohnsonBrokerage Managert: 212.606.7660 38 East 61st Street New York, New York 10065
DOWNTOWN MANHATTAN Diane LevineBrokerage Managert: 212.431.2440 149 Fifth Avenue, 4th Floor New York, New York 10010
WEST SIDE MANHATTAN Diane LevineBrokerage Managert: 212.579.9300 2244 BroadwayNew York, New York 10024
END NOTES
© MMXVI Sotheby’s International Realty, Inc. All Rights Reserved. All information in this report is provided by Vanderbilt Appraisal Company and other third party reports. Since all final closed data for the current quarter had not been reported at the time this report was compiled, the available closed data was extrapolated in an attempt to approximate full results for the current quarter. Actual results may materially vary from the approximated results. This offering is subject to errors, omissions, changes including price or withdrawal without notice. If your property is listed with a real estate broker, please disregard. It is not our intention to solicit the offerings of other real estate brokers. We are happy to work with them and cooperate fully. Sotheby’s International Realty and the Sotheby’s International Realty logo are registered (or unregistered) service marks used with permission. Operated by Sotheby’s International Realty, Inc. Real estate agents affiliated with Sotheby’s International Realty, Inc. are independent contractor sales associates and are not employees of Sotheby’s International Realty, Inc. Equal housing opportunity.
35 EAST 76TH STREET, SUITE 2906 | $6,000,000 | WEB: 00110734 Roberta Golubock, 212.606.7704
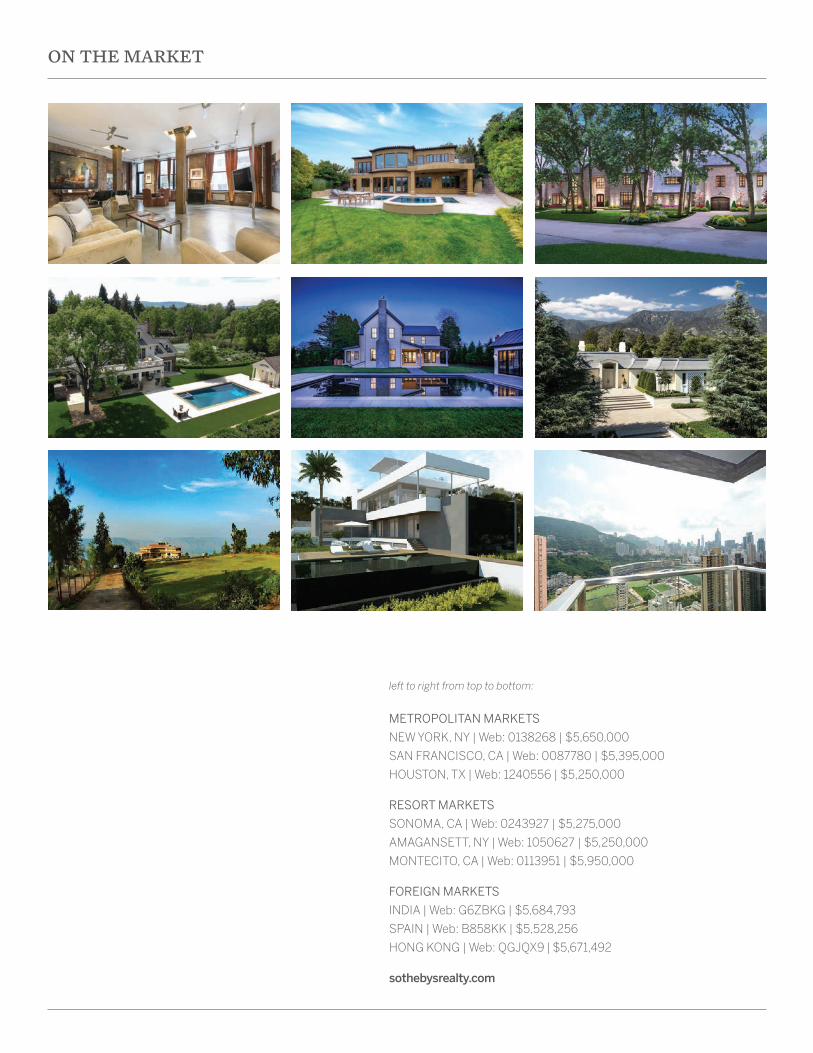
left to right from top to bottom:
METROPOLITAN MARKETS
NEW YORK, NY | Web: 0138268 | $5,650,000
SAN FRANCISCO, CA | Web: 0087780 | $5,395,000
HOUSTON, TX | Web: 1240556 | $5,250,000
RESORT MARKETS
SONOMA, CA | Web: 0243927 | $5,275,000
AMAGANSETT, NY | Web: 1050627 | $5,250,000
MONTECITO, CA | Web: 0113951 | $5,950,000
FOREIGN MARKETS
INDIA | Web: G6ZBKG | $5,684,793
SPAIN | Web: B858KK | $5,528,256
HONG KONG | Web: QGJQX9 | $5,671,492
sothebysrealty.com
ON THE MARKET

AUCTION CALENDAR MAY 2016
Orfèvrerie, Boîtes en Or et Objets de VitrineParis 3 May
MALCOLM Part One: New YorkNew York 7 May Impressionist & Modern Art Evening SaleNew York 9 May
Impressionist & Modern Art Day SaleNew York 10 May
Contemporary Art Evening AuctionNew York 11 May
Finest and Rarest WinesLondon 11 May
Contemporary Art Day AuctionNew York 12 May
Important Chinese ArtLondon 13 May
RM Sotheby’s: MonacoMonte Carlo 14 May
© 2016 Calder Foundation, New York / Artists Rights Society (ARS), New York
Property Formerly in the Collection of Alfred H. Barr, Jr.Alexander Calder
Untitled, circa 1942Estimate $2,500,000-3,500,000
We invite you to explore our real estate listings at sothebyshomes.com and view the worldwide auction schedule at sothebys.com Enquiries +1 212 606 7000. Sotheby’s 72 & York Register now at sothebys.com SOTHEBY’S, INC. LICENSE NO. 1216058. © SOTHEBY’S, INC. 2016