Manhattan Market Report Aug 15
28
mns.com Manhattan Rental Market Report August 2015
description
Real Estate Market
Transcript of Manhattan Market Report Aug 15

mns.com
Manhattan Rental Market ReportAugust 2015

page 2
Manhattan Rental Market Report August 2015
mns.comGramercy Park I Williamsburg
TABLE OF CONTENTS
12 Neighborhood Price Trends
27 The Report Explained
03 Introduction04 A Quick Look07 Mean Manhattan Rental Prices11 Manhattan Price Trends
12 Battery Park City13 Chelsea14 East Village15 Financial District16 Gramercy Park 17 Greenwich Village18 Harlem19 Lower East Side20 Midtown East21 Midtown West22 Murray Hill23 SoHo24 TriBeCa25 Upper East Side26 Upper West Side

page 3
Manhattan Rental Market Report August 2015
mns.com mns.comGramercy Park I Williamsburg
INTRODUCTIONAverage rent across Manhattan increased by 0.29% since last month, from $3,963 in July 2015 to $3,975 in August 2015.

page 4
Manhattan Rental Market Report August 2015
mns.comGramercy Park I Williamsburg
Average rent across Manhattan increased by 0.29% since last month, from $3,963 in July 2015 to $3,975 in August 2015. Listing inventory decreased by 2.91% from 8,663 rental units in July 2015 to 8,411 rental units in August 2015. The ratio on Non-Doorman units to Doorman units in all of Manhattan changed from 43.1% (NDM) and 56.9% (DM) to 42.4% (NDM) and 57.6% (DM). TriBeCa and Chelsea saw the largest shifts in inventory, with TriBeCa inventory falling by 19.8%, and Chelsea increasing by 7.4%.
The largest percentage price increases were seen in Studio Non Doorman units in Financial District, One Bedroom Non Doorman Units in Greenwich Village and Two Bedroom Non Doorman units in Soho, at 11.7%, 7.4% and 9.6% respectively. These fluctuations were largely attributed to relatively low sample sizes and lower priced rental units exiting the market.
The largest percentage decreases were seen in SoHo in Studio Doorman (-16.8%) and Non Doorman Units (-9.5%) and One Bedroom Doorman (-9.3%) and Non Doorman Units (-13.8%). It is important to note that Soho also had the lowest level of inventory in the sample at 179 units (after BPC which had 149 units). Neighborhoods with a low sample size tend to react more than those with higher sample sizes when lower/higher priced units enter/leave the market. The largest annual shifts were seen in Harlem and Midtown East. The average rent in Harlem grew by 20.0% from $2,356 in August 2014 to $2,828 in August 2015. This is largely the result of the movement toward new construction residential buildings in the area. Midtown East experienced a decline of 11.6%, from $3,954 in August 2014 to $3,497 in August 2015.
A QUICK LOOK

page 5
Manhattan Rental Market Report August 2015
mns.com mns.comGramercy Park I Williamsburg
A QUICK LOOKType Most Expensive Least Expensive
Non-Doorman Studios TriBeCa $3,948 Harlem $1,749
Non-Doorman One Bedrooms TriBeCa $5,082 Harlem $2,148
Non-Doorman Two Bedrooms TriBeCa $7,987 Harlem $2,660
Battery Park City Doorman One-Bedroom -2.3% Chelsea Non-Doorman Studios -0.1%Doorman Studios -2.1%Doorman One-Bedroom -1.5%Non-Doorman Two-Bedroom -1.1% East Village Doorman Studios -3.1%Non-Doorman Studios -0.4%Non-Doorman One-Bedroom -2.1%Doorman One-Bedroom -1.0%Doorman Two-Bedroom -0.2% Financial District Doorman Studios -0.4%Non-Doorman One-Bedroom -2.1% Gramercy Non-Doorman One-Bedroom -1.0%Doorman One-Bedroom -1.5%Non-Doorman Two-Bedroom -1.2% Greenwich Village Doorman One-Bedroom -0.7%Doorman Two-Bedroom -0.1%Non-Doorman Two-Bedroom -7.4%
Harlem Non-Doorman Two-Bedroom -1.2% Lower East Side Doorman Studios -6.1% Midtown East Doorman One-Bedroom -0.6%Non-Doorman One-Bedroom -3.6%Non-Doorman Two-Bedroom -4.2% Midtown West Non-Doorman One-Bedroom -1.3%Doorman One-Bedroom -0.2%Doorman Two-Bedroom -2.0% Murray Hill Non-Doorman Two-Bedroom -3.1%Doorman Two-Bedroom -1.1% SoHo Non-Doorman Studios -16.8%Doorman Studios -9.5%Non-Doorman One-Bedroom -9.3%Doorman One-Bedroom -13.8% Tribeca Doorman Studios -0.8%Non-Doorman One-Bedroom -2.9%Doorman One-Bedroom -5.0%
Upper East Side Doorman Studios -0.9%Non-Doorman Studios -1.4%
Where Prices Decreased (monthly)
Notable Trends: Manhattan Highs and Lows (Average Prices)
Type Most Expensive Least Expensive
Doorman Studios TriBeCa $4,132 Harlem $2,562
Doorman One Bedrooms SoHo $6,118 Harlem $3,193
Doorman Two Bedrooms SoHo $8,448 Harlem $4,655
page 6
Manhattan Rental Market Report August 2015
mns.comGramercy Park I Williamsburg
A QUICK LOOK
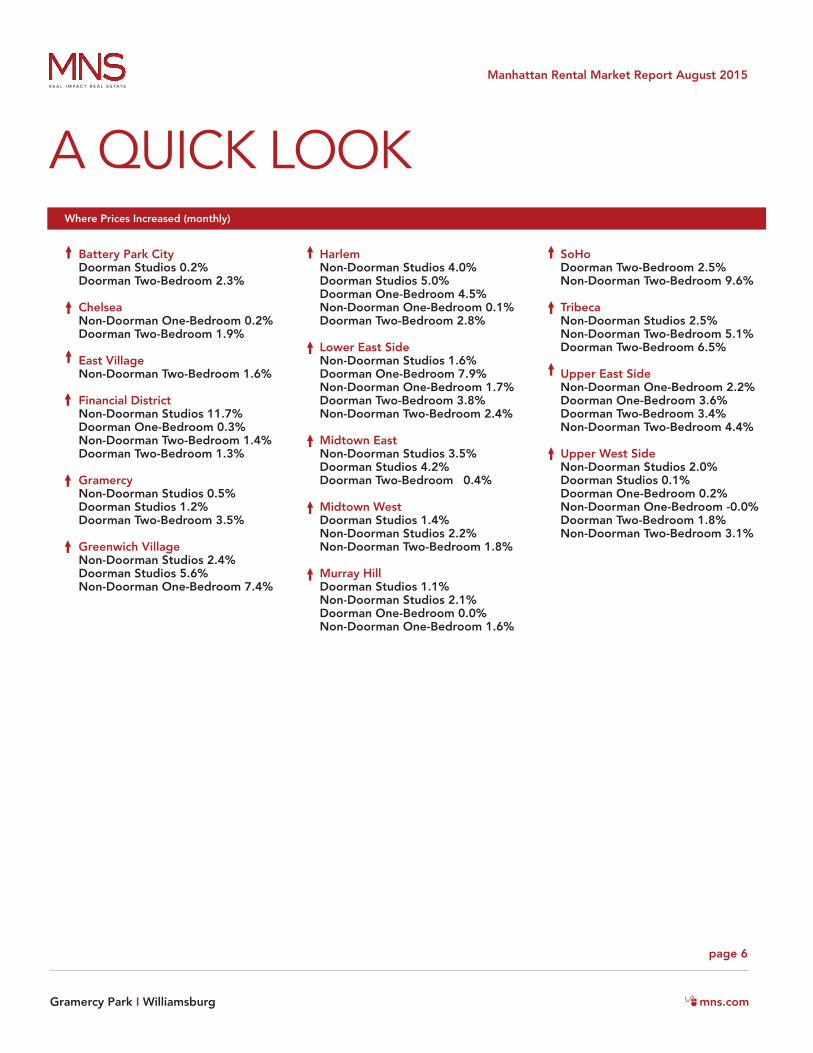
Battery Park City Doorman Studios 0.2%Doorman Two-Bedroom 2.3% Chelsea Non-Doorman One-Bedroom 0.2%Doorman Two-Bedroom 1.9% East Village Non-Doorman Two-Bedroom 1.6% Financial District Non-Doorman Studios 11.7%Doorman One-Bedroom 0.3%Non-Doorman Two-Bedroom 1.4%Doorman Two-Bedroom 1.3% Gramercy Non-Doorman Studios 0.5%Doorman Studios 1.2%Doorman Two-Bedroom 3.5% Greenwich Village Non-Doorman Studios 2.4%Doorman Studios 5.6%Non-Doorman One-Bedroom 7.4%
Harlem Non-Doorman Studios 4.0%Doorman Studios 5.0%Doorman One-Bedroom 4.5%Non-Doorman One-Bedroom 0.1%Doorman Two-Bedroom 2.8% Lower East Side Non-Doorman Studios 1.6%Doorman One-Bedroom 7.9%Non-Doorman One-Bedroom 1.7%Doorman Two-Bedroom 3.8%Non-Doorman Two-Bedroom 2.4% Midtown East Non-Doorman Studios 3.5%Doorman Studios 4.2%Doorman Two-Bedroom 0.4% Midtown West Doorman Studios 1.4%Non-Doorman Studios 2.2%Non-Doorman Two-Bedroom 1.8% Murray Hill Doorman Studios 1.1%Non-Doorman Studios 2.1%Doorman One-Bedroom 0.0%Non-Doorman One-Bedroom 1.6%
SoHo Doorman Two-Bedroom 2.5%Non-Doorman Two-Bedroom 9.6% Tribeca Non-Doorman Studios 2.5%Non-Doorman Two-Bedroom 5.1%Doorman Two-Bedroom 6.5% Upper East Side Non-Doorman One-Bedroom 2.2%Doorman One-Bedroom 3.6%Doorman Two-Bedroom 3.4%Non-Doorman Two-Bedroom 4.4% Upper West Side Non-Doorman Studios 2.0%Doorman Studios 0.1%Doorman One-Bedroom 0.2%Non-Doorman One-Bedroom -0.0%Doorman Two-Bedroom 1.8%Non-Doorman Two-Bedroom 3.1%
Where Prices Increased (monthly)
page 7
Manhattan Rental Market Report August 2015
mns.com mns.comGramercy Park I Williamsburg
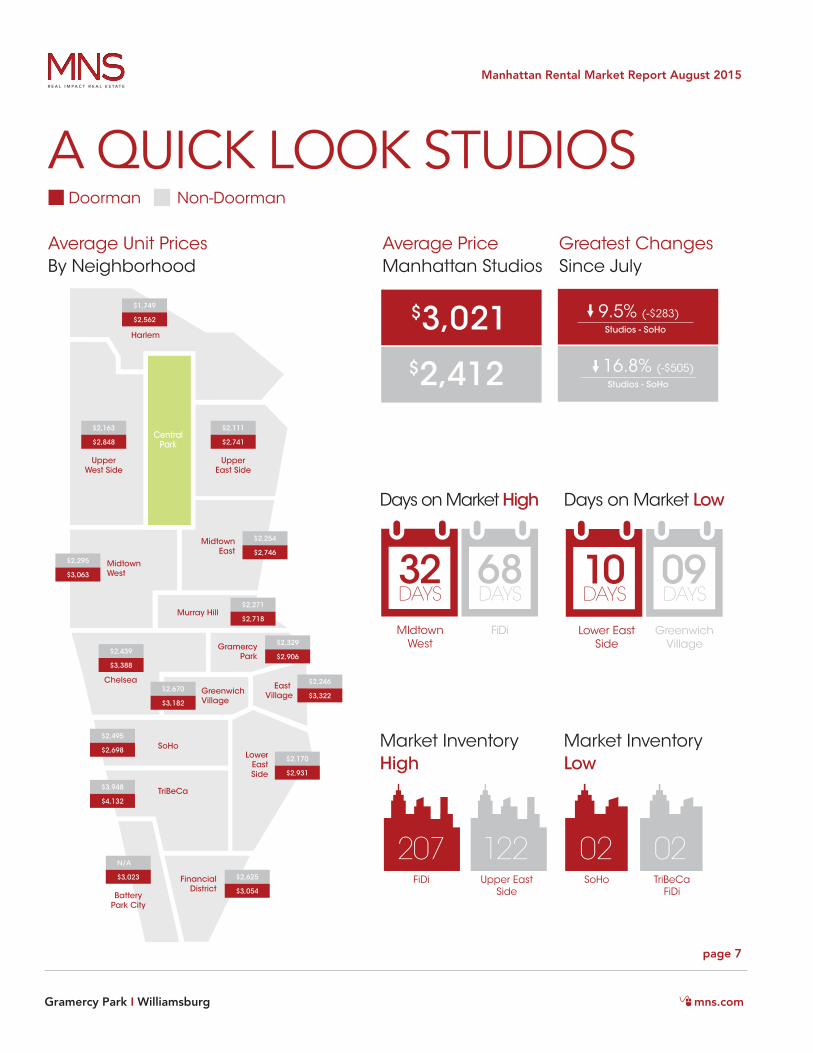
A QUICK LOOK STUDIOS
Harlem
UpperWest Side
UpperEast Side
MidtownWest
MidtownEast
Murray Hill
Chelsea
GramercyPark
GreenwichVillage
East Village
SoHoLower
EastSide
TriBeCa
BatteryPark City
FinancialDistrict
CentralPark
$1,749
$2,562
$2,163
$2,848
$2,295
$3,063
$2,439
$3,388
$2,495
$2,698
$3,948
$4,132
N/A
$3,023
$2,111
$2,741
$2,254
$2,746
$2,271
$2,718
$2,329
$2,906
$2,246
$3,322
$2,170
$2,931
$2,625
$3,054
$2,670
$3,182
Greatest ChangesSince July
MIdtown West
Lower East Side
FiDi GreenwichVillage
32 1068 09DAYS DAYSDAYS DAYS
Upper EastSide
TriBeCaFiDi
FiDi SoHo
Days on Market High Days on Market Low
Market Inventory Low
Market Inventory High
Doorman Non-Doorman
122 02207 02
Average Unit Prices By Neighborhood
Average PriceManhattan Studios
16.8% (-$505)Studios - SoHo
9.5% (-$283)Studios - SoHo
$3,021$2,412
page 8
Manhattan Rental Market Report August 2015
mns.comGramercy Park I Williamsburg
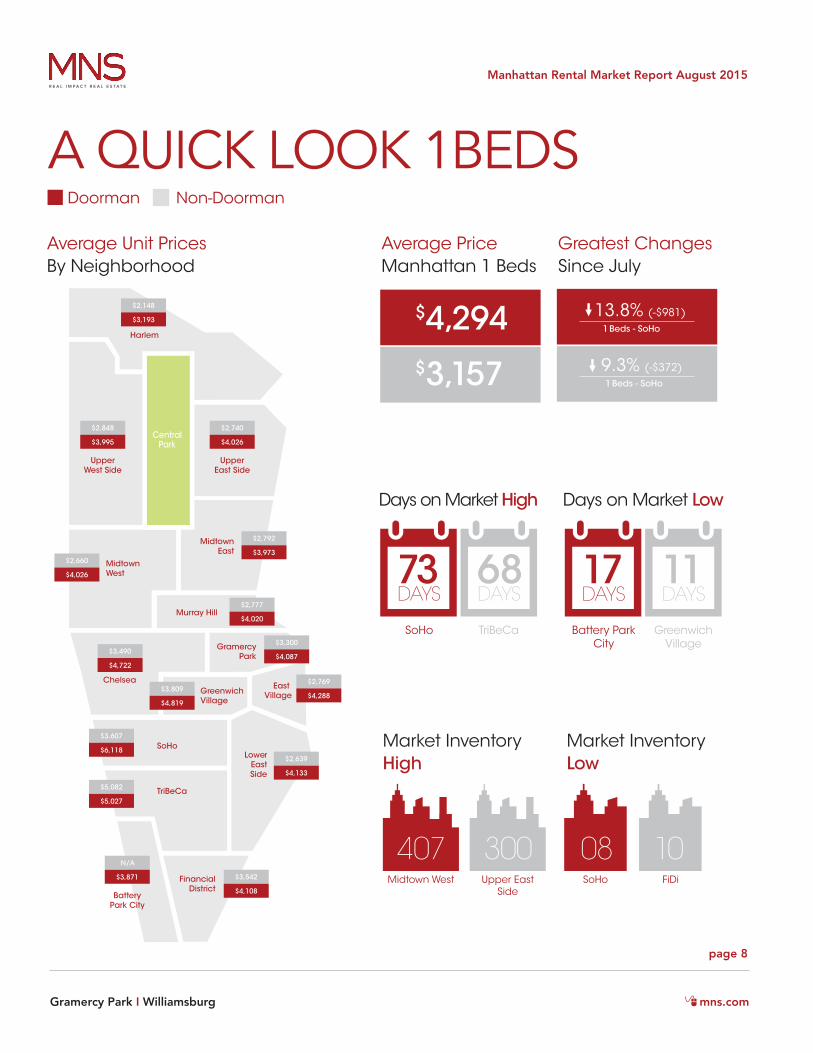
A QUICK LOOK 1BEDS
Harlem
UpperWest Side
UpperEast Side
MidtownWest
MidtownEast
Murray Hill
Chelsea
GramercyPark
GreenwichVillage
East Village
SoHoLower
EastSide
TriBeCa
BatteryPark City
FinancialDistrict
CentralPark
$2,148
$3,193
$2,848
$3,995
$2,660
$4,026
$3,490
$4,722
$3,607
$6,118
$5,082
$5,027
N/A
$3,871
$2,740
$4,026
$2,792
$3,973
$2,777
$4,020
$3,300
$4,087
$2,769
$4,288
$2,639
$4,133
$3,542
$4,108
$3,809
$4,819
Greatest ChangesSince July
SoHo Battery ParkCity
TriBeCa GreenwichVillage
73 1768 11DAYS DAYSDAYS DAYS
FiDiSoHo
Days on Market High Days on Market Low
Doorman Non-Doorman
300 10407 08
Average Unit Prices By Neighborhood
Average PriceManhattan 1 Beds
13.8% (-$981)1 Beds - SoHo
9.3% (-$372)1 Beds - SoHo
$4,294$3,157
Market Inventory Low
Market Inventory High
Upper EastSide
Midtown West

page 9
Manhattan Rental Market Report August 2015
mns.com mns.comGramercy Park I Williamsburg
A QUICK LOOK 2 BEDS
Harlem
UpperWest Side
UpperEast Side
MidtownWest
MidtownEast
Murray Hill
Chelsea
GramercyPark
GreenwichVillage
East Village
SoHoLower
EastSide
TriBeCa
BatteryPark City
FinancialDistrict
CentralPark
$2,660
$4,655
$3,838
$6,414
$3,649
$6,158
$4,906
$7,318
$5,359
$8,448
$7,987
$7,448
N/A
$6,797
$3,359
$6,226
$3,633
$5,586
$3,875
$5,411
$3,592
$6,999
$3,655
$6,731
$3,520
$6,014
$5,094
$5,775
$4,741
$6,482
Greatest ChangesSince July
71 1749 15DAYS DAYSDAYS DAYS
TriBeCaSoHo
Days on Market High Days on Market Low
Doorman Non-Doorman
230 12269 07
Average Unit Prices By Neighborhood
Average PriceManhattan 2 Beds
6.5% ($456)2 Beds - TriBeCa
9.6% ($471)2 Beds - SoHo
$6,431$4,276
Market Inventory Low
Market Inventory High
East VillageUpper WestSide
SoHo Battery ParkCity
TriBeCa GreenwichVillage
page 10
Manhattan Rental Market Report August 2015
mns.comGramercy Park I Williamsburg
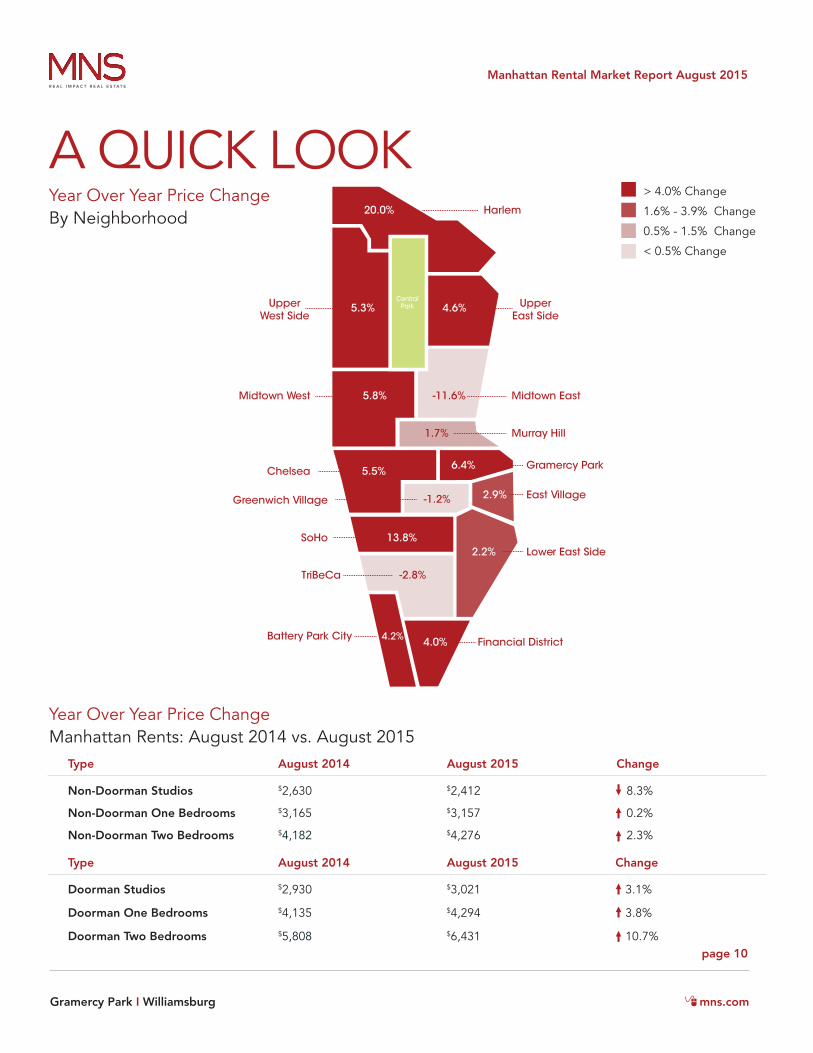
Type August 2014 August 2015 Change
Non-Doorman Studios $2,630 $2,412 8.3%
Non-Doorman One Bedrooms $3,165 $3,157 0.2%
Non-Doorman Two Bedrooms $4,182 $4,276 2.3%
Type August 2014 August 2015 Change
Doorman Studios $2,930 $3,021 3.1%
Doorman One Bedrooms $4,135 $4,294 3.8%
Doorman Two Bedrooms $5,808 $6,431 10.7%
A QUICK LOOK20.0%
UpperWest Side
4.6%
5.8% -11.6%
1.7%
5.5% 6.4%
-1.2% 2.9%
13.8%
4.0%
2.2%
-2.8%
Battery Park City Financial District
CentralPark
Harlem
UpperEast Side
5.3%
Midtown West Midtown East
Murray Hill
Chelsea Gramercy Park
Greenwich Village East Village
Lower East SideSoHo
TriBeCa
4.2%
Year Over Year Price Change By Neighborhood
Year Over Year Price Change Manhattan Rents: August 2014 vs. August 2015
> 4.0% Change
1.6% - 3.9% Change
0.5% - 1.5% Change
< 0.5% Change

page 11
Manhattan Rental Market Report August 2015
mns.com mns.comGramercy Park I Williamsburg
MANHATTAN PRICE TRENDSManhattan Studio Price Trends Over 13 Months
Manhattan One-Bedroom Price Trends Over 13 Months
Manhattan Two-Bedroom Price Trends Over 13 Months
Doorman
Doorman
Doorman
Non--Doorman
Non--Doorman
Non--Doorman
3,300
4,225
5,150
6,075
7,000
2,700
3,125
3,550
3,975
4,400
2,000
2,325
2,650
2,975
3,300
Aug Sep Oct Nov Dec Jan Feb Mar Apr May Jun July Aug2,930 2,932 2,946 2,937 2,970 3,005 3,041 3,203 3,167 3,074 3,048 3,034 3,0212,630 2,352 2,277 2,331 2,366 2,557 2,455 2,482 2,456 2,385 2,437 2,396 2,412
Aug Sep Oct Nov Dec Jan Feb Mar Apr May Jun July Aug4,135 4,151 4,043 3,978 4,045 4,088 4,103 4,183 4,233 4,259 4,353 4,359 4,2943,165 2,983 3,026 3,287 3,051 3,115 3,193 3,181 3,081 3,041 3,160 3,187 3,157
Aug Sep Oct Nov Dec Jan Feb Mar Apr May Jun July Aug5,808 5,748 5,900 5,827 6,033 6,210 5,978 6,074 6,184 6,293 6,375 6,315 6,4314,182 4,139 4,157 4,269 4,133 4,313 4,395 4,432 4,271 4,241 4,288 4,234 4,276

page 12
Manhattan Rental Market Report August 2015
mns.comGramercy Park I Williamsburg
BATTERY PARK CITY
Battery Park City Studio Price Trends Over 13 Months
Battery Park City One-Bedroom Price Trends Over 13 Months
Battery Park City Two-Bedroom Price Trends Over 13 Months
Doorman
Doorman
Doorman
Non--Doorman
Non--Doorman
• The monthly average rent remained stable, increasing by 0.5% since the previous month.• The annual average rent increased by 4.2% since August 2014.
Non--Doorman
4,000
5,000
6,000
7,000
8,000
2,000
2,800
3,600
4,400
2,000
2,300
2,600
2,900
3,200
Aug Sep Oct Nov Dec Jan Feb Mar Apr May Jun July Aug2,923 2,942 3,024 2,975 2,967 3,136 3,157 3,113 3,044 3,081 3,103 3,016 3,023
- - - - - - - - - - - - -
Aug Sep Oct Nov Dec Jan Feb Mar Apr May Jun July Aug3,637 3,713 3,618 3,628 3,810 3,709 3,838 3,835 3,889 4,013 3,868 3,960 3,871
- - - - - - - - - - - - -
Aug Sep Oct Nov Dec Jan Feb Mar Apr May Jun July Aug6,579 6,203 6,247 5,993 6,351 6,480 6,462 6,736 6,499 6,370 6,607 6,646 6,797
- - - - - - - - - - - - -

page 13
Manhattan Rental Market Report August 2015
mns.com mns.comGramercy Park I Williamsburg
CHELSEA
Chelsea Studio Price Trends Over 13 Months
Chelsea One-Bedroom Price Trends Over 13 Months
Chelsea Two-Bedroom Price Trends Over 13 Months
Doorman
Doorman
Doorman
Non--Doorman
Non--Doorman
• The monthly average rent moved -0.2% since the previous month, indicating stability in the market. • Annually, the average rent increased 5.5% since last year, showing consistent growth in the Chelsea market.
Non--Doorman
3,800
4,600
5,400
6,200
7,000
7,800
2,500
3,000
3,500
4,000
4,500
5,000
1,700
2,000
2,300
2,600
2,900
3,200
3,500
Aug Sep Oct Nov Dec Jan Feb Mar Apr May Jun July Aug3,163 3,175 3,198 3,074 3,138 3,188 3,208 3,367 3,222 3,251 3,387 3,460 3,3882,607 2,718 2,606 2,664 2,798 2,656 2,754 2,921 2,509 2,573 2,498 2,442 2,439
Aug Sep Oct Nov Dec Jan Feb Mar Apr May Jun July Aug4,425 4,493 4,549 4,209 4,318 4,360 4,390 4,629 4,646 4,710 4,830 4,795 4,7223,352 3,253 3,114 3,291 3,224 3,350 3,392 3,345 3,400 3,350 3,579 3,483 3,490
Aug Sep Oct Nov Dec Jan Feb Mar Apr May Jun July Aug6,614 6,556 6,534 6,379 6,382 6,708 6,710 7,059 7,231 7,314 7,103 7,184 7,3184,725 4,565 4,383 4,415 4,495 4,627 4,901 4,771 4,686 4,946 4,972 4,963 4,906

page 14
Manhattan Rental Market Report August 2015
mns.comGramercy Park I Williamsburg
EAST VILLAGE
East Village Studio Price Trends Over 13 Months
East Village One-Bedroom Price Trends Over 13 Months
East Village Two-Bedroom Price Trends Over 13 Months
Doorman
Doorman
Doorman
Non--Doorman
Non--Doorman
• The East Village market remained stable across all unit classes, moving -0.80% since July 2015 and 2.9% since August 2014.
Non--Doorman
2,700
3,500
4,300
5,100
5,900
6,700
7,500
2,000
2,600
3,200
3,800
4,400
5,000
1,500
2,000
2,500
3,000
3,500
4,000
Aug Sep Oct Nov Dec Jan Feb Mar Apr May Jun July Aug3,437 3,299 3,505 2,563 3,393 3,353 3,354 3,355 3,315 3,247 3,354 3,427 3,3222,146 2,197 2,251 2,380 2,279 2,380 2,212 2,354 2,217 2,197 2,173 2,255 2,246
Aug Sep Oct Nov Dec Jan Feb Mar Apr May Jun July Aug4,555 4,584 4,450 3,370 4,289 4,561 4,690 4,552 4,750 4,341 4,665 4,332 4,2882,808 2,718 2,733 2,917 2,740 2,678 2,673 2,650 2,679 2,767 2,776 2,830 2,769
Aug Sep Oct Nov Dec Jan Feb Mar Apr May Jun July Aug5,706 5,894 5,778 4,054 5,543 5,778 6,048 5,714 6,427 6,839 7,212 6,745 6,7313,703 3,662 3,789 3,956 3,603 3,527 3,590 3,727 3,584 3,595 3,732 3,598 3,655
page 15
Manhattan Rental Market Report August 2015
mns.com mns.comGramercy Park I Williamsburg
FINANCIAL DISTRICT
Financial District Studio Price Trends Over 13 Months
Financial District One-Bedroom Price Trends Over 13 Months
Financial District Two-Bedroom Price Trends Over 13 Months
Doorman
Doorman
Doorman
Non--Doorman
Non--Doorman
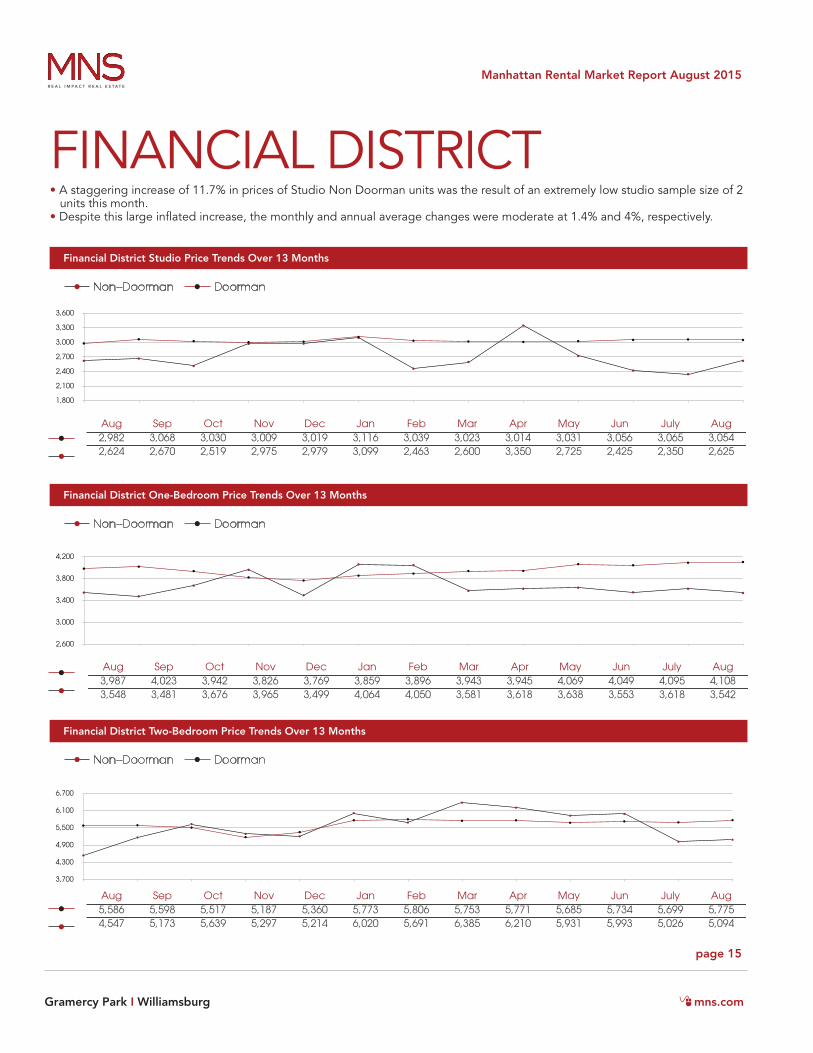
• A staggering increase of 11.7% in prices of Studio Non Doorman units was the result of an extremely low studio sample size of 2 units this month. • Despite this large inflated increase, the monthly and annual average changes were moderate at 1.4% and 4%, respectively.
Non--Doorman
3,700
4,300
4,900
5,500
6,100
6,700
2,600
3,000
3,400
3,800
4,200
1,800
2,100
2,400
2,700
3,000
3,300
3,600
Aug Sep Oct Nov Dec Jan Feb Mar Apr May Jun July Aug2,982 3,068 3,030 3,009 3,019 3,116 3,039 3,023 3,014 3,031 3,056 3,065 3,0542,624 2,670 2,519 2,975 2,979 3,099 2,463 2,600 3,350 2,725 2,425 2,350 2,625
Aug Sep Oct Nov Dec Jan Feb Mar Apr May Jun July Aug3,987 4,023 3,942 3,826 3,769 3,859 3,896 3,943 3,945 4,069 4,049 4,095 4,1083,548 3,481 3,676 3,965 3,499 4,064 4,050 3,581 3,618 3,638 3,553 3,618 3,542
Aug Sep Oct Nov Dec Jan Feb Mar Apr May Jun July Aug5,586 5,598 5,517 5,187 5,360 5,773 5,806 5,753 5,771 5,685 5,734 5,699 5,7754,547 5,173 5,639 5,297 5,214 6,020 5,691 6,385 6,210 5,931 5,993 5,026 5,094

page 16
Manhattan Rental Market Report August 2015
mns.comGramercy Park I Williamsburg
GRAMERCY PARK
Gramercy Park Studio Price Trends Over 13 Months
Gramercy Park One-Bedroom Price Trends Over 13 Months
Gramercy Park Two-Bedroom Price Trends Over 13 Months
Doorman
Doorman
Doorman
Non--Doorman
Non--Doorman
• Two Bedroom Doorman units experienced the largest increase amongst the other unit classes at 3.5%, contributed by lower priced Two Bedroom Doorman rental units leaving the market.• Overall, monthly and annual average changes increased by 0.6% and 6.4%, respectively.
Non--Doorman
3,500
4,500
5,500
6,500
7,500
2,500
3,100
3,700
4,300
4,900
1,900
2,200
2,500
2,800
3,100
3,400
Aug Sep Oct Nov Dec Jan Feb Mar Apr May Jun July Aug2,989 3,092 3,095 3,038 3,041 2,860 2,896 2,831 2,898 2,872 2,906 2,871 2,9062,426 2,392 2,369 2,406 2,370 2,372 2,462 2,480 2,341 2,379 2,407 2,317 2,329
Aug Sep Oct Nov Dec Jan Feb Mar Apr May Jun July Aug4,020 4,070 4,016 4,083 4,024 4,385 4,324 4,309 4,270 4,249 4,212 4,149 4,0873,016 2,911 2,853 3,100 2,964 2,897 2,921 2,983 2,753 2,748 3,249 3,332 3,300
Aug Sep Oct Nov Dec Jan Feb Mar Apr May Jun July Aug5,335 5,333 6,257 6,416 5,474 6,327 6,402 5,950 6,329 6,240 6,826 6,764 6,9994,030 3,932 3,942 4,291 3,901 4,293 4,830 4,877 3,783 3,862 3,888 3,637 3,592

page 17
Manhattan Rental Market Report August 2015
mns.com mns.comGramercy Park I Williamsburg
GREENWICH VILLAGE
Greenwich Village Studio Price Trends Over 13 Months
Greenwich Village One-Bedroom Price Trends Over 13 Months
Greenwich Village Two-Bedroom Price Trends Over 13 Months
Doorman
Doorman
Doorman
Non--Doorman
Non--Doorman
• Noticeable growth was seen in Studio and One Bedroom Doorman units, which increased by 5.6% and 7.4%, respectively.• With Two Bedroom Non Doorman units declining by 7.4% and One and Two Bedroom Doorman units moving under -1.0%, the monthly average rent balanced out with a 0.3% change since July 2015.
Non--Doorman
3,000
4,200
5,400
6,600
7,800
2,500
3,100
3,700
4,300
4,900
5,500
1,700
2,100
2,500
2,900
3,300
3,700
Aug Sep Oct Nov Dec Jan Feb Mar Apr May Jun Jun Aug2,980 2,996 3,053 2,907 2,844 2,924 3,031 2,979 3,006 3,114 3,288 3,013 3,1822,483 2,492 2,462 2,704 3,229 2,851 2,614 2,847 2,513 2,447 2,568 2,606 2,670
Aug Sep Oct Nov Dec Jan Feb Mar Apr May Jun July Aug4,976 5,018 4,901 4,720 4,682 4,609 4,599 4,332 4,814 4,724 4,877 4,854 4,8193,720 3,532 3,431 3,688 3,567 3,516 3,785 4,084 3,697 3,453 3,593 3,547 3,809
Aug Sep Oct Nov Dec Jan Feb Mar Apr May Jun July Aug6,894 6,816 6,179 5,970 6,152 7,196 5,868 5,716 6,887 6,993 6,717 6,488 6,4824,965 4,803 5,370 5,112 4,806 4,547 5,218 5,109 5,289 4,999 4,966 5,117 4,741

page 18
Manhattan Rental Market Report August 2015
mns.comGramercy Park I Williamsburg
HARLEM
Harlem Studio Price Trends Over 13 Months
Harlem One-Bedroom Price Trends Over 13 Months
Harlem Two-Bedroom Price Trends Over 13 Months
Doorman
Doorman
Doorman
Non--Doorman
Non--Doorman
• Harlem continues to be a market leader in growth, with an increase of 20% in prices since August 2014, driven by the surge of newly constructed residential buildings in the area.• On a monthly comparison, Studio Non Doorman, Studio Doorman and One Bedroom Doorman unit averages experienced increases of 4.0%, 5.0% and 4.5%, respectively.
Non--Doorman
1,800
2,300
2,800
3,300
3,800
4,300
4,800
5,300
1,400
1,900
2,400
2,900
3,400
3,900
1,200
1,400
1,600
1,800
2,000
2,200
2,400
2,600
2,800
Aug Sep Oct Nov Dec Jan Feb Mar Apr May Jun July Aug2,076 2,188 2,347 2,625 2,403 2,405 2,381 2,717 2,399 2,077 2,493 2,440 2,5621,665 1,588 1,713 1,764 1,720 1,707 1,659 1,729 1,803 1,672 1,677 1,681 1,749
Aug Sep Oct Nov Dec Jan Feb Mar Apr May Jun July Aug2,656 2,514 2,656 3,180 2,976 2,957 3,026 3,312 3,071 3,197 3,434 3,055 3,1931,895 1,900 1,947 2,074 2,092 2,067 2,181 2,282 2,102 2,114 2,157 2,145 2,148
Aug Sep Oct Nov Dec Jan Feb Mar Apr May Jun July Aug3,351 3,465 3,325 4,311 4,318 4,626 4,083 4,890 4,610 4,400 4,708 4,526 4,6552,494 2,461 2,550 2,727 2,612 2,584 2,609 2,619 2,629 2,619 2,688 2,693 2,660

page 19
Manhattan Rental Market Report August 2015
mns.com mns.comGramercy Park I Williamsburg
LOWER EAST SIDE
Lower East Side Studio Price Trends Over 13 Months
Lower East Side One-Bedroom Price Trends Over 13 Months
Lower East Side Two-Bedroom Price Trends Over 13 Months
Doorman
Doorman
Doorman
Non--Doorman
Non--Doorman
• With the exception Studio Doorman Units, which fell by 6.1%, all unit classes increased since July 2015.• Overall, monthly and annual average prices increased by 2.4% and 2.2%, respectively.
Non--Doorman
2,500
3,500
4,500
5,500
6,500
7,500
2,000
2,500
3,000
3,500
4,000
4,500
5,000
1,500
2,000
2,500
3,000
3,500
4,000
Aug Sep Oct Nov Dec Jan Feb Mar Apr May Jun July Aug3,554 3,643 3,527 3,676 3,245 2,993 3,108 3,060 3,115 3,050 3,215 3,120 2,9312,195 2,067 2,063 2,601 2,124 2,178 2,213 2,201 2,082 2,076 2,128 2,136 2,170
Aug Sep Oct Nov Dec Jan Feb Mar Apr May Jun July Aug4,270 4,348 4,389 3,636 3,861 3,913 3,756 3,624 3,644 3,918 4,048 3,830 4,1332,683 2,633 2,526 2,759 2,615 2,615 2,518 2,569 2,478 2,593 2,634 2,596 2,639
Aug Sep Oct Nov Dec Jan Feb Mar Apr May Jun July Aug4,638 4,569 4,920 4,899 5,649 6,549 4,770 5,195 5,633 5,756 6,129 5,792 6,0143,599 3,558 3,446 3,599 3,500 3,549 3,344 3,444 3,484 3,454 3,608 3,437 3,520

page 20
Manhattan Rental Market Report August 2015
mns.comGramercy Park I Williamsburg
MIDTOWN EAST
Midtown East Studio Price Trends Over 13 Months
Midtown East One-Bedroom Price Trends Over 13 Months
Midtown East Two-Bedroom Price Trends Over 13 Months
Doorman
Doorman
Doorman
Non--Doorman
Non--Doorman
• The monthly average fell slightly by 0.4% since last month, as the annual prices shifted an immense -11.6% since August 2014.
Non--Doorman
3,000
4,000
5,000
6,000
7,000
2,200
2,700
3,200
3,700
4,200
1,500
1,900
2,300
2,700
3,100
Aug Sep Oct Nov Dec Jan Feb Mar Apr May Jun July Aug2,880 2,544 2,546 2,764 2,759 2,839 2,644 2,778 2,721 2,755 2,672 2,636 2,7462,812 2,539 2,015 2,334 2,266 2,315 2,360 2,370 2,267 2,121 2,180 2,178 2,254
Aug Sep Oct Nov Dec Jan Feb Mar Apr May Jun July Aug3,815 3,796 3,793 3,477 3,741 3,782 3,769 3,730 3,754 3,859 3,945 3,999 3,9733,158 2,966 2,748 2,702 2,818 2,615 2,518 3,068 2,831 2,796 2,828 2,895 2,792
Aug Sep Oct Nov Dec Jan Feb Mar Apr May Jun July Aug6,106 5,921 5,829 5,382 5,492 5,526 5,595 5,543 5,410 5,717 5,620 5,566 5,5864,952 4,053 3,529 3,681 3,799 4,056 3,825 4,060 3,840 3,623 3,759 3,794 3,633

page 21
Manhattan Rental Market Report August 2015
mns.com mns.comGramercy Park I Williamsburg
MIDTOWN WEST
Midtown West Studio Price Trends Over 13 Months
Midtown West One-Bedroom Price Trends Over 13 Months
Midtown West Two-Bedroom Price Trends Over 13 Months
Doorman
Doorman
Doorman
Non--Doorman
Non--Doorman
• Monthly rents remained unchanged since July 2015, with an overall -0.1% movement• On an annual comparison, Midtown West saw growth at 5.8% since August 2014.
Non--Doorman
2,400
3,400
4,400
5,400
6,400
2,100
2,600
3,100
3,600
4,100
4,600
1,600
2,000
2,400
2,800
3,200
Aug Sep Oct Nov Dec Jan Feb Mar Apr May Jun July Aug2,916 2,891 2,881 2,928 2,982 2,908 2,877 2,903 2,914 2,933 3,021 3,021 3,0632,191 2,158 2,082 2,166 2,145 2,212 2,165 2,187 2,310 2,193 2,184 2,245 2,295
Aug Sep Oct Nov Dec Jan Feb Mar Apr May Jun July Aug3,877 3,896 3,885 3,890 3,887 3,915 3,940 4,001 4,029 4,062 4,002 4,033 4,0262,681 2,620 2,529 2,681 2,676 2,757 2,742 2,676 2,706 2,785 2,698 2,694 2,660
July Aug Sep Oct Nov Dec Jan Feb Mar Apr May Jun July5,977 5,690 5,778 5,891 6,032 5,813 5,982 5,951 5,918 5,915 5,868 5,926 6,2873,414 3,298 3,337 3,393 3,393 3,399 3,539 3,641 3,559 3,413 3,419 3,590 3,586
Aug Sep Oct Nov Dec Jan Feb Mar Apr May Jun July Aug5,690 5,778 5,891 6,032 5,813 5,982 5,951 5,918 5,915 5,868 5,926 6,287 6,1583,298 3,337 3,393 3,393 3,399 3,539 3,641 3,559 3,413 3,419 3,590 3,586 3,649

page 22
Manhattan Rental Market Report August 2015
mns.comGramercy Park I Williamsburg
MURRAY HILL
Murray Hill Studio Price Trends Over 13 Months
Murray Hill One-Bedroom Price Trends Over 13 Months
Murray Hill Two-Bedroom Price Trends Over 13 Months
Doorman
Doorman
Doorman
Non--Doorman
Non--Doorman
• Murray Hill saw stability since last month and last year, with a slight decrease of 0.3% since July 2015 and a 1.7% increase since August 2014.
Non--Doorman
2,700
3,500
4,300
5,100
5,900
6,700
2,200
2,600
3,000
3,400
3,800
4,200
1,800
2,200
2,600
3,000
3,400
Aug Sep Oct Nov Dec Jan Feb Mar Apr May Jun July Aug2,717 2,795 2,741 2,808 2,879 3,071 2,600 2,583 2,711 2,656 2,680 2,689 2,7182,455 2,352 2,190 2,383 2,334 2,272 2,324 2,262 2,444 2,349 2,228 2,224 2,271
Aug Sep Oct Nov Dec Jan Feb Mar Apr May Jun July Aug3,652 3,619 3,595 3,549 3,605 3,586 3,630 3,655 3,678 3,811 3,961 4,019 4,0202,853 2,911 2,796 2,783 2,813 3,004 2,965 2,987 2,866 2,750 2,743 2,732 2,777
Aug Sep Oct Nov Dec Jan Feb Mar Apr May Jun July Aug5,252 5,367 5,421 5,414 5,377 5,440 5,594 5,207 5,070 5,367 5,491 5,471 5,4113,791 4,002 3,453 4,100 3,511 4,090 4,014 4,448 4,006 4,006 4,132 3,999 3,875

page 23
Manhattan Rental Market Report August 2015
mns.com mns.comGramercy Park I Williamsburg
SOHO
SoHo Studio Price Trends Over 13 Months
SoHo One-Bedroom Price Trends Over 13 Months
SoHo Two-Bedroom Price Trends Over 13 Months
Doorman
Doorman
Doorman
Non--Doorman
Non--Doorman
• With a consistently low sample size, Soho remains very sensitive to price movements.• Studio Non Doorman, Studio Doorman, One Bedroom Non Doorman and One Bedroom Doorman average rents dropped by 16.8%, 9.5%, 9.3% and 13.8%, respectively, as lower priced rental units entered the market.• Compared to July 2015, prices saw a 4.8% decrease, while a 13.8% increase was seen since August 2014.
Non--Doorman
3,500
5,000
6,500
8,000
9,500
3,000
3,750
4,500
5,250
6,000
6,750
7,500
2,0002,5003,0003,5004,0004,5005,0005,5006,0006,500
Aug Sep Oct Nov Dec Jan Feb Mar Apr May Jun July Aug2,793 2,717 2,498 4,495 5,995 5,795 4,373 2,973 2,980 2,6982,662 2,535 2,532 2,674 3,243 3,880 3,315 3,559 2,791 2,757 3,157 3,000 2,495
Aug Sep Oct Nov Dec Jan Feb Mar Apr May Jun July Aug5,820 5,878 4,754 6,051 5,600 5,599 5,287 5,958 6,100 6,115 6,429 7,099 6,1183,431 3,623 3,734 4,294 3,624 3,679 3,784 3,810 3,673 3,654 3,807 3,979 3,607
Aug Sep Oct Nov Dec Jan Feb Mar Apr May Jun July Aug6,595 6,060 7,629 8,210 9,038 7,975 7,533 7,983 7,634 8,558 8,186 8,238 8,4483,941 4,234 4,293 5,143 4,879 4,600 5,136 5,072 5,137 5,021 4,995 4,888 5,359

page 24
Manhattan Rental Market Report August 2015
mns.comGramercy Park I Williamsburg
TRIBECA
TriBeCa Studio Price Trends Over 13 Months
TriBeCa One-Bedroom Price Trends Over 13 Months
TriBeCa Two-Bedroom Price Trends Over 13 Months
Doorman
Doorman
Doorman
Non--Doorman
Non--Doorman
• Increases since July 2015 were seen in Studio Non Doorman (2.5%), Two Bedroom Non Doorman (5.1%) and Two Bedroom Doorman (6.5%) Units.• Decreases were seen in Studio Doorman (-0.8%), One Bedroom Non Doorman (-2.9%), and One Bedroom Doorman (-5.0%)
Non--Doorman
5,000
5,850
6,700
7,550
8,400
3,700
4,200
4,700
5,200
5,700
6,200
6,700
2,700
3,700
4,700
5,700
6,700
7,700
8,700
Aug Sep Oct Nov Dec Jan Feb Mar Apr May Jun July Aug3,259 3,371 3,458 3,502 3,671 3,912 3,574 3,851 3,888 4,012 3,983 4,165 4,1326,450 3,050 3,088 3,700 3,840 3,700 3,700 2,900 3,486 3,595 4,200 3,850 3,948
Aug Sep Oct Nov Dec Jan Feb Mar Apr May Jun July Aug4,571 4,653 4,490 4,699 4,699 4,728 4,834 5,105 5,211 4,912 5,283 5,290 5,0275,920 4,081 5,024 6,477 4,898 5,039 5,807 5,050 5,004 4,480 5,235 5,233 5,082
Aug Sep Oct Nov Dec Jan Feb Mar Apr May Jun July Aug6,743 6,637 6,705 7,244 7,644 6,815 6,901 7,234 7,128 6,779 6,958 6,992 7,4487,666 7,174 7,473 7,020 7,154 7,792 7,713 6,778 6,929 7,042 6,831 7,599 7,987

page 25
Manhattan Rental Market Report August 2015
mns.com mns.comGramercy Park I Williamsburg
UPPER EAST SIDE
Upper East Side Studio Price Trends Over 13 Months
Upper East Side One-Bedroom Price Trends Over 13 Months
Upper East Side Two-Bedroom Price Trends Over 13 Months
Doorman
Doorman
Doorman
Non--Doorman
Non--Doorman
• This neighborhood experienced a consistent and strong growth in both monthly and annual average prices, with a 2.4% increase since July 2015 and a 4.6% increase since August 2014.
Non--Doorman
2,500
3,500
4,500
5,500
6,500
2,000
2,500
3,000
3,500
4,000
4,500
1,500
1,800
2,100
2,400
2,700
3,000
Aug Sep Oct Nov Dec Jan Feb Mar Apr May Jun July Aug2,611 2,625 2,538 2,596 2,583 2,705 2,559 2,684 2,674 2,795 2,751 2,765 2,7412,041 2,048 1,912 2,019 2,004 2,052 2,073 2,200 2,083 2,100 2,087 2,142 2,111
Aug Sep Oct Nov Dec Jan Feb Mar Apr May Jun July Aug3,888 3,794 3,801 3,632 3,696 3,661 3,800 3,916 3,836 3,934 3,768 3,886 4,0262,479 2,420 2,440 2,497 2,443 2,568 2,601 2,653 2,542 2,549 2,553 2,683 2,740
Aug Sep Oct Nov Dec Jan Feb Mar Apr May Jun July Aug6,072 6,001 5,996 5,947 5,978 5,949 5,798 5,842 6,082 6,175 6,254 6,019 6,2263,171 3,237 3,206 3,163 3,180 3,338 3,394 3,384 3,207 3,124 3,261 3,216 3,359

page 26
Manhattan Rental Market Report August 2015
mns.comGramercy Park I Williamsburg
UPPER WEST SIDE
Upper West Side Studio Price Trends Over 13 Months
Upper West Side One-Bedroom Price Trends Over 13 Months
Upper West Side Two-Bedroom Price Trends Over 13 Months
Doorman
Doorman
Doorman
Non--Doorman
Non--Doorman
• Another consistent performer, the Upper West Side saw an annual growth of 5.3% since August 2014.
Non--Doorman
2,500
3,700
4,900
6,100
7,300
2,200
2,600
3,000
3,400
3,800
4,200
1,600
1,900
2,200
2,500
2,800
3,100
Aug Sep Oct Nov Dec Jan Feb Mar Apr May Jun July Aug2,672 2,636 2,744 2,651 2,659 2,653 2,695 2,812 2,792 2,868 2,842 2,844 2,8482,058 2,118 2,083 2,195 2,161 2,126 2,063 2,145 2,188 2,208 2,202 2,122 2,163
Aug Sep Oct Nov Dec Jan Feb Mar Apr May Jun July Aug3,884 3,867 3,808 3,723 3,726 3,698 3,773 3,842 3,851 3,965 3,924 3,988 3,9952,761 2,713 2,818 2,788 2,743 2,765 2,769 2,796 2,784 2,894 2,835 2,849 2,848
Aug Sep Oct Nov Dec Jan Feb Mar Apr May Jun July Aug5,961 6,021 6,275 5,961 5,926 6,024 6,146 6,366 6,131 6,333 6,154 6,301 6,4143,663 3,756 3,729 3,863 3,816 3,818 3,620 3,819 3,601 3,739 3,621 3,723 3,838

page 27
Manhattan Rental Market Report August 2015
mns.com mns.comGramercy Park I Williamsburg
THE REPORT EXPLAINED
Author: MNS has been helping Manhattan & Brooklyn landlords and renters navigate the rental market since 1999. From large companies to individuals, MNS tailors services to meet your needs. Contact us today to see how we can help.
Contact Us Now: 212.475.9000
Note: All market data is collected and compiled by MNS’s marketing department. The information presented here is intended for instructive purposes only and has been gathered from sources deemed reliable, though it may be subject to errors, omissions, changes or withdrawal without notice.
If you would like to republish this report on the web, please be sure to source it as the “Manhattan Rental Market Report” with a link back to its original location
http://www.mns.com/manhattan_rental_market_report
The Manhattan Rental Market Report™ compares fluctuation in the city’s rental data on a monthly basis. It is an essential tool for potential renters seeking transparency in the NYC apartment market and a benchmark for landlords to efficiently and fairly adjust individual property rents in Manhattan.
The Manhattan Rental Market Report™ is based on data cross-sectioned from over 10,000 currently available listings located below 125th Street and priced under $10,000, with ultra-luxury property omitted to obtain a true monthly rental average. Our data is aggregated from the MNS proprietary database and sampled from a specific mid-month point to record current rental rates offered by landlords during that particular month. It is then combined with information from the REBNY Real Estate Listings Source (RLS), OnLine Residential (OLR. com) and R.O.L.E.X. (Real Plus).

mns.comGramercy Park I Williamsburg