
December 2015 Manhattan Beach Real Estate Market Trends Update
Upload
mother-son-south-bay-real-estate-agentsCategory
view
3download
0description

Table of
Contents
Key Statistics for August
Sales 2015 Residential Sales Stats Year-to-Year Total Sales by Map Area Median 2015 Median Sales Stats Year-to-Year Median Sales by Map Area Listings 2015 Active Listings by Map Area 2015 Total Active Listings vs. Total Sales Year-to-Year Active Listings by Map Area Inventory 2015 Months of Inventory by Map Area Year-to-Year Months of Inventory
Recap & Outlook for September
About Hady Chahine Contact Information

Key Statistics for August
Back to Table of Contents
= trending positive = trending positive
= trending negative = trending negative
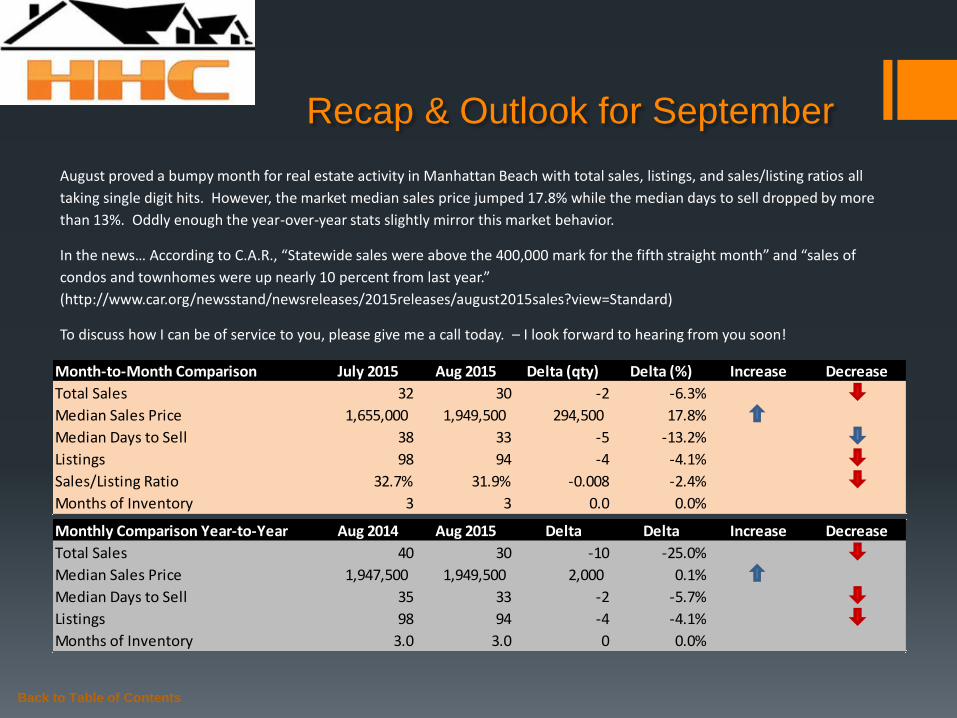
Month-to-Month Comparison July 2015 Aug 2015 Delta (qty) Delta (%) Increase Decrease
Total Sales 32 30 -2 -6.3%
Median Sales Price 1,655,000 1,949,500 294,500 17.8%
Median Days to Sell 38 33 -5 -13.2%
Listings 98 94 -4 -4.1%
Sales/Listing Ratio 32.7% 31.9% -0.008 -2.4%
Months of Inventory 3 3 0.0 0.0%
Monthly Comparison Year-to-Year Aug 2014 Aug 2015 Delta Delta Increase Decrease
Total Sales 40 30 -10 -25.0%
Median Sales Price 1,947,500 1,949,500 2,000 0.1%
Median Days to Sell 35 33 -2 -5.7%
Listings 98 94 -4 -4.1%
Months of Inventory 3.0 3.0 0 0.0%
Back to Table of Contents
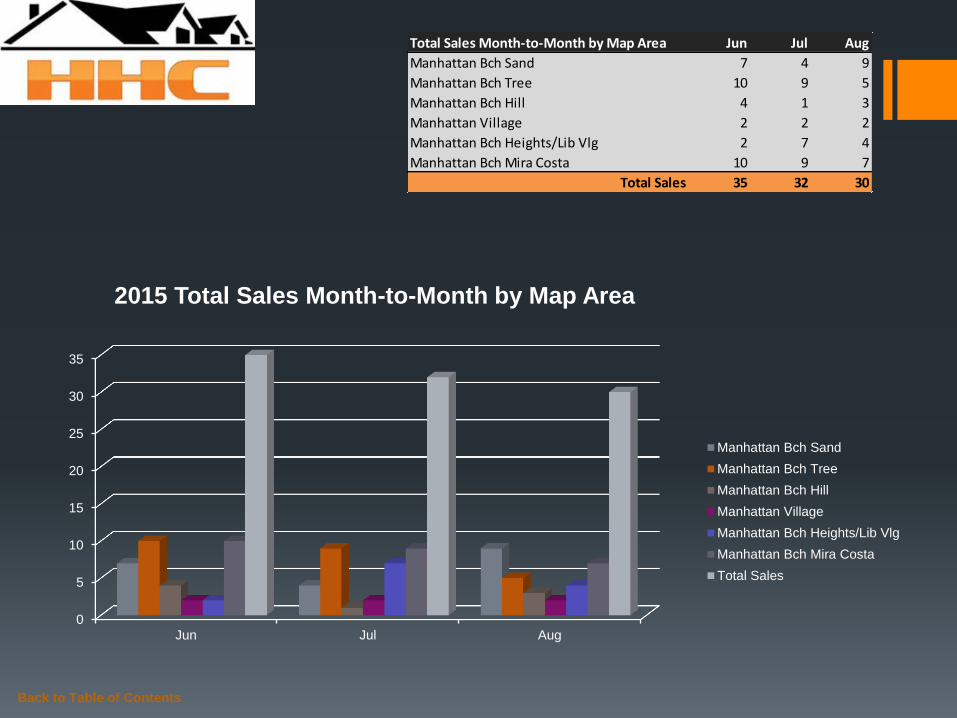
Total Sales Month-to-Month by Map Area Jun Jul Aug
Manhattan Bch Sand 7 4 9
Manhattan Bch Tree 10 9 5
Manhattan Bch Hill 4 1 3
Manhattan Village 2 2 2
Manhattan Bch Heights/Lib Vlg 2 7 4
Manhattan Bch Mira Costa 10 9 7
Total Sales 35 32 30
0
5
10
15
20
25
30
35
Jun Jul Aug
2015 Total Sales Month-to-Month by Map Area
Manhattan Bch Sand
Manhattan Bch Tree
Manhattan Bch Hill
Manhattan Village
Manhattan Bch Heights/Lib Vlg
Manhattan Bch Mira Costa
Total Sales

Back to Table of Contents
Total Sales Year-to-Year by Map Area 2013 2014 2015
Manhattan Bch Sand 7 13 9
Manhattan Bch Tree 16 10 5
Manhattan Bch Hill 5 2 3
Manhattan Village 1 4 2
Manhattan Bch Heights/Lib Vlg 4 4 4
Manhattan Bch Mira Costa 7 7 7
Total Sales 40 40 30
0
5
10
15
20
25
30
35
40
2013 2014 2015
Total Sales Year-to-Year by Map Area: August
Manhattan Bch Sand
Manhattan Bch Tree
Manhattan Bch Hill
Manhattan Village
Manhattan Bch Heights/Lib Vlg
Manhattan Bch Mira Costa
Total Sales

Back to Table of Contents
Median Sales Price Month-to-Month by Map Area Jun Jul Aug
Manhattan Bch Sand 3,075,000 7,156,250 3,850,000
Manhattan Bch Tree 2,195,000 2,075,000 2,525,000
Manhattan Bch Hill 2,875,000 9,400,000 1,922,500
Manhattan Village 1,412,000 1,386,500 1,334,500
Manhattan Bch Heights/Lib Vlg 1,477,500 1,400,000 1,200,000
Manhattan Bch Mira Costa 2,500,000 1,229,000 1,575,000
Market Median Sales Price 2,400,000 1,655,000 1,949,500
-
1,000,000
2,000,000
3,000,000
4,000,000
5,000,000
6,000,000
7,000,000
8,000,000
9,000,000
10,000,000
Jun Jul Aug
2015 Median Sales Price Month-to-Month by Map Area
Manhattan Bch Sand
Manhattan Bch Tree
Manhattan Bch Hill
Manhattan Village
Manhattan Bch Heights/Lib Vlg
Manhattan Bch Mira Costa
Market Median Sales Price
Back to Table of Contents
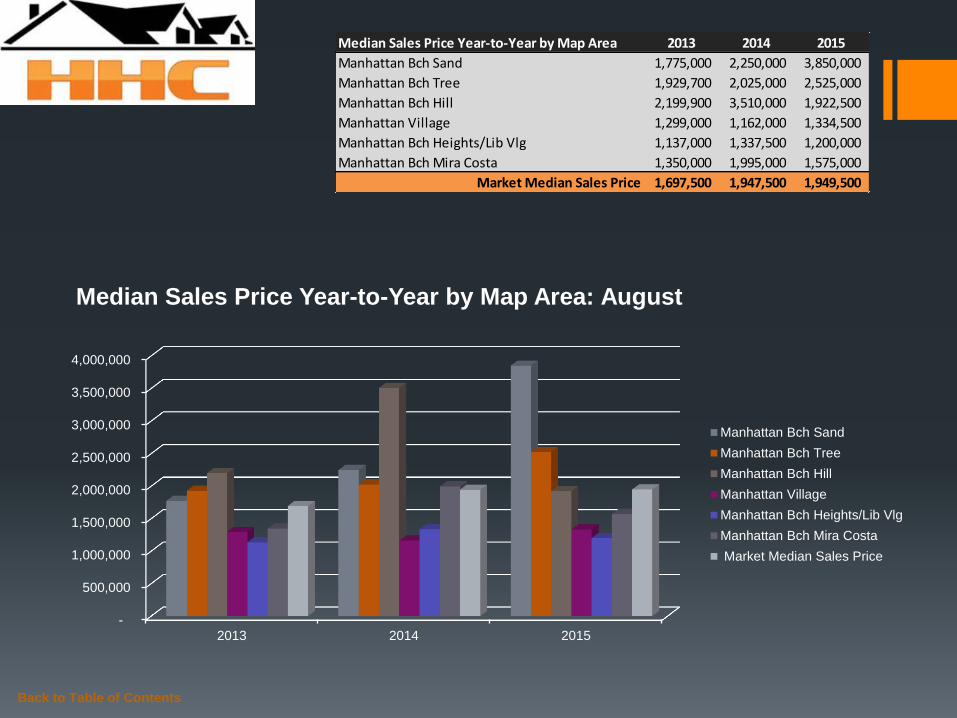
Median Sales Price Year-to-Year by Map Area 2013 2014 2015
Manhattan Bch Sand 1,775,000 2,250,000 3,850,000
Manhattan Bch Tree 1,929,700 2,025,000 2,525,000
Manhattan Bch Hill 2,199,900 3,510,000 1,922,500
Manhattan Village 1,299,000 1,162,000 1,334,500
Manhattan Bch Heights/Lib Vlg 1,137,000 1,337,500 1,200,000
Manhattan Bch Mira Costa 1,350,000 1,995,000 1,575,000
Market Median Sales Price 1,697,500 1,947,500 1,949,500
-
500,000
1,000,000
1,500,000
2,000,000
2,500,000
3,000,000
3,500,000
4,000,000
2013 2014 2015
Median Sales Price Year-to-Year by Map Area: August
Manhattan Bch Sand
Manhattan Bch Tree
Manhattan Bch Hill
Manhattan Village
Manhattan Bch Heights/Lib Vlg
Manhattan Bch Mira Costa
Market Median Sales Price

Back to Table of Contents
Active Listings vs. Total Sales by Map Area Jan Feb Mar Apr May Jun Jul Aug Sep Oct Nov Dec
Manhattan Bch Sand 14 19 28 23 26 24 34 32
Manhattan Bch Tree 16 14 20 20 22 20 19 20
Manhattan Bch Hill 2 3 5 6 10 11 14 11
Manhattan Village 6 5 4 3 3 4 2 1
Manhattan Bch Heights/Lib Vlg 4 5 6 8 6 10 9 8
Manhattan Bch Mira Costa 13 11 14 10 15 21 20 22
Total Active Listings 55 57 77 70 82 90 98 94
-
5
10
15
20
25
30
35
Jan Feb Mar Apr May Jun Jul Aug Sep Oct Nov Dec
2015 Active Listings by Map Area
Manhattan Bch Sand
Manhattan Bch Tree
Manhattan Bch Hill
Manhattan Village
Manhattan Bch Heights/Lib Vlg
Manhattan Bch Mira Costa

Back to Table of Contents
Active Listings vs. Total Sales by Map Area Jan Feb Mar Apr May Jun Jul Aug Sep Oct Nov Dec
Manhattan Bch Sand 14 19 28 23 26 24 34 32
Manhattan Bch Tree 16 14 20 20 22 20 19 20
Manhattan Bch Hill 2 3 5 6 10 11 14 11
Manhattan Village 6 5 4 3 3 4 2 1
Manhattan Bch Heights/Lib Vlg 4 5 6 8 6 10 9 8
Manhattan Bch Mira Costa 13 11 14 10 15 21 20 22
Total Active Listings 55 57 77 70 82 90 98 94
Total Sales 21 19 34 31 36 35 32 30
Sales/Listings Ratio 38.2% 33.3% 44.2% 44.3% 43.9% 38.9% 32.7% 31.9%
-
10
20
30
40
50
60
70
80
90
100
Jan Feb Mar Apr May Jun Jul Aug Sep Oct Nov Dec
2015 Total Active Listings vs. Total Sales
Total Active Listings
Total Sales
Back to Table of Contents
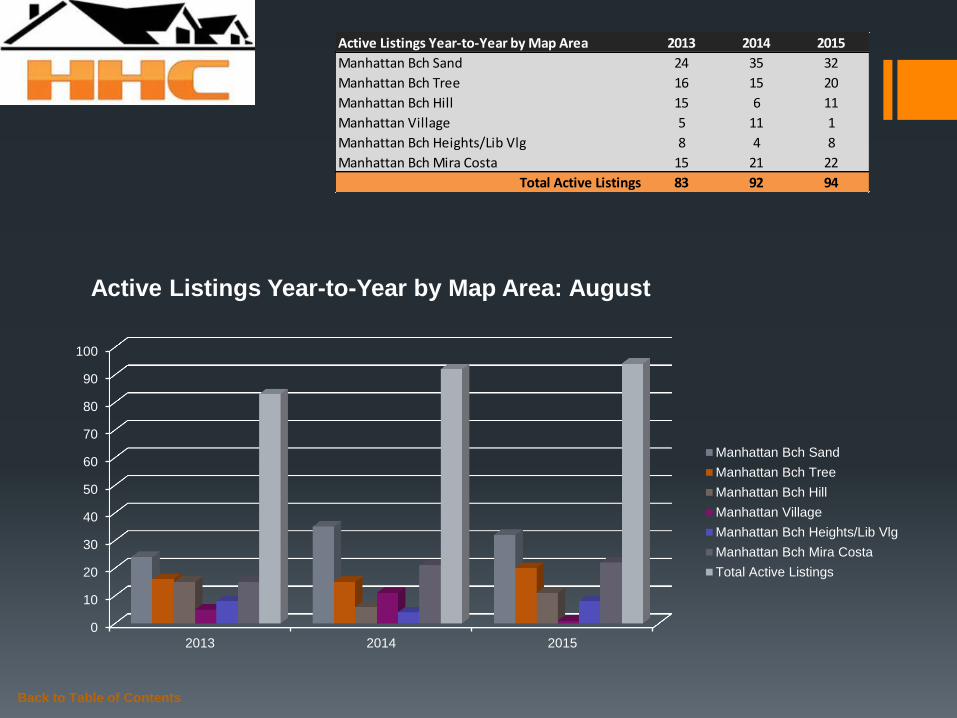
Active Listings Year-to-Year by Map Area 2013 2014 2015
Manhattan Bch Sand 24 35 32
Manhattan Bch Tree 16 15 20
Manhattan Bch Hill 15 6 11
Manhattan Village 5 11 1
Manhattan Bch Heights/Lib Vlg 8 4 8
Manhattan Bch Mira Costa 15 21 22
Total Active Listings 83 92 94
0
10
20
30
40
50
60
70
80
90
100
2013 2014 2015
Active Listings Year-to-Year by Map Area: August
Manhattan Bch Sand
Manhattan Bch Tree
Manhattan Bch Hill
Manhattan Village
Manhattan Bch Heights/Lib Vlg
Manhattan Bch Mira Costa
Total Active Listings

Back to Table of Contents
Months of Inventory by Map Area Jan Feb Mar Apr May Jun Jul Aug Sep Oct Nov Dec
Manhattan Bch Sand 2.3 6.3 2.3 2.6 2.4 3.0 9.0 4.0
Manhattan Bch Tree 16.0 2.3 3.3 2.0 1.4 2.0 2.0 4.0
Manhattan Bch Hill 0.7 1.5 5.0 6.0 - 3.0 14.0 4.0
Manhattan Village 2.0 2.5 1.0 1.5 3.0 2.0 1.0 1.0
Manhattan Bch Heights/Lib Vlg 2.0 1.7 1.5 2.7 1.5 5.0 1.0 2.0
Manhattan Bch Mira Costa 2.2 3.7 2.0 1.7 3.8 2.0 2.0 3.0
-
2.0
4.0
6.0
8.0
10.0
12.0
14.0
16.0
Jan Feb Mar Apr May Jun Jul Aug Sep Oct Nov Dec
2015 Months of Inventory by Map Area
Manhattan Bch Sand
Manhattan Bch Tree
Manhattan Bch Hill
Manhattan Village
Manhattan Bch Heights/Lib Vlg
Manhattan Bch Mira Costa

Back to Table of Contents
Months of Inventory Year-to-Year Jan Feb Mar Apr May Jun Jul Aug Sep Oct Nov Dec
2013 2.9 3.4 2.0 1.7 1.8 2.5 2.1 2.0 2.2 2.0 1.5 0.8
2014 3.0 2.2 2.2 2.0 2.0 2.0 2.2 2.0 2.8 1.9 1.5 1.1
2015 2.6 3.0 2.3 2.3 2.3 3.0 3.0 3.0
-
0.5
1.0
1.5
2.0
2.5
3.0
3.5
Jan Feb Mar Apr May Jun Jul Aug Sep Oct Nov Dec
Months of Inventory Year-to-Year
2013
2014
2015
Recap & Outlook for September
August proved a bumpy month for real estate activity in Manhattan Beach with total sales, listings, and sales/listing ratios all
taking single digit hits. However, the market median sales price jumped 17.8% while the median days to sell dropped by more
than 13%. Oddly enough the year-over-year stats slightly mirror this market behavior.
In the news… According to C.A.R., “Statewide sales were above the 400,000 mark for the fifth straight month” and “sales of
condos and townhomes were up nearly 10 percent from last year.”
(http://www.car.org/newsstand/newsreleases/2015releases/august2015sales?view=Standard)
To discuss how I can be of service to you, please give me a call today. – I look forward to hearing from you soon!
Back to Table of Contents
Month-to-Month Comparison July 2015 Aug 2015 Delta (qty) Delta (%) Increase Decrease
Total Sales 32 30 -2 -6.3%
Median Sales Price 1,655,000 1,949,500 294,500 17.8%
Median Days to Sell 38 33 -5 -13.2%
Listings 98 94 -4 -4.1%
Sales/Listing Ratio 32.7% 31.9% -0.008 -2.4%
Months of Inventory 3 3 0.0 0.0%
Monthly Comparison Year-to-Year Aug 2014 Aug 2015 Delta Delta Increase Decrease
Total Sales 40 30 -10 -25.0%
Median Sales Price 1,947,500 1,949,500 2,000 0.1%
Median Days to Sell 35 33 -2 -5.7%
Listings 98 94 -4 -4.1%
Months of Inventory 3.0 3.0 0 0.0%
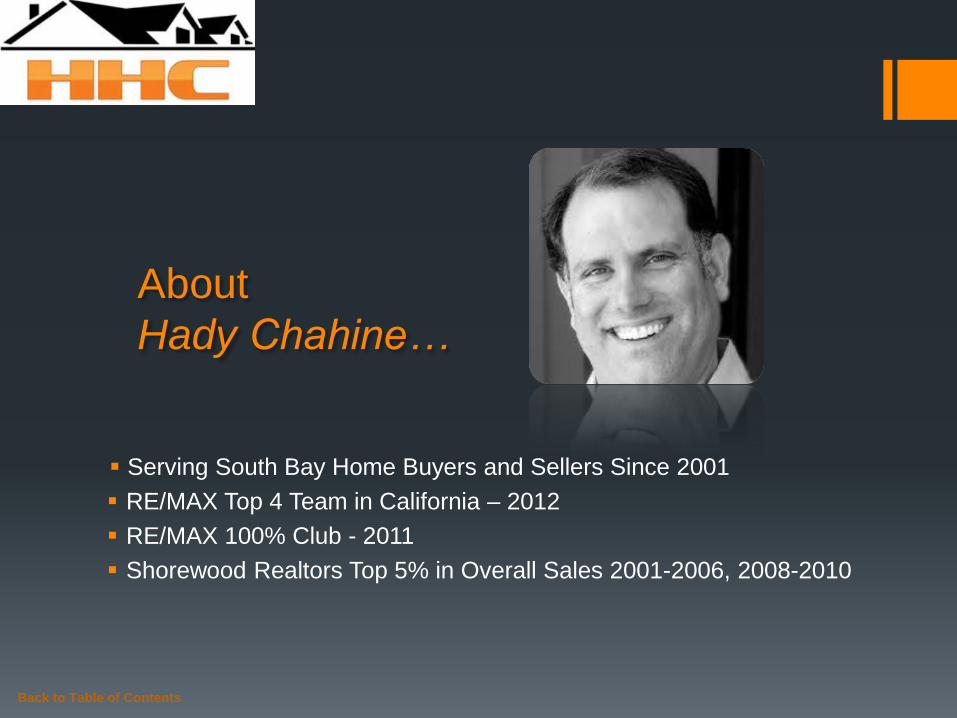
Serving South Bay Home Buyers and Sellers Since 2001
RE/MAX Top 4 Team in California – 2012
RE/MAX 100% Club - 2011
Shorewood Realtors Top 5% in Overall Sales 2001-2006, 2008-2010
Back to Table of Contents
About
Hady Chahine…

The information being provided by CARETS (CLAW, CRISNet MLS, DAMLS, CRMLS, i-Tech MLS, and/or VCRDS) is for the visitor’s personal, non-commercial use and may not be used for
any purpose other than to identify prospective properties visitor may be interested in purchasing. Any information relating to a property referenced on this web site comes from the Internet
Data Exchange (IDX) program of CARETS. This web site may reference real estate listing(s) held by a brokerage firm other than the broker and/or agent who owns this web site. The accuracy
of all information, regardless of source, including but not limited to square footages and lot sizes, is deemed reliable but not guaranteed and should be personally verified through personal
inspection by and/or with the appropriate professionals.
Back to Table of Contents
Listings MLS BLOG Website