Managing Your Service Department for Profit
15
Managing Your Service Department for Profit An NADA White Paper
Transcript of Managing Your Service Department for Profit

Managing Your Service Department for Profit An NADA White Paper

TABLE OF CONTENTSTHE SERVICE MANAGER’S JOB ……………………………… 1
Service Manager Position Summary …………………1
PROFIT ………………………………………………………… 2
Retaining Gross Profits …………………………………2
The Service and Parts Relationship and Profitability …3
Profit Centering …………………………………………4
Fixed Absorption ………………………………………6
Service Pricing Techniques ……………………………6
Repair Order Analysis …………………………………9
NADA Actual Service Analysis …………………………10
Facility Utilization ………………………………………10
The National Automobile Dealers Association (NADA) has prepared this white paper to assist its dealer members in being as efficient as possible in the operation of their dealerships. The presentation of this information is not intended to encourage concerted action among competitors or any other action on the part of dealers that would in any manner fix or stabilize the price or any element of the price of any good or service.
Managing Your Service Department for Profit An NADA White Paper

M a n a g i n g Y o u r S e r v i c e D e p a r t m e n t f o r P r o f i t A n N A D A W h i t e P a p e r 1
THE SERVICE MANAGER’S JOB
The dealership service manager has a big job. NADA Job Descriptions, available through HR Dealership Fundamentals at nada.org, provides an all-inclusive job description, intended to be modified according to each dealership’s needs. For our purposes, we’ve divided job responsibilities into three categories; some duties may well fit into more than one category. We’ve included customer contact responsibilities that may not involve direct contact; the customer’s primary link to the service department is the service advisor, whose activities are supervised by the service manager.
Service Manager Position SummaryRuns an efficient and profitable service department through productive staffing, customer retention, cost controls, achievement of objectives and maintenance of service records. Ensures that the daily inventory of technicians’ time is consistently sold to service customers.
Duties and responsibilities may include the following:
Profit-related• Forecasts goals and objectives for the
department and strives to meet them.• Prepares and administers an annual
operating budget for the service department.• Ensures that all customers are given fair
estimates on costs and time required for repairs and maintenance.
• Develops and implements a marketing plan that promotes new and repeat business.
• Maintains reporting systems required by general management and the factory.
• Monitors and controls the performance of the department using appropriate reports, tracking systems and surveys.
• Understands and ensures compliance with manufacturer warranty and policy procedures.
• Monitors warranty repair orders for sales and hours relative to expectations.
• Prepares pricing guides and maintenance menus for frequent labor operations.
• Attends managers meetings.
Productivity-related• Directs and schedules the activities of all
department employees.• Maintains high-quality service repairs and
minimizes comebacks.• Conducts periodic spot checks of completed
jobs for thoroughness and quality.• Understands, keeps abreast of and complies
with federal, state and local regulations that affect service operations, such as hazardous waste disposal, OSHA, Right-to-Know, etc.
• Ensures that customers’ service files are up-to-date and readily available for reference.
• Monitors technicians’ daily productivity reports and corresponding payroll records.
• Facilitates and/or conducts technical training and sends employees to appropriate training schools as needed.
• Monitors and follows up on parts orders with the parts manager to ensure availability.
• Ensures the proper care, storage and inventory of special tools.

M a n a g i n g Y o u r S e r v i c e D e p a r t m e n t f o r P r o f i t A n N A D A W h i t e P a p e r 2
• Keeps abreast of new equipment and tools available and recommends purchases.
• Informs repair technicians of time allowances on each repair order.
• Accounts for all documents; ensures that none are missing and all are processed correctly.
• Maintains a safe working environment.
People-related• Hires, trains, motivates, counsels and
monitors the performance of all service department staff.
• Strives for harmony and teamwork within the department and with all other departments.
• Handles customer complaints immediately and according to dealership guidelines.
• Serves as liaison with factory representatives.• Establishes and maintains good working
relationships with vocational and technical schools to enhance personnel recruitment activities.
• Establishes and maintains 24-hour follow-up with all customers to confirm satisfaction with the service experience.
• Establishes and maintains good working relationships with customers to encourage repeat and referral business.
• Holds weekly department meetings.• Ensures that the work areas and customer
waiting areas are kept clean.• Maintains a professional appearance.
From a management perspective, then, all of the service manager’s functions center on controlling and optimizing profit, productivity and the utilization of personnel while maintaining the highest possible degree of customer satisfaction.
Your mission as department manager is growth—in all three categories:
• Profit• Productivity• People
Let’s examine the “three P’s,” starting with profit. (This white paper was excerpted from NADA’s A
Dealer Guide to the Three Ps of Effective Service Management: Profit, Productivity, Personnel. The full publication is free to members at nada.org.)
PROFIT
As service manager, your first objective is to earn a high net profit. The net allows you to provide the best training, equipment, facility and benefits for your employees, plus all the perks that aid customer retention. To earn your best net, you have to know the gross profit necessary to arrive at the net. Then you can establish the number of labor hours you need to sell to get to the gross and finally the net.
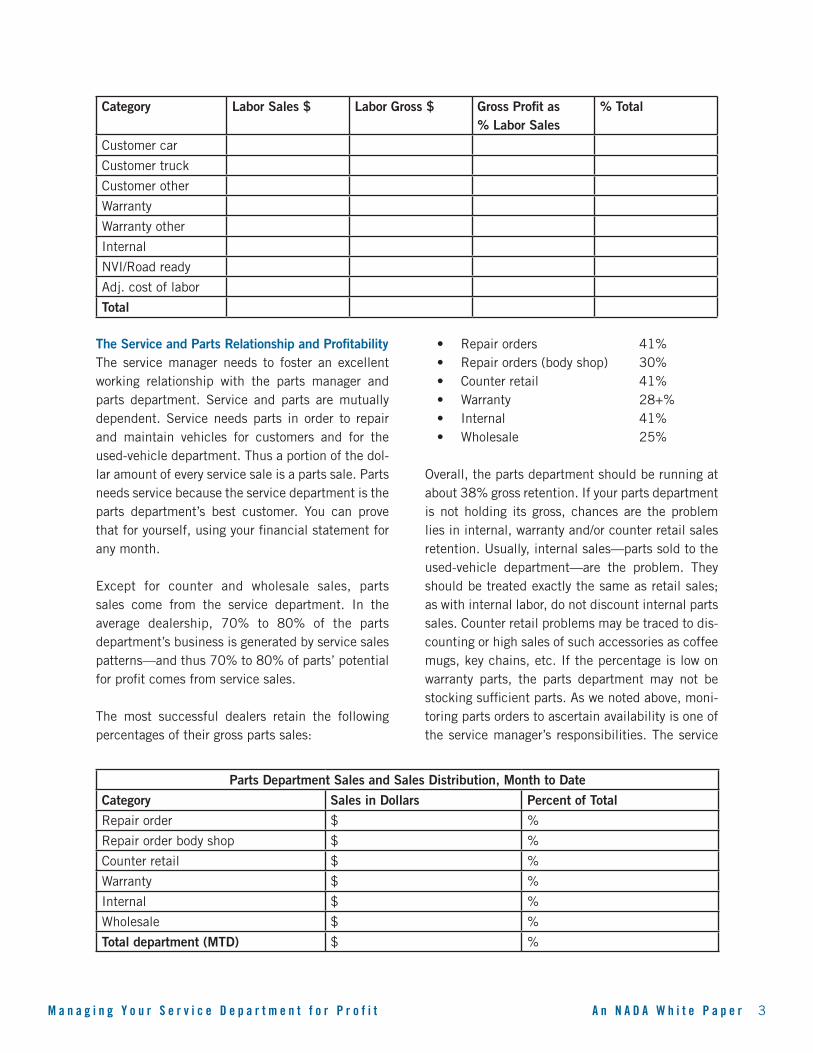
Retaining Gross ProfitsStart with your dealership’s financial statement. Analyze the service department’s labor-only sales and grosses. Divide your gross by your sales to determine your gross profit as a percentage of sales. Divide each category by the total to determine what percentage of the total that category provides.
According to NADA 20 Group guidelines, representing figures achieved by the top 25% of the most profit-able NADA 20 Group dealers, the service department should strive for 72% or higher gross retention in every category. Even a small increase in your gross can have a dramatic impact on the dollar sales you need to arrive at your desired net profit.
Your customer-pay labor (car, truck and other) should account for 60% of your total labor sales, with warranty and internal contributing 40%. And your adjusted cost of labor—the difference between the number of hours you pay your technicians and what you collect from your customers—should be as low as possible. Cost of labor affects the gross significantly.
Are you holding 72% of your gross? If not, look into your cost of sales and the percentage of your sales from each category. Do not discount internal labor sales; all sales should be charged at retail.
M a n a g i n g Y o u r S e r v i c e D e p a r t m e n t f o r P r o f i t A n N A D A W h i t e P a p e r 3
The Service and Parts Relationship and ProfitabilityThe service manager needs to foster an excellent working relationship with the parts manager and parts department. Service and parts are mutually dependent. Service needs parts in order to repair and maintain vehicles for customers and for the used-vehicle department. Thus a portion of the dol-lar amount of every service sale is a parts sale. Parts needs service because the service department is the parts department’s best customer. You can prove that for yourself, using your financial statement for any month.
Except for counter and wholesale sales, parts sales come from the service department. In the average dealership, 70% to 80% of the parts department’s business is generated by service sales patterns—and thus 70% to 80% of parts’ potential for profit comes from service sales.
The most successful dealers retain the following percentages of their gross parts sales:
• Repair orders 41%• Repair orders (body shop) 30%• Counter retail 41%• Warranty 28+%• Internal 41%• Wholesale 25%
Overall, the parts department should be running at about 38% gross retention. If your parts department is not holding its gross, chances are the problem lies in internal, warranty and/or counter retail sales retention. Usually, internal sales—parts sold to the used-vehicle department—are the problem. They should be treated exactly the same as retail sales; as with internal labor, do not discount internal parts sales. Counter retail problems may be traced to dis-counting or high sales of such accessories as coffee mugs, key chains, etc. If the percentage is low on warranty parts, the parts department may not be stocking sufficient parts. As we noted above, moni-toring parts orders to ascertain availability is one of the service manager’s responsibilities. The service
Category Labor Sales $ Labor Gross $ Gross Profit as % Labor Sales
% Total
Customer car
Customer truck
Customer other
Warranty
Warranty other
Internal
NVI/Road ready
Adj. cost of labor
Total
Parts Department Sales and Sales Distribution, Month to Date
Category Sales in Dollars Percent of Total
Repair order $ %
Repair order body shop $ %
Counter retail $ %
Warranty $ %
Internal $ %
Wholesale $ %
Total department (MTD) $ %

M a n a g i n g Y o u r S e r v i c e D e p a r t m e n t f o r P r o f i t A n N A D A W h i t e P a p e r 4
manager also must track labor sales lost due to lack of parts; the parts manager needs to know what to stock. The parts manager can run a “Repair Order Fill Rate” report from the in-house computer system; the parts department must also track all lost sales.
Finally, let’s consider the parts-to-labor ratio. Using the data from your dealership’s financial statement, extract the figures for parts sales in each category (customer, warranty and internal), and do the same for labor sales. Your parts sales divided by your labor sales gives you the parts-to-labor ratio.
Parts cost about the same everywhere; labor rates can vary dramatically. You should aim for the following parts-to-labor ratios:
• Customer-pay: 80 cents parts/labor (for every dollar of labor, you should sell a minimum of 80 cents of parts).
• Warranty: Expense per unit repaired should be equal to or less than the zone average.
• Internal: 80 cents (assuming retail charges; certified used vehicles increase the parts/labor ratio).
Obviously, the service manager cannot control the parts department. It is to the advantage of both de-partments that their managers understand how one department affects the other, and work together to the benefit of both.
Profit CenteringUse your financial statement to subtract your total expenses from your total gross and find your net profit.
In general, successful service departments should net 20% after absorbing their share of administrative or indirect expenses.
A 20% net is definitely achievable. Like a small increase in gross, a small decrease in expense can have a big impact on sales needed to achieve your best net.
As a rule of thumb, personnel expense (which may appear on your statement as personnel, variable, or selling expense) should amount to 45% -50% of the gross. All other expenses should be 25% -30% of the gross. Manufacturer-specific figures are available to 20 Group members in NADA 20 Group Operating and Expense Profiles.
If your department expenses are higher than 80% of your labor gross, look first at your gross retention. If you are holding 72%, you need to focus on maximiz-ing grossing potential. Are you selling all the hours you have available in service? If not, then look at lowering expenses.
Common expenses needing tighter controls include shop supplies, policy work, uniforms and parts wash-ers. These may seem to be small costs, but they may be eating up more of your gross than you imagine.
Expense Category Dollars % Service Labor Gross Profile Dealers
Department gross $Total gross 100%
Variable expense
Selling expense
Personnel expense
Semi-Fixed expense
Fixed expense
Unallocated expense
Dealer’s salary
Total expenses
Net profit $Gross less expenses 20%
M a n a g i n g Y o u r S e r v i c e D e p a r t m e n t f o r P r o f i t A n N A D A W h i t e P a p e r 5
Shop SuppliesYour cost for shop supplies should be a negative number. Shop supply expenses need to be passed along to the consumer.
If your dealership is located in a state that permits you to charge the customer for shop supplies, you need to do so. Establish a ceiling, then charge the customer 5% to 12% of the total labor charge, not to exceed that ceiling. Customers’ shop supply charges should reflect proportional amounts of fluids, etc., that are used for their vehicles.
If you are located in a state that prohibits charging the customer for shop supplies, you must charge sup-plies out as parts. If the customer is charged for the whole “part,” he or she should be given the whole.
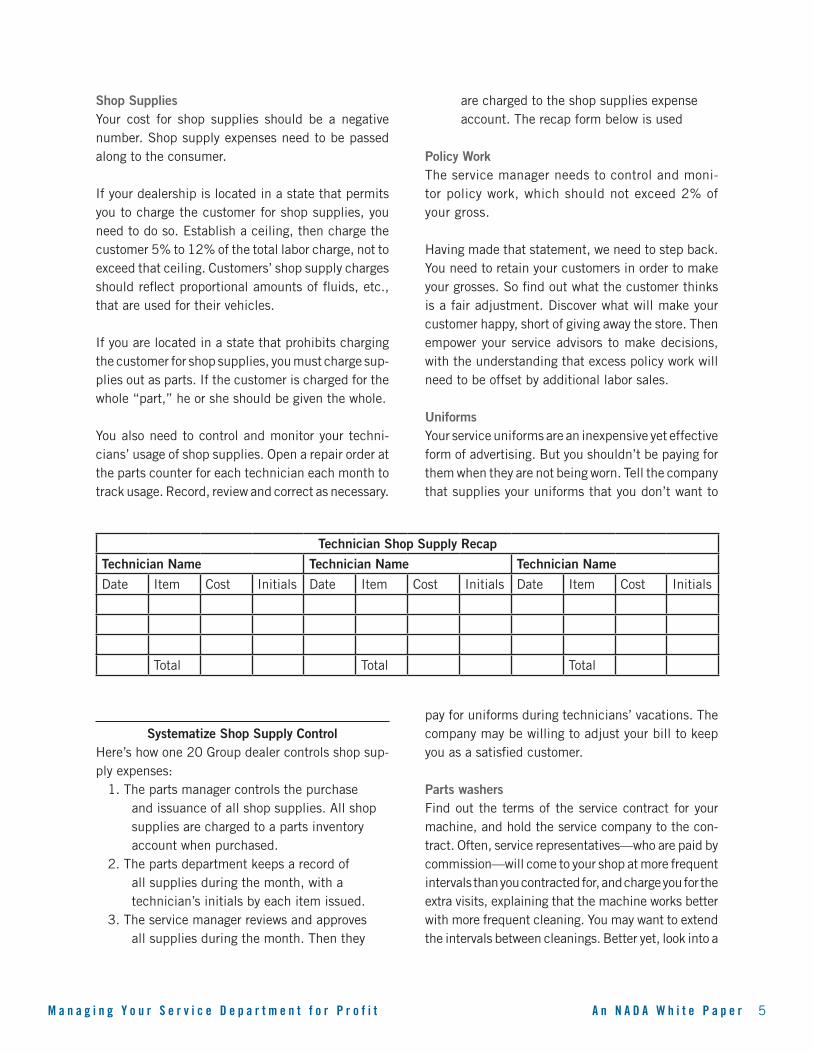
You also need to control and monitor your techni-cians’ usage of shop supplies. Open a repair order at the parts counter for each technician each month to track usage. Record, review and correct as necessary.
Systematize Shop Supply ControlHere’s how one 20 Group dealer controls shop sup-ply expenses:
1. The parts manager controls the purchase and issuance of all shop supplies. All shop supplies are charged to a parts inventory account when purchased.
2. The parts department keeps a record of all supplies during the month, with a technician’s initials by each item issued.
3. The service manager reviews and approves all supplies during the month. Then they
are charged to the shop supplies expense account. The recap form below is used
Policy WorkThe service manager needs to control and moni-tor policy work, which should not exceed 2% of your gross.
Having made that statement, we need to step back. You need to retain your customers in order to make your grosses. So find out what the customer thinks is a fair adjustment. Discover what will make your customer happy, short of giving away the store. Then empower your service advisors to make decisions, with the understanding that excess policy work will need to be offset by additional labor sales.
UniformsYour service uniforms are an inexpensive yet effective form of advertising. But you shouldn’t be paying for them when they are not being worn. Tell the company that supplies your uniforms that you don’t want to
pay for uniforms during technicians’ vacations. The company may be willing to adjust your bill to keep you as a satisfied customer.
Parts washersFind out the terms of the service contract for your machine, and hold the service company to the con-tract. Often, service representatives—who are paid by commission—will come to your shop at more frequent intervals than you contracted for, and charge you for the extra visits, explaining that the machine works better with more frequent cleaning. You may want to extend the intervals between cleanings. Better yet, look into a
Technician Shop Supply Recap
Technician Name Technician Name Technician Name
Date Item Cost Initials Date Item Cost Initials Date Item Cost Initials
Total Total Total

M a n a g i n g Y o u r S e r v i c e D e p a r t m e n t f o r P r o f i t A n N A D A W h i t e P a p e r 6
nonhazardous, water-based cleaning system that will wash the parts while your technicians work on vehicles.
Fixed AbsorptionService and parts are considered the regular—or “fixed”—sources of income, whereas the sales de-partments are considered variable sources of income. Fixed absorption is the ability of fixed operations (service and parts, and body shop if you have one) to absorb—cover—the entire dealership adjusted overhead expense. Adjusted overhead expense is total dealership expense less those expenses that are directly attributable to the sale of new and used vehicles—commission, delivery and policy.
Absorption, important in any vehicle sales curve, becomes even more crucial when vehicle sales slide. Variable income flow is reduced, but expenses in-crease. The more of the debt load that you can take off the variable operations, the easier it is for them to sell vehicles. You should aim for high fixed absorp-tion, the closer to full absorption—100%—the better.
If service and parts could generate sufficient gross to cover all dealership expenses, every vehicle sale would produce pure profit. NADA 20 Group guide-lines, which include used-vehicle gross in the formula below, recommend 100% absorption. Few dealers are able to achieve 100%. Some specialists in fixed operations profitability tie absorption rate to customer retention: If you have a 70% customer retention level, they say, you can expect 90% or better fixed absorption. On a national level, fixed absorption at this writing is at a poor 59%. NADA Academy, bas-ing its guidelines on the experience of the top 20% of dealers who are successful in all five dealership departments, recommends 75% absorption, with or without a body shop.
To calculate your absorption percentage, use the figures from your financial statement in the following formula:Gross Profit (Parts Department + Service Department + Body Shop) ÷ Adjusted Dealership Overhead Expense = Absorption Percentage
If your absorption is low, examine your grossing pat-terns. Service should be holding 72% of gross; parts should be holding 38%, and body shop should be holding 65% on labor, 30% on parts.
If you are holding gross in all these areas, examine your expenses.
As noted above, the adjusted overhead expense is the total dealership expense less new and used commission expense, policy expense and get ready/delivery expense. These are variable expenses, to which some manufacturers add floor plan interest and advertising. Floor plan interest and advertising are not under the control of fixed operations, but if your financial statement includes them with variable expenses and they are out of line, you may be in the position of absorbing the costs of aged inventory and the advertising intended to move it. Advise your general manager or sales manager.
Service Pricing TechniquesPricing Service JobsAs service manager, you need to utilize your human and facility resources to the maximum possible level while providing value that exceeds customer expecta-tions. To do so, you should establish pricing policies that do not necessarily conform to a predetermined labor rate, but which compete with locally available prices and still retain adequate profits.
You need to learn what your customers will pay for the many different service operations performed in your marketplace. Services fall into three broad categories:
1. Competitive2. Maintenance3. Repair
Since most repairs require higher skill levels than non-dealer competitors employ and therefore could be considered captive, you need only shop a few of the more commonly performed operations, such as strut replacement and transmission overhauls.
Most customers don’t leave dealership service depart-ments to have complicated repairs done somewhere

M a n a g i n g Y o u r S e r v i c e D e p a r t m e n t f o r P r o f i t A n N A D A W h i t e P a p e r 7
else. For the most part, they turn to non-dealership service outlets for maintenance and competitive work. And they leave, for the most part, because they perceive dealership prices to be higher. Sometimes, dealers’ prices are higher, because they have been setting prices according to their profit goals (cost-plus-markup percentage) rather than their marketplace.
In the real world, the question is not, “What price must I charge to make my profit?” It is, “What price is my customer willing to pay?”
By shopping your competitors to determine what they are charging, you can stay in touch with the market and ensure that your customers are receiving good value. If you can change the customer’s perception that your prices are higher, you can begin the process of winning them back and keeping them.
When you shop your competitors, note whether they give a price on two-wheel alignments. Dealers typi-cally quote on four-wheel alignments. You need to quote on the two-wheel alignment, then upsell in the service lane if the customer needs a four-wheel alignment.. And how about your price for installing pads? Dealership service departments tend to quote on two services—installing pads and turning rotors—instead of one. Give your price solely for installing pads; you may not need to turn rotors, anyway, unless there’s a problem.
Remember, when a customer questions price, it is a good sign. It’s a buying signal. And it gives you the chance to explain the value of the service you’re providing. A fair price is not enough. Superior service is not enough. Your customer needs to perceive your good service and price as good value. You don’t have to have the lowest prices in town to deliver value.
Pricing Service LaborMost customers don’t know—and don’t care—what labor costs your dealership. They just want a fair price. You need to price labor at what it’s worth, realistically, rather than as a response to what your technicians think they should be paid.
Briefly, you have four options for pricing labor:1. Clock-hour rates. Customers pay an
established hourly rate for the actual time spent by each technician working on their vehicles.
2. Flat-rate hours. Customers pay a uniform hourly charge for an operation’s time standard according to a flat-rate manual.
3. Job pricing (or menu pricing). Customers pay a labor charge based on the prevailing charges for similar operations at competing service facilities in their market.
4. Variable labor rates (also called multi-level flat-rate hours). Customers pay one of several hourly rates, based on skill or market category, for an operation’s time standard found in a flat-rate manual.
Robert Atwood of NADA Academy suggests that the fourth option, variable rates, is the key to becom-ing competitive. Variable labor rates based on the complexity of the jobs can match technician skills to particular jobs—utilizing your labor pool efficiently—and enhance the competitive stance of your service department. Again, do not charge a lower rate for internal work than you charge for retail work; your technician’s time and the service bay cost the same regardless of the customer.
Variable labor rates can be approached according to skill level alone or according to market categories that encompass skill-level considerations.
With skill-level rates, the hourly price is normally based on the traditional A, B, C or D skill codes. This method allows you to charge more for jobs requiring highly-skilled, higher-paid technicians and less for jobs requiring lower-skilled, lower-paid technicians. Skill code A receives a high market price, skill code B an average market price on the high end, skill code C an average market price on the low end, and skill code D a low market price.
Market category rates allow you to establish three separate labor rates, basing the per-hour labor price on the type of labor—competitive, maintenance or

M a n a g i n g Y o u r S e r v i c e D e p a r t m e n t f o r P r o f i t A n N A D A W h i t e P a p e r 8
repair. This method allows pricing to meet prevail-ing market conditions—and you can still assign your technicians to the various jobs according to their skill levels. Further, work performed on one vehicle may be divided among all three rates, depending on the services needed.
Atwood recommends the market category approach to variable rates; once you establish rates, you may decide to post a dollar range (for instance, $35-$85 per labor hour) in your shop. He offers the following rate considerations:
• Competitive labor comprises those services, limited in number, that you have chosen to be competitive in. Competitive labor is charged at a low hourly rate for the most competitive services in the marketplace:
– Lube, oil and filter changes – Alignments – Wheel balances – Tire rotations – Any market-driven, price-sensitive
maintenance items as required to maintain your competitive posture
• Maintenance labor is defined as any work that the manufacturer recommends or requires. Including common but less competitive services, maintenance labor is priced at a moderate hourly rate that usually averages out at or above your target or posted rate. Maintenance labor services are:
– Manufacturer’s required maintenance services
– Automatic transmission services – A/C service – Emission control services – Injector services
• Repair labor, which comprises every other service your department provides, is priced at your most expensive hourly rate. Repair labor involves the least competitive, most specialized operations, such as:
– Electronic engine control diagnosis and adjustments
– Electrical malfunctions and other wiring-related problems
– Accessory repairs and replacements – A/C compressor overhaul – Engine overhaul and other internal engine
work – Fuel injection calibration
How do you go about instituting a variable labor rate structure?
Suggested Steps for Setting Up Variable Labor RatesStep 1. Conduct a repair order analysis of your customer-pay work to determine your effective labor rate (ELR) and work mix by category (competitive, maintenance, repair).
Divide your sales in each category by the hours billed in that category to find your ELR.
Step 2. Establish your competitive rate at or near the LOF rate (which you determined by shopping your competition). Even though your other competitively priced maintenance work will carry a higher labor rate effectively, it is your LOF rate that contributes the most to your competition. Establishing a lower competitive rate will give you a slight cushion.
Establish your maintenance rate at or above the existing warranty rate. The maintenance rate is the “target” rate for your department and should never be lower than the warranty rate. All of your mainte-nance work should be priced with this rate in mind, especially the mileage interval services reflected in the owner’s maintenance schedule.
Establish your repair rate at $8 to $10 above the main-tenance rate or at an amount equal to the maintenance rate plus twice the deficit—a negative “Difference” shown on your RO Analysis Recap Sheet—whichever amount is less. (If your maintenance rate is $55, for example, and your Recap shows a shortfall of $4.50, set your repair rate at $9 above the maintenance rate, or $64.)
Step 3. Monitor the movement. Consider your new variable rate schedule as a trial. Once your rates take hold and you continue to monitor your work mix and

M a n a g i n g Y o u r S e r v i c e D e p a r t m e n t f o r P r o f i t A n N A D A W h i t e P a p e r 9
ELR trend, you may find that time and inflation will allow you to shrink the gap between your maintenance and repair rates. Your deficit should decrease; if it deepens, it may be necessary to increase the repair rate slightly to offset the shortfall.
Additional GuidelinesThorough RO analysis every month (see Driven guide Repair Order Analysis on nada.org) will demonstrate if your service department’s performance is consis-tent with goals and guidelines. These are guidelines pertinent to the present discussion:
• Percentage competitive and maintenance sales: 60%, collectively
• Percentage repair sales: 40%• Cost of sale (COS): 30% or lower• Average cost per flat-rate hour (FRH): Equal
to or less than average technician pay• Total ROs: 14-18* per service advisor per day• Total FRHs: 40-50 per service advisor per day• Average flat-rate hours per RO: 2.2-2.5;
high line 3.0• Percentage menu sales: Upsell 30%• Percentage one-item ROs: 10%-15%• Model-year mix: New-vehicles still under
warranty should comprise 50% of your work mix—upsell maintenance
* Note: The number of ROs is not as crucial as the work involved. Your department may thrive on more work from fewer ROs. Sell needed service (i.e., technician time), not lines on the dispatch sheet.
One Way to Devise a Variable Price StructureThere are many methods of creating variable price structures that will work for your shop in your mar-ket according to your work mix and the skill levels of your technicians. One 20 Group dealer, intent on achieving service gross percentage at or above 72%, switched from an across-the-board flat rate for all customer-pay work to a pricing grid. But the grid, based on a graduated labor rate that increases with the number of FRHs an operation pays, had some problems. Diagnostic work, for instance, of-ten paid a single hour, generating a relatively low labor rate; yet in many cases it could be performed only by the highest skill level (i.e., the highest-paid technicians). On the other hand, replacement of an
automatic transmission pays a high number of hours, thus generating a higher labor rate—but generally a medium-skill technician can do it. Furthermore, a local transmission shop could buy the same rebuilt transmission from this dealer’s parts department and perform the repair for several hundred dollars less. So the service department instituted a four-tiered pricing system:
1. Competitive items = brakes and shocks: $XX per FRH
2. Maintenance items = belts, hoses and fuel filters: $XX plus $5 per FRH
3. General repair items = engine replacement, suspension work: $XX plus $12 per FRH
4. Specialty work = driveability, electrical, passive restraints : $XX plus $32 per FRH
After three months of using this structure, this ser-vice department increased its effective rate 18%. Customer-pay gross percentage for the third month was 74.19%, and total labor sales gross percentage was 72.98%.
Repair Order AnalysisAs you know, the repair order is the single most im-portant piece of paper in the service department. The RO is the ticket—the work that yields sales that, in turn, yield profits. Service managers should examine ROs daily, ensuring that they are complete, that pric-ing is accurate, and that service advisors are selling needed service as well as taking orders.
On a monthly basis, analyze the ROs to determine what needs to be improved and what actions you should take to do so. Try to analyze 100 ROs each month—100 ROs per service advisor per month would be even better—comparing your department’s performance against guidelines. With your eye on the goal—to maintain an effective labor rate that always exceeds your target—and your ongoing RO analysis in hand, you can do minor tweaking with major results. You should also review computerized reports on a daily basis to monitor the ELR, which will fluctuate depending on the work mix. You want to manage the sales effort to minimize one-item ROs—as the count of one-line items decreases, your hours per RO
M a n a g i n g Y o u r S e r v i c e D e p a r t m e n t f o r P r o f i t A n N A D A W h i t e P a p e r 10
increases—and maximize the use of menus, pricing guides and controlled work mixing scheduling.
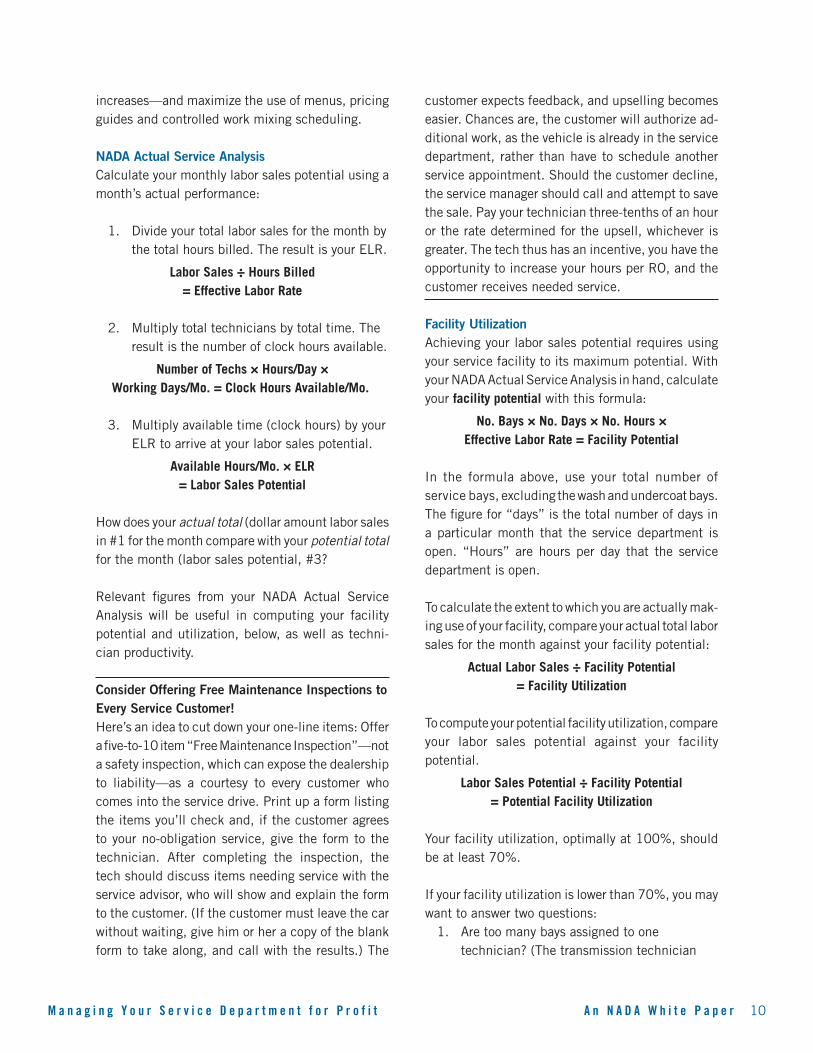
NADA Actual Service AnalysisCalculate your monthly labor sales potential using a month’s actual performance:
1. Divide your total labor sales for the month by the total hours billed. The result is your ELR.
Labor Sales ÷ Hours Billed = Effective Labor Rate
2. Multiply total technicians by total time. The result is the number of clock hours available.
Number of Techs × Hours/Day × Working Days/Mo. = Clock Hours Available/Mo.
3. Multiply available time (clock hours) by your ELR to arrive at your labor sales potential.
Available Hours/Mo. × ELR = Labor Sales Potential
How does your actual total (dollar amount labor sales in #1 for the month compare with your potential total for the month (labor sales potential, #3?
Relevant figures from your NADA Actual Service Analysis will be useful in computing your facility potential and utilization, below, as well as techni-cian productivity.
Consider Offering Free Maintenance Inspections to Every Service Customer!Here’s an idea to cut down your one-line items: Offer a five-to-10 item “Free Maintenance Inspection”—not a safety inspection, which can expose the dealership to liability—as a courtesy to every customer who comes into the service drive. Print up a form listing the items you’ll check and, if the customer agrees to your no-obligation service, give the form to the technician. After completing the inspection, the tech should discuss items needing service with the service advisor, who will show and explain the form to the customer. (If the customer must leave the car without waiting, give him or her a copy of the blank form to take along, and call with the results.) The
customer expects feedback, and upselling becomes easier. Chances are, the customer will authorize ad-ditional work, as the vehicle is already in the service department, rather than have to schedule another service appointment. Should the customer decline, the service manager should call and attempt to save the sale. Pay your technician three-tenths of an hour or the rate determined for the upsell, whichever is greater. The tech thus has an incentive, you have the opportunity to increase your hours per RO, and the customer receives needed service.
Facility UtilizationAchieving your labor sales potential requires using your service facility to its maximum potential. With your NADA Actual Service Analysis in hand, calculate your facility potential with this formula:
No. Bays × No. Days × No. Hours × Effective Labor Rate = Facility Potential
In the formula above, use your total number of service bays, excluding the wash and undercoat bays. The figure for “days” is the total number of days in a particular month that the service department is open. “Hours” are hours per day that the service department is open.
To calculate the extent to which you are actually mak-ing use of your facility, compare your actual total labor sales for the month against your facility potential:
Actual Labor Sales ÷ Facility Potential = Facility Utilization
To compute your potential facility utilization, compare your labor sales potential against your facility potential.
Labor Sales Potential ÷ Facility Potential = Potential Facility Utilization
Your facility utilization, optimally at 100%, should be at least 70%.
If your facility utilization is lower than 70%, you may want to answer two questions:
1. Are too many bays assigned to one technician? (The transmission technician

M a n a g i n g Y o u r S e r v i c e D e p a r t m e n t f o r P r o f i t A n N A D A W h i t e P a p e r 11
and the engine technician may use two or three bays. All other technicians should be given a lift and share a flat stall—i.e., one and a half stalls per technician.)
2. Do I need to hire additional technicians in order to maximize facility utilization?
(This white paper was excerpted from NADA’s A Dealer Guide to the Three Ps of Effective Service Management: Profit, Productivity, Personnel. The full publication is free to members at nada.org.)

ACKNOWLEDGMENTS
NADA would like to acknowledge Robert Atwood, NADA Academy instructor, for his assistance in the prepa-ration of this white paper.

nada.org
© NADA 2010, rev. 2014. All rights reserved.
OVER
500 TRAINING ASSETS
Driven Guides Interactive Online Courses
Webinars
Show Workshops
Job Descriptions
NADA Data
Workforce Study
If the dealership you work for is a member of NADA you have access to all of these other great resources. Create an account today.
If you don’t already have an account with nada.org, please create one now by clicking here.
from nada.org
Additional NADA Resources