Managing Through Economic Turmoil: How to Reduce Defined ...
25
May 29, 2009 Stéphane Jean and Roland Pratte © 2009 Towers Perrin Managing Through Economic Turmoil: How to Reduce Defined Benefit Pension Plan Risks FEI Canada 2009 National Conference Breakfast Seminar
Transcript of Managing Through Economic Turmoil: How to Reduce Defined ...
May 29, 2009
Stéphane Jean and Roland Pratte
© 2009 Towers Perrin
Managing Through Economic Turmoil: How to Reduce Defined Benefit Pension Plan Risks
FEI Canada 2009 National ConferenceBreakfast Seminar

2© 2009 Towers Perrin
2000 – 2002 « Perfect storm »
Hit on the two main frontsSignificant drop in equity marketsSignificant drop in interest rates
Significant drop in Asset/Liability ratiosE.g., 25% to 30% on accounting basis
Cumulative Returns (2000 - 2002)
-18%
-32%
-38% -38%
-43%
30%33%
-7%
-50%
-40%
-30%
-20%
-10%
0%
10%
20%
30%
40%
S&P/TSX S&P 500 S&P 500 $US EAFE Net EAFE Net Local DEX Universe DEX Long Term Benchmark Plan(60/40)
Index
Ret
urn

3© 2009 Towers Perrin
What happened since? 2003 – 2007
Improvement in Asset/Liability ratios, but mainly from additional contributionsGrowth from equity markets partially offset by decrease in discount rates
Cumulative Returns (2002 - 2007)
132%
14%
83%
66%
111%
31%
47%
60%
0%
20%
40%
60%
80%
100%
120%
140%
S&P/TSX S&P 500 S&P 500 $US EAFE Net EAFE Net Local DEX Universe DEX Long Term Benchmark Plan(60/40)
Index
Ret
urn

4© 2009 Towers Perrin
What happened since? 2008 & Q1 2009
Significant deterioration of Asset/Liability ratiosE.g., about 15% on accounting basis, > 20% on solvency basis
Cumulative Returns (2008 & Q1 2009)
-34%
-29%
-44%
-38%
-46%
8%
3%
-19%
-50%
-40%
-30%
-20%
-10%
0%
10%
20%
S&P/TSX S&P 500 S&P 500 $US EAFE Net EAFE Net Local DEX Universe DEX Long Term Benchmark Plan(60/40)
Index
Ret
urn

5© 2009 Towers Perrin
Solvency discount rates remain at historical lows as at December 31, 2008Annuity purchase discount rates have slightly increased since last valuationCommuted value have decreased slightly since last valuation
3.5%
4.0%
4.5%
5.0%
5.5%
6.0%
6.5%
7.0%
7.5%
1999 2000 2001 2002 2003 2004 2005 2006 2007 2008
Lump sum settlement Annuity purchase Accounting (average plan)
Funding/accounting discount rates
Lump sum rates under new commuted value
standard (effective April 2009) would increase by 40 bps as of Dec. 2008
(December 31)

6© 2009 Towers Perrin
Key sources of risk in defined benefit pension plans
Risk posed by inflation rate changes, changes in spreads and yield curve shapes, pension asset/liability mismatchInterest rate risk is not compensated: Greater returns are generally NOT expected from interest sensitivity mismatches
Interest rate risk
Plan governancePlan administration
Operational risk
Risk posed by participant longevity and embedded design options (e.g., lump sums, early retirement subsidies)
Demographic risk
Risk from regulatory changes by pension or accounting authoritiesAsymmetric risk of surplus rules
Regulatory risk
Market risk posed by investments held in pension trust (e.g., equity, real estate, etc.)Market risk can be compensated: Greater returns are expected in the long run for greater risk undertaken
SourceMarket riskType of Risk
These risks can be managed

7© 2009 Towers Perrin
Some of these risks can be mitigated through investments
Can partially mitigate through LDI investment strategy —“There is no such thing as a perfect interest rate hedge”
Interest rate risk
Can mitigate through design for active participantsCan mitigate through annuity purchase for participants in pay — either settlement or as an investment of the trustCan partially mitigate through longevity SWAPS— theoretically
Demographic risk
Can mitigate through investment strategiesMitigation
Market riskType of Risk
Degree of mismatch risk generally influenced by:Plan designMaturity of plan (proportion of active versus retiree liability)Investment time horizonFunded status of planFinancial health and risk tolerance of the plan sponsor Materiality of the pension plan to the sponsorFor overlay strategies, plan sponsor's comfort level with the use of derivatives

8© 2009 Towers Perrin
Pension Financial Management Strategy
Overview of pension financial management
The optimal pension financial management strategy addresses pension risks to ensure implications are understood and addressed
The strategy must be consistent with corporate objectives to ensure proper management of the business implications
Pension ImplicationsPension Risk Business
Implications
Risks manifest in this direction…
…and should be managed in this direction

9© 2009 Towers Perrin
Pension financial management strategy
An effective plan covers four policy areas that together serve to manage program cost within the sponsor’s tolerance for financial risk
Business objectives
Availability and
use of cash
Cost allocation over time
Benefits
Funding
Investment
Accounting
Asset/liability risk
Active management
Total rewards Affordable
Competitive

10© 2009 Towers Perrin
DB pension plan design
Completed Planned Considering Not considering
Source: Towers Perrin Benefits in Crisis Pulse Survey – Canada
Close DB plan to new participants
Suspend or eliminate DB pension benefit accruals for current participants
Increase employee contributions to DB plans
Change DB benefit levels to reduce cost
Implement benefit changes to support desired retirement patterns
6%
45%
5%
11%
10%
11%
5%
9%
84%
85%
81%
86%
45%
2
3
3
3
3
1
2
0% 20% 40% 60% 80% 100%

11© 2009 Towers Perrin 11
LONG-TERM
EFFECT
SHORT-TERM EFFECT
Changes to defined benefit plansOptional for current
employees
DRIVERS
Compulsory for current employees
New hires only
Level of targeted benefitsDefined contribution component
Pensionable earnings/method for calculating the averageEmployee contributions/risk sharing
Ancillary benefits (early retirement, form of payment)Past service treatment
Indexation, ad hoc adjustments and updatesTargeted phased/early retirement plans
Eligibility rulesNotice period
Other considerations: Negotiations, legal issues, anti-selection, change of actuarial assumptions, introduction of a flexible component, demographic profile, SERP plans

12© 2009 Towers Perrin
Regulatory risk – Quebec registered pension plans
Bill 30 introduces significant limitations with respect to plan funding with effect from January 1, 2010
New funding rule, solvency provision for adverse deviations (PfAD) will increase the funding requirement (above 100%) Annual valuation requirementImmediate funding of certain improvementsEquitable use of surplus assets rule — Will be an obstacle to plan improvement when plan is in surplus
As a result, sponsors should adopt a minimum funding strategy in order to reduce deficit positions while not creating significant surplus positions between now and 2010
Objective: Determine appropriate funding strategy for the plan in light of the current environment and the expected requirements under Bill 30

13© 2009 Towers Perrin
Funding relief : what is proposed*
* According to recommendations proposed on May 19, 2009; some conditions may apply
Quebec Ontario Alberta B-C. FederalSmoothing of assetsAmortization of deficit over a 10 year periodConsolidation of amortization schedulesLetter of creditReport on the increase of contributions
Proposed Already permitted Not permitted
Ontario : If consent of the participantsFederal : in 2009 only, no conditions; after 2009, if consent of the participants or letter of credit
If requested by the Superintendent and if authorized

14© 2009 Towers Perrin
Regulatory riskGlobalization of accounting/financial reporting
Global market for capital reinforces need for global set of accounting standardsIFRS acceptance around the worldCanada adopting IFRS for fiscal years beginning in 2011SEC now accepts IFRS for reporting by non-US registrants
FASB and IASB have committed to work towards convergence of U.S. GAAP and IFRS ("Memorandum of Understanding")
SEC has proposed a "Road Map" for US public companies to adopt IFRS between 2014 and 2016.
Timing depends on market capitalization.
15© 2009 Towers Perrin
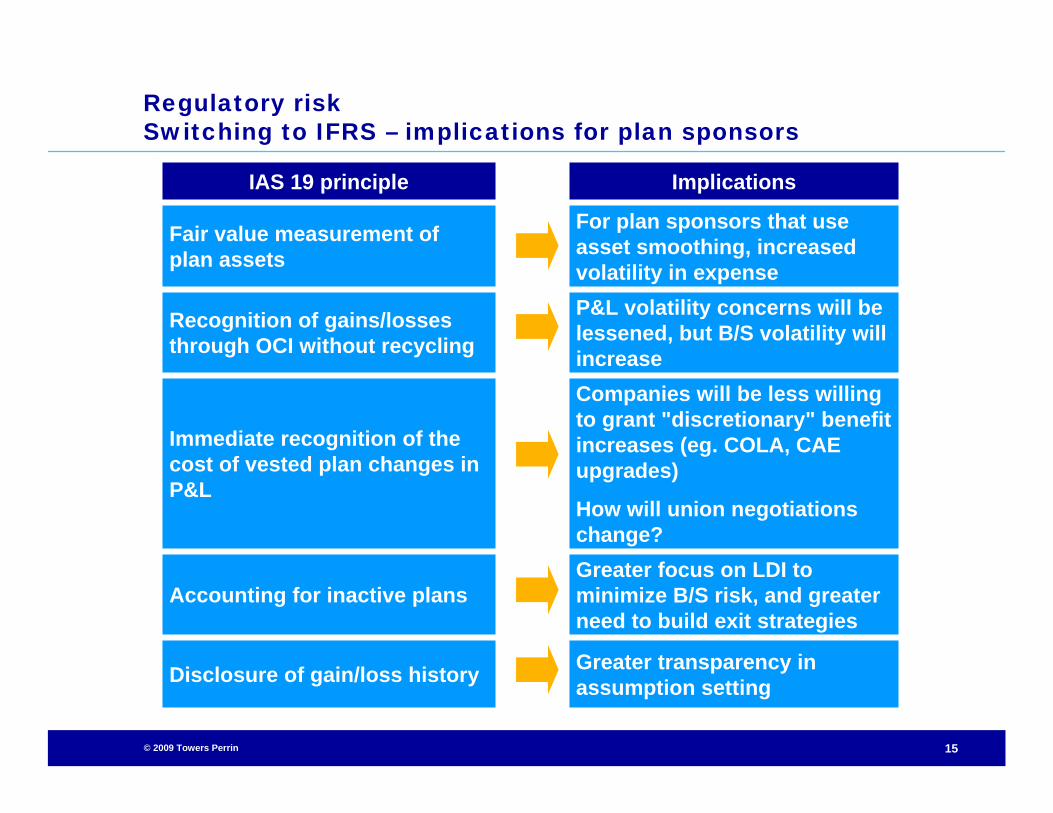
Regulatory riskSwitching to IFRS – implications for plan sponsors
Greater focus on LDI to minimize B/S risk, and greater need to build exit strategies
Accounting for inactive plans
P&L volatility concerns will be lessened, but B/S volatility will increase
Recognition of gains/losses through OCI without recycling
For plan sponsors that use asset smoothing, increased volatility in expense
Fair value measurement of plan assets
IAS 19 principle Implications
Immediate recognition of the cost of vested plan changes in P&L
Companies will be less willing to grant "discretionary" benefit increases (eg. COLA, CAE upgrades)
How will union negotiations change?
Disclosure of gain/loss history Greater transparency in assumption setting

16© 2009 Towers Perrin
Risk management strategies - Example
Objective – All plans combined
Reduce by 50% the potential decrease in funded status, or risk, with a 95% confidence level
Changes implemented
Immunized the Mature Plans, which represent 30% of total liabilitiesEstimated solvency ratio of around 105%Closed to new entrants; current active population close to retirementOver 80% of liabilities related to inactive members
Increased the interest rate risk hedge ratio of the Other Plans with LDI strategyEstimated solvency ratio of around 87%Open to new entrantsAround 50% of liabilities related to inactive members
Reduced equity content of Other Plans by 20%
Introduced partial currency hedging strategy
Reviewed manager structure
17© 2009 Towers Perrin
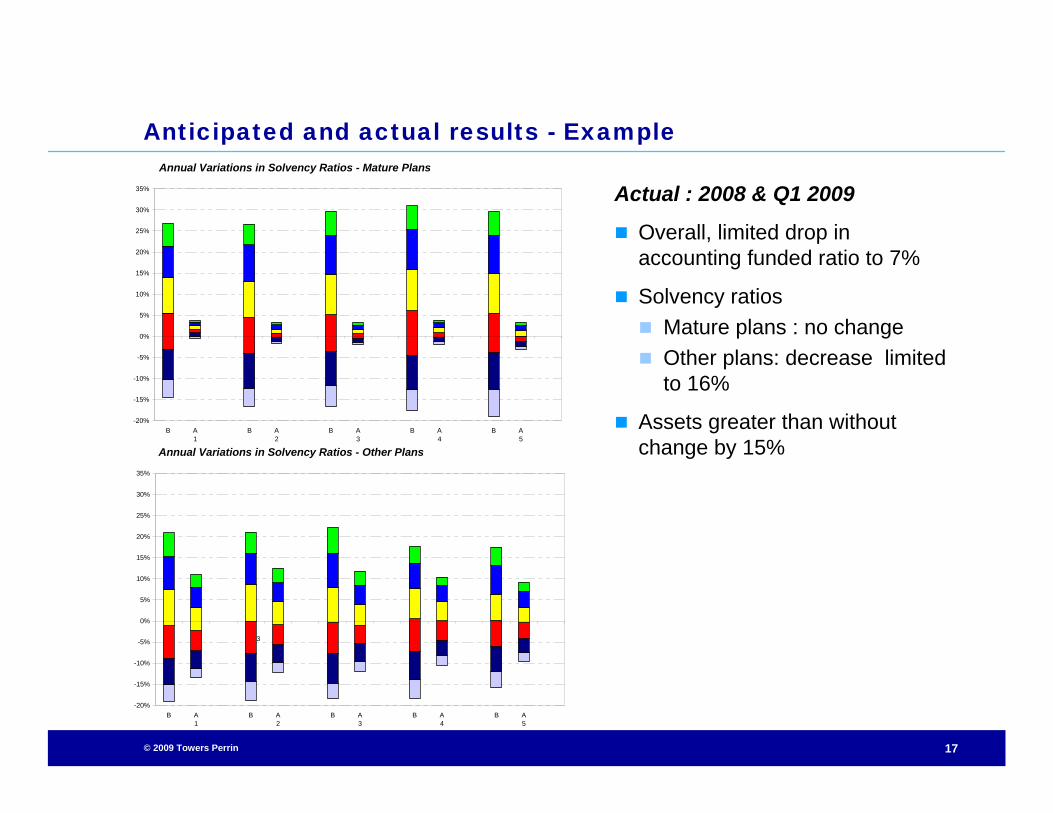
Anticipated and actual results - Example
Actual : 2008 & Q1 2009
Overall, limited drop in accounting funded ratio to 7%
Solvency ratiosMature plans : no changeOther plans: decrease limited to 16%
Assets greater than without change by 15%
Annual Variations in Solvency Ratios - Mature Plans
-20%
-15%
-10%
-5%
0%
5%
10%
15%
20%
25%
30%
35%
B A1
B A2
B A3
B A4
B A5
Annual Variations in Solvency Ratios - Other Plans
-20%
-15%
-10%
-5%
0%
5%
10%
15%
20%
25%
30%
35%
B A1
B A2
B A3
B A4
B A5
3

18© 2009 Towers Perrin
Lessons learned and best practices
Governance
Competencies and leadership of management
Education of stakeholders
Optimal allocation of governance budget (time, resources)
Efficient governance process
Risk management
From ERM to LDI
Establishment of clear objectives and risk measures
Best practices as opposed to common practices
Coordinated management as opposed to silos
Action plan and monitoring of key measures
19© 2009 Towers Perrin
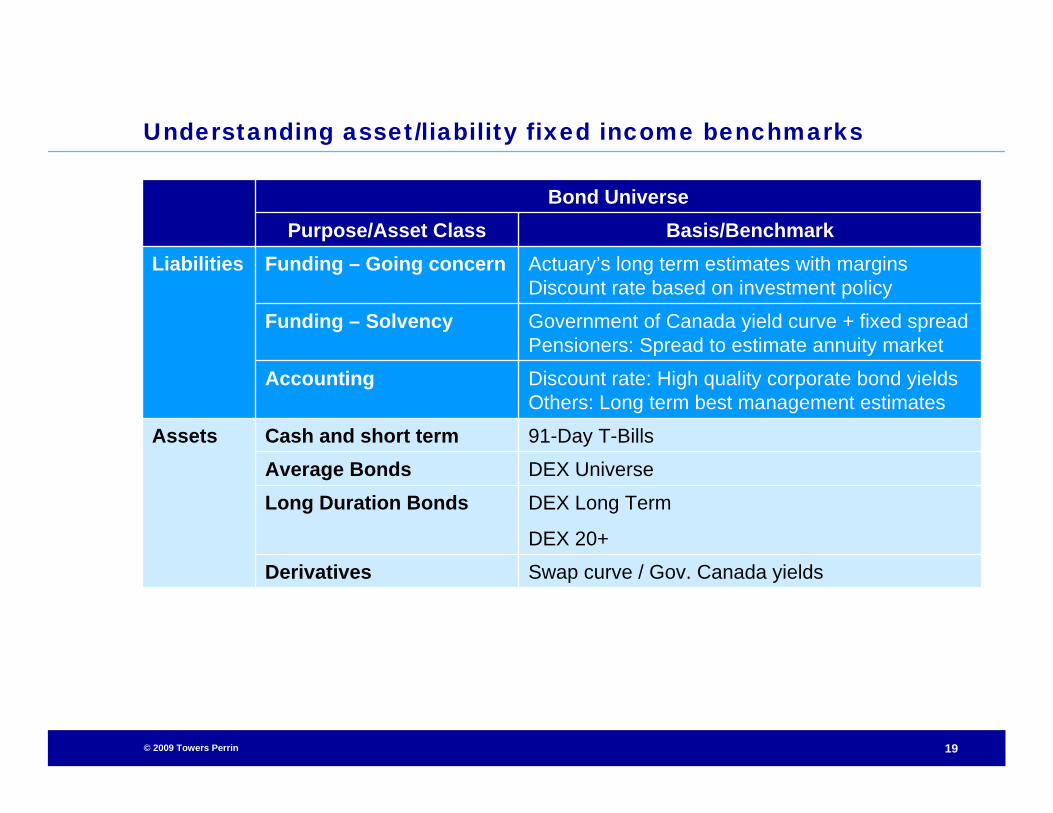
Understanding asset/liability fixed income benchmarks
Assets
Liabilities
Discount rate: High quality corporate bond yieldsOthers: Long term best management estimates
Accounting
DEX UniverseAverage Bonds91-Day T-BillsCash and short term
Swap curve / Gov. Canada yieldsDerivatives
DEX Long Term
DEX 20+
Long Duration Bonds
Bond Universe
Government of Canada yield curve + fixed spreadPensioners: Spread to estimate annuity market
Funding – Solvency
Actuary’s long term estimates with margins Discount rate based on investment policy
Funding – Going concernBasis/BenchmarkPurpose/Asset Class

20© 2009 Towers Perrin
Managing risks through investments - Process
Entire investment process can be viewed as a continuum
All elements of the investment process are interlinked and should have a consistent philosophical underpinning
Asset Allocation
Operational Risk Management
Performance Evaluation
Performance Measurement
Governance
Objective Setting
Manager Structure
Execute
Monitor
Manager Review/ Selection
Establish

21© 2009 Towers Perrin
Asset/Liability investment framework
Plan Assets
Overlay Using Derivatives
Liability Risk Management Assets
Return Enhancement Assets
Improves hedging of interest rate risk
Lengthens duration synthetically to better match liabilities
May not disrupt asset allocation
Nature of portfolioDurationConvexityCredit
Partially addresses mismatch risk and volatility of funded ratio
Low return, higher long term pension costs but with low volatility
Delivers return premium (over risk-minimizing portfolio)
Allocation to equities, real estate, infrastructure, absolute return strategies, etc.
Uncorrelated sources of alpha
May reduce long term pension costs but with high volatility
Asset Liability Risk Management Decision:Controls degree of exposure to financially risky assetsHow much to hedge?
Current thinking is to split asset allocationdecisions into the “Liability Risk Management”and “Return Enhancement ” components
22© 2009 Towers Perrin
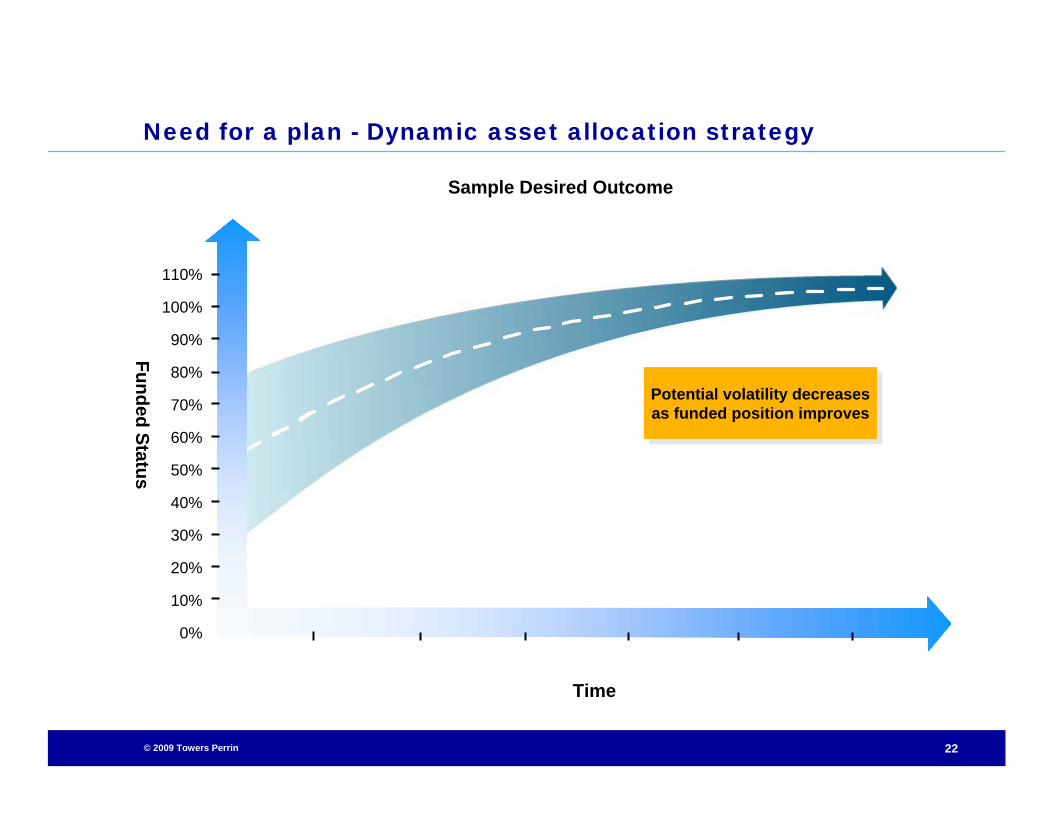
Need for a plan - Dynamic asset allocation strategy
110%
100%
90%
80%
70%
60%
50%
40%
30%
20%
10%
0%
Funded Status
Sample Desired Outcome
Time
Potential volatility decreases as funded position improves
Potential volatility decreases as funded position improves

23© 2009 Towers Perrin
It’s portfolio management — notsettlement or risk transfer—that provesthe most common approach to managing risk
Percentage of all respondents
In your opinion, how likely is your company to adopt the following methods for managing pension risk?
Likely
Ongoing Management
Respondents have a clear preference today
for managing the risk as opposed to
transferring or settling the risk
6%
7%
7%
12%
15%
17%
20%
21%
30%
30%
18%
20%
22%
32%
20%
52%
46%
45%
20%
28%
8%
7%
6%
7%
7%
0% 25% 50% 75% 100%
Captive insurancesolutions
Settlement with lifeinsurer
Transfer of plan tothird party
Decrease equityexposure in pension
portfolio
Liability-based assetmanagement
Very likely Somewhat likely Somewhat unlikely Very unlikely Don't know
Source: CFO Research Services - 2008 survey.

24© 2009 Towers Perrin
End-game strategy
A pension risk management policy consistent with corporate financial objectives that ultimately leads to an exit from plan sponsorship while addressing the interim risk tolerances and constraints
Once a defined benefit plan is closed to new participants, an implicit decision has been made to exit plan sponsorship (be it in 50 days or 50 years)
Developing a dynamic exit strategy enables plan sponsors to:Understand and quantify the accounting and economic costs of available exit strategiesArticulate a multi-year plan including…— Explicit trigger points for partial or complete exit actions— Dynamic investment strategies to achieve financial objectives along the way
Other approaches are available to facilitate settlementTraditional annuity purchase (buy-out)Buy-inPension captive
Desired Outcome
25© 2009 Towers Perrin
Questions