Managing the risk of a COVID-19 outbreak from border arrivals
15
Note: This paper has not yet undergone formal peer review Managing the risk of a COVID-19 outbreak from border arrivals 20 August 2020 Alex James 1,4 , Michael J. Plank 1,4 , Rachelle N. Binny 2,4 , Shaun C. Hendy 3,4 , Audrey Lustig 2,4 , Nicholas Steyn 1,3,4 1. School of Mathematics and Statistics University of Canterbury, New Zealand. 2. Manaaki Whenua, Lincoln, New Zealand. 3. Department of Physics, University of Auckland, New Zealand. 4. Te Pūnaha Matatini: the Centre for Complex Systems and Networks, New Zealand. Executive Summary and recommendations • Weekly testing of all workers who have direct or indirect contact with border arrivals and quarantine residents will greatly reduce the chance of another outbreak. • These tests should be conducted by a health professional with knowledge of COVID-19 symptoms to reduce false negatives and help diagnose probable cases. • If the first detected case of COVID-19 is in a frontline worker, there is a high probability that the outbreak is still very small and can be contained by fast case isolation and contact tracing. • If the first detected case of COVID-19 is in an individual without a direct link to arrivals or quarantine facilities, then an immediate local lockdown may be necessary to contain the outbreak. • If the first detected case of COVID-19 is in an individual who is a household contact of a frontline worker and does not themselves have direct contact with the quarantine process, this should be treated in the same way as community transmission and strong community-wide social distancing measures, possible a regional return to a high alert level, should be considered. • This applies even if the first detected community cases is a household contact of a frontline worker because it means there is a high risk the frontline worker has already infected others. • Well-managed 14 day quarantine, with minimal interactions between travellers beyond family groups, and tests on day 3 and day 12 provides a very good safeguard against infected travellers initiating community outbreaks. Abstract In an attempt to maintain elimination of COVID-19 in New Zealand, all international arrivals are required to spend 14 days in government-managed quarantine and to return a negative test result before being released. We model the testing, isolation and transmission of COVID-19 within quarantine facilities to estimate the risk of community outbreaks being seeded at the border. We use a simple branching process model for COVID-19 transmission that includes a time-dependent probability of a false
Transcript of Managing the risk of a COVID-19 outbreak from border arrivals

Note: This paper has not yet undergone formal peer review
Managing the risk of a COVID-19 outbreak from border arrivals
20 August 2020
Alex James1,4, Michael J. Plank1,4, Rachelle N. Binny2,4, Shaun C. Hendy3,4, Audrey Lustig2,4, Nicholas Steyn1,3,4
1. School of Mathematics and Statistics University of Canterbury, New Zealand. 2. Manaaki Whenua, Lincoln, New Zealand. 3. Department of Physics, University of Auckland, New Zealand. 4. Te Pūnaha Matatini: the Centre for Complex Systems and Networks, New Zealand.
Executive Summary and recommendations
• Weekly testing of all workers who have direct or indirect contact with border arrivals and quarantine residents will greatly reduce the chance of another outbreak.
• These tests should be conducted by a health professional with knowledge of COVID-19 symptoms to reduce false negatives and help diagnose probable cases.
• If the first detected case of COVID-19 is in a frontline worker, there is a high probability that the outbreak is still very small and can be contained by fast case isolation and contact tracing.
• If the first detected case of COVID-19 is in an individual without a direct link to arrivals or quarantine facilities, then an immediate local lockdown may be necessary to contain the outbreak.
• If the first detected case of COVID-19 is in an individual who is a household contact of a frontline worker and does not themselves have direct contact with the quarantine process, this should be treated in the same way as community transmission and strong community-wide social distancing measures, possible a regional return to a high alert level, should be considered.
• This applies even if the first detected community cases is a household contact of a frontline worker because it means there is a high risk the frontline worker has already infected others.
• Well-managed 14 day quarantine, with minimal interactions between travellers beyond family groups, and tests on day 3 and day 12 provides a very good safeguard against infected travellers initiating community outbreaks.
Abstract
In an attempt to maintain elimination of COVID-19 in New Zealand, all international arrivals are required to spend 14 days in government-managed quarantine and to return a negative test result before being released. We model the testing, isolation and transmission of COVID-19 within quarantine facilities to estimate the risk of community outbreaks being seeded at the border. We use a simple branching process model for COVID-19 transmission that includes a time-dependent probability of a false

Page | 1
Te Pūnaha Matatini The University of Auckland Private Bag 92019 Auckland 1011 New Zealand
negative test result. We show that the combination of 14-day quarantine with two tests reduces risk of releasing an infectious case to around 0.1% per infected arrival. Shorter quarantine periods, or reliance on testing only with no quarantine, substantially increase this risk. We calculate the ratio of cases detected in the first week of quarantine to cases detected in the second week and show that this may be a useful indicator of the likelihood of transmission occurring within quarantine facilities. Frontline staff working at the border risk exposure to infected individuals and this has the potential to lead to a community outbreak. We use the model to test surveillance strategies and evaluate the likely size of the outbreak at the time it is first detected. We conclude with some recommendations for managing the risk of potential future outbreaks originating from the border.
Introduction
In mid-July New Zealand’s COVID-19 re-emergence plan for dealing with new cases detected beyond managed isolation and quarantine facilities was announced. The plan emphasises the importance of acting rapidly and robustly to ring-fence the virus in order to avoid a substantial second outbreak. It also includes the options of local lockdowns and wider community testing should any significant new clusters occur. However, the maintenance of New Zealand’s COVID-19 free status is currently reliant on the management of quarantined arrivals from overseas. Frontline staff working in airports or managed quarantine and isolation facilities are vital in this line of defence against future outbreaks. Indeed, in August 2020, a community outbreak was detected in Auckland. At the time of writing, the source of this outbreak has not been identified, but there is a strong possibility that it is linked to a managed isolation or quarantine facility. It is important to understand the risks of reintroduction via such facilities, as it is to develop surveillance measures to detect any such a reintroduction as rapidly as possible.
Models of COVID-19 in New Zealand have so far not considered the rate of arrival of COVID-19 cases from overseas and the effect of various border measures in reducing the risk of these cases being released into the community. Assessment of the risk is critical because, with almost all domestic restrictions relaxed since elimination of the virus from New Zealand in June 2020, a community outbreak could grow very rapidly. This is illustrated in the recent outbreak of COVID-19 in Melbourne, Australia, which is thought to have originated from close contacts between residents and workers in government-mandated quarantine facilities. The Melbourne outbreak serves as a timely reminder of the importance of minimising the risk to frontline workers in government-managed quarantine facilities and also at all points of contact between quarantined border arrivals and the community. The staff in these roles include securely-employed highly-trained health professionals, who administer regular COVID-19 swab tests, full-time defence staff who manage emergency fire evacuations, through to less-secure contract staff who clean or provide transport to quarantine facilities. As these individuals comprise our current front line of defence against a second major outbreak of COVID-19 and a possible return to lockdowns, whether local or otherwise, it is worth spending considerable effort to minimise all risk wherever possible. In this study, we introduce models for two potential routes for reincursion of COVID-19 into New Zealand. These models describe the incubation, transmission, and testing of quarantined residents and frontline border staff. The first model is used to consider the risk that international arrivals themselves pose, while the second looks at managing the risks associated with frontline workers coming into contact with recent international arrivals. We use the first model for exploring the risk of releasing infectious arrivals into the community under different scenarios. Key outcomes include: the probability of cases being undetected and the infectiousness of any undetected cases after being released from quarantine. We propose a metric that can be used to estimate the level of transmission occurring internally within quarantine facilities. We evaluate possible policy decisions and their

Page | 2
Te Pūnaha Matatini The University of Auckland Private Bag 92019 Auckland 1011 New Zealand
potential outcomes, e.g. introducing special exemptions, cohort demarcation, and shortening the mandatory quarantine period.
With the second model, we consider transmission into the community from a single seed case in a frontline worker. We estimate the number of exposed cases that could result from this by the time the outbreak is first detected. We consider two scenarios: one where the outbreak is first detected in the original seed case, and one where it is first detected in a secondary case (i.e. a contact of the frontline worker) or later. We consider three transmission routes (household contacts, work/casual contacts, and environmental transmission) and quantify the number of expected cases that result. This serves to quantify the risk of a serious outbreak depending on how the outbreak is first detected and the transmission route involved.
Previous work by Wilson et al. (2020) considered the levels of community surveillance at healthcare facilities that would be required to detect new outbreaks early enough to stop a large outbreak. Here we do not explicitly consider general community surveillance or testing of those seeking healthcare. Instead, we examine the targeted testing of individuals at the highest risk of seeding an outbreak, namely frontline workers. We make recommendations for testing regimes for all frontline staff that minimise the risk of future outbreaks and provide analysis that could be used to make decisions on future lockdowns to prevent a widespread community outbreak.
Methods
We use a continuous-time branching process to model the number of infections, with a single initial seed case representing an infected frontline staff member (James 2020). All parameter values are given in Table 1. When an individual is infected they develop symptoms on average 5.5 days (s.d. 2.3 days) after exposure. With no other surveillance in place, after a short delay they will be tested and provided the test does not give a false negative the case will be detected at that point. The expected time between symptom onset and a positive test result in the New Zealand case data is approximately six days. We assume individuals in quarantine, frontline workers and their families have a higher awareness of symptoms and get tested more quickly (on average two days from symptom onset to test result) than members of the public (on average six days). Casual contacts of frontline workers follow the population average. Secondary cases infected via environmental transmission are assumed to have very low awareness and take, on average, 10 days to be get tested. Testing is fast and results are received on the same day. We assume that, until the test result is received, the person does not isolate or quarantine and will continue to infect others. Due to variation between individuals, the high chance of a false negative test result, asymptomatic individuals and, in some scenarios, a low testing rate, the first detected case may not be the seed case. The model includes no self-isolation measures as we are interested only the initial time period before contact tracing and isolation measures have been initiated.
The key model assumptions are:
• Each infection is randomly assigned as subclinical with probability 𝑝!"# and clinical with probability 1 − 𝑝!"#, independent of the index case. Once assigned as clinical or subclinical, individuals remain in this category for the duration of their infectious period. There is no correlation between the clinical status of the index case and the clinical status of the secondary cases.

Page | 3
Te Pūnaha Matatini The University of Auckland Private Bag 92019 Auckland 1011 New Zealand
• Each infected individual 𝑖 causes a randomly generated number 𝑁$~𝑁𝑒𝑔𝐵𝑖𝑛(𝑅$ , 𝑘) of new infections. For clinical individuals the mean number of exposures, 𝑅$ = 𝑅%&$' and for subclinical individuals, 𝑅$ = 𝑅!"#, which is assumed to be 50% of 𝑅%&$' (Davies, Kucharski, et al., 2020). 𝑘 = 0.5 is the overdisperson parameter (Lloyd-Smith et al., 2005). This allows for some superspreading events and an increased probability an individual will infect no secondary cases.
• There is no superspreading within quarantine facilities, i.e. 𝑁$~𝑃𝑜𝑖𝑠𝑠(𝑅$). • The time between an individual becoming infected and infecting another individual, the
generation time 𝑇(, is Weibull distributed with mean and median equal to 5.0 days and standard deviation of 1.9 days (Ferretti et al., 2020). The infection times of all 𝑁$ secondary infections from individual 𝑖 are independent, identically distributed random variables from this distribution.
• The model does not explicitly include a latent period. However, the shape of the Weibull generation time distribution captures this effect, giving a low probability of a short generation time between infections.
• Infected individuals are randomly assigned an infection route depending on the type of contact: household (the index and secondary case reside in the same household); casual (the index and secondary case have had direct contact outside the home); or environmental (there has been no direct contact between the index and secondary case and transmission is via a contaminated surface). These are weighted by the relative attack rates for each contact route, 𝑤)*"+,.
• The model has no fixed household size as we are only interested in the very initial stages where only one or two household members are typically infected.
• The incubation period, i.e. the time between an individual becoming infected and developing symptoms, is Gamma distributed with mean 5.51 days and standard deviation 2.28 days (Lauer et al., 2020).
• The probability of a symptomatic individual getting tested is 𝑝-,+,%+. • For individuals who are tested, the time between developing symptoms and receiving the test
result is Gamma distributed. The mean of this distribution depends on the infection route, the standard deviation is 80% of the mean.
• If frontline workers and their immediate family get tested, they will, on average, present for testing quickly. Casual contacts have some awareness but have a longer expected time. Individuals infected by environmental transmission take the longest to be tested.
• Two community awareness scenarios are investigated: low community awareness where only 50% of individuals (including frontline workers) ever present for testing; high community awareness, where
• The time between symptom onset and testing for casual contacts is taken from data on New Zealand cases from March-May 2020.
• Tests have a probability of returning a false negative that depends on the time since infection (Kucirka, Lauer, Laeyendecker, Boon, & Lessler, 2020). This false negative probability is lowest eight days after infection (~20%).
• Tests with symptom checks, which are only performed on frontline workers in certain scenarios, are assumed to be less likely to return a false negative more than 8 days after exposure than a standard test. More than 10 days after exposure they have a zero false negative rate. This assumption reflects diagnosis of “probable” cases based on clinical assessment in the absence of a positive test result.
Page | 4
Te Pūnaha Matatini The University of Auckland Private Bag 92019 Auckland 1011 New Zealand
Parameter Value Source Distribution of generation times
𝑊𝑒𝑖𝑏𝑢𝑙𝑙(𝑠𝑐𝑎𝑙𝑒 = 5.67, 𝑠ℎ𝑎𝑝𝑒 = 2.83) (Ferretti et al., 2020)
Distribution of exposure to onset (days)
Γ(𝑠𝑐𝑎𝑙𝑒 = 0.95, 𝑠ℎ𝑎𝑝𝑒 = 5.8) (Lauer et al., 2020)
Relative infectiousness of subclinical cases
𝑅!"#/𝑅%&$' = 50% (Davies, Klepac, et al., 2020; Davies, Kucharski, et al., 2020)
Reproduction number for clinical infections
𝑅%&$' = 2.5 Estimated
Reproduction number for clinical infections inside quarantine
𝑅./0 = [0.1, 0.5] See scenarios
Superspreading dispersion parameter (outside quarantine only)
𝑘 = 0.5 James REF
Proportion of subclinical infections
𝑝!"# = 0.33 (Davies, Klepac, et al., 2020)
Relative positive test probability for subclinical infections
𝑝+,!+!"#%&$' = 0.65 Kucharski REF
Proportion of cases detected 𝑝-,+,%+ = [1, 0.5] See scenarios Relative secondary attack rates outside quarantine
𝑤1*"!,1*&2 = 0.11 𝑤%3!"3& = 0.05
𝑤,'4$)*'5,'+3& = 0.01
(Ferretti et al., 2020)
Distribution of time from symptom onset to test result (days)
Quarantined individuals, frontline workers and their household contacts
Γ(𝜇 = 2, 𝜎 = 0.8𝜇)
Casual contacts Γ(𝜇 = 6.75, 𝜎 = 0.8𝜇) Environmental contacts Γ(𝜇 = 10, 𝜎 = 0.8𝜇)
Casual taken from NZ data
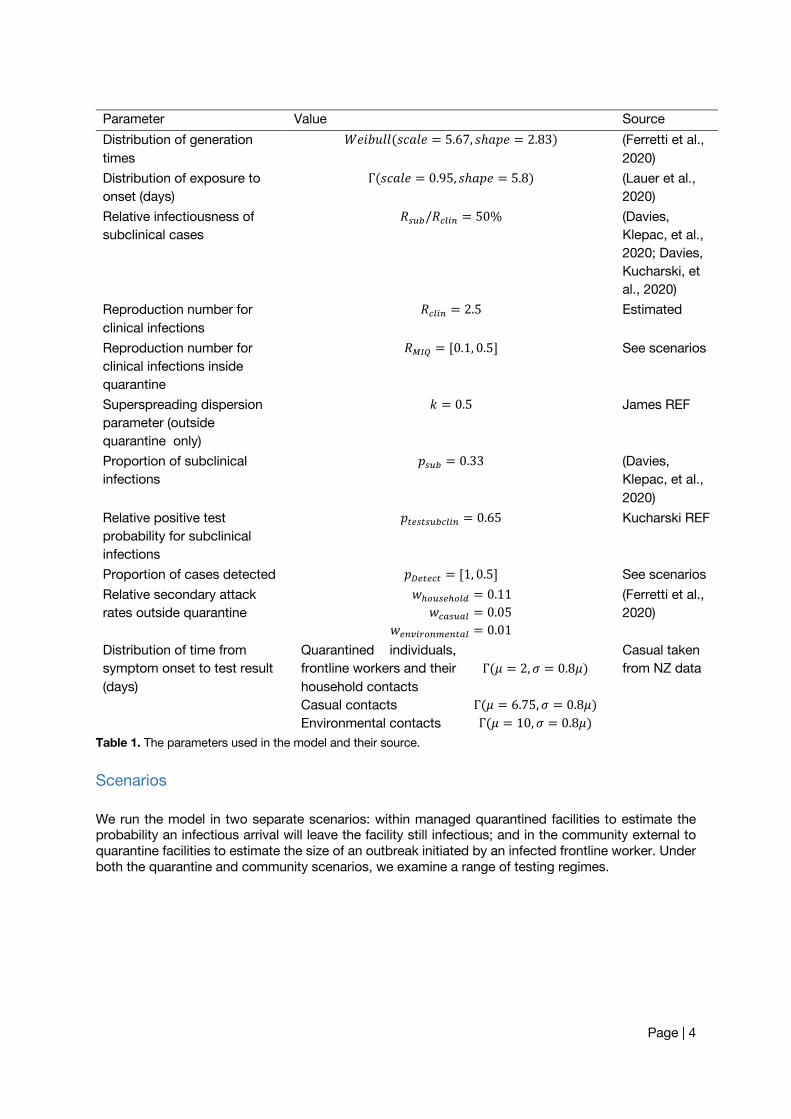
Table 1. The parameters used in the model and their source.
Scenarios
We run the model in two separate scenarios: within managed quarantined facilities to estimate the probability an infectious arrival will leave the facility still infectious; and in the community external to quarantine facilities to estimate the size of an outbreak initiated by an infected frontline worker. Under both the quarantine and community scenarios, we examine a range of testing regimes.

Page | 5
Te Pūnaha Matatini The University of Auckland Private Bag 92019 Auckland 1011 New Zealand
Quantifying the risk of a border arrival leaving quarantine whilst infectious
Figure 1: The probability of an infected international arrival being released into the community whilst A) infectious (within 14 days of exposure) or B) very infectious (within 5 days of exposure) under two different rates of transmission within managed isolation and quarantine facilities.
All international arrivals to New Zealand are required to spend 14 days in a government-managed isolation and quarantine facility during which they are tested twice (around day 3 and day 12 after arrival). No individual is allowed to leave quarantine without returning at least one negative test result. We investigate the risk of an infectious individual being released into the community under this regime and under alternative quarantine and testing regimes: testing of travellers only on departure and arrival; 5-day quarantine with testing on day 3; 14-day quarantine with no scheduled testing. We also investigate the potential effect of transmission of the virus among individuals within quarantine. We assume that any individual testing positive is completely isolated and not released until fully recovered. Individuals that are infected during their stay in quarantine could be at any point in their stay, i.e. there is no attempt to group returning travellers by arrival date. The key model output is therefore the probability of an infected individual reaching the end of their stay in quarantine without having returned a positive test result.
14-day quarantine with two tests. The current regime of 14-day quarantine with testing on day 3 and day 12, and assuming moderate transmission within quarantine facilities, means that the risk of an infectious individual being released into the community is around 2% (Figure 1A). The risk of a highly infectious individual (within 5 days of exposure) leaving quarantine is lower at 1% (Figure 1B). This is the probability per infected arrival, i.e. it is expected that one infectious individual will be released for every 1000 infected arrivals on average. With a significant risk of transmission due to mixing within quarantine, the risk of a highly infectious person entering the community increases to 7% per infected arrival. With no internal transmission all individuals are no longer considered infectious (i.e. they were exposed more than 14 days ago) when leaving.
Departure and arrival testing only. Tests on departure from the home country and on arrival in New Zealand with no mandatory quarantine period mean that approximately 50% of infected arrivals will be isolated on arrival (Figure 1A). This assumes individuals with symptom onset and self-referred test date before departure do not travel, and that travel to NZ takes approximately one day on average.

Page | 6
Te Pūnaha Matatini The University of Auckland Private Bag 92019 Auckland 1011 New Zealand
This very low detection rate reflects the high probability of a false negative test particular during the first five days after infection before symptom onset. These individuals are also likely to be highly infectious (i.e. within 5 days of exposure) when they enter the community (Fig 1B). With only a very limited window for internal transmission (approximately one day) the level of internal transmission makes very little difference. This shows that a testing-only policy would pose a very high risk to the community.
5-day quarantine with one test. A stay of 5 days in quarantine facilities with a test on day 3 reduces the probability of a highly infectious individual entering the community. With moderate internal transmission around 26% of individuals will leave whilst infectious. This still poses a high risk to the community: around one in four infected arrivals will still be infectious on leaving quarantine and around 1 in 35 will be very infectious. If there is significant transmission within the quarantine facility this probability increases to around 38% infectious when leaving quarantine and over 15% highly infectious.
14-day quarantine with no scheduled testing. With no testing and a 14 day quarantine period the probability of an infectious person leaving quarantine is 4% or 28% under moderate or high transmission respectively. Under the moderate transmission scenario this is comparable to 14 days with two tests. However, if internal transmission rates are high the additional testing gives a large decrease in risk. The risk of a very infectious person leaving is not significantly changed by removing the two tests from the 14 day quarantine period.
Measuring the risk of transmission within quarantine facilities The ratio of cases detected in the second week to cases detected in the first week is a measurable indicator of potential transmission within quarantine. Although noisy, tracking this value over time gives some insight into the level of transmission among individuals in quarantine facilities. If this ratio increases substantially, then internal procedures should be evaluated. Under the scenarios described here we would expect 19% of cases to test positive during week 2 with moderate internal transmission and 31% under high transmission. Community outbreak seeded by a frontline worker We consider four scenarios, each with two different levels of community awareness: high, where 100% of infected symptomatic individuals will be detected, and low, where 50% of the infected symptomatic individuals, including frontline workers, will never be detected. The latter might be the result of reduced public awareness or lack of community testing, for instance. The four scenarios are:
• No regular frontline worker testing. There is no regular scheduled testing of frontline staff but they do have an increased awareness of COVID-19 symptoms, which is reflected in a shorter average time between symptom onset and testing in those that get tested.
• Fortnightly testing of frontline workers. In addition to an increased awareness of symptoms, frontline staff receive fortnightly tests. These tests have the same false negative rates as tests for the general population.
• Weekly testing of frontline workers. In addition to an increased awareness of symptoms, frontline staff receive weekly tests. These tests have the same false negative rates as tests for the general population.
• Weekly testing and symptom checks of frontline workers: Symptom checks administered only at the time of testing decrease the chance of a false negative for symptomatic cases in frontline workers more than 8 days after exposure, and any test on a symptomatic frontline
Page | 7
Te Pūnaha Matatini The University of Auckland Private Bag 92019 Auckland 1011 New Zealand
worker more than 10 days after exposure is guaranteed a positive test result (i.e. they would be declared a “probable” case and acted on accordingly).
Model outputs are: (i) the transmission route of the first detected case; (ii) the number of additional infected individuals when the first case is detected; and (iii) the length of time between infection of the seed cases and the first case being detected.
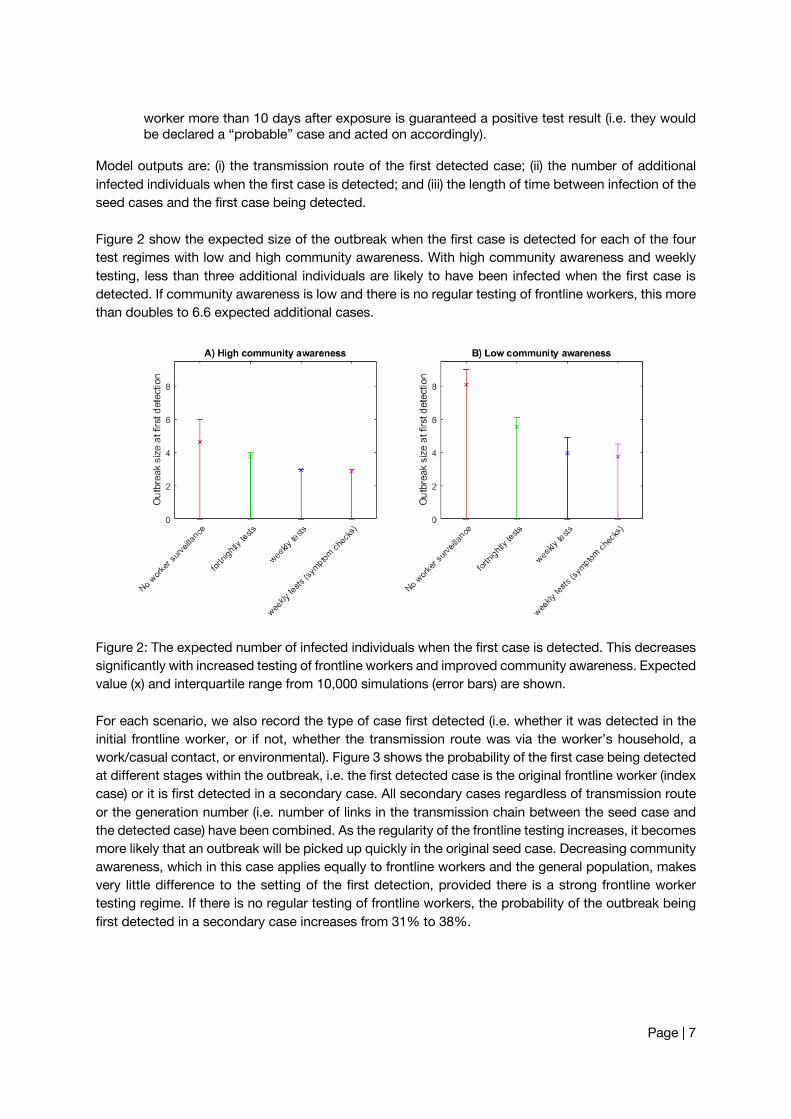
Figure 2 show the expected size of the outbreak when the first case is detected for each of the four test regimes with low and high community awareness. With high community awareness and weekly testing, less than three additional individuals are likely to have been infected when the first case is detected. If community awareness is low and there is no regular testing of frontline workers, this more than doubles to 6.6 expected additional cases.
Figure 2: The expected number of infected individuals when the first case is detected. This decreases significantly with increased testing of frontline workers and improved community awareness. Expected value (x) and interquartile range from 10,000 simulations (error bars) are shown.
For each scenario, we also record the type of case first detected (i.e. whether it was detected in the initial frontline worker, or if not, whether the transmission route was via the worker’s household, a work/casual contact, or environmental). Figure 3 shows the probability of the first case being detected at different stages within the outbreak, i.e. the first detected case is the original frontline worker (index case) or it is first detected in a secondary case. All secondary cases regardless of transmission route or the generation number (i.e. number of links in the transmission chain between the seed case and the detected case) have been combined. As the regularity of the frontline testing increases, it becomes more likely that an outbreak will be picked up quickly in the original seed case. Decreasing community awareness, which in this case applies equally to frontline workers and the general population, makes very little difference to the setting of the first detection, provided there is a strong frontline worker testing regime. If there is no regular testing of frontline workers, the probability of the outbreak being first detected in a secondary case increases from 31% to 38%.

Page | 8
Te Pūnaha Matatini The University of Auckland Private Bag 92019 Auckland 1011 New Zealand
Figure 3: The probability of a secondary case being detected at different stages of the outbreak. When there is a strong testing regime for frontline workers the probability of an outbreak being detected in the index case is high.
Knowing whether the outbreak was first detected in a frontline worker or not (i.e. detected in the seed cases or in a secondary case) gives a valuable indicator as to the expected current size of the outbreak when it is first detected. Figure 4 shows the expected size of the outbreak given the stage at which the epidemic is detected. Regardless of community awareness level and testing regime, if the first detected case is the seed case, i.e. the frontline worker, the size of the outbreak is likely still to be small, possibly less than three additional infections. If the first detected case is a secondary case, this includes household infections, then the outbreak is expected to be much larger, between 10 and 17 individuals depending predominantly on the community awareness level.
Figure 4: Expected exposures by stage of outbreak. Outbreaks detected in a secondary rather than seed case will be significantly larger. Expected value (x) and interquartile range from 10,000 simulations (error bars) are shown.

Page | 9
Te Pūnaha Matatini The University of Auckland Private Bag 92019 Auckland 1011 New Zealand
Finally, we use the model to predict the probability that an individual infected in one region has travelled to another region. The key model outputs are the number of cases 𝑁% infected before the first case was detected and the number of infectious days 𝐷$ (𝑖 = 1,… ,𝑁%) for each of these new cases before the first detection. Together, these give the total number of opportunities for daily travel by any infected individual. This can be combined with the population size of Region A and the number of individuals that travel to Region B each day to estimate the probability that an infected individual has travelled from Region A to Region B before the first case was detected and travel restrictions could potentially be put in place.
𝑃(𝑎𝑛𝑖𝑛𝑓𝑒𝑐𝑡𝑒𝑑𝑝𝑒𝑟𝑠𝑜𝑛ℎ𝑎𝑠𝑡𝑟𝑎𝑣𝑒𝑙𝑙𝑒𝑑𝑓𝑟𝑜𝑚𝐴𝑡𝑜𝐵) = 1 − W1 −𝑟𝑀Y
/! (1)
where
• 𝑟 is the number of individuals travelling from A to B each day • 𝑀 is the population size of region A (number of people normally present in region A at one
time) • 𝐼- is the total number of infectious days: 𝐼- =∑ 𝐷$
6"$78
• 𝐷$ is the number of days case 𝑖 was infectious for before the outbreak was detected.
The model assumes that every individual in the region, including those infected, has an equal probability (𝑟/𝑀) of travelling between regions each day. An important limitation is that the model ignores heterogeneity in travel patterns. However, as we do not have data on this, we assume that travel patterns are homogeneous within a region. Another caveat is that this method estimates the probability that an infected individual has travelled to Region B, not the probability they have passed the virus on to someone else in Region B. The latter will depend on the time since the traveller was infected, individual heterogeneity in contact rates, the length of stay in Region B, and potential correlations among these variables. We do not have data on length of stay so we do not attempt to quantify this, but we note the probability of onward transmission in Region B will be less than the probability of travel to Region B, so our results provide a conservative estimate of the risk of spread.
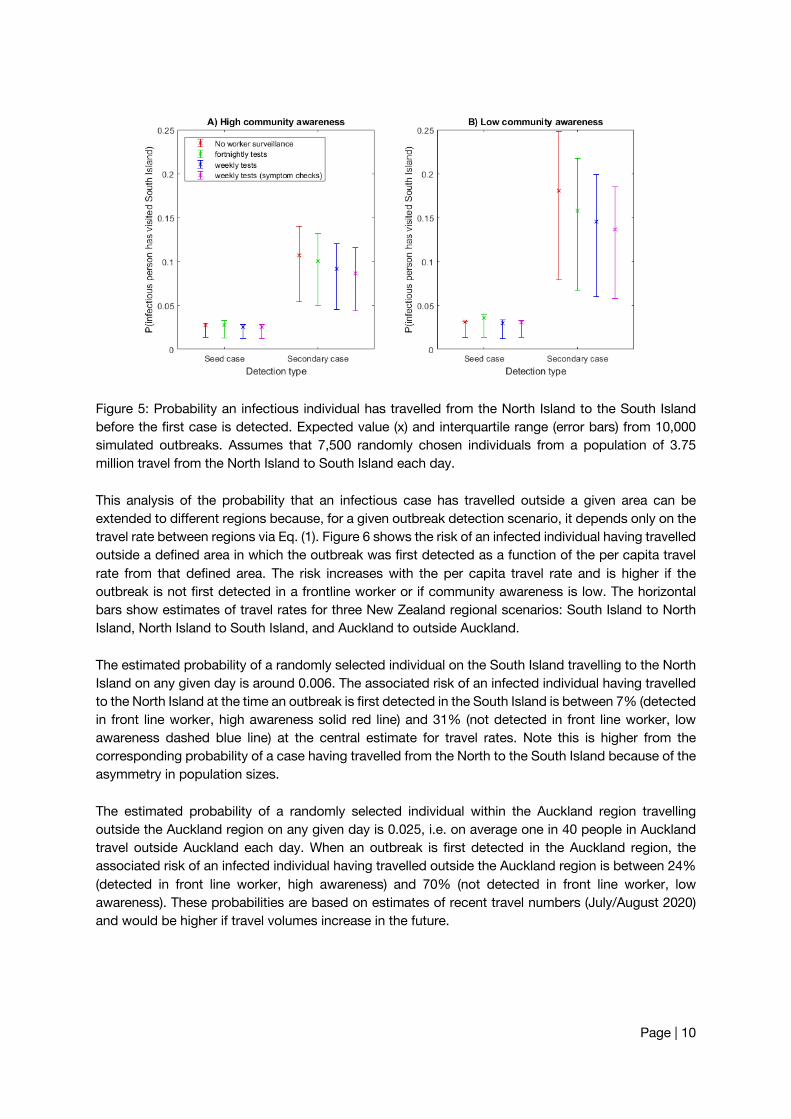
Figure 5 shows the probability that an infected individual from an outbreak that originated on the North Island has travelled to the South Island before the first case was detected. This assumes the population of the North Island is 3.75 million and that 7,500 randomly selected people travel from the North Island to the South Island each day. If the outbreak is first detected in a frontline border worker, the probability is approximately 3% regardless of the level of community awareness. However, if the outbreak is first detected in an individual who is not a frontline worker, the probability is much higher. When community awareness is high, i.e. all symptomatic individuals get tested, the probability of an infectious individual having travelled is 11% on average, and up to 15% for a large outbreak. If community awareness is low, i.e. only 50% of symptomatic individuals get tested, the probability is 13-16% on average (depending on stringency of frontline worker testing) and up to 22% for a large outbreak.
Page | 10
Te Pūnaha Matatini The University of Auckland Private Bag 92019 Auckland 1011 New Zealand
Figure 5: Probability an infectious individual has travelled from the North Island to the South Island before the first case is detected. Expected value (x) and interquartile range (error bars) from 10,000 simulated outbreaks. Assumes that 7,500 randomly chosen individuals from a population of 3.75 million travel from the North Island to South Island each day.
This analysis of the probability that an infectious case has travelled outside a given area can be extended to different regions because, for a given outbreak detection scenario, it depends only on the travel rate between regions via Eq. (1). Figure 6 shows the risk of an infected individual having travelled outside a defined area in which the outbreak was first detected as a function of the per capita travel rate from that defined area. The risk increases with the per capita travel rate and is higher if the outbreak is not first detected in a frontline worker or if community awareness is low. The horizontal bars show estimates of travel rates for three New Zealand regional scenarios: South Island to North Island, North Island to South Island, and Auckland to outside Auckland.
The estimated probability of a randomly selected individual on the South Island travelling to the North Island on any given day is around 0.006. The associated risk of an infected individual having travelled to the North Island at the time an outbreak is first detected in the South Island is between 7% (detected in front line worker, high awareness solid red line) and 31% (not detected in front line worker, low awareness dashed blue line) at the central estimate for travel rates. Note this is higher from the corresponding probability of a case having travelled from the North to the South Island because of the asymmetry in population sizes.
The estimated probability of a randomly selected individual within the Auckland region travelling outside the Auckland region on any given day is 0.025, i.e. on average one in 40 people in Auckland travel outside Auckland each day. When an outbreak is first detected in the Auckland region, the associated risk of an infected individual having travelled outside the Auckland region is between 24% (detected in front line worker, high awareness) and 70% (not detected in front line worker, low awareness). These probabilities are based on estimates of recent travel numbers (July/August 2020) and would be higher if travel volumes increase in the future.

Page | 11
Te Pūnaha Matatini The University of Auckland Private Bag 92019 Auckland 1011 New Zealand
Figure 6. Risk of an infected individual having travelled from region A to region B before the outbreak is first detected as a function of the travel rate from region A to region B. The different curves show different levels of community awareness (red = high awareness, blue = low awareness) and different detection settings (first detected in frontline worker = solid, first detected elsewhere = dashed). Travel rate is measured as the number of people that travel from region A to region B per day divided by the population size of region A. Horizontal black bars indicate the range of travel rates for three regional scenarios: outbreak detected in the North Island, risk of an infected individual having travelled to the South Island (NI -> SI); outbreak detected in the South Island, risk of an infected individual having travelled to the North Island (SI -> NI); outbreak detected in the Auckland region, risk of an infected individual having travelled outside the Auckland region (AKL -> other). Travel volumes per day: between the North and South Islands 7000 – 8500; between Auckland and the rest of New Zealand 35,000 – 45,000. Population sizes: North Island 3.75 million; South Island 1.25 million; Auckland region 1.6 million.
Small variations in the parameters chosen make very little change to the qualitative results. For example, increasing or decreasing the probability of being subclinical (25%-40%), and using a similar published infection kernel (Du et al., 2020) gave minor numerical changes but made no difference to the overall message that weekly testing with symptom checks is a substantial improvement on no testing or even fortnightly testing. In all parameter explorations there was a substantial increase in the expected number of exposures if the first detected case was not in the frontline worker.
Discussion
For international arrivals at the border, the safest regime analysed was by far the 14 day stay in managed isolation or quarantine with two tests. Combined with complete isolation of confirmed cases, this regime reduces the risk of an infectious case being released into the community to approximately 0.1% per arriving case. Significantly reducing the length of stay in quarantine would increase the risk

Page | 12
Te Pūnaha Matatini The University of Auckland Private Bag 92019 Auckland 1011 New Zealand
of a highly infectious individual entering the community. Relying on testing alone with no quarantine would be much higher risk.
The greatest reduction in risk associated with quarantined international arrivals can be obtained by minimising mixing among guests in the facilities. This can be achieved by eliminating shared spaces such as smoking and exercise areas. Evidence suggests that speaking, especially while exercising, can substantially increase the chances of transmission (Buonanno et al, 2020). Removing the possibility of contacts between guests in quarantine facilities reduces the probability that someone acquires the disease during their stay and remains undetected. It also allows special exemptions to operate with significantly reduced risk, and results in lower overall infection in the facility, so the risk to frontline workers is reduced.
The ratio of cases detected in the second week of quarantine to cases detected in the first week is an effective indicator of the level of transmission among individuals staying in quarantine facilities. The absolute value of this ratio is difficult to estimate due to sensitivity to key modelling assumptions. The ratio is also likely to be noisy when calculated from real data, especially with small sample size. Despite this, it is a useful metric to track over time, and an upward trend in this ratio should be considered an indicator that transmission is potentially taking place.
The risk of a frontline worker inadvertently seeding a major outbreak can be significantly reduced by a combined weekly test and symptom check by a trained professionals. Clearly this should be undertaken alongside measures that minimise the risk of a frontline worker becoming infected, including training of frontline workers in infection control, supply and correct use of effective protective personal equipment, cleaning potentially infected surfaces and eliminating all close contacts between frontline workers and individuals in quarantine and isolation.
The test for SARS-CoV-2 is invasive and unpleasant. Repeated testing on individuals, particular those at low risk may be unpopular. A recent study (Menni et al., 2020) of over 2.6 million individuals tested a smart phone app to assess symptoms. The best fit model had a 69% positive prediction rate, implying that this method would likely miss 30% of symptomatic cases and all asymptomatic cases. This is a slightly lower rate of false negatives than PCR testing of symptomatic individuals, but nonetheless comparable. However, the symptom checker results did not state at what point in the course of the illness the model was applied, i.e. late onset symptoms may be needed to achieve this level of accuracy.
If the first case is detected is not a frontline worker, it is likely that are a significant number of other infections will have occurred at the time of the first detection. In these circumstances, the likely number of secondary and tertiary infections is large enough that an immediate local lockdown may be necessary in order to bring the outbreak under control. This is the case even if the first detected case is a household contact of a frontline worker, because at this stage in the outbreak it will be likely that there are other infections beyond the worker’s household.
These findings apply to all workers who have contact with quarantined arrivals, whether direct or indirect. Workers who experience only indirect or environmental contact with quarantined individuals have a lower overall risk of being infected, but once infected the consequences are the same. New Zealand’s COVID-19 free status depends on its ability to contain all cases at the border. While the controls investigated here may seem onerous, in the long run they are likely to be a preferable alternative to local, or even national, lockdowns.

Page | 13
Te Pūnaha Matatini The University of Auckland Private Bag 92019 Auckland 1011 New Zealand
We did not model superspreaders or superspreading events inside quarantine facilities, as these are unlikely to occur in this environment. It is possible that communal spaces and surfaces (such as buses, elevators, reception areas, door handles) could provide an avenue for environmental transmission. This would effectively correspond to an increase in the mean number of contacts parameter in the model, but is unlikely to cause superspreading events given the restrictions on individual movements. Nevertheless, communal spaces and surfaces should be regularly cleaned and good hand hygiene encouraged to minimise the possibility of environmental transmission. Supershedders (individual heterogeneity in infectiousness) can increase the risk of release an infectious case, but this effect is small providing existing procedures are followed. We did not explicitly model families or other groups travelling together. It is possible that these will increase the number of cases detected in the second week because of transmission between people staying in the same room, but for the purposes of measuring widespread transmission in quarantine should not be considered in the ratio calculation.
Acknowledgements
The authors acknowledge the support of StatsNZ, ESR, and the Ministry of Health in supplying data in support of this work. The authors would also like to thank Samik Datta, Nigel French, Markus Luczak-Roesch, Anja Mizdrak and Matt Parry for informal peer review comments on an earlier version of part of this manuscript. This work was funded by the New Zealand Ministry of Business, Innovation and Employment and Te Pūnaha Matatini, Centre of Research Excellence in Complex Systems.
References
Davies, N. G., Klepac, P., Liu, Y., Prem, K., Jit, M., Eggo, R. M., & group, C. C.-w. (2020). Age-dependent effects in the transmission and control of COVID-19 epidemics. MedRxiv.
Davies, N. G., Kucharski, A. J., Eggo, R. M., Gimma, A., Edmunds, W. J., & Group, C. C.-W. (2020). The effect of non-pharmaceutical interventions on COVID-19 cases, deaths and demand for hospital services in the UK: a modelling study. MedRxiv.
Du, Z., Xu, X., Wu, Y., Wang, L., Cowling, B. J., & Meyers, L. A. (2020). Serial interval of COVID-19 among publicly reported confirmed cases. Emerging infectious diseases, 26(6), 1341.
Ferretti, L., Wymant, C., Kendall, M., Zhao, L., Nurtay, A., Abeler-Dörner, L., . . . Fraser, C. (2020). Quantifying SARS-CoV-2 transmission suggests epidemic control with digital contact tracing. Science, 368(6491).
James, A., Plank, M. J., Binny, R. N., Hannah, K., Hendy, S. C., Lustig, A. and Steyn, N. “A structured model for COVID-19 spread: modelling age and healthcare inequities” MedRxiv https://doi.org/10.1101/2020.05.17.20104976 (2020).
Kucirka, L. M., Lauer, S. A., Laeyendecker, O., Boon, D., & Lessler, J. (2020). Variation in false-negative rate of reverse transcriptase polymerase chain reaction–based SARS-CoV-2 tests by time since exposure. Annals of internal medicine.
Lauer, S. A., Grantz, K. H., Bi, Q., Jones, F. K., Zheng, Q., Meredith, H. R., . . . Lessler, J. (2020). The incubation period of coronavirus disease 2019 (COVID-19) from publicly reported confirmed cases: estimation and application. Annals of internal medicine, 172(9), 577-582.
Menni, C., Valdes, A. M., Freidin, M. B., Sudre, C. H., Nguyen, L. H., Drew, D. A., . . . Moustafa, J. S. E.-S. (2020). Real-time tracking of self-reported symptoms to predict potential COVID-19. Nature medicine, 1-4.

Page | 14
Te Pūnaha Matatini The University of Auckland Private Bag 92019 Auckland 1011 New Zealand
Wilson, N., Schwehm, M., Verrall, A. J., Parry, M., Baker, M. G., & Eichner, M. (2020). Detecting the Emergent or Re-Emergent COVID-19 Pandemic in a Country: Modelling Study of Combined Primary Care and Hospital Surveillance. MedRxiv.