MANAGING SUPPLY CHAIN AND OPERATIONS SUPPLY CHAIN AND OPERATIONS An Integrative Approach S. Thomas...
26
MANAGING SUPPLY CHAIN AND OPERATIONS An Integrative Approach S. Thomas Foster Donald L. Staheli Professor and Department Chair of Marketing and Global Supply Chain Marriott School of Management Brigham Young University Scott Sampson Hazel S. Thorsell Professor and Area Leader of Global Supply Chain Management Marriott School of Management Brigham Young University Cindy Wallin Associate Professor of Global Supply Chain Management Marriott School of Management Brigham Young University Scott Webb Assistant Professor of Global Supply Chain Management Marriott School of Management Brigham Young University SECOND EDITION New York, NY A01_FOST9830_02_SE_FM.indd 1 10/11/17 2:50 PM
Transcript of MANAGING SUPPLY CHAIN AND OPERATIONS SUPPLY CHAIN AND OPERATIONS An Integrative Approach S. Thomas...

MANAGING SUPPLY CHAIN AND OPERATIONSAn Integrative Approach
S. Thomas FosterDonald L. Staheli Professor and Department Chair
of Marketing and Global Supply ChainMarriott School of ManagementBrigham Young University
Scott SampsonHazel S. Thorsell Professor and Area Leader of
Global Supply Chain ManagementMarriott School of ManagementBrigham Young University
Cindy WallinAssociate Professor of Global Supply Chain
ManagementMarriott School of ManagementBrigham Young University
Scott WebbAssistant Professor of Global Supply Chain
ManagementMarriott School of ManagementBrigham Young University
S E C O N D E D I T I O N
New York, NY
A01_FOST9830_02_SE_FM.indd 1 10/11/17 2:50 PM

Vice President, Business, Economics, and UK Courseware: Donna Battista
Director of Portfolio Management: Stephanie WallEditorial Assistant: Linda Siebert AlbelliVice President, Product Marketing: Roxanne McCarleySenior Product Marketer: Product Marketer: Kaylee CarlsonProduct Marketing Assistant: Marianela SilvestriManager of Field Marketing, Business Publishing:
Adam GoldsteinExecutive Field Marketing Manager: Field Marketing
Manager: Nicole PriceVice President, Production and Digital Studio, Arts and
Business: Etain O’DeaDirector of Production, Business: Jeff HolcombManaging Producer, Business: Melissa FeimerContent Producer: Yasmita HotaOperations Specialist: Carol Melville
Design Lead: Kathryn FootManager, Learning Tools: Brian SuretteContent Developer, Learning Tools: Lindsey SloanManaging Producer, Digital Studio and GLP, Media
Production and Development: Ashley SantoraManaging Producer, Digital Studio: Diane LombardoDigital Studio Producer: Regina DaSilvaDigital Studio Producer: Alana ColesDigital Content Project Lead: Courtney KamaufProject Management: Thistle Hill Publishing ServicesInterior and Cover Design: Cenveo® Publisher ServicesCover Art: Steve Vidler/Alamy Stock Photo; Wavebreakmedia/
Shutterstock; Daryl Benson/Photodisc/Getty Images; PixieMe/Shutterstock; Foodcollection/Getty Images; Ixefra/Getty Images; Wavebreakmedia/Shutterstock
Printer/Binder: LSC Communications, Inc./ KendalvilleCover Printer: Phoenix Color/Hagerstown
ISBN 10: 0-13-473983-3
ISBN 13: 978-0-13-473983-0
Microsoft and/or its respective suppliers make no representations about the suitability of the information contained in the documents and related graphics published as part of the services for any purpose. All such documents and related graphics are provided “as is” without warranty of any kind. Microsoft and/or its respective suppliers hereby disclaim all warranties and conditions with regard to this information, including all warranties and conditions of merchantability, whether express, implied or statutory, fitness for a particular purpose, title and non-infringement. In no event shall Microsoft and/or its respective suppliers be liable for any special, indirect or consequential damages or any damages whatsoever resulting from loss of use, data or profits, whether in an action of contract, negligence or other tortious action, arising out of or in connection with the use or performance of information available from the services.
The documents and related graphics contained herein could include technical inaccuracies or typographical errors. Changes are periodically added to the information herein. Microsoft and/or its respective suppliers may make improvements and/or changes in the product(s) and/or the program(s) described herein at any time. Partial screen shots may be viewed in full within the software version specified.
Microsoft® and Windows® are registered trademarks of the Microsoft Corporation in the U.S.A. and other countries. This book is not sponsored or endorsed by or affiliated with the Microsoft Corporation.
Copyright © 2019, 2016 by Pearson Education, Inc. or its affiliates. All Rights Reserved. Manufactured in the United States of America. This publica-tion is protected by copyright, and permission should be obtained from the publisher prior to any prohibited reproduction, storage in a retrieval system, or transmission in any form or by any means, electronic, mechanical, photocopying, recording, or otherwise. For information regarding permissions, request forms, and the appropriate contacts within the Pearson Education Global Rights and Permissions department, please visit www.pearsoned.com/permissions/.
Acknowledgments of third-party content appear on the Credits page, which constitutes an extension of this copyright page.
PEARSON, ALWAYS LEARNING, and MYLAB are exclusive trademarks owned by Pearson Education, Inc. or its affiliates in the U.S. and/or other countries.
Unless otherwise indicated herein, any third-party trademarks, logos, or icons that may appear in this work are the property of their respective owners, and any references to third-party trademarks, logos, icons, or other trade dress are for demonstrative or descriptive purposes only. Such references are not intended to imply any sponsorship, endorsement, authorization, or promotion of Pearson’s products by the owners of such marks, or any relationship between the owner and Pearson Education, Inc., or its affiliates, authors, licensees, or distributors.
Library of Congress Cataloging-in-Publication DataNames: Foster, S. Thomas, author.Title: Managing supply chain and operations : an integrative approach / S. Thomas Foster, Brigham Young University, Scott Sampson, Brigham Young University, Cindy Wallin, Brigham Young University, Scott Webb, Brigham Young University.Description: Second Edition. | New York : Pearson, NY. [2017] | Revised edition of the authors’ Managing supply chain and operations, [2016] | Includes bibliographical references and index.Identifiers: LCCN 2017050842| ISBN 9780134739830 (hardcover) | ISBN 0134739833 (hardcover) Subjects: LCSH: Production management. | Production control. | Business logistics—Management. | Industrial management.Classification: LCC TS155 .F67 2017 | DDC 658.5—dc23LC record available at https://lccn.loc.gov/2017050842
1 17
A01_FOST9830_02_SE_FM.indd 2 10/11/17 2:50 PM

For Camille—T. F.
For Kristen—S. S.
For David and Joyce Wallin—C. W.
For my best friend, Mary—S. W.
A01_FOST9830_02_SE_FM.indd 3 10/11/17 2:50 PM

iv
S. Thomas Foster is the Donald Staheli Professor and department chair of marketing and global supply chain management at Brigham Young University’s Marriott School of Manage-ment. He is an internationally recognized expert in quality and global supply chain manage-ment and has experience in manufacturing, financial services, and international oil exploration. He has consulted for more than 30 organizations, including Eaton/Cutler Hammer, Hewlett-Packard, Heinz Frozen Foods, Hyundai Corporation, and the U.S. Department of Energy.
Foster has served on the editorial boards of the Journal of Operation Management and Decision Sciences and is Editor in Chief of the Quality Management Journal. He has published more than 80 articles in journals such as Decision Sciences, Journal of Operations Management, International Journal of Production Research, and Quality Management Journal. His book Quality Management: Integrating the Supply Chain is an international best seller. He recently served on the Malcolm Baldrige Board of Overseers and was awarded the prestigious Instructional Innovation Award from the Decision Sciences Institute.
Scott Sampson is the Hazel S. Thorsell Professor of global supply chain management with the Marriott School of Management at Brigham Young University. He teaches MBA, executive MBA, and undergraduate courses in services management and customer relationship management.
Sampson is the author of the books Understanding Service Businesses and Essentials of Service Design and Innovation. His award-winning research involves service design paradigms, service quality measurement, and service supply chains. He has published research in leading aca-demic journals, including Management Science, Production and Operations Management, Operations Research, Decision Sciences, and Journal of Operations Management. He received his MBA and PhD degrees from the University of Virginia and taught at Florida State University prior to joining the Brigham Young University faculty.
Cindy Wallin is an associate professor of global supply chain management at Brigham Young University’s Marriott School of Management. She earned her PhD in supply chain manage-ment from the W. P. Carey School of Business at Arizona State University. Wallin’s research focuses on buyer-supplier interfaces in the form of trust-based relationships, information sharing, collaboration, and collaborative inventory management approaches. Her research has been published in various journals, including Decision Sciences Journal, Journal of Supply Chain Management, Quality Management Journal, and Journal of Business Logistics.
Before pursuing her doctoral studies, Wallin was a commodity team manager for Intel Corporation. During her eight years at Intel, she also held the positions of senior buyer, purchasing manager, stores manager, and commodity manager. Before her graduate studies, Wallin also worked as an auditor for the Defense Contract Audit Agency.
Scott Webb is an associate professor of global supply chain management at Brigham Young University and specializes in logistics management. He received his PhD in logistics and oper-ations management from the Eli Broad College of Business at Michigan State University. In addition to his PhD, he earned an MS degree in logistics management from the Air Force Institute of Technology and a BA in experimental psychology from the College of Idaho.
During his Air Force career, Webb worked on both base- and Pentagon-level assign-ments. He separated from active duty military service in 2008 at the rank of major and after earning both AF Commendation Medals and the AF Meritorious Service Medal.
About the Authors
A01_FOST9830_02_SE_FM.indd 4 10/11/17 2:50 PM

Improving Supply Chain and Operations Management Performance 339
Chapter 12 Project Management 340
Chapter 13 Supply Chain Quality Management 381
Chapter 14 Statistical Process Control 409
Chapter 15 Lean and Six Sigma Management and Leading Change 452
Innovating Supply Chain and Operations 47
Chapter 3 Product and Process Design and Mapping 48
Chapter 4 Service Design 92
Chapter 5 Customer Relationship Management 120
v
Brief Contents
Integrating Supply Chain and Operations Management 1
Chapter 1 Introduction to Supply Chain and Operations Management 2
Chapter 2 Supply Chain and Operations Strategy 21
1
2
Impacting Supply Chain and Operations Performance 141
Chapter 6 Strategic Sourcing 142
Chapter 7 Supplier Management 166
Chapter 8 Demand Management and Forecasting 195
Chapter 9 Inventory Management Fundamentals and Independent Demand 242
Chapter 10 Sales and Operations Planning and Enterprise Resource Planning 273
Chapter 11 Logistics 305
3
4
A01_FOST9830_02_SE_FM.indd 5 10/11/17 2:50 PM

vi
Changes in Strategy 30Types of Relationships 31
4 Execute Strategy 32Aligning Strategic Levels 32Aligning Incentives 33Focusing on Process 34
5 Understand and Apply Strategic Metrics and Measurements 36Correct Strategic Behavior 36Actionable and Predictive Metrics 36Commonly Used Supply Chain Metrics 37Systems Thinking 37
6 Describe the Changing Strategic Environment 38Analytics 38Globalization 38Sustainability 39Innovation 40
Summary 43 • Key Terms 44 • Integrative Learning Exercise 44 • Integrative Experiential Exercise 45 • Discussion Questions 45
●Case: Zara 46
Innovating Supply Chain and Operations 47
Chapter 3 Product and Process Design and Mapping 481 Understand and Explain the Steps of Process Design 49
Processes and Extended Processes 49Process Choice 50The Process Continuum 51Break-Even Analysis 54
SOLVED PROBLEM 3.1 > Using Break-Even Analysis to Evaluate an Investment in Processes and Equipment 55
2 Understand and Explain the Steps of Process Mapping and Layout Planning 56Extended Process Maps for Supply Chains 57Hybrid Layouts 57Line Balancing 61
SOLVED PROBLEM 3.2 > Line Balancing in Action 62Designing Functional Layouts 65
SOLVED PROBLEM 3.3 > Load-Distance Model in Action 66
SOLVED PROBLEM 3.4 > Muther’s Grid in Action 68
3 Illustrate the Different Elements of Product Design 69Product Life Cycle 70Research and Development 71Product Design Process 71
4 Understand and Employ Quality Function Deployment 74Concurrent Design Teams 75Design for Manufacture Method 75Design for Maintainability 76Designing for Reliability 77
SOLVED PROBLEM 3.5 > Series Reliability 79
2
Preface xvi
Integrating Supply Chain and Operations Management 1
Chapter 1 Introduction to Supply Chain and Operations Management 21 Understand Why You Are Studying Supply Chain and Operations Management 3
Processes 4Supply Chain Globalization 5
2 Define, Understand, and Apply the Components of Supply Chain and Operations Management 8Supply Chain Management 9Supply Chain Flows 10Service Supply Chains 11Operations Management 11Combining Supply Chain and Operations Management 12Developing Skills for Your Career 14
3 Explain the Integrative Model for Supply Chain and Operations Management 15The Operating Core 15Upstream Collaboration 16Downstream Collaboration 16Logistics, Analytics, and Quality Management 17Strategic Integration 17
4 Explain the Four I’s 17Impacting 17Improving 17Innovating 17Integrating 18Supplier Responsibility at Apple 18
Summary 18 • Key Terms 19 • Integrative Learning Exercise 19 • Integrative Experiential Exercise 19 • Discussion Questions 19
●Case: Williamston Manufacturing 20
Chapter 2 Supply Chain and Operations Strategy 211 Understand and Use Generic SC&O Strategies 22
Generic Strategies 22Alignment 23Assessing Customer Value 25
2 Explain How to Apply SC&O Strategy Process and Content 26Hoshin Kanri Strategic Planning 27SC&O Strategy Content 27
3 Supply Chain Strategy 30
1
Contents
A01_FOST9830_02_SE_FM.indd 6 10/11/17 2:50 PM
Contents vii
Changes in Strategy 30Types of Relationships 31
4 Execute Strategy 32Aligning Strategic Levels 32Aligning Incentives 33Focusing on Process 34
5 Understand and Apply Strategic Metrics and Measurements 36Correct Strategic Behavior 36Actionable and Predictive Metrics 36Commonly Used Supply Chain Metrics 37Systems Thinking 37
6 Describe the Changing Strategic Environment 38Analytics 38Globalization 38Sustainability 39Innovation 40
Summary 43 • Key Terms 44 • Integrative Learning Exercise 44 • Integrative Experiential Exercise 45 • Discussion Questions 45
●Case: Zara 46
Innovating Supply Chain and Operations 47
Chapter 3 Product and Process Design and Mapping 481 Understand and Explain the Steps of Process Design 49
Processes and Extended Processes 49Process Choice 50The Process Continuum 51Break-Even Analysis 54
SOLVED PROBLEM 3.1 > Using Break-Even Analysis to Evaluate an Investment in Processes and Equipment 55
2 Understand and Explain the Steps of Process Mapping and Layout Planning 56Extended Process Maps for Supply Chains 57Hybrid Layouts 57Line Balancing 61
SOLVED PROBLEM 3.2 > Line Balancing in Action 62Designing Functional Layouts 65
SOLVED PROBLEM 3.3 > Load-Distance Model in Action 66
SOLVED PROBLEM 3.4 > Muther’s Grid in Action 68
3 Illustrate the Different Elements of Product Design 69Product Life Cycle 70Research and Development 71Product Design Process 71
4 Understand and Employ Quality Function Deployment 74Concurrent Design Teams 75Design for Manufacture Method 75Design for Maintainability 76Designing for Reliability 77
SOLVED PROBLEM 3.5 > Series Reliability 79
2
A01_FOST9830_02_SE_FM.indd 7 10/11/17 2:50 PM

viii Contents
2 Learn the Techniques to Improve Customer Service 127Understanding and Meeting Customer Expectations 127Providing Fail-Safe Services 128Providing Service Guarantees 128Measuring Service Performance 129Managing Customer Complaints 131
SOLVED PROBLEM 5.1 > Net Promoter Scores in Action 131Recovering from Service Failures 132
3 Change Relationships through Servitization 134
4 Manage Service Supply Chains 135
Summary 137 • Key Terms 138 • Integrative Learning Exercise 138 • Integrative Experiential Exercise 138 • Discussion Questions 138 • Solved Problem 139 • Problems 139
●Case: Can CRM Help a New Start-Up Business? 140
Impacting Supply Chain and Operations Performance 141
Chapter 6 Strategic Sourcing 1421 Understand the Origins of the Purchasing Profession 144
2 Describe the Effect of Strategic Sourcing on a Firm 145Reducing the Cost of Purchased Products and Services 145
SOLVED PROBLEM 6.1 > Economics of Purchasing 146The Quality of Purchased Goods and Services 147Cost of Development and Design 148
3 Apply the Portfolio Approach to Strategic Sourcing 149Category Segmentation 149Routine Items 151Leverage Items 151Bottleneck Items 152Critical Items 152
4 Master the Tools of Strategic Cost Management 152Spend Analysis 153Price Analysis 154
SOLVED PROBLEM 6.2 > Price Analysis in Action 154Cost Analysis 155Total Cost of Ownership Analysis 155
SOLVED PROBLEM 6.3 > Total Cost of Ownership 156Total Cost of Ownership and Outsourcing Decisions 158
SOLVED PROBLEM 6.4 > Total Cost of Ownership and Outsourcing 158
Summary 159 • Key Terms 160 • Integrative Learning Exercise 160 • Integrative Experiential Exercise 160 • Discussion Questions 160 • Solved Problems 161 • Problems 163
●Case: Hazeltonn Industries 164
Chapter 7 Supplier Management 1661 Understand the Importance of Identifying and Applying the Correct Specification
for Materials, Services, and Type of Business Relationship 168
3
SOLVED PROBLEM 3.6 > Reliability Measurement Failure Rates 79
SOLVED PROBLEM 3.7 > System Availability 80
5 Apply Green Design to Your Process and Product Design 81Design for Reuse 81Other Green Design Concepts 81
Summary 82 • Key Terms 83 • Integrative Learning Exercise 83 • Integrative Experiential Exercise 84 • Discussion Questions 84 • Solved Problems 84 • Problems 87
●Case: Hamilton Electronics 90
Chapter 4 Service Design 921 Understand the Relationships between Services and Tangibles 93
2 Identify and Apply the Key Elements of Service Design 94Designing for Service Quality 95Designing for Service Recovery 96B2B versus B2C Services 96Customer-Interactive Processes 97Offerings and Experiences 97
3 Understand and Apply the Process Chain Network (PCN) Tool for Service Design 98Process Chain Networks 99Process Positioning 100Three Process Principles 101Steps in Developing a PCN Diagram 102
SOLVED PROBLEM 4.1 > PCN Diagrams in Action 102
4 Describe and Use the Planning Service Capacity for Uncertain Demand 103Capacity Components 103Capacity Planning Tools 105
SOLVED PROBLEM 4.2 > The Newsvendor Problem in Action 106
5 Apply Queuing Theory 107Queuing Psychology 107Queue Systems and Service Stations 107Wait Times 108
SOLVED PROBLEM 4.3> Model I in Action for a Single-Phase Queue with a Single Server and Exponential Service Times 110
SOLVED PROBLEM 4.4 > Model II in Action for a Single-Phase Queue with a Single Server and Constant Service Times 110
SOLVED PROBLEM 4.5 > Model III in Action for a Multiserver System with Exponential Service Times 111
Summary 113 • Key Terms 114 • Integrative Learning Exercise 114 • Integrative Experiential Exercise 114 • Discussion Questions 114 • Solved Problems 115 • Problems 116
●Case: XLG Enterprises 118
Chapter 5 Customer Relationship Management 1201 Understand and Apply Customer Relationships and Systems 121
Customer Relationship Management Systems 122Customer Relationships 123CRM Processes 126
A01_FOST9830_02_SE_FM.indd 8 10/11/17 2:50 PM
Contents ix
2 Learn the Techniques to Improve Customer Service 127Understanding and Meeting Customer Expectations 127Providing Fail-Safe Services 128Providing Service Guarantees 128Measuring Service Performance 129Managing Customer Complaints 131
SOLVED PROBLEM 5.1 > Net Promoter Scores in Action 131Recovering from Service Failures 132
3 Change Relationships through Servitization 134
4 Manage Service Supply Chains 135
Summary 137 • Key Terms 138 • Integrative Learning Exercise 138 • Integrative Experiential Exercise 138 • Discussion Questions 138 • Solved Problem 139 • Problems 139
●Case: Can CRM Help a New Start-Up Business? 140
Impacting Supply Chain and Operations Performance 141
Chapter 6 Strategic Sourcing 1421 Understand the Origins of the Purchasing Profession 144
2 Describe the Effect of Strategic Sourcing on a Firm 145Reducing the Cost of Purchased Products and Services 145
SOLVED PROBLEM 6.1 > Economics of Purchasing 146The Quality of Purchased Goods and Services 147Cost of Development and Design 148
3 Apply the Portfolio Approach to Strategic Sourcing 149Category Segmentation 149Routine Items 151Leverage Items 151Bottleneck Items 152Critical Items 152
4 Master the Tools of Strategic Cost Management 152Spend Analysis 153Price Analysis 154
SOLVED PROBLEM 6.2 > Price Analysis in Action 154Cost Analysis 155Total Cost of Ownership Analysis 155
SOLVED PROBLEM 6.3 > Total Cost of Ownership 156Total Cost of Ownership and Outsourcing Decisions 158
SOLVED PROBLEM 6.4 > Total Cost of Ownership and Outsourcing 158
Summary 159 • Key Terms 160 • Integrative Learning Exercise 160 • Integrative Experiential Exercise 160 • Discussion Questions 160 • Solved Problems 161 • Problems 163
●Case: Hazeltonn Industries 164
Chapter 7 Supplier Management 1661 Understand the Importance of Identifying and Applying the Correct Specification
for Materials, Services, and Type of Business Relationship 168
3
A01_FOST9830_02_SE_FM.indd 9 10/11/17 2:50 PM

x Contents
Identifying the Need for Materials 168Identifying the Need for Services 169Identifying the Need for a Type of Relationship 169
2 Make Informed Supplier Selection Decisions 171Identifying Supplier Requirements with Weighted-Factor Analysis 172
SOLVED PROBLEM 7.1 > Creating a Weighted-Factor Analysis 174Searching for Potential Suppliers 175Supplier Evaluation 176
SOLVED PROBLEM 7.2 > Supplier Evaluation Using Weighted-Factor Analysis 176Negotiating the Agreement 178
3 Create and Develop Constructive Supplier Relationships 179Identifying Suppliers to Develop 179Forming a Cross-Functional Team 180Involving Top Management 180Identifying Opportunities 180Defining Key Metrics and Cost Sharing 181Agreeing on Projects and Resources 181Monitoring Status and Modifying 181
4 Provide Constructive Supplier Feedback 183Designing and Implementing the Supplier Scorecard 183
SOLVED PROBLEM 7.3 > Supplier Scorecard Design 184Delivery and Cost Assessment 186Supplier Awards 187
Summary 188 • Key Terms 189 • Integrative Learning Exercise 189 • Integrative Experiential Exercise 189 • Discussion Questions 189 • Solved Problems 190 • Problems 191
●Case: Rockhurst Company 194
Chapter 8 Demand Management and Forecasting 1951 Apply the Fundamentals of Demand Management 197
2 Understand and Apply Time Series Forecasting 200Components of a Time Series 200Forecasting and Bullwhips 201Types of Forecasting Models 202Judgmental or Experiential Forecasting 202
3 Understand and Apply Naive Forecasting Methods 205Simple Moving Average 205
SOLVED PROBLEM 8.1 > Using the Moving Average 205Weighted Moving Average 206
SOLVED PROBLEM 8.2 > Weighted Moving Average 206Single Exponential Smoothing 207
SOLVED PROBLEM 8.3 > Single Exponential Smoothing 208Double Exponential Smoothing 209
SOLVED PROBLEM 8.4 > Double Exponential Smoothing 209Measures of Forecasting Error 210
SOLVED PROBLEM 8.5 > Measures of Forecasting Error 211
4 Understand and Apply Time Series Forecasting Using Regression 212Time Series Forecasts Using Simple Linear Regression 213
SOLVED PROBLEM 8.6 > Using Simple Linear Regression 214
A01_FOST9830_02_SE_FM.indd 10 10/11/17 2:50 PM

Contents xi
Linear Regression with Seasonality 216
SOLVED PROBLEM 8.7 > Deseasonalizing a Time Series 218Econometric and Multiple Regression Models 222
Summary 226 • Key Terms 227 • Integrative Learning Exercise 227 • Integrative Experiential Exercise 227 • Discussion Questions 227 • Solved Problems 228 • Problems 234
●Case: Demand Planning at BIOCNG 241
Chapter 9 Inventory Management Fundamentals and Independent Demand 2421 Define the Roles and Types of Inventory 243
The Role of Inventory 243Types of Inventory 245
2 Understand Important Inventory Concepts 247Inventory Velocity 247
SOLVED PROBLEM 9.1 > Computing Inventory Turnover 247Consignment Inventory 248Vendor-Managed Inventory 249Inventory and Bullwhips 249
3 Understand, Perform, and Apply Demand Analysis 250Dependent versus Independent Demand 250ABC Analysis 250
SOLVED PROBLEM 9.2 > Performing ABC Inventory Analysis 251Review Systems 254
4 Explain and Apply Inventory Models 256The Basic Economic Order Quantity Model 256
SOLVED PROBLEM 9.3 > Total Annualized Inventory Costs 256
SOLVED PROBLEM 9.4 > The Economic Order Quantity in Action 257Quantity Discounts 258
SOLVED PROBLEM 9.5 > Using EOQ with Quantity Discounts 259Reorder Points 260
SOLVED PROBLEM 9.6 > Computing a Reorder Point with Deterministic Lead Time 260
SOLVED PROBLEM 9.7 > Reorder Point with Stochastic Demand during Lead Time 261Periodic Review Inventory Models 262A Finite Replenishment Rate Inventory Model 262
SOLVED PROBLEM 9.8 > Using the Periodic Review Inventory Model 262A Finite Replenishment Rate Inventory Model 262
SOLVED PROBLEM 9.9 > Using the Finite Replenishment Rate Model 263
Summary 264 • Key Terms 265 • Integrative Learning Exercise 265 • Integrative Experiential Exercise 265 • Discussion Questions 266 • Solved Problems 266 • Problems 269
●Case: Managing Inventory at Nordstrom 272
Chapter 10 Sales and Operations Planning and Enterprise Resource Planning 2731 Apply Sales and Operations Planning 274
Production Planning 275Performing Sales and Operations Planning 277
A01_FOST9830_02_SE_FM.indd 11 10/11/17 2:50 PM

xii Contents
Summary 330 • Key Terms 330 • Integrative Learning Exercise 330 • Integrative Experiential Exercise 331 • Discussion Questions 331 • Solved Problems 331 • Problems 333
●Case: Brentward Logistics 336
Improving Supply Chain and Operations Management Performance 339
Chapter 12 Project Management 3401 Understand Project Management 341
The Human Element in Projects 342Qualifying Projects 346Project Charters 348
SOLVED PROBLEM 12.1 > Project Charters in Action 350
2 Utilize Project Planning Tools 350Estimating Task Completion Times 350
SOLVED PROBLEM 12.2 > Computing Task Times 352
SOLVED PROBLEM 12.3 > Computing Task Variance 352
SOLVED PROBLEM 12.4 > Putting It Together: Task Times and Variances 353Managing Multiple Projects 354
3 Plan and Control Projects Using PERT/CPM 355
SOLVED PROBLEM 12.5 > Drawing AON Networks 356Finding the Critical Path 356Computing Early Times 357Computing Late Times 358Computing Slack and the Critical Path 358
SOLVED PROBLEM 12.6 > Finding the Critical Path 360Using PERT/CPM in Delegation Decisions 361Probabilistic PERT 361
SOLVED PROBLEM 12.7 > Computing Required Project Completion Times 364
SOLVED PROBLEM 12.8 > The Other Side of the Coin: Determining the Probability of Completing a Project in a Given Time 365
4 Learn How to Manage Costs of Projects through Gantt Charts 366Managing Costs and Expediting Projects 366Expediting or Crashing Tasks 368
SOLVED PROBLEM 12.9 > Crashing Projects 369
Summary 370 • Key Terms 371 • Integrative Learning Exercise 371 • Integrative Experiential Exercise 371 • Discussion Questions 371 • Solved Problems 372 • Problems 377
●Case: Getting the Ducks in a Row for Project Management 380
Chapter 13 Supply Chain Quality Management 3811 Understand the Importance of Product Quality Dimensions 382
2 Discuss the Basics of Quality Management as Espoused by Deming, Juran, Crosby, and Ishikawa 384W. Edwards Deming 384Joseph Juran 385
4
SOLVED PROBLEM 10.1 > A Chase Plan in Action 278
SOLVED PROBLEM 10.2 > A Level Plan in Action 279
2 Define and Explain How Capacity Functions in Operations Management 281Bottlenecks 282Best Operating Level 282
3 Understand and Apply Capacity Planning 283Capacity Planning Process 284Modeling Capacity 285
SOLVED PROBLEM 10.3 > Modeling Capacity Measures 286
SOLVED PROBLEM 10.4 > Rough-Cut Capacity Planning in Action 286Rough-Cut Capacity Planning 286
4 Understand the Main Functionality of an Enterprise Resource Planning System 287
5 Understand and Apply Material Requirements Management 288MRP Inputs 288MRP Record 290
SOLVED PROBLEM 10.5 > MRP Record Computations 290MRP Logic 291
SOLVED PROBLEM 10.6 > Rolling Cart MRP Logic 292MRP Outputs 294
Summary 295 • Key Terms 296 • Integrative Learning Exercise 296 • Integrative Experiential Exercise 296 • Discussion Questions 296 • Solved Problems 297 • Problems 301
●Case: Montclair State University 303
Chapter 11 Logistics 3051 Understand the Strategic Importance of Logistics 306
Cost 307Flow 308Access 309Sustainability 310
2 Understand and Apply Fundamental Logistics Trade-Offs 312Cost-to-Cost Trade-Offs 312
SOLVED PROBLEM 11.1 > Cost-to-Cost Trade-Off Calculations 312Modal Trade-Offs 312Cost-to-Service Trade-Offs 313Landed Cost 313
SOLVED PROBLEM 11.2 > Landed Cost Trade-Off Calculations 314
3 List and Apply the Five Logistics Processes 315Demand Processing 315Inventory Management 317Transportation 318Warehousing 320
SOLVED PROBLEM 11.3 > Warehousing Square Root Rule in Action 321
SOLVED PROBLEM 11.4 > Weighted Center of Gravity in Action 323Transportation Method 323
SOLVED PROBLEM 11.5 > The Transportation Method in Action 324Configuring Logistics 326Structural Network 329Reverse Logistics 329
A01_FOST9830_02_SE_FM.indd 12 10/11/17 2:50 PM

Contents xiii
Summary 330 • Key Terms 330 • Integrative Learning Exercise 330 • Integrative Experiential Exercise 331 • Discussion Questions 331 • Solved Problems 331 • Problems 333
●Case: Brentward Logistics 336
Improving Supply Chain and Operations Management Performance 339
Chapter 12 Project Management 3401 Understand Project Management 341
The Human Element in Projects 342Qualifying Projects 346Project Charters 348
SOLVED PROBLEM 12.1 > Project Charters in Action 350
2 Utilize Project Planning Tools 350Estimating Task Completion Times 350
SOLVED PROBLEM 12.2 > Computing Task Times 352
SOLVED PROBLEM 12.3 > Computing Task Variance 352
SOLVED PROBLEM 12.4 > Putting It Together: Task Times and Variances 353Managing Multiple Projects 354
3 Plan and Control Projects Using PERT/CPM 355
SOLVED PROBLEM 12.5 > Drawing AON Networks 356Finding the Critical Path 356Computing Early Times 357Computing Late Times 358Computing Slack and the Critical Path 358
SOLVED PROBLEM 12.6 > Finding the Critical Path 360Using PERT/CPM in Delegation Decisions 361Probabilistic PERT 361
SOLVED PROBLEM 12.7 > Computing Required Project Completion Times 364
SOLVED PROBLEM 12.8 > The Other Side of the Coin: Determining the Probability of Completing a Project in a Given Time 365
4 Learn How to Manage Costs of Projects through Gantt Charts 366Managing Costs and Expediting Projects 366Expediting or Crashing Tasks 368
SOLVED PROBLEM 12.9 > Crashing Projects 369
Summary 370 • Key Terms 371 • Integrative Learning Exercise 371 • Integrative Experiential Exercise 371 • Discussion Questions 371 • Solved Problems 372 • Problems 377
●Case: Getting the Ducks in a Row for Project Management 380
Chapter 13 Supply Chain Quality Management 3811 Understand the Importance of Product Quality Dimensions 382
2 Discuss the Basics of Quality Management as Espoused by Deming, Juran, Crosby, and Ishikawa 384W. Edwards Deming 384Joseph Juran 385
4
A01_FOST9830_02_SE_FM.indd 13 10/11/17 2:50 PM

xiv Contents
Philip Crosby 387Kaoru Ishikawa 387
3 Understand Supply Chain Quality Management 387Forming Collaborative Relationships 389ISO 9000 and Industry-Specific Standards 389
4 Understand and Apply Quality in Services 390Service Quality Dimensions 391SERVQUAL 391
SOLVED PROBLEM 13.1 > SERVQUAL “Minding the Gap” Exercise 393Customer-Driven Excellence 393
5 Understand and Apply Quality Tools and Approaches 394Seven Basic Quality Tools 394The Malcolm Baldrige National Quality Award (MBNQA) 400Benchmarking 401
Summary 403 • Key Terms 404 • Integrative Learning Exercise 404 • Integrative Experiential Exercise 404 • Discussion Questions 405 • Solved Problems 405 • Problems 406
●Case: Corporate Universities: Teaching the Tools of Quality 407
Chapter 14 Statistical Process Control 4091 Articulate the Purposes of Statistical Quality Control and Statistical Thinking 410
2 Understand Process Stability 412Sampling and Inspection 413Types of Samples 413Inspection Methods 413
SOLVED PROBLEM 14.1 > Computing Inspection Ratios 415
3 Explain and Use Variables and Attributes Process Control Charts 415Understanding Control Charts 416A Generalized Procedure for Developing Process Charts 418Variables Control Charts 418
SOLVED PROBLEM 14.2 > Developing Charts 422
SOLVED PROBLEM 14.3 > Using Excel to Develop X Control Charts 423
SOLVED PROBLEM 14.4 > Developing R Charts 425
SOLVED PROBLEM 14.5 > Developing R Charts in Excel 426Attributes Control Charts 428
SOLVED PROBLEM 14.6 > Developing p Charts 430
4 Apply Control Charts 432Interpreting Control Charts 432
SOLVED PROBLEM 14.7 > Interpreting Control Charts 433Corrective Action 434Tampering with the Process 434Control Charts and Services 434
5 Perform Process Capability Analysis 434
SOLVED PROBLEM 14.8 > Capability Analysis 435
Summary 437 • Key Terms 437 • Integrative Learning Exercise 438 • Integrative Experiential Exercise 438 • Discussion Questions 438 • Solved Problems 438 • Problems 444
●Case: Meeting Standards in Software Quality 451
A01_FOST9830_02_SE_FM.indd 14 10/11/17 2:50 PM

Contents xv
Chapter 15 Lean and Six Sigma Management and Leading Change 4521 Define Six Sigma and Explain Its Various Roles 453
Six Sigma Roles 455DMAIC 456Business Cases 456
2 Understand and Use Lean 459Lean Solutions 459Lean Viewpoints 460Lean Philosophy 460
3 Apply Lean Practices 461Practicing Lean Production 462
SOLVED PROBLEM 15.1 > Determining the Number of Kanban Cards Needed 464Lean Workforce Practices 465Systemwide Solutions 467Lean Supply Chain Management 468
4 Familiarize Yourself with Change Management 468
Summary 469 • Key Terms 470 • Integrative Learning Exercise 470 • Integrative Experiential Exercise 470 • Discussion Questions 470 • Solved Problem 471 • Problems 471
●Case: Automotive Resources 471
Appendix A-1Glossary G-1Name Index I-1Subject Index I-3Photo Credits C-1
A01_FOST9830_02_SE_FM.indd 15 10/11/17 2:50 PM

xvi
EW TO THIS EDITIONWith this edition of Managing Supply Chain and Operations: An Integrative Approach, we wanted to up our game. Every new edition of a textbook must represent a step forward. We feel like we met that goal with this edition. At the same time, you will see that this edition maintains the strengths of the first edition with additional features.
N
Preface
• Analytics Emphasis We have added analytics to the core model in the book. We have also honed our focus on ana-lytics. For every quantitative example in the text, we have added analytics icons to show students that they are learn-ing tools they can use in their careers. We have also included discussion of the importance of analytics in the early parts of the book.
Understand and Employ Quality Function Deployment 79
MEASURING RELIABILITY In addition to the series reliability function we have discussed, there are other ways to evaluate reliability. These models take into account historical data and are helpful in evaluating the efficacy of products. Let’s discuss some basic reliability func-tions. Failure rate is measured as
failure rate =number of failures
units tested * number of hours tested (3.13)
Some care should be exercised in using Equation 3.13 because there is no distinction between continuous hours of testing or testing performed at separate times. For example, there is no difference in testing hours if five units are tested for 100 hours each or if one unit is tested for 500 hours. See SOLVED PROBLEM 3.6.
SYSTEM AVAILABILITY Remember that the failure rate is a useful measure for many prod-ucts. In Solved Problem 3.6, 2,500 hours between failures may not make sense because many products are never used that many hours. A useful measure for maintainability of a product is system availability, which considers both mean time between failures (MTBF) and a new sta-tistic, mean time to repair (MTTR), which is the mean number of hours it takes to repair the product. System availability (SA) gives us the “uptime” (or proportion of time the product functions properly) of a product or system. System availability is interesting because it fac-tors the importance of service into reliability calculations. If one supplier can get our system repaired in less time, we want to take that service into account (see SOLVED PROBLEM 3.7). The system availability formula is
SA =MTBF
MTBF + MTTR (3.14)
where
SA = system availabilityMTBF = mean time between failures
MTTR = mean time to repair
mean time to repair (MTTR)The mean number of hours it takes to repair the product.
system availability (SA)The “uptime” or proportion of time that a product or system functions properly.
< SOLVED PROBLEM 3.6 f(x)Reliability Measurement Failure Rates
Problem: Suppose that your manager asked you to test 25 ski exercise machines under strenu-ous conditions for 100 hours per machine. Of the 25 machines you tested, 3 experienced malfunctions during the test. What is the failure rate for the exercise machines?
Solution:
failure rate =3
25 * 100= 0.0012 failure per operating hour
< SOLVED PROBLEM 3.5 f(x)Series Reliability
Problem: Your manager has asked you to compute reliability for the following system.
A0.98
B0.99
D0.97
C0.90
Solution: The overall reliability for this system is
R = 0.98 * 0.99 * 0.90 * 0.97 = 0.847
M03_FOST9830_02_SE_C03.indd 79 20/07/17 5:52 PM
• Cutting Edge Almost all of the vignettes and examples in the book have been updated. For example, the forecast section includes discussion of the work being done to use social media to forecast trends and preferences. New supply chain and operations vignettes are used to amplify and contextualize the techniques and tools taught in the book. More up-to-date information is provided on our Managing Supply Chain and Operations Facebook page, includ-ing all source articles for every vignette in the text.
Is Big Data the Key to Better Forecasting?
As you will see in this chapter, a lot of forecasting requires the gathering of his-
torical data, which can be time consuming to gather and to analyze. However,
data is everywhere; it comes from social media, search engines, and online
retailing. Can this data provide a key to predicting the future? Giselle Guzman
thinks it can. She is the founder of Now-Cast Data Corp, a company that uses
big data and crowdsourcing to help create financial forecasts and trends.
For example, Now-Cast1 has found that by scrubbing data on prices
from online sources, it can predict inflation much more quickly than the
U.S. government can. By monitoring searches on the word inflation, it can better gauge
consumer expectations and worries relative to price increases.
Giselle has worked closely with eminent researchers in forecasting such as Nobel
Laureates Joseph Stiglitz and Lawrence Klein. She believes that there is wisdom in
crowds and that their data can be explored and analyzed on a moment-by-moment basis.
Analytics can be used to monitor this data, but external variables, such as terrorism or
natural disasters, can also be followed to adjust expectations. Next, machine learning can
be used to improve forecasting.
While the jury is still out concerning the use of big data in forecasting, it is intrigu-
ing to think that this data may be useful in predicting trends like future spending and
demand. In this chapter, we introduce you to forecasting methods that use data as a
foundation for decision making in firms. We’ll return to Now-Cast at the chapter’s end.
1Pisani, B., “Finding a Better Way to Do Economic Forecasting,” CNBC, 24 Mar. 2016.
All business planning starts with a forecast. You need a forecast to deter-mine how much financing you need, how much plant and equipment you need, how many employees you need, what type of systems to put in place, and everything else. Managers must make decisions based on data. The problem is that all forecasts are wrong.
Possibly the most common complaint in business is the inaccuracy of forecasts. This chapter is written based on the premise that all forecasts are wrong. Does that mean that we eliminate them? Does it mean that we distrust them? Of course not.
What it means is that, as a manager, you need to understand business forecasting for supply chain and operational purposes. If you understand the forecasting process, you can understand the assumptions behind a forecast—its strengths and weaknesses—to use the data for better-informed decision making. A forecast is an assertion about the future whose outcome you have not yet seen. Forecasting is the process of cre-ating that assertion about the future.
A product or service has independent demand when the demand does not rely on the demand for some other item. We contrast this with dependent demand, where the demand is calculated from the demand of some other parent or sibling item. Parent-dependent demand is illustrated Accuracy in forecasting is often elusive.
M08_FOST9830_02_SE_C08.indd 196 07/07/17 5:11 PM
A01_FOST9830_02_SE_FM.indd 16 10/11/17 2:50 PM
Preface xvii
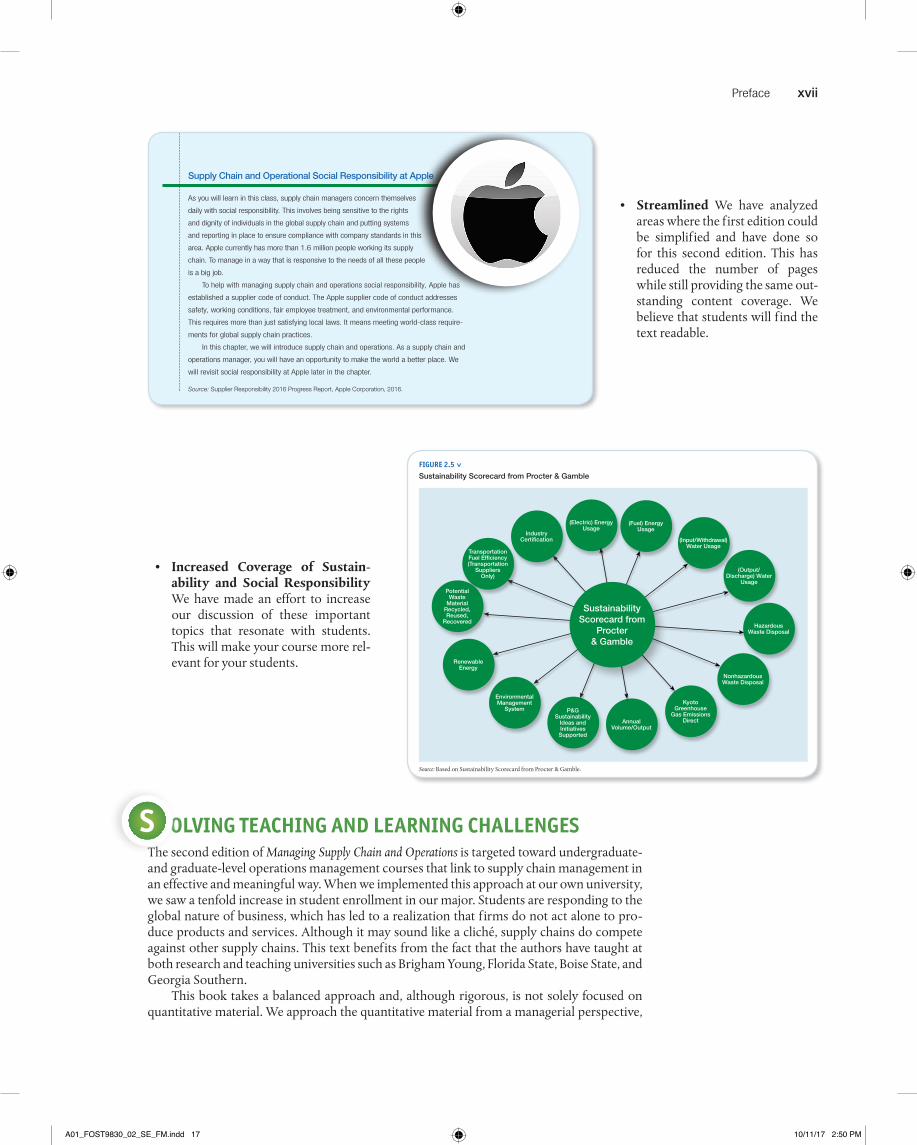
• Increased Coverage of Sustain-ability and Social Responsibility We have made an effort to increase our discussion of these important topics that resonate with students. This will make your course more rel-evant for your students.
• Streamlined We have analyzed areas where the first edition could be simplified and have done so for this second edition. This has reduced the number of pages while still providing the same out-standing content coverage. We believe that students will find the text readable.
Understand Why You Are Studying Supply Chain and Operations Management 3
Supply Chain and Operational Social Responsibility at Apple
As you will learn in this class, supply chain managers concern themselves
daily with social responsibility. This involves being sensitive to the rights
and dignity of individuals in the global supply chain and putting systems
and reporting in place to ensure compliance with company standards in this
area. Apple currently has more than 1.6 million people working its supply
chain. To manage in a way that is responsive to the needs of all these people
is a big job.
To help with managing supply chain and operations social responsibility, Apple has
established a supplier code of conduct. The Apple supplier code of conduct addresses
safety, working conditions, fair employee treatment, and environmental performance.
This requires more than just satisfying local laws. It means meeting world-class require-
ments for global supply chain practices.
In this chapter, we will introduce supply chain and operations. As a supply chain and
operations manager, you will have an opportunity to make the world a better place. We
will revisit social responsibility at Apple later in the chapter.
Source: Supplier Responsibility 2016 Progress Report, Apple Corporation, 2016.
If you listen carefully, that sound you hear is the sound of new jobs being created in supply chain and operations (SC&O) management. These jobs create opportunities for you as stu-dents, but SC&O management is not just about jobs. It crosses many international borders and touches the lives of billions of people worldwide. As firms cooperate to create customer value, they also create economic and political alliances that add stability to an unstable world. The supply chain binds not only companies but also cultures, continents, and competencies.
NDERSTAND WHY YOU ARE STUDYING SUPPLY CHAIN AND OPERATIONS MANAGEMENT
Before we begin discussing supply chains and operations, and how they work together, let’s define some terms. These terms are commonly used in the SC&O field as well as throughout this text.
Supply chain management is cooperation between different firms to create value for customers. Operations management is the administration of transformation processes that create value for customers by meeting their needs or enabling them to meet their own needs. Combining these terms to make supply chain and operations (SC&O) emphasizes the linkages between firms that tie operations together with the goal of satisfying customers. The move to SC&O management from just operations management externalizes the view of a productive firm in a way that is healthy for the world, individual firms, and their global competitiveness.
As a student, you might be asking yourself, Because my major area of study is not SC&O man-agement, why do I need to study this topic? That is a good question. In leading business schools around the world, students—regardless of their major—study accounting, marketing, finance, human resources, and SC&O management. Let’s see why.
U
supply chain managementFirms cooperating to create value for customers.
operations managementManaging transformation pro-cesses to convert inputs into prod-ucts and services.
supply chain and operations (SC&O)Combining supply chain and oper-ations to serve customers.
M01_FOST9830_02_SE_C01.indd 3 14/07/17 2:46 PM
OLVING TEACHING AND LEARNING CHALLENGESThe second edition of Managing Supply Chain and Operations is targeted toward undergraduate- and graduate-level operations management courses that link to supply chain management in an effective and meaningful way. When we implemented this approach at our own university, we saw a tenfold increase in student enrollment in our major. Students are responding to the global nature of business, which has led to a realization that firms do not act alone to pro-duce products and services. Although it may sound like a cliché, supply chains do compete against other supply chains. This text benefits from the fact that the authors have taught at both research and teaching universities such as Brigham Young, Florida State, Boise State, and Georgia Southern.
This book takes a balanced approach and, although rigorous, is not solely focused on quantitative material. We approach the quantitative material from a managerial perspective,
S
42 CHAPTER 2 Supply Chain and Operations Strategy
FIGURE 2.5 < Sustainability Scorecard from Procter & Gamble
Transportation Fuel Effi ciency (Transportation
Suppliers Only)
Industry Certifi cation
(Electric) Energy Usage
Potential Waste
Material Recycled, Reused,
Recovered
(Fuel) Energy Usage
Renewable Energy
Environmental Management
System
(Input/Withdrawal) Water Usage
(Output/Discharge) Water
Usage
P&G Sustainability
Ideas and Initiatives Supported
Annual Volume/Output
Kyoto Greenhouse
Gas Emissions Direct
Nonhazardous Waste Disposal
Hazardous Waste Disposal
Sustainability Scorecard from
Procter & Gamble
Source: Based on Sustainability Scorecard from Procter & Gamble.
FIGURE 2.6 > Examples of
“Throwaway” ProductsSwiff er WetJet Mops use reusable inserts that bring customers back again and again. The problem is that they replace reusable mops that were just fi ne.
Frisbees fl y so well they end up in trees.
Umbrellas are cheaply made and don’t last. Over 100,000 umbrellas end up in landfi lls yearly.
Lightbulbs. There is now a bulb that lasts 20 years. How can that be profi table?
Solo Cup, a $1.8 billion company, makes products that last as long as one quarter in a football game.
Razors. Do you realize that before disposable razors and blades, people rarely bought razor equipment?
Much furniture, such as that sold at Ikea, is made out of particle board and it doesn’t last. By comparison, if you watch the Antiques Roadshow, you will see that some furniture was built to last hundreds of years.
Items That Fill Junk Yards
Source: Based on Spencer Bailey, “Keeping Landfills in the Black,” Businessweek, June 25, 2012, p. 91.
M02_FOST9830_02_SE_C02.indd 42 21/07/17 5:31 PM
A01_FOST9830_02_SE_FM.indd 17 10/11/17 2:50 PM

xviii Preface
answering the question: “Where does the analytical tool fit into a supply chain and operations (SC&O) management system?” We also recognize that most students in introductory opera-tions courses are not operations or supply chain management majors. Because this course is often a service course, our approach will help students understand how and why this subject area applies to their roles as future managers.
16 CHAPTER 1 Introduction to Supply Chain and Operations Management
management, sales and operations planning, enterprise resource planning, project manage-ment, statistical quality control, lean production, Six Sigma processes, and managing change. Look for these operations topics as we move through the text; understanding them is impor-tant when making operations decisions within the context of this model.
Upstream CollaborationMoving upstream in Figure 1.9, the farthest left sphere encompasses working with and collabo-rating with suppliers. This collaboration is a very important aspect of supply chain management. This text covers this and related topics extensively because managers’ relationships with and understanding of their suppliers are an integral aspect of keeping their supply chains operational. Among the topics covered in upstream processes are strategic sourcing or purchasing; supplier selection and development; total cost of ownership; supplier management; supplier scorecards; and supply chain quality management, which deals largely with supplier quality issues.
Downstream CollaborationMoving downstream from the center in Figure 1.9 is customer relationship management. Although customer relationship management can happen throughout the supply chain, we use this concept to sharpen our focus on downstream processes and customers.
Customer relationship management involves both personal interactions with customers and information systems used in enhancing customer relations. Among the downstream col-laboration topics covered in this text are service process design, business-to-business strat-egies, business-to-consumer strategies, waiting line theory, mass customization, after-sales service, and demand management. There is also a strong focus in this text on customer ser-vice and customer satisfaction.
Managers approach business to business (B2B) and business to consumer (B2C) col-laboration somewhat differently due to the requirements of B2B and B2C markets. B2B is busi-ness between two business entities such as a supplier providing components for a personal computer. B2C is business to consumer such as Hershey’s selling candy to customers. For example, in B2B collaborations, important topics include information sharing, joint design whereby products are designed collaboratively by suppliers, joint planning, and achieving an understanding relative to needs and requirements. B2C collaboration takes business into mass customization; servitization; and developing an understanding of customer service, including gathering data from customers as a basis for improvement. We will discuss B2B and B2C collaboration in Chapter 4.
business to business (B2B)Business transacted between two commercial firms.
business to consumer (B2C)Business transacted between a business and a consumer.
FIGURE 1.9 > An Integrative
Model of Supply Chain
and Operations Management
IMPROVING QUALITY MANAGEMENT, ANALYTICS, AND LOGISTICS
Customer Relationship Management
Downstream Processes
Operations Management
Core Processes
Supply Management
Upstream Processes
IMPACTING
INTEGRATING GLOBAL SC&O STRATEGY
INNOVATING
M01_FOST9830_02_SE_C01.indd 16 14/07/17 2:47 PM
A second motivation for our writing this book emerges from the field. The field of SC&O management has developed from the three academic disciplines of purchasing, logistics, and operations. Faculty members who are coming from these differing fields do not always see the world the same way, which has created some fragmentation within the course. By putting together a world-class team from these three different academic traditions, we have developed the integrative model for SC&O management that brings these areas together. This model presents the glue that integrates these areas to provide a robust and complete textbook for students. Following are other teaching features in the text:
92
4 Service Design
IMPROVING QUALITY MANAGEMENT, ANALYTICS, AND LOGISTICS
Customer Relationship Management
Downstream Processes
Operations Management
Core Processes
Supply Management
Upstream Processes
IMPACTING
INTEGRATING GLOBAL SC&O STRATEGY
INNOVATING
CHAPTER OUTLINE AND LEARNING OBJECTIVES
1 Understand the Relationships between Services and Tangibles• Identify How Services and Nonservices Differ
2 Identify and Apply the Key Elements of Service Design• Describe how managers design for service quality.• Explain how managers and designers design products
for service recovery.• Explain the differences between business-to- consumer
(B2C) and business-to-business (B2B) services.• Describe customer-interactive services and the
components of the customer experience.
3 Understand and Apply the Process Chain Network (PCN) Tool for Service Design• Understand process chain networks.
• Explain process positioning.• List the three process principles.• List and use the steps in developing a PCN diagram.
4 Describe and Use the Planning Service Capacity for Uncertain Demand• Understand the components of capacity
planning.• Describe the tools that managers use to plan
and manage capacity.
5 Apply Queuing Theory• Understand queuing psychology.• Apply analytic queuing models to improve service
performance.
M04_FOST9830_02_SE_C04.indd 92 19/07/17 12:49 PM
• Each chapter has a defined set of Learning Objectives. Because AACSB is requiring faculty to identify learning objectives, we provide them as an aid for faculty and students.
94 CHAPTER 4 Service Design
office. Dentistry includes the production process of cleaning and repairing patients’ teeth. Dentists use resources such as equipment, cleaning substances, trained labor, and physical facili-ties. The most essential resource that dentists use, however, is customers’ teeth. Dentists cannot proceed with the teeth-cleaning process until after the customer provides teeth to clean.
Although this dental example may seem humorous, it illustrates the contrasts between ser-vice processes and a typical make-to-stock manufacturing operation. For example, a factory that makes dental tools can produce those tools even at times of low demand, and it can keep the tools in inventory until customers purchase them. The factory can wait for dentists to order the tools, but dentists cannot clean teeth in times of low demand; they can only clean teeth simultaneously with demand.
TABLE 4.1 provides examples of customer resources that are processed in service operations. In each case, the provider can prepare for production without customers, but the provider requires customer resources to produce in a substantive, revenue-generating way.
Because production in service operations depends on customer resources, the design of services leads to unique challenges. We begin with the elements of service design.
Managing Across Majors 4.1 Marketing majors, remember that service operations need information from marketing to help identify and understand customer needs.
DENTIFY AND APPLY THE KEY ELEMENTS OF SERVICE DESIGN
An element of service design alluded to in the dentistry example is known as simultaneity, which means that the production of services occurs at roughly the same time as customer demand. Instead of producing ahead of demand, service production largely occurs as demand arises. Restaurants can prepare food products and set tables before customers arrive, but the revenue-generating activity of serving customers can occur only when customers arrive and present their demand (and their input resources).
In manufacturing, inventory is a great resource for dealing with fluctuations in demand. Manufacturing firms can often produce relatively constant quantities of goods across times of high demand and low demand. At times of low demand, manufacturers produce goods and store them in inventory, which can be used during times of high demand.
Because of simultaneity, service production usually cannot be inventoried. Instead, managers must rely on extra capacity to meet fluctuations in demand. If the service provider believes that it is important to meet demand even during times of high demand, it needs to set
IsimultaneityWhen the production of services occurs at roughly the same time as customer demand.
Examples of Service Operations
Service Operation Customer Input Resources Service Provider Outputs
Accounting Financial records Financial statements
Air transportation Passengers and baggage Transported passengers
Auto repair Broken car Repaired car
Consulting Business problems Business solutions
Dentistry Patients’ teeth Mended teeth
Education Students’ minds Educated minds
Legal services Legal problems Legal remedies
Healthcare Illness and injuries Healthier patients
TABLE 4.1 >
tangiblesProducts, technology, and other outputs and inputs associated with services.
M04_FOST9830_02_SE_C04.indd 94 19/07/17 12:49 PM
• Managing Across Majors boxes directly address how students in different majors and disciplines will use SC&O concepts upon graduation. Making a clear con-nection between the concepts and how students will use them reinforces the importance and relevance of these concepts.
A01_FOST9830_02_SE_FM.indd 18 10/11/17 2:50 PM
Preface xix
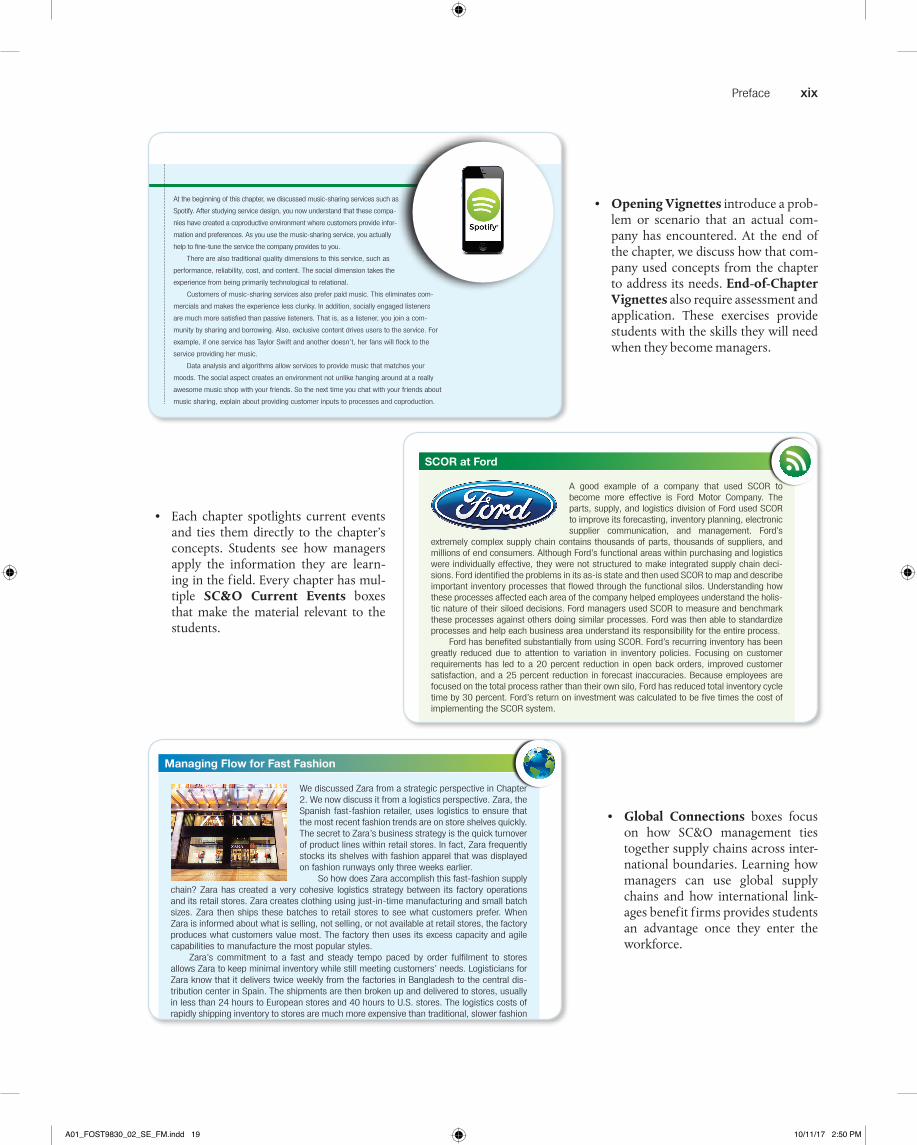
• Each chapter spotlights current events and ties them directly to the chapter’s concepts. Students see how managers apply the information they are learn-ing in the field. Every chapter has mul-tiple SC&O Current Events boxes that make the material relevant to the students.
Execute Strategy 35
SCOR Model Processes
Plan Balances aggregate demand and supply to develop a course of action that best meets sourcing, production, and delivery requirements.
Source Includes activities related to procuring goods and services to meet planned and actual demand.
Make Includes activities related to transforming products into a finished state to meet planned or actual demand.
Deliver Provides finished goods or services to meet planned or actual demand, typi-cally including order management, transportation management, and distribu-tion management.
Return Deals with returning or receiving returned products for any reason and extends into post delivery customer support.
Source: Reprinted by permission from Lambert, D., Supply Chain Management: Processes, Partner-ships, Performance. Supply Chain Management Institute, Tempe AZ, 2008.
< TABLE 2.4
Furthermore, the SCOR model encourages managers to consider these five processes not only within the company but also outside the company in the interfaces with suppliers and suppliers’ suppliers on the upstream side. The SCOR model encourages managers to consider also how these processes influence customers and customers’ customers on the downstream side. The SCOR process then suggests that the company should benchmark its processes against firms that are very good at doing similar processes and find where their processes differ. Managers can then compare process measurements and metrics to ensure that their supply chain processes are causing the holistic behaviors needed in a supply chain. In short, the SCOR model gives the manager an effective tool for understanding and controlling how supply chain processes affect the entire supply chain. An application of SCOR is provided in SC&O CURRENT EVENTS 2.3.
< SC&O CURRENT EVENTS 2.3
A good example of a company that used SCOR to become more effective is Ford Motor Company. The parts, supply, and logistics division of Ford used SCOR to improve its forecasting, inventory planning, electronic supplier communication, and management. Ford’s
extremely complex supply chain contains thousands of parts, thousands of suppliers, and millions of end consumers. Although Ford’s functional areas within purchasing and logistics were individually effective, they were not structured to make integrated supply chain deci-sions. Ford identified the problems in its as-is state and then used SCOR to map and describe important inventory processes that flowed through the functional silos. Understanding how these processes affected each area of the company helped employees understand the holis-tic nature of their siloed decisions. Ford managers used SCOR to measure and benchmark these processes against others doing similar processes. Ford was then able to standardize processes and help each business area understand its responsibility for the entire process.
Ford has benefited substantially from using SCOR. Ford’s recurring inventory has been greatly reduced due to attention to variation in inventory policies. Focusing on customer requirements has led to a 20 percent reduction in open back orders, improved customer satisfaction, and a 25 percent reduction in forecast inaccuracies. Because employees are focused on the total process rather than their own silo, Ford has reduced total inventory cycle time by 30 percent. Ford’s return on investment was calculated to be five times the cost of implementing the SCOR system.
SCOR at Ford
M02_FOST9830_02_SE_C02.indd 35 21/07/17 5:30 PM
Summary 113
At the beginning of this chapter, we discussed music-sharing services such as
Spotify. After studying service design, you now understand that these compa-
nies have created a coproductive environment where customers provide infor-
mation and preferences. As you use the music-sharing service, you actually
help to fine-tune the service the company provides to you.
There are also traditional quality dimensions to this service, such as
performance, reliability, cost, and content. The social dimension takes the
experience from being primarily technological to relational.
Customers of music-sharing services also prefer paid music. This eliminates com-
mercials and makes the experience less clunky. In addition, socially engaged listeners
are much more satisfied than passive listeners. That is, as a listener, you join a com-
munity by sharing and borrowing. Also, exclusive content drives users to the service. For
example, if one service has Taylor Swift and another doesn’t, her fans will flock to the
service providing her music.
Data analysis and algorithms allow services to provide music that matches your
moods. The social aspect creates an environment not unlike hanging around at a really
awesome music shop with your friends. So the next time you chat with your friends about
music sharing, explain about providing customer inputs to processes and coproduction.
1. The chapter began by reviewing the importance of tangibles in services.a. All services involve a bundling of tangibles and intangibles.b. Both the tangibles and intangibles have to be correct.
2. We then discussed the key elements of a service design.a. An important aspect of service design is that customers provide inputs to all services.
This aspect is a major distinction between services and manufacturing.b. B2B and B2C services differ in that the entities are different.
3. We followed our service design discussion with details of the process chain network (PCN) diagram.a. PCN diagrams provide a basis for process positioning, that is, determining best how to
interact with customers and suppliers.b. PCN diagrams place service processes in the context of supply chains.
4. We then provided tools for managing services with uncertain capacity.a. The first tool was the newsvendor model, which is useful for perishable capacity.b. Next, we discussed queuing models as a means for optimizing customer service
and waiting lines.
Summary
M04_FOST9830_02_SE_C04.indd 113 19/07/17 12:49 PM
• Opening Vignettes introduce a prob-lem or scenario that an actual com-pany has encountered. At the end of the chapter, we discuss how that com-pany used concepts from the chapter to address its needs. End-of-Chapter Vignettes also require assessment and application. These exercises provide students with the skills they will need when they become managers.
Understand the Strategic Importance of Logistics 309
chain as needed. Lean manufacturing strategies rely heavily on storage and transportation functions to ensure that materials and products truly do arrive “just in time.” GLOBAL CONNECTIONS 11.1 discusses the issue of flow in more detail.
AccessAs companies continue to expand into new markets, access becomes a strategic issue. For exam-ple, marketers may tell a company that there is significant demand for a product in Vietnam, but Vietnam’s transportation infrastructure may be so inadequate that there is no way to reach this market. One of the strategic responsibilities of logisticians is to determine the accessibility of markets. Consumers in markets with poor infrastructure will have to bear the costs of dif-ficult deliveries, so they must be prepared to understand the logistics costs and benefits of such markets. After the fall of the Soviet Union in 1991, many economists suggested that Russia was a prime market for Western goods. Because the 280 million citizens of the former Soviet states had been denied many of the market goods that Western Europe and the United States enjoyed, marketers expected a booming market. Logisticians would later tell companies, however, that Russia was not ready to be an export marketplace. Importing goods ran into too much red tape at the borders. In addition, the infrastructure was not efficient enough to import products cheaply. The efficient Russian railways were an exception, but Russian trains ran on a different gauge rail than the rest of the world. Therefore, every shipment going into Russia would have to be off-loaded onto a train equipped for the Russian rail. Even though there was a huge demand for these Western goods, the logistics made penetrating this market very difficult.
LOGISTICS ACCESS Logistics access, the ability of companies to deliver their product or service to a market affordably, does not apply only to countries with inadequate infrastructure. Business-to-business (B2B) and business-to-consumer (B2C) businesses must also consider logistics access.
We discussed Zara from a strategic perspective in Chapter 2. We now discuss it from a logistics perspective. Zara, the Spanish fast-fashion retailer, uses logistics to ensure that the most recent fashion trends are on store shelves quickly. The secret to Zara’s business strategy is the quick turnover of product lines within retail stores. In fact, Zara frequently stocks its shelves with fashion apparel that was displayed on fashion runways only three weeks earlier.
So how does Zara accomplish this fast-fashion supply chain? Zara has created a very cohesive logistics strategy between its factory operations and its retail stores. Zara creates clothing using just-in-time manufacturing and small batch sizes. Zara then ships these batches to retail stores to see what customers prefer. When Zara is informed about what is selling, not selling, or not available at retail stores, the factory produces what customers value most. The factory then uses its excess capacity and agile capabilities to manufacture the most popular styles.
Zara’s commitment to a fast and steady tempo paced by order fulfilment to stores allows Zara to keep minimal inventory while still meeting customers’ needs. Logisticians for Zara know that it delivers twice weekly from the factories in Bangladesh to the central dis-tribution center in Spain. The shipments are then broken up and delivered to stores, usually in less than 24 hours to European stores and 40 hours to U.S. stores. The logistics costs of rapidly shipping inventory to stores are much more expensive than traditional, slower fashion shipping. However, Zara recoups the higher logistics costs by selling around 85 percent of its merchandise at full price, while those fashion retailers using slower supply chains sell only around 70 percent of their merchandise at full price. The fast flow necessary to accom-modate fast fashion is facilitated by logistics.
Source: Based on https://www.forbes.com/sites/walterloeb/2015/03/30/zara-leads-in-fast-fashion/ #77ef445f5944https://www.tradegecko.com/blog/zara-supply-chain-its-secret-to-retail-success
Managing Flow for Fast Fashion < GLOBAL CONNECTIONS 11.1
M11_FOST9830_02_SE_C11.indd 309 22/08/17 11:38 AM
• Global Connections boxes focus on how SC&O management ties together supply chains across inter-national boundaries. Learning how managers can use global supply chains and how international link-ages benefit firms provides students an advantage once they enter the workforce.
A01_FOST9830_02_SE_FM.indd 19 10/11/17 2:50 PM

xx Preface
• Using Technology boxes walk students through the ways managers use technol-ogy to solve SC&O problems in the workplace. Step-by-step tutorials break down problems and solutions and provide computer-based fundamentals for SC&O problem solving.
Apply Queuing Theory 107
You can also use Excel to apply newsvendor analysis to Solved Problem 4.2.
< USING TECHNOLOGY 4.1
<
FIGURE 4.5 Newsvendor Excel Spreadsheet
A B C D E F G H I
1 Example 4-1 Newsvendor Analysis2
3 Cost of understocking ($): 30 Critical Fractile: 0.75
4 Cost of overstocking ($): 10
5 Average demand (tables): 25 Optimal Number of Tables: 28.375
6 Std dev of demand (tables): 5
7 z value: 0.675
8 (Use =norm.s.inv(G3) command)
9
10
11
12
=C5+C6*C7
=C3/(C4+C3)
processing times. Queuing theory requires that we have information about the distribution of demand (which we get from forecasting) and about the behavior of the queue system. The remainder of this chapter discusses details of queues and queuing theory.
PPLY QUEUING THEORYManagers and designers use queuing theory when planning service capacity if they are uncer-tain about demand. This section will show you how managers approach queuing theory with respect to psychology, queue configuration, and wait times.
Queuing PsychologyQueuing psychology recognizes that the customer’s cost of waiting is not just about the time customers spend waiting in line but also includes what customers think about the wait-ing. Uncomfortable waits can seem much longer than they really are. Entertaining waits can seem much shorter. Queuing psychology identifies ways that service operations managers can improve waits by improving the perception of those waits. David Maister provided the following eight points of queuing psychology:2
1. Unoccupied waits seem longer than occupied waits.2. Preprocess waits seem longer than in-process waits.3. Anxiety makes waits seem longer.4. Uncertain waits seem longer than waits of a known duration.5. Unexplained waits seem longer than explained waits.6. Unfair waits seem longer than equitable waits.7. The more valuable the service, the longer people are willing to wait.8. Waiting alone seems longer than waiting with a group.
Queue Systems and Service StationsThere are many options for queue systems. A system may have one queue or multiple queues. Each queue leads to one or more servers or service stations. For example, at a fast-food restaurant, customers may wait to place their order and then wait again to pay for it. When there are multiple queues and service stations, one after another, we say that it is a
A
queuing psychologyThe side of queuing theory that emphasizes human behavior.
servers or service stationsThe person providing service in a queuing system.
2Based on D. Maister, “The Psychology of Waiting Lines” (1985), available at http://davidmaister .com/articles/5/52/.
M04_FOST9830_02_SE_C04.indd 107 19/07/17 12:49 PM
• The text includes videos in MyLab Operations Management for over 70 Solved Problems from the text, allowing students to practice quantitative material prior to coming to class.
106 CHAPTER 4 Service Design
NEWSVENDOR ANALYSIS Newsvendor analysis is another way to make capacity decisions under a different set of assumptions. In particular, you may want to trade off the costs of not enough capacity (CU, or the cost of understocking) against the costs of excess capacity (CO, or the cost of overstocking). With newsvendor analysis, we make the following assumptions:
1. Excess capacity costs = CO dollars per time period.2. If customers have to wait, the cost is CU per time period. This cost could be lost goodwill
or lost sales.3. Capacity is perishable. In other words, you cannot use today’s extra capacity to meet
tomorrow’s demand.
If these conditions are met, the optimal capacity is the point in the cumulative distribution of demand known as the critical fractile, CF:
CF =CU
(CO + CU) (4.1)
The newsvendor problem is also called the perishable inventory problem because it is used to calculate the optimal amount of inventory of a perishable item. It is called the newsvendor problem because newspapers are an example of a perishable item. Daily newspapers have a cer-tain value on the day they come out, but little or no value if they are not sold that day.
A newsstand in New York City can purchase newspapers for $0.10 each and sell them for $0.25 each. Daily demand is normally distributed with a mean of 100 and a standard deviation of 20. Newspapers that are not sold at the end of the day are worthless. So the cost having too many (CO) is $0.10 per paper (the purchase cost), and the cost of having too few (CU) is $0.15 per paper (the lost profit, which is $0.25 revenue minus $0.10 cost). To find the critical fractile using the newsvendor model use Equation 4.1. Here the critical fractile is 15> 110 + 152 = 0.60. The 0.60 point on a cumulative normal distribution (see Appendix Table A-2) is z = 0.255. Thus, the optimal number of newspapers is 100 + 10.255 * 202 = 105.1, or 105 newspa-pers. A more complete problem is given in SOLVED PROBLEM 4.2.
SOLVED PROBLEM 4.2 > f(x) The Newsvendor Problem in Action
Problem: In service environments, an inventory issue is capacity. Service operations have a capacity for meeting customer demand according to how they are designed. If there is not enough capacity, customer demand may not turn into sales. Excess capacity comes with a cost as well.
For example, a restaurant chain is opening a new location in a business district. The ques-tion is how many tables to design in the restaurant. The key revenue period is the weekday lunch seating, so the restaurant desires to plan capacity for that demand. Lunchtime demand is forecast to be normally distributed with a mean of 25 parties and a standard deviation of 5 parties. (Assume one party per table.) How many tables should the restaurant have?
A naive view would have 25 tables, but that ignores the asymmetric cost structure. The average party spends $40 for lunch, with ingredient costs being 25 percent of that amount.
Solution: Therefore, the cost of insufficient tables (CU) is 40 – (140 * 0.252 = $30 per table, which is the average profit contribution per party. Each table takes up 100 square feet of space, and space costs $3 per square foot per month (approximately $0.10 per square foot per day).
Therefore, the cost of an extra table is 100 * 0.10 = $10 per table per day. This cost sug-gests that an optimal number of tables would have CF = 30>(10 + 30) = 0.75, or 75 percent of the cumulative distribution. Looking up 0.75 in the normal cumulative distribution table (see Appendix Table A-2) shows that z = 0.675. Therefore, the optimal number of tables is 25 + (0.675 * 5) = 28.375, or approximately 28 tables. See FIGURE 4.5 for the formulas and a sample layout for a newsvendor problem.
newsvendor analysisA method for making capacity decisions in services that meas-ures the trade-offs between the cost of understocking and the cost of overstocking.
critical fractileThe optimal capacity level in news-vendor analysis.
WAITING LINES Queuing theory shows the relationship between capacity levels and expected wait costs. A queue is a waiting line. Queues can take many forms, such as fast-food drive-through lanes, will-call windows at concerts, and process production lines with variation in
MyLab Operations Management Video
M04_FOST9830_02_SE_C04.indd 106 19/07/17 12:49 PM
A01_FOST9830_02_SE_FM.indd 20 10/11/17 2:50 PM
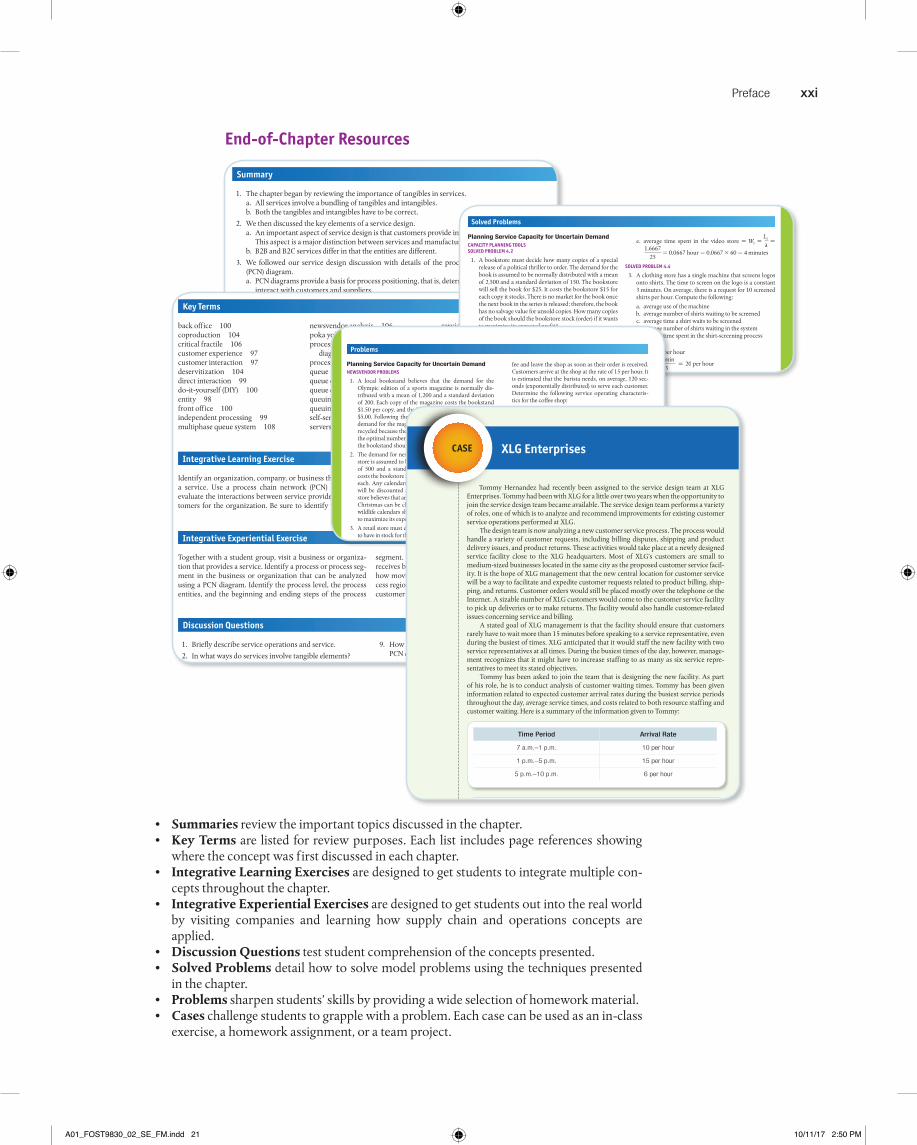
Preface xxi
• Summaries review the important topics discussed in the chapter.• Key Terms are listed for review purposes. Each list includes page references showing
where the concept was first discussed in each chapter.• Integrative Learning Exercises are designed to get students to integrate multiple con-
cepts throughout the chapter.• Integrative Experiential Exercises are designed to get students out into the real world
by visiting companies and learning how supply chain and operations concepts are applied.
• Discussion Questions test student comprehension of the concepts presented.• Solved Problems detail how to solve model problems using the techniques presented
in the chapter.• Problems sharpen students’ skills by providing a wide selection of homework material.• Cases challenge students to grapple with a problem. Each case can be used as an in-class
exercise, a homework assignment, or a team project.
Summary 113
At the beginning of this chapter, we discussed music-sharing services such as
Spotify. After studying service design, you now understand that these compa-
nies have created a coproductive environment where customers provide infor-
mation and preferences. As you use the music-sharing service, you actually
help to fine-tune the service the company provides to you.
There are also traditional quality dimensions to this service, such as
performance, reliability, cost, and content. The social dimension takes the
experience from being primarily technological to relational.
Customers of music-sharing services also prefer paid music. This eliminates com-
mercials and makes the experience less clunky. In addition, socially engaged listeners
are much more satisfied than passive listeners. That is, as a listener, you join a com-
munity by sharing and borrowing. Also, exclusive content drives users to the service. For
example, if one service has Taylor Swift and another doesn’t, her fans will flock to the
service providing her music.
Data analysis and algorithms allow services to provide music that matches your
moods. The social aspect creates an environment not unlike hanging around at a really
awesome music shop with your friends. So the next time you chat with your friends about
music sharing, explain about providing customer inputs to processes and coproduction.
1. The chapter began by reviewing the importance of tangibles in services.a. All services involve a bundling of tangibles and intangibles.b. Both the tangibles and intangibles have to be correct.
2. We then discussed the key elements of a service design.a. An important aspect of service design is that customers provide inputs to all services.
This aspect is a major distinction between services and manufacturing.b. B2B and B2C services differ in that the entities are different.
3. We followed our service design discussion with details of the process chain network (PCN) diagram.a. PCN diagrams provide a basis for process positioning, that is, determining best how to
interact with customers and suppliers.b. PCN diagrams place service processes in the context of supply chains.
4. We then provided tools for managing services with uncertain capacity.a. The first tool was the newsvendor model, which is useful for perishable capacity.b. Next, we discussed queuing models as a means for optimizing customer service
and waiting lines.
Summary
M04_FOST9830_02_SE_C04.indd 113 19/07/17 12:49 PM
114 CHAPTER 4 Service Design
back office 100coproduction 104critical fractile 106customer experience 97customer interaction 97deservitization 104direct interaction 99do-it-yourself (DIY) 100entity 98front office 100independent processing 99multiphase queue system 108
newsvendor analysis 106poka yoke 95process chain network (PCN)
diagram 98process domain 99queue 97queue configuration 108queue discipline 108queuing psychology 107queuing theory 104self-service 100servers 107
service capacity planning 103service offering 97service operations 93service recovery 96services 93service stations 107service system 108simultaneity 94surrogate interaction 99tangibles 93time-perishable capacity 95two-phase system 108
Key Terms
Identify an organization, company, or business that provides a service. Use a process chain network (PCN) diagram to evaluate the interactions between service providers and cus-tomers for the organization. Be sure to identify the process
domain region, the direct interaction region, the surrogate interaction region, and the independent processing region of the service design. If applicable, recommend improvements to the service delivery system that you evaluated.
Integrative Learning Exercise
Together with a student group, visit a business or organiza-tion that provides a service. Identify a process or process seg-ment in the business or organization that can be analyzed using a PCN diagram. Identify the process level, the process entities, and the beginning and ending steps of the process
segment. Be sure to identify the points where the customer receives benefits and the provider incurs costs. Comment on how moving and rearranging steps across and between pro-cess regions might affect the value proposition by increasing customer benefits, decreasing provider costs, or both.
Integrative Experiential Exercise
1. Briefly describe service operations and service.
2. In what ways do services involve tangible elements?
3. Identify the customer input resources and the service provider outputs for the following service operations: accounting, education, computer repair, and healthcare.
4. What is meant by simultaneity in services? What is a major consequence of simultaneity?
5. What are some long-term responses for increasing and decreasing service capacity?
6. What is meant by the term time-perishable capacity as it relates to service operations? Provide an example.
7. Customers are generally involved in the service delivery process. What are some negative consequences associ-ated with customer interaction in the service operation?
8. Briefly define and describe how a process chain network (PCN) diagram can be used in designing service delivery systems.
9. How can you shift the focus of your operations using a PCN diagram?
10. What trade-offs are generally made when making capac-ity decisions?
11. How do capacity choices vary in the near and long terms?
12. How can queuing theory be used to help evaluate capac-ity decisions for service providers?
13. Queuing psychology identifies ways that service opera-tions managers can improve waits by improving the per-ception of those customers who do wait. What are some of the fundamental points related to queuing psychology?
14. In waiting lines, sometimes technological advances can-not make it easier to manage queues. How can psychol-ogy help with this problem?
15. How does the newsvendor model allow service firms to evaluate capacity decisions?
Discussion Questions
M04_FOST9830_02_SE_C04.indd 114 19/07/17 12:49 PM
Solved Problems 115
Planning Service Capacity for Uncertain DemandCAPACITY PLANNING TOOLS SOLVED PROBLEM 4.2
1. A bookstore must decide how many copies of a special release of a political thriller to order. The demand for the book is assumed to be normally distributed with a mean of 2,500 and a standard deviation of 150. The bookstore will sell the book for $25. It costs the bookstore $15 for each copy it stocks. There is no market for the book once the next book in the series is released; therefore, the book has no salvage value for unsold copies. How many copies of the book should the bookstore stock (order) if it wants to maximize its expected profit?
Answer:CU = price - cost = 25 - 15 = $10CO = cost - salvage = 15 - 0 = $15
CF =CU
CO + CU =
1010 + 15
= 0.4
z = -0.25Q = m + z(s) = 2500 + (-0.25)(150) = 2462.5,
or 2463 books
Queuing TheoryWAIT TIMES SOLVED PROBLEM 4.3
2. A small dollar store has a single checkout aisle staffed by one cashier. Customers arrive at the checkout aisle at the rate of 25 every hour. The cashier is able to process 40 customers per hour. Her service time is estimated to be exponentially distributed. Find the following:
a. average server utilizationb. average line lengthc. average time spent in lined. average number of customers in the system (in the
video store)e. average time spent in the video store
Answer:l = 25 per hourm = 40 per hour
a. average server utilization =l
m=
2540
= 0.625
b. average line length = Lq =l2
m(m - l)=
252
40(40 - 25) =
1.042 customers
c. average time spent in line = Wq =Lq
l=
1.04225
=
0.0417 hour = 0.0417 * 60 = 2.5 minutes
d. average number of customers in the system (in the video
store) = Ls = Lq +l
m= 0.0142 +
2540
= 1.6667
e. average time spent in the video store = Ws =Ls
l =
1.666725
= 0.0667 hour = 0.0667 * 60 = 4 minutes
SOLVED PROBLEM 4.4
3. A clothing store has a single machine that screens logos onto shirts. The time to screen on the logo is a constant 3 minutes. On average, there is a request for 10 screened shirts per hour. Compute the following:
a. average use of the machineb. average number of shirts waiting to be screenedc. average time a shirt waits to be screenedd. average number of shirts waiting in the systeme. average time spent in the shirt-screening process
Answer:l = 10 per hour
m =60 min
3= 20 per hour
a. average utilization of the machine = average utiliza-
tion of the server =l
m=
1020
= 0.5
b. average number of shirts waiting to be screened =
Lq =l2
2m(m - l)=
102
2(20)(20 - 10)= 0.25 shirt
c. average time a shirt waits to be screened =
Wq =Lq
l=
0.2510
= 0.025 hour = 0.025 * 60 =
1.5 minutesd. average number of shirts waiting in the system =
Ls = Lq +l
m= .25 +
1020
= 0.75 shirt
e. average time spent in the shirt-screening process =
Ws =Ls
l=
0.7510
= 0.075 hours = 0.075 * 60 =
4.5 minutes
SOLVED PROBLEM 4.5
4. Calls arrive at a help desk at the rate of three every 2 minutes. The help desk has four service representatives who are able to handle incoming calls. If a representative can process, on average, one call in 2 minutes, compute the following:
a. the average utilization of the representativesb. average time a caller must wait to have his or her call
answeredc. average amount of time a caller spends in the system.
Answer:
l = 90 per hour =60 min
2* 3
m = 30 per hour =60 min
2
M = 4
Solved Problems
M04_FOST9830_02_SE_C04.indd 115 19/07/17 12:50 PM
116 CHAPTER 4 Service Design
a. average utilization of the representatives =l
Mm=
904 * 30
= 0.75.
b. average time a caller must wait to have call answered =
Wq =Lq
l.
Using Table 4.5:
l
m 9030
= 3
M = 4
Lq = 1.5282
Wq =1.5282
90= 0.017 hour = 0.017 * 60 = 1.0188
minutes.
c. average amount of time a caller spends in the system =
Ws =Ls
l
Ls = Lq +l
m= 1.5283 +
9030
= 4.5283
Ws =4.5283
90= 0.0503 hour = 0.0503 * 60 =
3.0189 minutes
Planning Service Capacity for Uncertain DemandNEWSVENDOR PROBLEMS
1. A local bookstand believes that the demand for the Olympic edition of a sports magazine is normally dis-tributed with a mean of 1,200 and a standard deviation of 200. Each copy of the magazine costs the bookstand $1.50 per copy, and the bookstand will sell the issue for $5.00. Following the Olympic Games, there will be no demand for the magazine, and all leftover copies will be recycled because they will have no salvage value. What is the optimal number of copies of the Olympic edition that the bookstand should order?
2. The demand for next year’s wildlife calendar at a book-store is assumed to be normally distributed with a mean of 500 and a standard deviation of 75. Each calendar costs the bookstore $5.50 each and will be sold for $12.50 each. Any calendars remaining for sale after Christmas will be discounted and sold for $1.00 each. The book-store believes that any calendar remaining to be sold after Christmas can be cleared at the $1.00 price. How many wildlife calendars should the bookstore stock if it wants to maximize its expected profit from wildlife calendars?
3. A retail store must decide how many Mother’s Day cards to have in stock for this year’s Mother’s Day. Cards must be ordered months in advance, and there is only an opportu-nity to order one time. The store believes that the demand for cards will be normally distributed with a mean of 750 and a standard deviation of 50. The cards cost the shop $2.00 each and will be sold for $3.00 each. Any cards remaining after Mother’s Day will be destroyed. How many cards should the retail store order for Mother’s Day?
Queuing TheorySINGLE SERVER QUEUING
4. A small coffee shop has a single barista. Because the shop is small, there are no tables or chairs. Consequently, cus-tomers wait in a single line to order and receive their cof-
fee and leave the shop as soon as their order is received. Customers arrive at the shop at the rate of 15 per hour. It is estimated that the barista needs, on average, 120 sec-onds (exponentially distributed) to serve each customer. Determine the following service operating characteris-tics for the coffee shop:
a. average server utilization
b. average line length in the coffee shop
c. average time spent in line
d. average number of customers in the coffee shop
e. average time spent by customers in the coffee shop (includes waiting time and service time)
5. An ATM located on a college campus is able to process, on average, one customer request every 2 minutes. Assume that the processing times are exponentially distributed and that each person using the ATM makes only one request per visit. If students arrive at the ATM at the rate of 10 per hour throughout the day, find the following:
a. percentage of time the ATM is busyb. probability the ATM is not in use when a student
arrivesc. average number of students waiting to use the ATMd. average time a student spends waiting in line to use the
ATMe. average time spent waiting and using the ATMf. average number of students waiting and using the ATM
(i.e., the average number of customers in the system)
6. A quick-service restaurant has a single drive-through lane with one worker at the window. It is assumed that the worker can process an order every 4 minutes on aver-age and that the processing (service) times are exponen-tially distributed. If customers arrive at the drive-through at the rate of 10 per hour, calculate the following service operation performance characteristics:
a. percentage of time the worker at the drive-through is busy
Problems
M04_FOST9830_02_SE_C04.indd 116 19/07/17 12:50 PM
XLG Enterprises
Tommy Hernandez had recently been assigned to the service design team at XLG Enterprises. Tommy had been with XLG for a little over two years when the opportunity to join the service design team became available. The service design team performs a variety of roles, one of which is to analyze and recommend improvements for existing customer service operations performed at XLG.
The design team is now analyzing a new customer service process. The process would handle a variety of customer requests, including billing disputes, shipping and product delivery issues, and product returns. These activities would take place at a newly designed service facility close to the XLG headquarters. Most of XLG’s customers are small to medium-sized businesses located in the same city as the proposed customer service facil-ity. It is the hope of XLG management that the new central location for customer service will be a way to facilitate and expedite customer requests related to product billing, ship-ping, and returns. Customer orders would still be placed mostly over the telephone or the Internet. A sizable number of XLG customers would come to the customer service facility to pick up deliveries or to make returns. The facility would also handle customer-related issues concerning service and billing.
A stated goal of XLG management is that the facility should ensure that customers rarely have to wait more than 15 minutes before speaking to a service representative, even during the busiest of times. XLG anticipated that it would staff the new facility with two service representatives at all times. During the busiest times of the day, however, manage-ment recognizes that it might have to increase staffing to as many as six service repre-sentatives to meet its stated objectives.
Tommy has been asked to join the team that is designing the new facility. As part of his role, he is to conduct analysis of customer waiting times. Tommy has been given information related to expected customer arrival rates during the busiest service periods throughout the day, average service times, and costs related to both resource staffing and customer waiting. Here is a summary of the information given to Tommy:
CASE
Average service time per customer representative (all servers are assumed to have the same capabilities)
15 minutes
Cost of waiting (estimated hourly cost for customers in the XLG sys-tem, waiting and being served)
$20
Hourly cost of service representative (including benefits) $25
Average waiting time goal 3 minutes
Time Period Arrival Rate
7 a.m.–1 p.m. 10 per hour
1 p.m.–5 p.m. 15 per hour
5 p.m.–10 p.m. 6 per hour
Tommy remembers studying waiting line analysis in his SC&O management course. A quick review of his old notes helps him recall that the total hourly costs of providing
118
M04_FOST9830_02_SE_C04.indd 118 19/07/17 12:50 PM
End-of-Chapter Resources
A01_FOST9830_02_SE_FM.indd 21 10/11/17 2:50 PM

xxii Preface
YLAB OPERATIONS MANAGEMENT
Reach Every Student by Pairing This Text with Mylab Operations ManagementMyLab is the teaching and learning platform that empowers you to reach every student. By combining trusted author content with digital tools and a flexible platform, MyLab personal-izes the learning experience and improves results for each student. Learn more about MyLab Operations Management at www.pearson.com/mylab/operations-management.
Deliver Trusted ContentYou deserve teaching materials that meet your own high standards for your course. That’s why we partner with highly respected authors to develop interactive content and course- specific resources that you can trust—and that keep your students engaged.
This text is totally integrated with MyOMLab. Among the features that have proven pop-ular are:
• Over 80 videos. Every solved example in the main body of every chapter has a video that shows step-by-step how to solve the problems. Students love this feature of the book. We believe that our videos are best-in-class. We used the talent of BYUTv to develop these videos.
M
A01_FOST9830_02_SE_FM.indd 22 10/11/17 2:50 PM

Preface xxiii
• Simulations A series of simulations created by Pearson educational specialists are avail-able for use in your SC&O course at various times. These make great team in-class activi-ties that you can use to drive home key concepts and to make SC&O fun!
• Dynamic Study Modules These are fantastic utilities that help tutor students on key SC&O concepts.
• E-text Students can save money by utilizing the e-text and bypassing the need to have a paper text. Red Shelf and other tools are available to make this access very economical for the students. Just contact your Pearson rep to find out about this alternative. We do this at BYU and have saved our students a lot of money.
A01_FOST9830_02_SE_FM.indd 23 10/11/17 2:50 PM

xxiv Preface
Empower Each LearnerEach student learns at a different pace. Personalized learning pinpoints the precise areas where each student needs practice, giving all students the support they need—when and where they need it—to be successful.
Teach Your Course Your WayYour course is unique. Whether you’d like to build your own assignments, teach multiple sections, or set prerequisites, MyLab gives you the flexibility to easily create your course to fit your needs.
• You can create quizzes using prewritten editable questions from Tom Foster or you can create your own quizzes that students can complete either before, during, or after class.
Improve Student ResultsWhen you teach with MyLab, student performance improves. That’s why instructors have chosen MyLab for over 15 years, touching the lives of over 50 million students.
EVELOPING EMPLOYABILITY SKILLSThis book is designed to provide a basic understanding of supply chain and operations man-agement. For SC&O majors, this is a great platform for other, more advanced classes. For non-majors, in addition to other skills, they will be learning the basic concepts and important tools for managing:
• Logistics• Purchasing• Operations Management• Inventory Management
• Project Management• Process Management• Process Improvement• Six Sigma
This class will provide tools and concepts that you can use on the first day of your job. Pay attention. This is a growing field that is full of excitement and relevance for your future.
D
114 CHAPTER 4 Service Design
back office 100coproduction 104critical fractile 106customer experience 97customer interaction 97deservitization 104direct interaction 99do-it-yourself (DIY) 100entity 98front office 100independent processing 99multiphase queue system 108
newsvendor analysis 106poka yoke 95process chain network (PCN)
diagram 98process domain 99queue 97queue configuration 108queue discipline 108queuing psychology 107queuing theory 104self-service 100servers 107
service capacity planning 103service offering 97service operations 93service recovery 96services 93service stations 107service system 108simultaneity 94surrogate interaction 99tangibles 93time-perishable capacity 95two-phase system 108
Key Terms
Identify an organization, company, or business that provides a service. Use a process chain network (PCN) diagram to evaluate the interactions between service providers and cus-tomers for the organization. Be sure to identify the process
domain region, the direct interaction region, the surrogate interaction region, and the independent processing region of the service design. If applicable, recommend improvements to the service delivery system that you evaluated.
Integrative Learning Exercise
Together with a student group, visit a business or organiza-tion that provides a service. Identify a process or process seg-ment in the business or organization that can be analyzed using a PCN diagram. Identify the process level, the process entities, and the beginning and ending steps of the process
segment. Be sure to identify the points where the customer receives benefits and the provider incurs costs. Comment on how moving and rearranging steps across and between pro-cess regions might affect the value proposition by increasing customer benefits, decreasing provider costs, or both.
Integrative Experiential Exercise
1. Briefly describe service operations and service.
2. In what ways do services involve tangible elements?
3. Identify the customer input resources and the service provider outputs for the following service operations: accounting, education, computer repair, and healthcare.
4. What is meant by simultaneity in services? What is a major consequence of simultaneity?
5. What are some long-term responses for increasing and decreasing service capacity?
6. What is meant by the term time-perishable capacity as it relates to service operations? Provide an example.
7. Customers are generally involved in the service delivery process. What are some negative consequences associ-ated with customer interaction in the service operation?
8. Briefly define and describe how a process chain network (PCN) diagram can be used in designing service delivery systems.
9. How can you shift the focus of your operations using a PCN diagram?
10. What trade-offs are generally made when making capac-ity decisions?
11. How do capacity choices vary in the near and long terms?
12. How can queuing theory be used to help evaluate capac-ity decisions for service providers?
13. Queuing psychology identifies ways that service opera-tions managers can improve waits by improving the per-ception of those customers who do wait. What are some of the fundamental points related to queuing psychology?
14. In waiting lines, sometimes technological advances can-not make it easier to manage queues. How can psychol-ogy help with this problem?
15. How does the newsvendor model allow service firms to evaluate capacity decisions?
Discussion Questions
M04_FOST9830_02_SE_C04.indd 114 19/07/17 12:49 PM
Expanding Your Career Skills or Building Your Career SkillsAs educators and practitioners, we are aware of the changing landscape of the workplace and the needs of managers in vari-ous industries. This category of activities encourages stu-dents to research data, identify patterns and facts in data, take initiative, work in groups, and clearly communicate their find-ings to others.
A01_FOST9830_02_SE_FM.indd 24 10/11/17 2:50 PM

Preface xxv
NSTRUCTOR TEACHING RESOURCESThis program comes with the following teaching resources.
I
Supplements available to instructors at www.pearsonhighered.com Features of the Supplement
Instructor’s Resource Manual, authored by Khurrum Bhutta from Ohio University
• Chapter-by-chapter summaries• A sample syllabus and course outline• Teaching tips• Examples and activities not in the main book• Class discussion questions• Video suggestions
Solutions Manual, authored by Mahesh Srinivasan from The University of Akron
Solutions to all discussion questions, problems, and case questions
Test Bank, authored by Mahesh Srinivasan from The University of Akron
More than 1,000 multiple-choice, true/false, short-answer, and graphing questions with these annotations:
• Difficulty level (easy, moderate, difficult)• Type (multiple-choice, true/false, short-answer, essay)• Learning objective• AACSB learning standard (Written and Oral Communication; Ethical
Understanding and Reasoning; Analytical Thinking; Information Technology; Interpersonal Relations and Teamwork; Diverse and Multicultural Work; Reflective Thinking; Application of Knowledge)
Computerized TestGen TestGen allows instructors to:
• Customize, save, and generate classroom tests• Edit, add, or delete questions from the test item files• Analyze test results• Organize a database of tests and student results
PowerPoints, authored by Scott Webb from Brigham Young University
Slides include all the figures, tables, and equations in the textbook.PowerPoints meet accessibility standards for students with disabilities. Features include, but are not limited to:
• Keyboard and screen reader access• Alternative text for images• High color contrast between background and foreground colors
If assistance is needed, our dedicated technical support team is ready to help with the media supplements that accompany this text. Visit support.pearson.com/getsupport for answers to frequently asked questions and toll-free user support phone numbers.
A01_FOST9830_02_SE_FM.indd 25 10/11/17 2:50 PM

xxvi Preface
Nezih Altay, DePaul UniversityKwasi Amoako, University of North CarolinaAntonio Arreola-Risa, Texas A&M UniversityCliff Asay, University of WyomingDan Ball, Monmouth UniversityPamela Barnes, Kansas State UniversityHooshang Beheshti, Radford UniversityEdnilson Bernardes, University of West VirginiaKhurrum Bhutta, Ohio UniversityGreg Bier, University of MissouriTerrence Boardman, East Carolina UniversityLeland Buddress, Portland State UniversityDan Bumblauskas, University of MissouriJohn Burbridge, Elon UniversityPaul Choi, California State UniversityRich Coleman, Elon UniversityJohn Connolly, Latter-Day Saints Business CollegeGordon Corzine, University of MassachusettsMichael Fathi, Georgia Southwestern State UniversityJohn Gardner, Brigham Young UniversityRay Gehani, The University of AkronWooseung Jang, University of MissouriAmit Kakkad, University of San DiegoPeter Kelle, Louisiana State UniversityGeorge Kenyon, Lamar UniversityGregg Macaluso, University of Colorado
Alan Mackelprang, Georgia Southern UniversityBill Maligie, California State UniversityHilda Martinez, Clarkson UniversityAnthony Narsing, Macon State CollegeRoger Nibler, Portland State UniversityGlenn Pace, Missouri State UniversityGertrude Pannirselvam, Southern Illinois UniversityAli Parlakturk, University of North CarolinaPatrick Penfield, Syracuse UniversityFred Raafat, San Diego State UniversityAna Rosado Feger, Ohio UniversityBrooke Saladin, Wake Forest UniversityMichael Santonino, Bethune Cookman UniversityMahesh Srinivasan, The University of AkronLarry Taube, University of North CarolinaPaul Vanderspek, Colorado State UniversityJerry Wei, University of Notre DameMarek Wermus, Old Dominion UniversityAngela Wicks, Bryant UniversityKaitlin Wowak, University of Notre DameJohn Wu, California State UniversityXiaohui Xu, California State Polytechnic UniversityHelio Yang, San Diego State UniversityZach Zacharia, Lehigh UniversityWenge Zhu, California State Polytechnic University
CKNOWLEDGMENTSWe acknowledge the contributions of many in making this book a success, including graduate assistant support from Erik Chaston, Scott Merrell, Aaron Hefner, Aaron Lund, Heidi Hun-saker, and Brian Andersen. We also wish to thank Phillip Fry for his contributions. Past and current editors have been essential in providing vision, including Chuck Synovec, Donna Bat-tista, and Dan Tylman. Especially, Deepa Chungi has been a wonderful support to this project.
Many outside reviewers have contributed to the quality of this text and include the following:
A
Finally, we are thankful for our faith that keeps us continually improving and progressing.
A01_FOST9830_02_SE_FM.indd 26 10/11/17 2:50 PM