Managing PostgreSQL with PgCenter
64
Managing PostgreSQL with pgCenter PgConf EU 2016, Estonia, Tallinn Alexey Lesovsky [email protected]
-
Upload
alexey-lesovsky -
Category
Education
-
view
306 -
download
3
Transcript of Managing PostgreSQL with PgCenter

I am a PostgreSQL DBA:
● Linux administration, internals;
● and PostgreSQL of course.
Work in PostgreSQL-Consulting:
● Consulting, support, troubleshooting, profiling, training, etc...
https://goo.gl/NYRFQV
About me

PostgreSQL statistics overview.
PgCenter – quick overview.
Management and troubleshoot with pgCenter.
Outline

+ The most subsystems and objects have stats.
+ Getting stats is quite easy.
– Stats are provided as counters.
– No history or what happened X minutes ago?
– No builtin tools, only psql and hand-made queries.
PostgreSQL statistics

Write Ahead Log
SharedBuffers
Buffers IO Autovacuum Workers
Autovacuum Launcher
Background Workers
Indexes IO
Query Execution
Query Planning
Client Backends Postmaster
Tables IO
Logger Process Stats Collector
LogicalReplication
WAL SenderProcess
ArchiverProcess
BackgroundWriter
CheckpointerProcess
Network Storage
Recovery Process
WAL Receiver ProcessTables/Indexes Data Files
pg_stat_all_tables
pg_current_xlog_location
pg_replication_slots
pg_stat_replication
pg_stat_archiver
pg_stat_database_conflicts
pg_buffercachepg_stat_database
pg_stat_activitypg_stat_user_tables
pg_stat_database
pg_stat_bgwrier
pgstattuplepg_table_size
pg_database_size
pg_index_size
pg_stat_activity
EXPLAIN
pg_stat_statements
pg_locks
pg_stat_user_functions
pg_stat_all_indexes
pg_stat_database
pg_statio_all_indexes
pg_statio_all_tablespg_xlog_location_diff
nicstat* iostat*
pg_stat_kcache
pg_stat_statements
* system tools
pg_stat_progress_vacuum
pg_stat_wal_receiver
pg_blocking_pids

Written in the C, uses libpq and ncurses.
Support PostgreSQL 9.x (9.0 ... 9.6).
Linux only.
Sources on Github.
Packages:
● ALT Linux;
● RedHat/CentOS/Fedora (pgdg, epel-testing);
● Ubuntu (Launchpad);
What is the pgCenter

Top-like interface for viewing stats.
System resource utilization (cpu, memory, storage, networking).
PostgreSQL general utilization (connections, autovacuum, qps).
Common admin tasks.
Major features

The same options as in the psql:
● pgcenter -h 127.0.0.1 -p 5432 -U postgres -d mydb
● pgcenter -U postgres mydb
● pgcenter mydb
Environment variables:
● PGHOST, PGPORT, PGUSER, PGDATABASE, PGPASSWORD
Connections file (~/.pgcenterrc).
How to run pgCenter

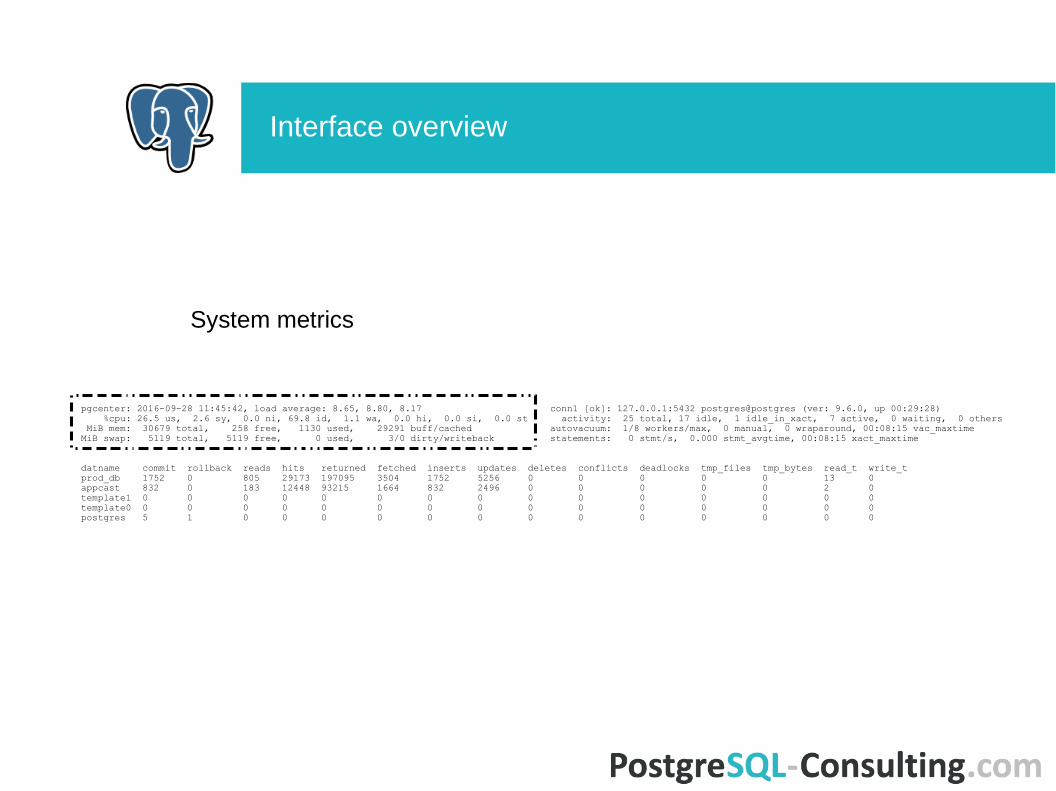
pgcenter: 2016-09-28 11:45:42, load average: 8.65, 8.80, 8.17 conn1 [ok]: 127.0.0.1:5432 postgres@postgres (ver: 9.6.0, up 00:29:28) %cpu: 26.5 us, 2.6 sy, 0.0 ni, 69.8 id, 1.1 wa, 0.0 hi, 0.0 si, 0.0 st activity: 25 total, 17 idle, 1 idle_in_xact, 7 active, 0 waiting, 0 others MiB mem: 30679 total, 258 free, 1130 used, 29291 buff/cached autovacuum: 1/8 workers/max, 0 manual, 0 wraparound, 00:08:15 vac_maxtimeMiB swap: 5119 total, 5119 free, 0 used, 3/0 dirty/writeback statements: 0 stmt/s, 0.000 stmt_avgtime, 00:08:15 xact_maxtime
datname commit rollback reads hits returned fetched inserts updates deletes conflicts deadlocks tmp_files tmp_bytes read_t write_tprod_db 1752 0 805 29173 197095 3504 1752 5256 0 0 0 0 0 13 0appcast 832 0 183 12448 93215 1664 832 2496 0 0 0 0 0 2 0template1 0 0 0 0 0 0 0 0 0 0 0 0 0 0 0template0 0 0 0 0 0 0 0 0 0 0 0 0 0 0 0postgres 5 1 0 0 0 0 0 0 0 0 0 0 0 0 0
Interface overview
System metrics

pgcenter: 2016-09-28 11:45:42, load average: 8.65, 8.80, 8.17 conn1 [ok]: 127.0.0.1:5432 postgres@postgres (ver: 9.6.0, up 00:29:28) %cpu: 26.5 us, 2.6 sy, 0.0 ni, 69.8 id, 1.1 wa, 0.0 hi, 0.0 si, 0.0 st activity: 25 total, 17 idle, 1 idle_in_xact, 7 active, 0 waiting, 0 others MiB mem: 30679 total, 258 free, 1130 used, 29291 buff/cached autovacuum: 1/8 workers/max, 0 manual, 0 wraparound, 00:08:15 vac_maxtimeMiB swap: 5119 total, 5119 free, 0 used, 3/0 dirty/writeback statements: 0 stmt/s, 0.000 stmt_avgtime, 00:08:15 xact_maxtime
datname commit rollback reads hits returned fetched inserts updates deletes conflicts deadlocks tmp_files tmp_bytes read_t write_tprod_db 1752 0 805 29173 197095 3504 1752 5256 0 0 0 0 0 13 0appcast 832 0 183 12448 93215 1664 832 2496 0 0 0 0 0 2 0template1 0 0 0 0 0 0 0 0 0 0 0 0 0 0 0template0 0 0 0 0 0 0 0 0 0 0 0 0 0 0 0postgres 5 1 0 0 0 0 0 0 0 0 0 0 0 0 0
Interface overview
System metrics PostgreSQL metrics
Statistics values

pgcenter: 2016-09-28 11:45:42, load average: 8.65, 8.80, 8.17 conn1 [ok]: 127.0.0.1:5432 postgres@postgres (ver: 9.6.0, up 00:29:28) %cpu: 26.5 us, 2.6 sy, 0.0 ni, 69.8 id, 1.1 wa, 0.0 hi, 0.0 si, 0.0 st activity: 25 total, 17 idle, 1 idle_in_xact, 7 active, 0 waiting, 0 others MiB mem: 30679 total, 258 free, 1130 used, 29291 buff/cached autovacuum: 1/8 workers/max, 0 manual, 0 wraparound, 00:08:15 vac_maxtimeMiB swap: 5119 total, 5119 free, 0 used, 3/0 dirty/writeback statements: 0 stmt/s, 0.000 stmt_avgtime, 00:08:15 xact_maxtime
datname commit rollback reads hits returned fetched inserts updates deletes conflicts deadlocks tmp_files tmp_bytes read_t write_tprod_db 1752 0 805 29173 197095 3504 1752 5256 0 0 0 0 0 13 0appcast 832 0 183 12448 93215 1664 832 2496 0 0 0 0 0 2 0template1 0 0 0 0 0 0 0 0 0 0 0 0 0 0 0template0 0 0 0 0 0 0 0 0 0 0 0 0 0 0 0postgres 5 1 0 0 0 0 0 0 0 0 0 0 0 0 0
Interface overview
System metrics PostgreSQL metrics
Statistics valuesAdditional information

pgcenter: 2016-09-28 11:45:42, load average: 8.65, 8.80, 8.17 %cpu: 26.5 us, 2.6 sy, 0.0 ni, 69.8 id, 1.1 wa, 0.0 hi, 0.0 si, 0.0 st MiB mem: 30679 total, 258 free, 1130 used, 29291 buff/cachedMiB swap: 5119 total, 5119 free, 0 used, 3/0 dirty/writeback
Interface overview
program name current time load average
cpu usage memory usage swap usage

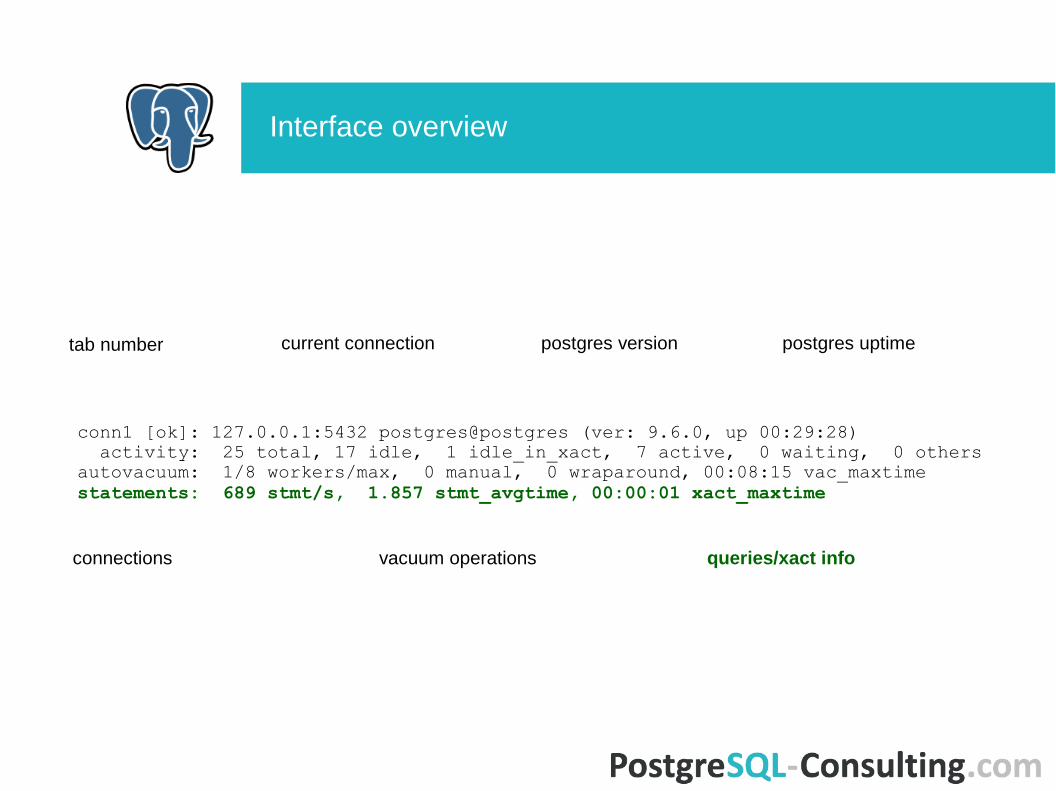
conn1 [ok]: 127.0.0.1:5432 postgres@postgres (ver: 9.6.0, up 00:29:28) activity: 25 total, 17 idle, 1 idle_in_xact, 7 active, 0 waiting, 0 othersautovacuum: 1/8 workers/max, 0 manual, 0 wraparound, 00:08:15 vac_maxtimestatements: 689 stmt/s, 1.857 stmt_avgtime, 00:00:01 xact_maxtime
Interface overview
tab number current connection postgres version
connections vacuum operations queries/xact info
postgres uptime

datname commit rollback reads hits returned fetched inserts updates >prod_db 1752 0 805 29173 197095 3504 1752 5256 >appcast 832 0 183 12448 93215 1664 832 2496 >template1 0 0 0 0 0 0 0 0 >template0 0 0 0 0 0 0 0 0 >Postgres 5 1 0 0 0 0 0 0 >
Interface overview

datname commit rollback reads hits returned fetched inserts updates >prod_db 1752 0 805 29173 197095 3504 1752 5256 >appcast 832 0 183 12448 93215 1664 832 2496 >template1 0 0 0 0 0 0 0 0 >template0 0 0 0 0 0 0 0 0 >Postgres 5 1 0 0 0 0 0 0 >
Left, Right: change sort.
F: Enable filter.
/: Change sort order – desc or asc.
Interface overview

N: open new connection in a new tab
Ctrl+D: close current tab.
1..8: switch between tabs.
W: save opened connections settings to the connfile.
General actions

d: pg_stat_databases
r: pg_stat_replication
t: pg_stat_all_tables
T: pg_statio_all_tables
i: pg_stat_all_indexes, pg_statio_all_indexes
f: pg_stat_user_functions
a: pg_stat_activity
v: pg_stat_progress_vacuum
x: pg_stat_statements
s: Relations size
Available stats

C: show config menu.
E: edit config menu.
R: reload postgres service.
Admin tasks

C: show config menu.
E: edit config menu.
R: reload postgres service.
l: show log file.
Admin tasks
C: show config menu.
E: edit config menu
R: reload postgres service.
l: show log file.
-: сancel query using pid.
_: terminate backend using pid.
Del: cancel group of queries using mask.
Shift+Del: terminate group of backends using mask.
.: show current mask, >: set new mask.
Admin tasks

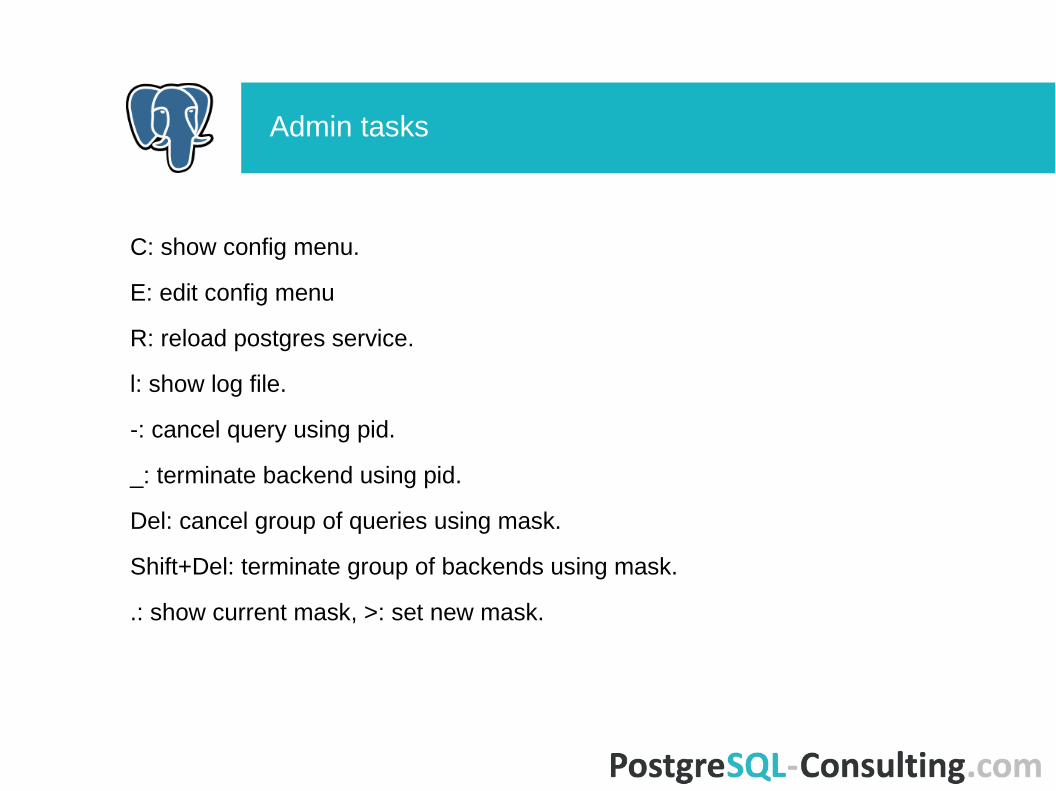
C: show config menu.
E: edit config menu.
R: reload postgres service.
l: show log file.
-: cancel query using pid.
_: terminate backend using pid.
Del: cancel group of queries using mask.
Shift+Del: terminate group of backends using mask.
.: show current mask, >: set new mask.
p: open psql session.
Admin tasks

B: open iostat.
I: open nicstat.
L: tail postgres log (show the latest log lines).
Additional Information

B: open iostat.Device: rrqm/s wrqm/s r/s w/s rMB/s wMB/s avgrq-sz avgqu-sz await r_await w_await %util
sda: 0.00 0.00 0.00 0.00 0.00 0.00 0.00 0.00 0.00 0.00 0.00 0.00
sda1: 0.00 0.00 0.00 0.00 0.00 0.00 0.00 0.00 0.00 0.00 0.00 0.00
sdb: 0.00 1.98 0.00 106.93 0.00 53.85 1031.33 141.19 1472.32 0.00 1472.32 100.00
sdb1: 0.00 0.00 0.00 0.00 0.00 0.00 0.00 0.00 0.00 0.00 0.00 0.00
sdb2: 0.00 1.98 0.00 106.93 0.00 53.85 1031.33 141.19 1472.32 0.00 1472.32 100.00
I: open nicstat.
L: tail postgres log (show the latest log lines).
Additional Information

B: open iostat.
I: open nicstat.Interface: rMbps wMbps rPk/s wPk/s rAvs wAvs IErr OErr Coll Sat %rUtil %wUtil %Util
eth0: 592.33 7.29 52350.50 16897.03 1483.04 56.52 0.00 0.00 0.00 0.00 44.05 0.54 44.59
eth1: 119.04 1.85 10728.71 4290.10 1454.32 56.39 0.00 0.00 0.00 0.00 8.85 0.14 8.99
lo: 0.13 0.13 49.50 49.50 351.96 351.96 0.00 0.00 0.00 0.00 0.00 0.00 0.00
L: tail postgres log (show the latest log lines).
Additional Information

B: open iostat.
I: open nicstat.
L: tail postgres log (show the latest log lines).ERROR: cannot execute SELECT FOR UPDATE in a read-only transaction
ERROR: cannot execute SELECT FOR UPDATE in a read-only transaction
LOG: checkpoint starting: time
LOG: checkpoint complete: wrote 40 buffers (0.0%); 0 transaction log file(s) added, 0 removed, 26 recycled; write=3.924 s, sync=0.
ERROR: cannot execute SELECT FOR UPDATE in a read-only transaction
Additional Information

Troubleshoot:
● quick overview, resource utilization and postgresql activity;
● autovacuum issues;
● replication problems;
● database anomalies;
● tables, indexes and functions;
● where is the space?
● bad company;
● queries investigation.
Troubleshoot

Quick overview:
● run pgCenter;
● check resources usage (cpu, mem, disk, net);
● check the postgresql usage;
● make a plan what's next.
Troubleshoot

pgcenter: 2016-09-28 12:21:45, load average: 19.81, 5.15, 3.35
%cpu: 68.6 us, 5.5 sy, 0.0 ni, 15.1 id, 10.8 wa, 0.0 hi, 0.0 si, 0.0 st
MiB mem: 30679 total, 1508 free, 1130 used, 28041 buff/cached
MiB swap: 5119 total, 552 free, 4567 used, 834/198 dirty/writeback
Troubleshoot

pgcenter: 2016-09-28 12:21:45, load average: 19.81, 5.15, 3.35
%cpu: 68.6 us, 5.5 sy, 0.0 ni, 15.1 id, 10.8 wa, 0.0 hi, 0.0 si, 0.0 st
MiB mem: 30679 total, 1508 free, 1130 used, 28041 buff/cached
MiB swap: 5119 total, 552 free, 4567 used, 834/198 dirty/writeback
load average? – check cpu/disks usage.
us – check queries/activity.
sy, si, hi – check system/kernel/hardware.
wa – check queries, disks activity.
mem/swap – revise shared_buffers/work_mem.
dirty/writeback – write activity, disks utilization.
Troubleshoot

PostgreSQL general state:
● too many connections;
● too many bad connections (waiting, idle_in_xact);
● too many vacuums, long vacuum;
● too many queries, long transactions/queries;
Troubleshoot

conn1 [ok]: 127.0.0.1:5432 postgres@postgres (ver: 9.6.0, up 05:02:50)
activity: 44 total, 2 idle, 2 idle_in_xact, 9 active, 31 waiting, 0 others
autovacuum: 6/8 workers/max, 0 manual, 6 wraparound, 02:13:02 vac_maxtime
statements: 172 stmt/s, 5.390 stmt_avgtime, 00:18:37 xact_maxtime
Troubleshoot

conn1 [ok]: 127.0.0.1:5432 postgres@postgres (ver: 9.6.0, up 05:02:50)
activity: 44 total, 2 idle, 2 idle_in_xact, 9 active, 31 waiting, 0 others
autovacuum: 6/8 workers/max, 0 manual, 6 wraparound, 02:13:02 vac_maxtime
statements: 172 stmt/s, 5.390 stmt_avgtime, 00:18:37 xact_maxtime
too many active – check activity.
idle in transactions, waiting – check activity, cancel or terminate that.
what about autovacuum worker limit? – increase the limit, play with cost parameters.
check pg_stat_progress_vacuum, disks utilization.
long transactions – cancel or terminate.
Troubleshoot

Replication problems:
● replication lag – queries with different results;
● network utilization, errors;
● disk utilization, bandwidth.
Troubleshoot

client user name state mode pending write flush replay total_lag
10.13.0.5 replica walreceiver streaming async 256 0 0 227754 228009
10.13.0.7 replica walreceiver streaming async 1248558 0 0 514 1249072
10.13.0.6 replica walreceiver streaming async 0 0 0 64 64
Troubleshoot

client user name state mode pending write flush replay total_lag
10.13.0.5 replica walreceiver streaming async 256 0 0 227754 228009
10.13.0.7 replica walreceiver streaming async 1248558 0 0 514 1249072
10.13.0.6 replica walreceiver streaming async 0 0 0 64 64
high pending – busy master/network.
high write/flush/replay – busy standby, long running queries.
Troubleshoot

Database anomalies:
● rollbacks;
● deadlocks;
● recovery conflicts;
● temporary files.
Troubleshoot

datname commit rollback reads hits returned fetched inserts updates deletes conflicts deadlocks tmp_files tmp_bytes read_t write_t
pgbench 11845 0 0 61663 11845 0 0 11845 0 0 0 4 85725 0 0
staging 1854 10 0 128 1844 0 1844 0 0 0 0 0 0 0 0
template1 0 0 0 0 0 0 0 0 0 0 0 0 0 0 0
template0 0 0 0 0 0 0 0 0 0 0 0 0 0 0 0
Postgres 5 0 0 0 0 0 0 0 0 0 0 0 0 0 0
rollbacks – check postgres and application logs for errors.
deadlocks – check postgres log, review pg_locks.
conflicts – check pg_stat_database_conflicts, raise delays, enable feedback.
temporary files – check logs, pg_stat_statements, work_mem (carefully).
Troubleshoot

Tables activity:
● sequential scans;
● abnormal activity;
Troubleshoot

relation seq_scan seq_read idx_scan idx_fetch inserts updates deletes hot_updates live dead
public.job_stats 94 116090 0 0 0 0 0 0 0 0
public.feed_settings 10924 10924 0 0 0 10924 0 10924 0 7
public.feed_actions 0 0 35 1275 0 68 3 0 0 3
public.job_boards 0 0 0 0 0 0 0 0 0 0
Troubleshoot

relation seq_scan seq_read idx_scan idx_fetch inserts updates deletes hot_updates live dead
public.job_stats 94 116090 0 0 0 0 0 0 0 0
public.feed_settings 924 924 0 0 0 924 0 924 0 7
public.feed_actions 0 0 35 1275 0 68 3 0 0 3
public.job_boards 0 0 0 0 0 0 0 0 0 0
sequential scans – no index or broken planner stats.
abnormal activity – too many CRUD, check pg_statio_all_tables.
Troubleshoot

Index activity:
● unused indexes;
Troubleshoot

relation index idx_scan idx_tup_read idx_tup_fetch idx_read idx_hit
public.job_bodies job_bodies_pkey 850 850 850 0 14560
public.job_bodies job_bodies_refcount_idx 850 880 850 0 14960
public.job_bodies job_bodies_reftype_idx 170 255 170 1136 7024
public.job_bodies job_bodies_spc2_idx 0 0 0 0 0
public.job_bodies job_bodies_spc5_idx 0 0 0 0 0
zero idx_scan – unused indexes;
tip: before drop them, check its usage on standbys.
Troubleshoot
Functions usage:
● long running functions;
● run psql, edit function with \ef funcname.
Troubleshoot

Where is the space Postgres ?
● check tables sizes (with and without indexes);
● check tables size changes;
● use filters to see interesting tables.
Troubleshoot

relation total_size rel_size idx_size total_change rel_change idx_change
public.job_bodies 7656200 6557568 1098632 312 260 58
public.job_stats_20161004 1629232 1285764 343468 37928 29920 8008
public.rules 3000 2744 256 0 0 0
public.resumes 384 224 160 0 0 0
public.versions 112 40 72 0 0 0
Troubleshoot

Bad company:
● long running queries or idle transactions;
● waiting queries/transactions;
● cancel queries or terminate backends using pid or mask;
● change age threshold to hide unwanted things.
Troubleshoot

pid cl_addr cl_port datname usename state wait_etype wait_event xact_age query_age change_age query
6942 -1 shopdb shop_app active Lock transactionid 00:10:14 00:00:17 00:00:17 update >
6930 -1 shopdb shop_app active 00:08:17 00:00:12 00:00:12 update >
3429 -1 shopdb shop_app active Lock transactionid 00:07:01 00:00:02 00:00:00 update >
3857 -1 shopdb shop_app active 00:00:00 00:00:00 00:00:00 select >
5781 -1 shopdb shop_bg active 00:03:29 00:00:01 00:00:01 select >
6901 -1 shopdb shop_bg active 00:01:10 00:00:01 00:00:01 select >
idle in transaction, waiting – cancel or terminate.
use age thresholds and filters.
Troubleshoot

Query investigation:
● cpu- or disk hog queries;
● most called queries;
● queries doing a lot of IO;
● pg_stat_statements;
● query reports;
● looking for a query example;
● run psql and EXPLAIN ANALYZE query;
● rewrite a query, build an index, move a query to the standby, blame developers...
Troubleshoot

user database t_all_t t_read_t t_write_t t_cpu_t all_t read_t write_t cpu_t calls queryid query
postgres pgbench 00:56:05 00:00:00 00:00:00 00:56:05 254 0 0 254 10790 e19c70cd44 update >
postgres pgbench 00:00:32 00:00:00 00:00:00 00:00:32 4 0 0 4 10790 cfc329b478 commit;
postgres pgbench 00:00:28 00:00:00 00:00:00 00:00:28 4 0 0 4 10790 731392f8ec begin;
postgres pgbench 00:35:03 00:14:01 00:00:00 00:21:02 85 22 0 107 1587 a357c10e55 select >
postgres pgbench 00:22:27 00:08:15 00:00:00 00:14:12 51 10 0 61 854 4db337810e update >
postgres pgbench 00:07:23 00:00:00 00:00:00 00:07:23 11 0 0 11 59 6acc738af9 select >
Troubleshoot

summary:
total_time: 01:03:47, cpu_time: 00:59:38, io_time: 00:04:09 (ALL: 100.00%, CPU: 93.47%, IO: 6.53%),
total queries: 258,798,086
query info:
usename: streamcast,
datname: outpost,
calls (relative to all queries): 86,250,226 (33.33%),
rows (relative to all queries): 86,250,226 (94.46%),
total time (relative to all queries): 00:58:14 (ALL: 91.3%, CPU: 97.7%, IO: 0.0%),
average time (only for this query): 0.04ms, cpu_time: 0.04ms, io_time: 0.00ms, (ALL: 100.0%, CPU: 100.0%, IO: 0.0%),
query text (id: 14a58a3b9f):
SELECT tags.tg_id FROM tags WHERE tags.id IN (?, ?, ?) AND (id NOT IN (?)) GROUP BY id HAVING count(distinct tg_id) > ? LIMIT ?
Troubleshoot
pgCenter has many features but:
● psql is always available – 'p' hotkey.
● use the help – 'h' hotkey.
In the end

pgCenter is useful:
● to check what's going on;
● for quick overview;
● to make simple admin operations;
● to manage postgres easier and faster (I hope).
In the end

Alexey [email protected]
PostgreSQL–Consulting: Data maintenance as its best.http://postgresql-consulting.com
Questions?