Managing Pediatric Dental Trauma in a Hospital Emergency
40
Managing Pediatric Dental Trauma in a Hospital Emergency Department Jonathan M. Mitchell, DMD, PhD A thesis Submitted in partial fulfillment for the degree of Master of Science of Dentistry University of Washington 2012 Barbara Sheller, DDS, MSD, Co-Chair Elizabeth Velan, DMD, MSD, Co-Chair JoAnna Scott, PhD Derya Caglar, MD Program Authorized to Offer Degree: Pediatric Dentistry
Transcript of Managing Pediatric Dental Trauma in a Hospital Emergency

Managing Pediatric Dental Trauma in a Hospital Emergency Department
Jonathan M. Mitchell, DMD, PhD
A thesis
Submitted in partial fulfillment for the degree of
Master of Science of Dentistry
University of Washington
2012
Barbara Sheller, DDS, MSD, Co-Chair
Elizabeth Velan, DMD, MSD, Co-Chair
JoAnna Scott, PhD
Derya Caglar, MD
Program Authorized to Offer Degree:
Pediatric Dentistry

i
TABLE OF CONTENTS
Page
List of Figures…………………………………………………………………..……. ii
List of Tables………………………………………………………………………… iii
Introduction…………………………………………………………………………... 1
Purpose……………………………………………………………………………….. 4
Methods……………………………………………………………………………….. 5
Results……………………………………………………………………………….... 7
Discussion…………………………………………………………………………….. 10
Figures…...…………………………………………………………………….………… 14
Tables…………………………………………………………………………….……… 20
Bibliography……………………………………………………………………………. 30
Appendix..……………………………………………………………………………… 34

ii
LIST OF FIGURES
Figure number Page
1. Patient flow in the ED for dental traumas………………………….………………. 14
2. Relationship between pain level and type of pain management..…..…………… 15
3. Medical services provided for dental trauma patients in the ED………………… 16
4. Relationship of triage score to ED treatment and wait times for dental
trauma patients……………………………………………………………………..... 17
5. Impact of medications or prescriptions on overall length of stay in ED………... 18
6. Wait and treatment times for dental trauma patients presenting to a
hospital ED………………………………………………………………………..….. 19

iii
LIST OF TABLES
Table number Page
1. Demographics and cause of injury in patients presenting with dental
trauma to a hospital emergency department (ED)………………………………… 20
2. Demographics for patients with no dental home presenting to an ED
with dental trauma………………………………...…………………………………… 21
3. Relationship of triage score to wait and treatment times in an ED……..………… 22
4. Relationship of pain score to treatment times and medical interventions
for patients presenting to an ED with dental trauma…………………….………..... 23
5. Medical services provided to pediatric patients presenting to an ED with
dental trauma……………………….…………………………………………………… 24
6. Dental services provided to pediatric patients presenting to an ED with
dental trauma……………………………………………………………………………. 25
7. Wait and treatment times for patients presenting to an ED with dental
injury……………………………………………………...………………………………. 26
8. Impact of administration of medications and prescriptions on overall length
of stay in the ED for dental trauma patients…….….………................................... 27
9. Patients characteristics for triage level 2 dental traumas presenting to a
hospital ED…………………………………………………………………………….… 28
10. Types of dental injuries presenting to SCH ED (2008-2010)………………………. 29

ACKNOWLEDGEMENTS
I would like to thank my research committee for their guidance and support of this thesis
project. It has been an honor and pleasure to work with all of them. In particular, I would
like to thank Dr. Sheller and Dr. Velan for their tireless efforts and for meeting with me
on many Saturday and Sunday mornings.

DEDICATION
I dedicate this thesis to my wife, Hong, and two children, Nolan and Jenson, for their
unconditional love and support. I appreciate all the sacrifices that they have made over
the past two years. Thank you.
1
INTRODUCTION
Over the past several decades, a shift has taken place in the role of the hospital emergency
department (ED) from a place that primarily treats significant trauma and other medical
emergencies to a source of primary care. In 2007, half of ED visits were for emergent or urgent
care (Niska et al, 2010). For uninsured patients or those with limited access to care, EDs are
now the “provider of last resort for millions of patients” (Institute of Medicine, 2006). This
change has also occurred in dentistry, most significantly for patients of low socioeconomic
status including a disproportionate number of minorities (Pettinato et al, 2000). This
demographic is more likely to be uninsured or have Medicaid, which decreases access to
dental care (Mouradian et al, 2000; Slifkin et al, 2004). Patients without a dental home are
more likely to seek treatment for dental emergencies at an ED (Cohen and Manski, 2006).
In the United States, ED visits increased 23.9% from 1997 to 2007 (Tang et al, 2010). Referred
to as the “safety net of the safety net,” EDs have become inundated with underserved patients,
many of whom present with non-urgent needs (Institute of Medicine, 2006). Studies focusing
on ED wait times have shown that low acuity patients have longer wait times compared to
patients with urgent symptoms, particularly at high-volume community or teaching hospitals
(Canada Institute for Health Information, 2007; Tang et al, 2010). Overcrowded waiting rooms
may delay treatment, increase the length of ED stay, and adversely impact the quality of care
(McCarthy et al, 2009; Schull et al, 2004).
Numerous studies have examined the implications of treating dental emergencies in hospital
EDs. Simple dental trauma results in thousands of ED visits every year. In contrast to a dental
clinic where definitive care can be provided, hospital EDs are not optimal for treating minor
dental trauma. In the United States, $2 trillion is spent per year on health care or $7,000 per
person (American Medical Association, 2010). One of the strategies of the American Medical
Association (AMA) to contain health care costs is to make care delivery more efficient by
reducing unnecessary treatment and directing care to cost-effective sites (American Medical
Association, 2010).

2
Dental emergencies are exacerbating the problem of overcrowded EDs (Schafermeyer and
Asplin, 2003; Schneider et al, 2003). From 1997 to 2000, there were over 700,000 annual
dental-related visits to hospital EDs in the United States (Lewis et al, 2003). Utilization of
hospital EDs for dental-related emergencies is increasing nationwide as demonstrated by a
California study reporting a 12% increase in ED dental visits from 2005 to 2007 (California
Healthcare Foundation, 2009) and a similar study in Houston that showed a 121% increase
from 1997 to 2001 (Ladrillo, 2006). A 2005 study of 6,431 patients presenting to hospital EDs
in Nevada, had total associated costs of $3.9 million. A 2010 study of five urban hospital EDs
in Minnesota, reported over 10,000 ED visits for dental-related problems with total charges
approaching $5 million in one year (Davis, et al. 2010). In New York state, dental treatment
costs at EDs and ambulatory surgery facilities increased from $18.5 to $31.3 million from 2004
to 2008 (Nagarkar, 2012). The majority of these charges were billed to public programs (Davis,
et al. 2010; Nagarkar, 2012).
According to the American Society of Oral Surgeons (ASOS), emergency dental care is the
“management or treatment of hemorrhage, upper airway impairment, trauma, acute infection,
or acute inflammation involving the teeth and dentoalveolar processes which threatens the
person’s life or substantially impairs the functioning of such structures” (DeLuke, 1976). These
types of emergencies rely upon urgent care and may require advanced life support. Most
dental-related emergencies that present to hospital EDs do not meet the ASOS definition.
Unless a hospital ED has dental providers, treatment of dental emergencies will be less
definitive than care by a dentist (Graham et al, 2000; DeLuke, 1976). A 1999 study calculated
that the cost per-visit in an ED was three to four times more than comparable treatment in an
outpatient clinic (Thompson and Glick, 1999). ED medical services are not essential for
appropriate management of most dental emergencies. When patients utilize more than one ED
seeking dental emergency treatment this further compounds inefficiencies and consumption of
resources (Sheller et al, 1997; Rowley et al, 2006).
Five studies of dental emergencies presenting to Seattle Children’s Hospital (SCH) have been
published. In a review of 1,482 cases of after-hours dental emergencies presenting between

3
1982 and 1991, dental trauma comprised 60% of total visits, compared to caries (35%) and
other (5%) (Zeng et al, 1994). Demographic differences were found between caries and
trauma patients: Caucasians were twice as likely to present with dental trauma, non-
Caucasians were more likely to present with caries-emergencies. Mean age of trauma patients
was 5.5 years compared to 7.5 years for caries. Trauma patients were more likely to have
private pay insurance (56% private, 29% none, and 15% Medicaid) compared to caries
patients (35% private, 33% none, and 32% Medicaid).
In a study describing 487 patients presenting with trauma-related emergencies during clinic
(59%) and after-hours (41%) between 1992 and 1994, patient characteristics, diagnoses, and
treatment were analyzed (Lombardi et al, 1998). The emergency visit was the first experience
with a dentist for 227 patients; 187 of first visit patients were 3.5 years or younger. Patient
ethnicity was consistent with the previous study. Payer source was not reported. Most children
had dental injuries that did not require hospital facilities for optimal treatment.
In a study of 2,683 dental emergencies from 1995 to 2003, 51% were trauma-related (Rowley
et al, 2006). Most traumas involved tooth injuries (88%), primarily to maxillary incisors. Similar
to previous SCH studies, there were ethnic differences: 55% of Caucasians presented for
dental trauma compared to African-Americans (45%), Asians (35%), and Hispanics (38%).
Trauma patients were usually younger than caries emergency patients. Medicaid was the most
frequent payer (32%). Thirty-nine percent of trauma patients presented to the ED because no
dentist was available. Twenty-eight percent of trauma patients had no dental home. Trauma
patients came more frequently after hours and 11% were referred from another ED.
All services provided by the ED falls under the Joint Commission on Accreditation of
Healthcare Organizations (JCAHO). JCAHO pain standards were established in January 1,
2001 stating that, “patients have the right to appropriate assessment and management of pain”
and consider pain to be the “fifth vital sign” to be assessed with temperature, pulse, respiration,
and blood pressure (Phillips, 2000; JCAHO, 2012). A five level triage scale is used in the ED at
SCH (Shelton 2009; Travers 2009; Christ 2010).

4
PURPOSE
The purpose of this study was three-fold: 1) examine the types of dental traumas presenting to
an emergency department (ED) of an urban children’s hospital, 2) describe the medical and
dental services provided to these patients, 3) quantify treatment and wait times in the ED for
dental trauma emergencies including the impact of pain score and level of triage acuity on time
variables measured.

5
METHODS
The records of 265 after-hours dental trauma patients receiving emergency dental treatment at
Seattle Children’s Hospital (SCH) from January 1, 2008 through December 31, 2010, were
analyzed in this Institutional Review Board-approved study. SCH is a 245-bed tertiary-care
pediatric teaching hospital located in Seattle, Washington (King County), providing care from
birth to age 21 years. After clinic hours (weekdays 5:00 PM to 8:00 AM; weekends/holidays all
day), patients either call the hospital or present directly to the ED. Phone calls are triaged by
an on-call pediatric dentistry resident who directs the patient to the ED as needed.
Patients presenting to the ED are initially triaged by a pediatric nurse (Figure 1). A triage score
is assigned from 1 to 5, with lower numbers indicating a more acute problem. Pain is scored
from 0 to 10 using a standardized scale with higher numbers indicating more severe pain. For
purposes of this study, pain was categorized as low (0-3), moderate (4-6), or severe (7-10).
Following the nursing assessment, ED patients are evaluated by a medical resident or fellow
then by an ED attending. Patients are referred as indicated to the on-call dental residents. A
problem-focused dental examination and acutely needed treatment is provided for emergency
patients. All emergencies are treated by pediatric dental residents with an attending pediatric
dentist available as needed.
Dental trauma type was classified as soft tissue, primary dentition, or permanent dentition. In
the case of multiple injuries, the most severe injury determined the classification category. For
example, an avulsed permanent incisor with gingival laceration was a categorized as
permanent tooth injury. All variables recorded for this study are listed in Appendix 1.
Data for this study came from the following sources: electronic medical record (Computerized
Information System (CIS)), Epic HyperspaceTM, paper medical record (hard chart), and an
electronic SCH Department of Dentistry After-Hours Patient Log. Dental radiographs are
stored with a copy of the dental treatment notes within the Department of Dentistry. Data
extraction and entry was performed by a single dentist examiner. This study was conducted
6
under committee guidance as partial requirement for the Master’s of Science in Dentistry
Degree at the University of Washington.
Data was entered into a database program (Microsoft Excel). Analysis was conducted with
STATA Version 11.1 (StataCorp LP, College Station, TX). Descriptive statistics were
calculated, including the mean and standard deviation for quantitative measures and frequency
and percent for categorical variables. Comparisons were made between emergency types
(primary tooth injury and permanent tooth injury) and between patient groups using analysis of
variance or t test to compare group means and using a chi-square test to compare group
frequencies.

7
RESULTS
A total of 265 patients with dental trauma (141 primary tooth injuries and 124 permanent tooth
injuries) presented over the study period. Selected patient characteristics are displayed in
Table 1. Mean patient age (7.1 ± 4.7 years), gender (Male 60%; Female 40%), ethnicity, payer
status, and cause of injury are consistent with previous SCH studies (Lombardi et al, 1998;
Rowley et al, 2006). Most patients were self-referred (78.9%). Of the 44 patients referred from
other hospital EDs, 34 had trauma to permanent teeth. All ten patients referred by a dentist,
had primary dental injuries (6 luxations, 3 complicated crown fractures, and 1 uncomplicated
crown fracture).
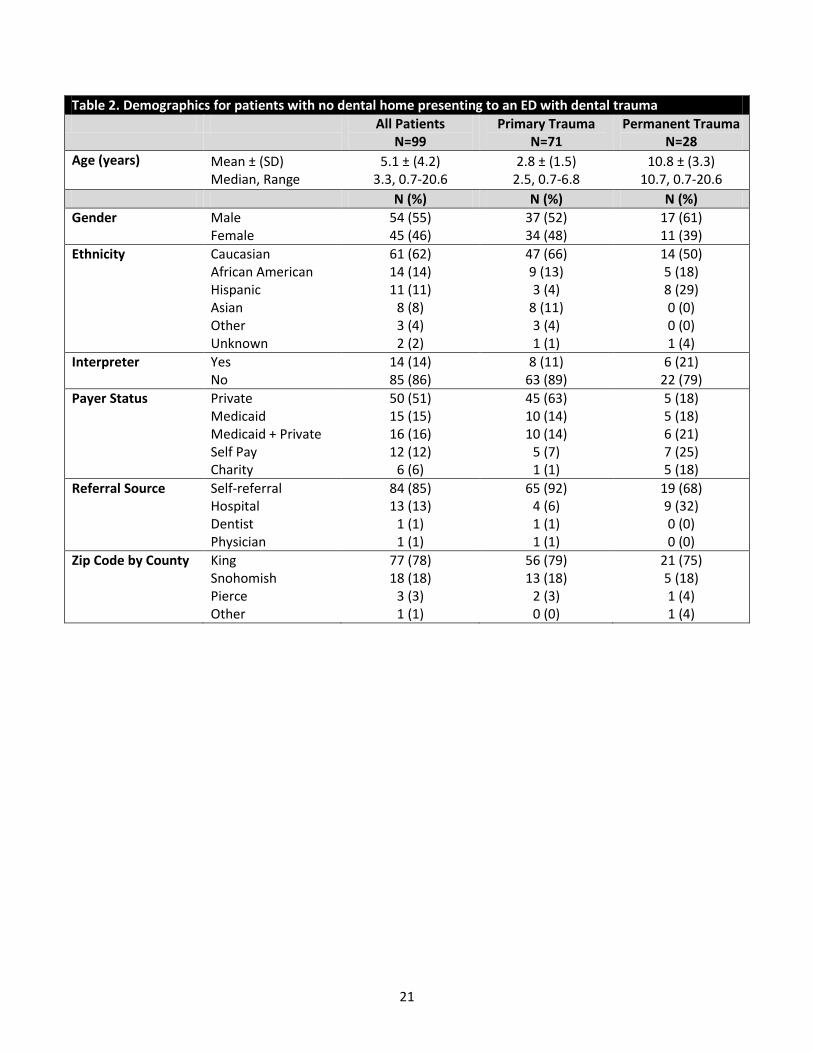
Ten percent of patients had a dental home at SCH or one of its partner institutions (University
of Washington and Odessa Brown Dental Clinic). Of all patients, 37.4% had no dental home;
the mean age for these patients was 5.1 ± 4.2 years (Table 2). Differences in payer status
were found between patients with primary versus permanent dental trauma. Nearly all patients
with primary dental trauma had some form of dental insurance (91.6%) compared to 57.2% of
patients with permanent dental trauma with dental insurance.
Medical and dental services provided
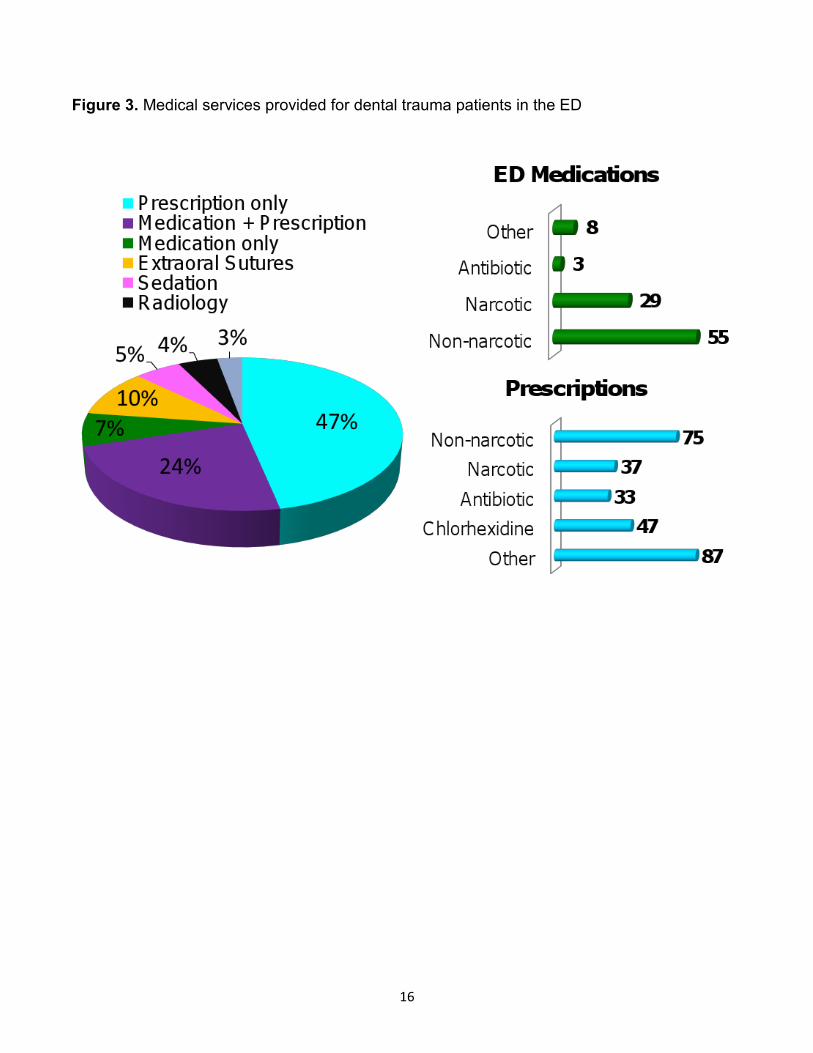
Of the 29% of patients who were given medications in the ED, the majority received analgesics
(57.9% non-narcotics vs. 30.5% narcotics) (Table 4). There were no statistically significant
differences between analgesic administration for primary and permanent dental traumas. Other
services such as non-dental radiographs, extraoral sutures, or laboratory testing were rarely
provided (Figure 3). For the 11 patients who received non-dental radiographic imaging, 8
involved bike or skateboard accidents (3 patients were wearing helmets).
Medications were prescribed for 64.5% of patients to be filled after discharge from the ED;
prescription types were: 28.5% non-narcotic analgesics, 17.9% chlorhexidine, 14.1% narcotic
analgesics, and 12.6% antibiotics (Table 5). Prescription patterns for primary versus
permanent dental traumas differed significantly with more prescriptions for permanent traumas
for narcotics (p=0.016), chlorhexidine (p=0.023), and antibiotics (p<0.001). Thirty-three percent
8
of prescriptions were for other commonly used pediatric medications including asthma
controllers.
Dental treatment ranged in complexity from an examination to tooth reimplantation, splinting,
and intraoral sutures (Table 6). Significant differences were found between primary and
permanent dental traumas for most treatment categories, reflecting recommended trauma
management by the American Academy of Pediatric Dentistry (American Academy of Pediatric
Dentistry. Guidelines on Management of Acute Dental Trauma, 2009). Forty-six out of 265
patients (10.9%) received nitrous oxide anxiolysis and 13 patients (4.9%) were sedated for the
dental procedure by an ED physician.
Triage level
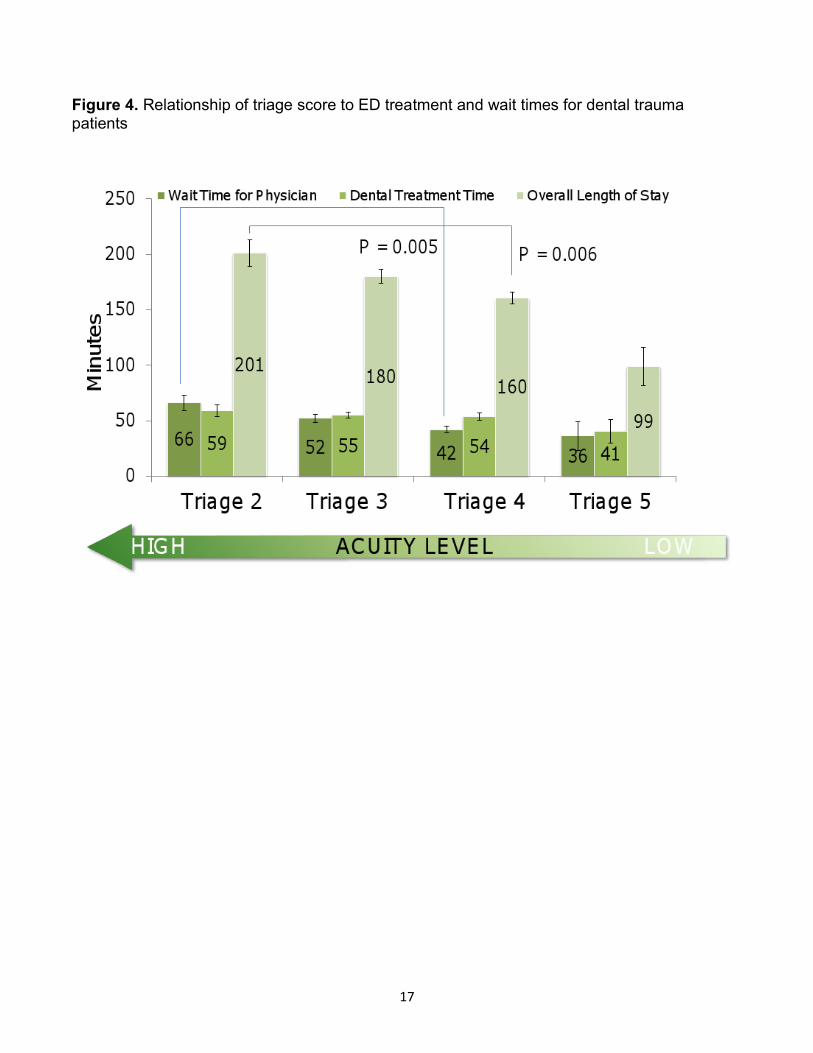
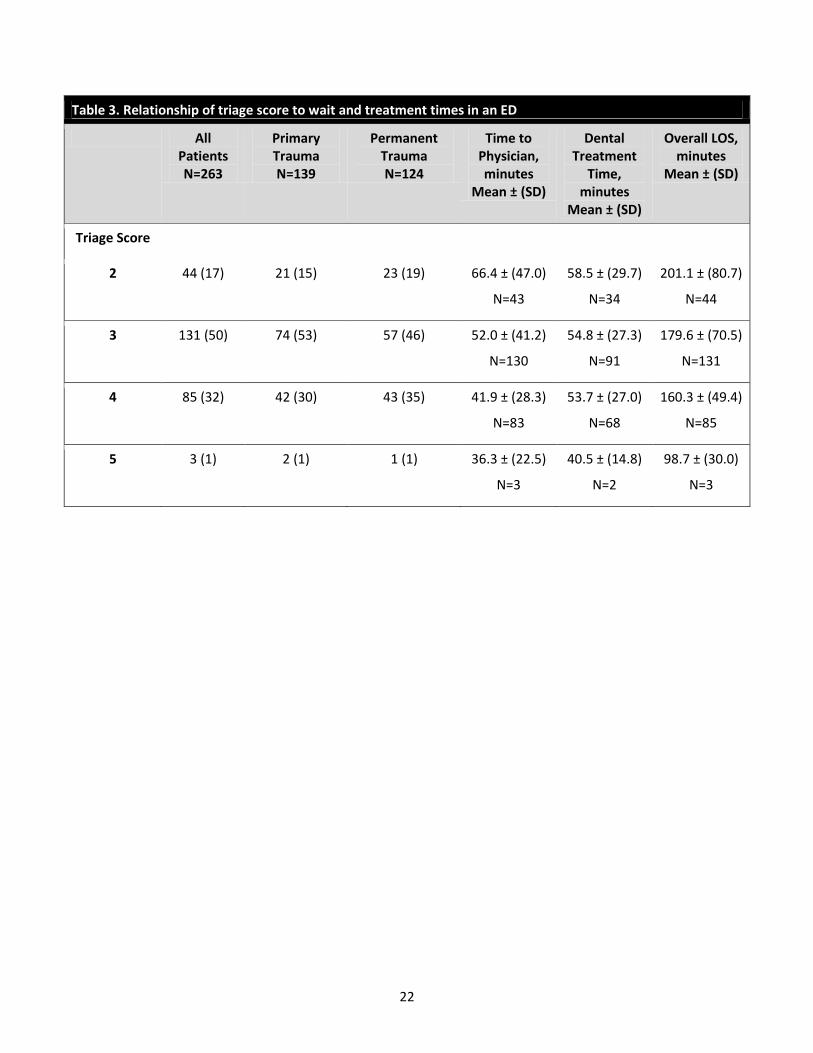
Triage scores were recorded for 263 of 265 patients (Table 3). Two-hundred and sixteen were
triaged with level 3 or 4 type injuries, evenly distributed for both primary and permanent dental
injuries. Forty-four patients were triaged at a higher acuity level (triage 2) and none were
triaged at the highest level (triage 1). As triage acuity increased, indicative of a more severe
dental injury, there was an increase in wait time for MD, dental treatment time, and overall
length of stay (Table 3 and Figure 4). Comparing patients with triage score 4 to those with
triage score 2, increased times were 25 minutes for physician wait time, 5 minutes for dental
treatment, and 40 minutes overall length of stay.
Pain score
Pain scores (low, moderate, or severe) were recorded for 215 of 265 patients (Table 4).
Patient gender was not associated with pain score. Patients reporting moderate or severe pain
were significantly older than those with low pain; low (5.8 + 4.4 years), moderate (8.2 + 4.7
years, low vs. moderate p=0.004), severe (9.6 + 4.7, low vs. severe p<0.001). No significant
age differences were found between moderate and severe pain groups. As pain level
increased, there was a trend towards analgesic administration in the ED and/or prescription
(Figure 2).

9
As pain level increased, the overall length of stay in the ED also increased; a difference of 58
minutes (low vs. severe) for primary dental injuries and 21 minutes (low vs. severe) for
permanent dental injuries (Table 4). For high pain levels, the mean wait time to MD for primary
dental injuries was 85.6 + 46.2 minutes compared to 47.8 + 40.2 for permanent dental injuries.
Dental treatment time was not significantly associated with pain scores. However, for the small
number of children with primary dental trauma and severe pain, treatment time was increased.
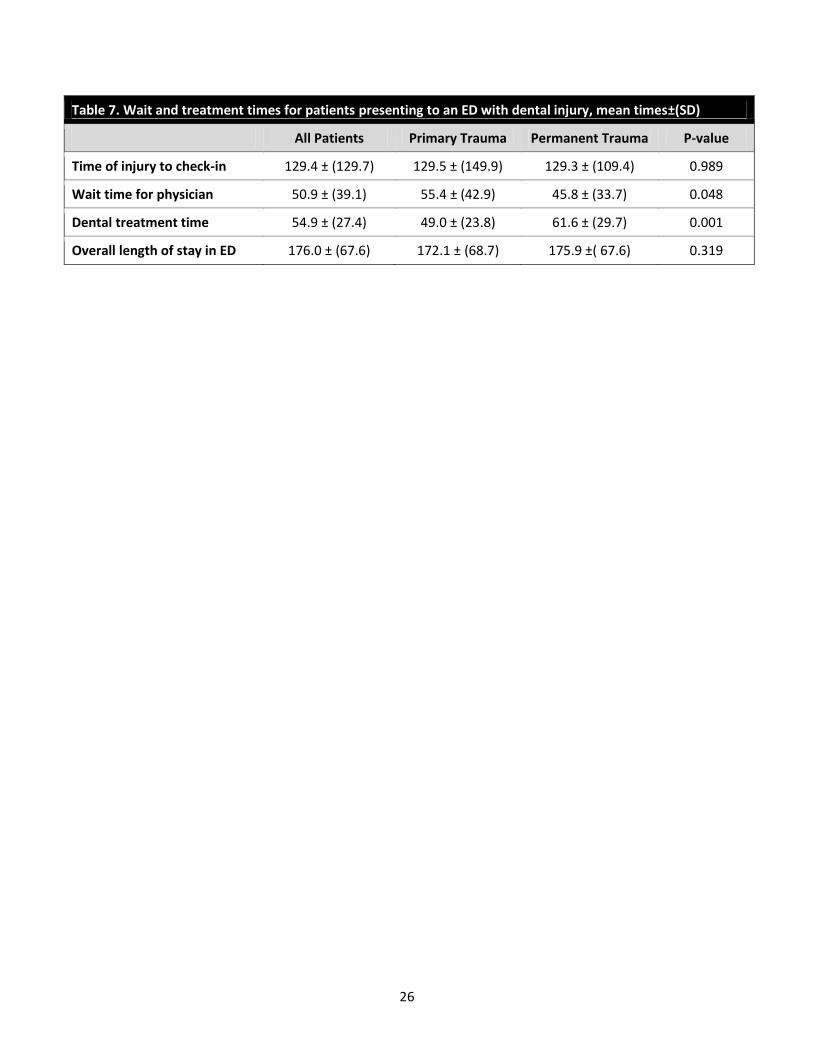
ED wait and treatment times
The average time between dental injury and check-in time at the ED exceeded 2 hours (Table
7). The mean overall length of stay in the ED was nearly 3 hours, with no significant
differences between primary and permanent dental traumas. Time was spent waiting for
providers and receiving medical and dental services. The overall mean wait time for a
physician evaluation (Time to MD) was 50.9 + 39.1 minutes and patients with primary dental
injuries waited a mean of 10 minutes longer than those with permanent dental injuries
(p<0.05). Time receiving dental treatment differed significantly between primary (49.0 + 23.8
minutes) and permanent (61.6 + 29.7 minutes) dental traumas (p<0.001). Administration of
medications (p<0.001) or prescriptions (p<0.001) significantly increased overall length of stay
for both dental injury types; a mean of 40 minutes for medications administered and 35
minutes for prescriptions.
10
DISCUSSION
A hospital ED is not the optimum environment for treating routine dental trauma; care is time-
consuming, expensive, and may not be definitive. Our findings confirm previous reports from
this institution and others regarding patient demographics, injury types, and dental treatment
(Lombardi et al, 1998; Rowley et al, 2006). To our knowledge, this is the first study to examine
the broader implications of receiving care for dental trauma in a hospital ED. If the majority of
time patients spend in the ED is not used receiving dental services, then what other services or
activities account for the time spent?
Since 2001, the AAPD has advocated establishment of a dental home by age 12 months for all
children (AAPD Policy on Dental Home, 2011). One of the reasons for establishing a dental
home at an early age is to secure a resource for emergency services. Over one-third of
patients in this study lacked a dental home; this was not limited to the youngest children. In a
previous study at this institution, Lombardi and co-authors found that the emergency dental
visit was the first appointment for most children younger than age three and under, similar to
our results (Lombardi et al, 1998). Despite educational measures encouraging the public and
healthcare providers to establish a dental home by age one year, this study indicates that
additional efforts are needed. Surprisingly, most of the dentally homeless patients in this study
had private insurance; financial resources for dental care were not presumed to be the primary
barrier. Nearly all dental traumas require timely follow-up, which is problematic for those
patients without a dental home. In a 2011 study of permanent tooth injuries, few patients
returned for recommended follow-up (Gustafson et al, 2011).
Hospital EDs follow JCAHO protocols including pain scores for each emergency patient
(Phillips, 2000; JCAHO, 2012). In this study, pain scores were correlated with an increase in
overall length of stay including longer wait times for medical providers and the overall length of
stay in the ED. Although counterintuitive, wait times for an evaluation by an ED physician were
longer with high pain dental injuries. This may be explained by the complexity of the injury
requiring extensive monitoring and stabilization as well as ancillary medical services including
radiographic imaging or extraoral sutures prior to treatment of their dental injury. Not

11
surprisingly, a high pain score was associated with longer dental treatment times for injuries to
primary teeth. This may be explained both by the complexity of the injury and lack of patient
cooperation in some young patients. Interestingly, few patients received nitrous oxide during
their dental treatment, most likely due to equipment challenges with a mobile nitrous oxide
system.
As pain score increased, both medications administered in the ED and prescriptions for
analgesics increased. However, in the group with the highest levels of pain, administration of
analgesics in the ED occurred less than 50% of the time and analgesic prescriptions slightly
more than half the time. This suggests that the dental treatment was expected to alleviate or
eliminate the pain. The benefit of analgesic medication is accompanied by an increased
amount of time waiting for the medication to be ordered or the prescription to be written, clearly
illustrated by our results. Receiving analgesic medication in the ED added an average of 40
minutes, and receiving a prescription added an average of 35 minutes to the overall length of
stay (Figure 5). The majority of analgesic prescriptions were for medications readily available
over the counter, compounding time inefficiency with increased cost. An additional time burden
exceeding one hour for patients receiving both analgesic administration and prescription is
significant both to families and overloaded EDs. Families discharged with a prescription faced
additional waiting time in the pharmacy. Just over a third of patients received prescriptions for
other medications not related to their dental injury (e.g. albuterol, multivitamins); it is possible
that many of these patients did not have a medical home.
A more acute triage score correlated with an increase in all time variables. For more complex
dental injuries, necessary medical management including the need for ancillary services,
administration of medications, and additional periods of monitoring increased wait times and
overall length of stay. Accordingly, with a more complex dental injury it is not surprising that the
dental treatment time is longer.
In this study, the mean time elapsed from the dental injury to checking in at the ED exceeded
two hours. Timely care for dental trauma is associated with improved outcomes for some
injuries such as avulsions (Andreasen et al, 2002; Flores et al, 2007; AAPD Guidelines on

12
Management of Acute Dental Trauma, 2009). Resources need to be in place so that patients
can reimplant and/or reposition teeth thereby improving long-term outcomes. Although the
majority of patients have had a medical screening by age 1, physicians are not adequately
trained or equipped to manage a dental injury. A 2012 study in the United Kingdom showed
that only a small number of ED physicians felt confident in managing common dental traumas
(Trivedy et al, 2012). Educating parents, teachers, and coaches in the appropriate initial
management of dental injuries is critical. Multiple studies report that parents and teachers have
low knowledge levels for managing dental trauma (Vergotine and Koerber, 2010; Hashim,
2011).
Although appropriate and timely dental treatment is essential, preventing dental injuries is of
the utmost importance. As seen in this and previous studies, falls were the most common
cause of dental injury. Over half of all injuries to primary teeth trauma involved a fall indoors. In
particular, a coffee table in the home presents as a unique hazard for young children still
developing coordination skills (Agostini et al, 2001; Cho et al, 2010). Although bicycle and
sports-related injuries comprised a small percentage of total dental injuries, the majority
involved permanent tooth trauma. In this study, bicycle or scooter injuries when the patient was
not wearing a helmet resulted in more severe dental injuries (luxations and avulsions)
compared to when a helmet was worn (data not shown). The wearing of protective equipment
including mouthguards is promoted by both the AAPD and Academy for Sports Dentistry
(ASD) to minimize sports-related injuries (AAPD Policy on Prevention of Sports-related
Orofacial Injuries, 2009; Academy of Sports Dentistry, 2012).
Although the “dental home” concept was adopted more than ten years ago, this study shows
that many children still do not have a dental home by age one year. If families have a dentist to
contact following a dental trauma, many patients would receive care in an office setting
minimizing time and expense. The economic implications of managing dental traumas in an
ED are unfavorable for patients and third party payers. It is the interest of the insurance
industry to minimize cost of care. Both medical and dental insurance vendors may wish to
commit resources to educational efforts promoting the dental home.

13
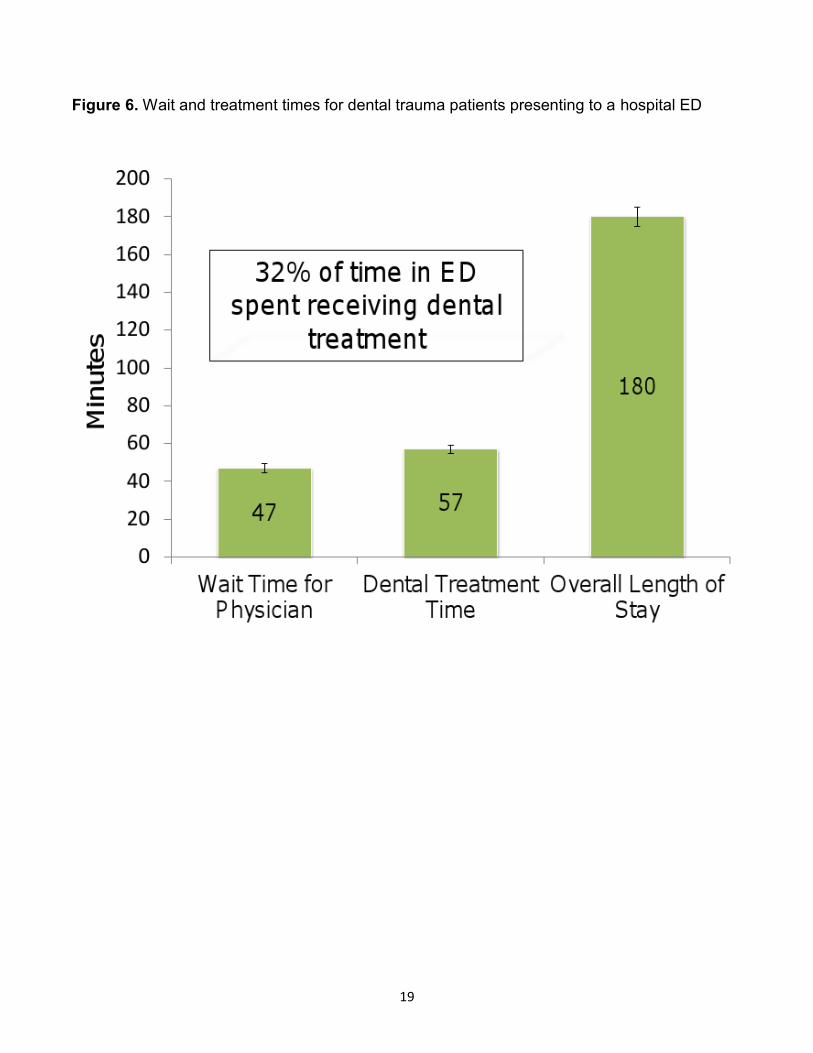
Although the authors of this study have extensive experience with hospitals and EDs, we were
surprised that only one-third of time spent by dental trauma patients was used receiving dental
services (Figure 6). This study demonstrates the need to improve efficiencies in the ED by
reducing overall wait and treatment times. One option may involve fast tracking medically
stable patients; this would be optimal for time-sensitive dental injuries such as permanent tooth
avulsions (Andreasen et al, 2002).
Limitations of this study are differences in the quality of record keeping among multiple medical
and dental providers, subjectivity of pain scores in young patients, inconsistency in triage
scores, and missing data including pain scores and some time parameters. In the current
climate of healthcare reform, and the quest for effective and cost efficient care this study
illustrates multiple opportunities to improve care for patients with dental trauma in the domains
of dental home, fast tracking within the ED, and minimizing the delay between injury and
accessing services.

14
FIGURES
Figure 1. Patient flow in ED for pediatric dental trauma

15
Figure 2. Relationship between pain level and type of pain management
Key: Medication administered in ED (Med); Prescription written (Rx); Pain scores: Low (0-3),
Medium (4-6), High (7-10)
16
Figure 3. Medical services provided for dental trauma patients in the ED
17
Figure 4. Relationship of triage score to ED treatment and wait times for dental trauma patients

18
Figure 5. Impact of medications or prescriptions on overall length of stay in ED
19
Figure 6. Wait and treatment times for dental trauma patients presenting to a hospital ED

20
TABLES
Table 1. Demographics and cause of injury in patients presenting with dental trauma to a hospital emergency department (ED)
All Patients N=265
Primary Trauma N=141
Permanent Trauma N=124
Age (years) Mean ± (SD) Median, Range
7.1 ± (4.7) 6.3, 0.1-21.6
3.0 ±( 1.7) 3.2, 0.7-8.1
10.9 ± (3.3) 10.7, 6.0-21.6
N (%) N (%) N (%)
Gender Male Female
158 (60) 107 (40)
80 (57) 61 (43)
75 (63) 46 (37)
Ethnicity Caucasian African American Hispanic Asian Other Unknown
166 (63) 42 (16) 19 (7) 19 (7) 11 (4) 8 (3)
91 (65) 22 (16)
8 (6) 11 (8) 6 (4) 3 (2)
75 (61) 20 (16) 11 (9) 8 (7) 5 (4) 5 (4)
Interpreter Yes No
31 (12) 234 (88)
17 (12) 124 (88)
14 (11) 110 (89)
Payer Status Private Medicaid Medicaid + Private Self Pay Charity
139 (53) 41 (16) 38 (14) 36 (14) 11 (4)
83 (59) 21 (15) 21 (15) 14 (10)
2 (1)
56 (45) 20 (16) 17 (14) 22 (18)
9 (7)
Dental Home Private UW/Seattle Children’s Community clinic None
120 (45) 28 (11) 14 (5)
99 (37) 4 (2)
53 (38) 4 (3)
11 (8) 71 (50)
2 (2)
67 (54) 24 (19)
3 (2) 28 (23)
2 (1)
Referral Source Self-referral Hospital Dentist Physician
209 (79) 44 (17) 10 (4) 2 (1)
119 (84) 10 (7) 10 (7) 2 (1)
90 (73) 34 (27)
0 (0) 0 (0)
Zip Code by County King Snohomish Pierce Other
204 (77) 45 (17)
7 (3) 9 (3)
113 (80) 20 (14)
4 (3) 4 (3)
91 (73) 25 (20)
3 (2) 5 (4)
Cause of Injury Fall indoors Fall outdoors Bicycle/scooter Athletics Other Unknown
93 (35) 62 (24) 34 (13) 17 (6)
62 (24) 3 (1)
72 (51) 41 (29)
9 (6) 1 (1)
16 (11) 3 (2)
21 (17) 21 (17) 25 (20) 16 (13) 46 (37)
0 (0)
21
Table 2. Demographics for patients with no dental home presenting to an ED with dental trauma
All Patients N=99
Primary Trauma N=71
Permanent Trauma N=28
Age (years) Mean ± (SD) Median, Range
5.1 ± (4.2) 3.3, 0.7-20.6
2.8 ± (1.5) 2.5, 0.7-6.8
10.8 ± (3.3) 10.7, 0.7-20.6
N (%) N (%) N (%)
Gender Male Female
54 (55) 45 (46)
37 (52) 34 (48)
17 (61) 11 (39)
Ethnicity Caucasian African American Hispanic Asian Other Unknown
61 (62) 14 (14) 11 (11)
8 (8) 3 (4) 2 (2)
47 (66) 9 (13) 3 (4)
8 (11) 3 (4) 1 (1)
14 (50) 5 (18) 8 (29) 0 (0) 0 (0) 1 (4)
Interpreter Yes No
14 (14) 85 (86)
8 (11) 63 (89)
6 (21) 22 (79)
Payer Status Private Medicaid Medicaid + Private Self Pay Charity
50 (51) 15 (15) 16 (16) 12 (12)
6 (6)
45 (63) 10 (14) 10 (14)
5 (7) 1 (1)
5 (18) 5 (18) 6 (21) 7 (25) 5 (18)
Referral Source Self-referral Hospital Dentist Physician
84 (85) 13 (13)
1 (1) 1 (1)
65 (92) 4 (6) 1 (1) 1 (1)
19 (68) 9 (32) 0 (0) 0 (0)
Zip Code by County King Snohomish Pierce Other
77 (78) 18 (18)
3 (3) 1 (1)
56 (79) 13 (18)
2 (3) 0 (0)
21 (75) 5 (18) 1 (4) 1 (4)
22
Table 3. Relationship of triage score to wait and treatment times in an ED
All Patients N=263
Primary Trauma N=139
Permanent Trauma N=124
Time to Physician, minutes
Mean ± (SD)
Dental Treatment
Time, minutes
Mean ± (SD)
Overall LOS, minutes
Mean ± (SD)
Triage Score
2 44 (17) 21 (15) 23 (19) 66.4 ± (47.0)
N=43
58.5 ± (29.7)
N=34
201.1 ± (80.7)
N=44
3 131 (50) 74 (53) 57 (46) 52.0 ± (41.2)
N=130
54.8 ± (27.3)
N=91
179.6 ± (70.5)
N=131
4 85 (32) 42 (30) 43 (35) 41.9 ± (28.3)
N=83
53.7 ± (27.0)
N=68
160.3 ± (49.4)
N=85
5 3 (1) 2 (1) 1 (1) 36.3 ± (22.5)
N=3
40.5 ± (14.8)
N=2
98.7 ± (30.0)
N=3

23
Table 4. Relationship of pain score to treatment times and medical interventions for patients presenting to an ED with dental trauma
All Patients N=215
Low (0-3) N=127
Moderate (4-6) N=57
Severe (7-10) N=31
N (%) N (%) N (%) N (%)
Age Mean ± (SD) Median, Range
7.0 ± (4.7)
6.7, 0.7-21.6
5.8 ± (4.4)
4.9, 0.8-17.5
8.2 ± (4.7)
8.9, 1.2-18.9
9.6 ± (4.7)
9.5. 0.7-21.6
Gender Male Female
130 (60) 86 (40)
75 (59) 53 (41)
37 (65) 20 (35)
18 (58) 13 (42)
Triage Score 2 3 4 5
36 (17)
105 (49) 71 (33)
3 (1)
17 (13) 57 (45) 50 (39)
3 (3)
12 (21) 30 (53) 15 (26)
0 (0)
7 (23)
18 (58) 6 (19) 0 (0)
Medications in ED Narcotic Non-narcotic
23 (11) 44 (21)
11 (9)
20 (16)
7 (12)
14 (25)
5 (16)
10 (32)
Prescriptions Narcotic Non-narcotic
31 (14) 58 (27)
12 (9)
36 (28)
13 (23) 11 (19)
6 (19)
11 (35)
Wait and treatment times in ED, minutes ± (SD)
Wait time for physician
Primary trauma Permanent trauma
50.7 ± (41.0)
50.7 ± (46.4) 44.5 ± (34.1)
49.9 ± (42.3)
55.2 ± (47.1) 42.7 ± (33.8)
49.4 ± (35.1)
54.5 ± (40.5) 45.1 ± (29.9)
56.4 ± (46.2)
85.6 ± (56.7) 47.8 ± (40.2)
Dental treatment time
Primary trauma Permanent trauma
55.4 ± (25.9)
48.7 ± (22.2) 61.9 ± (27.7)
54.8 ± (27.4)
48.7 ± (20.3) 63.7 ± (33.6)
53.3 ± (22.5)
44.1 ± (21.2) 60.7 ± (21.1)
61.0 ± (26.8)
63.7 ± (36.1) 60.1 ± (24.4)
Overall length of stay in ED
Primary trauma Permanent trauma
169.0 ± (58.2)
162.5 ± (58.0) 175.3 ± (58.0)
161.6 ± (54.6)
157.2 ± (53.2) 167.6 ± (56.5)
171.3 ± (61.0)
162.3 ± (67.1) 178.4 ± (55.9)
195.3 ± (61.2)
218.4 ± (49.2) 188.6 ± (63.6)

24
Table 5. Medical services provided to pediatric patients presenting to an ED with dental trauma
All Patients N=265
Primary Trauma N=141
Permanent Trauma N=124
P-value
N (%) N (%) N (%)
MEDICATIONS ADMINISTERED Non-narcotic Narcotic Antibiotic Other
55 (21) 29 (11)
3 (1) 8 (8)
28 (20) 12 (9) 2 (2) 3 (3)
27 (7) 17 (7) 1 (4) 5 (4)
0.677 0.169 0.644 0.361
PRESCRIPTIONS Non-narcotic Narcotic Chlorhexidine Antibiotic Other
75 (29) 37 (14) 47 (18) 33 (13) 87 (33)
43 (31) 13 (9) 8 (6)
11 (8) 49 (36)
32 (26) 24 (19) 39 (31) 22 (18) 38 (31)
0.282 0.016 0.023
<0.001 0.334
ADJUNCT SERVICES Sedation Extraoral sutures Radiology Laboratory services Diagnostic
13 (5) 24 (9) 11 (4) 3 (1) 4(2)
10 (7)
15 (11) 3 (2) 0 (0) 1 (1)
3 (2) 9 (7) 8 (7) 2 (2) 3 (2)
0.084 0.360 0.078

25
Table 6. Dental services provided to pediatric patients presenting to an ED with dental trauma
All Patients N=265
Primary Trauma N=141
Permanent Trauma N=124
P-value
N (%) N (%) N (%)
DENTAL SERVICES Intraoral radiographs Extraction Indirect pulp capping Exam only Splint Intraoral sutures Nitrous oxide Pulpotomy Reimplant tooth Reposition tooth Other
230 (87) 85 (32) 58 (22) 53 (20) 39 (15) 34 (13) 29 (11) 22 (8) 6 (2) 5 (2) 6 (2)
110 (78) 80 (57)
4 (3) 40 (28)
0 (0) 24 (17) 17 (12)
0 (0) 0 (0) 2 (1) 4 (3)
120 (97)
5 (4) 54 (44) 13 (11) 39 (32) 10 (8)
12 (10) 22 (18)
6 (5) 3 (2) 2 (2)
<0.001 <0.001 <0.001 <0.001 <0.001 0.033
<0.001 0.007 0.540 0.517
26
Table 7. Wait and treatment times for patients presenting to an ED with dental injury, mean times±(SD)
All Patients Primary Trauma Permanent Trauma P-value
Time of injury to check-in 129.4 ± (129.7) 129.5 ± (149.9) 129.3 ± (109.4) 0.989
Wait time for physician 50.9 ± (39.1) 55.4 ± (42.9) 45.8 ± (33.7) 0.048
Dental treatment time 54.9 ± (27.4) 49.0 ± (23.8) 61.6 ± (29.7) 0.001
Overall length of stay in ED 176.0 ± (67.6) 172.1 ± (68.7) 175.9 ±( 67.6) 0.319

27
Table 8. Impact of administration of medications and prescriptions on overall length of stay in the ED for dental trauma patients, mean times±(SD)
All Patients P-value Primary Trauma P-value Permanent Trauma P-value
ED MEDICATION Yes No
203.5 ± (83.3) 164.1 ± (56.1)
<0.001
205.0 ± (84.3) 155.4 ± (52.3)
<0.001
205.7 ± (76.8) 167.4 ± (56.4)
0.006
PRESCRIPTION Yes No
187.5 ± (71.0) 153.8 ± (54.7)
<0.001
186.0 ± (72.9) 151.8 ± (57.0)
<0.001
189.6 ± (70.0) 157.8 ± (50.9)
0.014

28
Table 9. Patients characteristics for triage level 2 dental traumas presenting to a hospital ED
All Patients N=44
Primary Trauma N=21
Permanent Trauma
N=23
Age (years) Mean±(SD) Median, Range
7.3 ± (3.9) 6.8, 0.8-14.0
3.7 ± (1.8) 3.0, 0.8-7.9
10.4 ± (2.2) 10.0, 6.0-14.0
N (%) N (%) N (%)
Referral Source Self-referral Hospital Dentist Physician
31 (71) 11 (25)
0 (0) 2 (5)
18 (86) 1 (5) 0 (0)
2 (10)
13 (57) 10 (44)
0 (0) 0 (0)
Cause of Injury Fall indoors Fall outdoors Bicycle/scooter Athletics Other Unknown
9 (21) 10 (23) 8 (18) 2 (5)
14 (32) 1 (2)
8 (38) 7 (33) 2 (9) 1 (5)
2 (10) 1 (5)
1 (4) 3 (13) 6 (26) 1 (4)
12 (52) 0 (0)
Dental Injury Types
Avulsion Luxation Complicated crown fracture Other
13 (30) 14 (32) 6 (14)
11 (25)
5 (24) 7 (33) 1 (4)
8 (38)
8 (35) 7 (30) 5 (22) 3 (13)
Medical Services Extraoral sutures Sedation Radiology Laboratory services Diagnostic
7 (16) 4 (9) 4 (9) 1 (2) 2 (5)
4 (19) 4 (19) 0 (0) 0 (0) 0 (0)
3 (13) 0 (0)
4 (17) 1 (4) 2 (9)

29
Table 10. Types of dental injuries presenting to SCH ED (2008-2010)
Primary Trauma N=141
Permanent Trauma N=124
N (%) N (%)
Luxation 72 (51) 31 (25)
Lateral
Extrusion
Intrusion
35 (25)
17 (12)
20 (14)
12 (10)
13 (10)
6 (5)
Crown fracture 23 (16) 68 (55)
Uncomplicated
Complicated
8 (6)
15 (11)
45 (36)
23 (19)
Avulsion
Subluxation
Soft tissue
Concussion
Alveolar fracture
Root fracture
14 (10)
12 (9)
13 (9)
1 (1)
5 (4)
1 (1)
17 (14)
2 (2)
5 (4)
0 (0)
1 (1)
0 (0)
30
BIBLIOGRAPHY
Agostini FG, Flaitz CM, Hicks MJ. Dental emergencies in a university-based pediatric dentistry
postgraduate outpatient clinic: a retrospective study. ASDC J Dent Child. 68:316-21, 300-1,
2001.
Academy of Sports Dentistry. 2012. http://www.academyforsportsdentistry.org (Accessed April
7, 2012).
American Academy of Pediatric Dentistry. Guidelines on Management of Acute Dental
Trauma. Pediatric Dentistry. 31(6):168-176, 2009.
American Academy of Pediatric Dentistry. Policy on the dental home. 2011.
http://www.aapd.org/media/policies_guidelines/p_dentalhome.pdf (Accessed April 10, 2012).
American Academy of Pediatric Dentistry. Policy on prevention of sports-related orofacial
Injuries. Pediatric Dentistry. 31(6):56-58, 2009.
American Medical Association (AMA). “Getting the most for our health care dollars: strategies
to address rising health care costs.” 2010 http://www.ama-assn.org/ama/pub/about-ama/2010-
strategic-issues/health-care-costs.shtml (Accessed April 7, 2012).
Andreasen FM, Skeie A, Hjorting-Hansen E, Schwartz O. Effect of treatment delay upon pulp and periodontal healing of traumatic dental injuries a review article. Dent Traumatol. 18:116-128, 2002.
Andrulis DP, Kellermann A, Hintz EA, Hackman BB, Weslowski VB. Emergency departments and crowding in United States teaching hospitals. Ann Emerg Med. 20(9):980-6, 1991.
California Healthcare Foundation. Emergency department visits for preventable dental conditions in California. Oakland, CA: California Healthcare Foundation; 2009. Carlson J. Free care adds up: hospitals' uncompensated costs up 10%. Modern Healthcare.
40(50): 10, 2010.
Canadian Institute for Health Information: Analysis in Brief, Understanding Emergency
Department Wait Times: How Long do People Spend in Emergency Departments in Ontario?
Ottawa: Canadian Institute of Health Information; 1-21, 2007.
Choi SC, Park JH, Pae A, Kim HR. Retrospective study on traumatic dental injuries in preschool children at Kyung Hee dental hospital, Seoul, South Korea. Dent Traumatol. 26:70-75, 2010.

31
Christ M, Grossmann F, Winter D, Bingisser R, Platz E. Modern triage in the emergency department. Dtsch Arztebl Int 107(50): 892–8, 2010. Cohen L, Manski R, Hooper F: Does the elimination of Medicaid reimbursement affect the frequency of emergency department dental visits? JADA 127:605-609, 1996. Cohen L, Manski R. Visits to Non-Dentist Health Care Providers for Dental Problems. Fam
Med. 8(8):556-64, 2006.
Davis ED, Deinard AS, Maïga EWH. Doctor, my tooth hurts: the costs of incomplete dental
care in the emergency room. J of Public Health Dentistry. 70: 205-210, 2010.
DeLuke D. Emergency dental care for the community: what is the responsibility of the hospital? J Hosp Dent Pract. 10(2):43-5, 1976. Flores MT, Andersson L, Andreasen JO, et al. Guidelines for the management of traumatic dental injuries II: avulsions of permanent teeth. Dent Traumatol. 23:66-71, 2007. Graham D, Webb M, Seale N: Pediatric emergency room visits for non-traumatic dental disease. Ped Dent 22:134-140, 2000. Gustafson D, McTigue D, Thikkurissy S, Casamassimo P, Nusstein J. Continued care of
children seen in an emergency department for dental trauma. Pediatric Dentistry.
2011;33(5):426-430.
Hashim R. Dental trauma management awareness among primary school teacher in the
Emirate of Ajman, United Araba Emirates. Eur j Paediatr Dent. 12(2):99-102, 2011.
Institute of Medicine. Hospital-based emergency care: at the breaking point. Washington, DC:
National Academies Press; pg .42, 2006.
Joint Commission on Accreditation of Healthcare Organizations. Facts about pain management. 2012. http://www.jointcommission.org/pain_management (Accessed April 7, 2012). Kaste LM, Gift HC, Bhat M, Swango PA: Prevalence of incisor trauma in persons 6-50 years of age: United States, 1988-1981. J Dent Res. 75:696-705, 1996. Ladrillo TE, Hobdell MH, Caviness AC. Increasing prevalence of emergency department visits for pediatric dental care, 1997-2001. JADA. 137:379-385, 2006. Lewis C, Lynch H, Johnston B. Dental complaints in emergency departments: a national perspective. Ann Emerg Med. 42-93-9, 2003.

32
Lombardi S, Sheller B, Williams B: Diagnosis and treatment of dental trauma in a children’s hospital. Ped Dent. 20:112-20, 1998. McCarthy M, Zeger S, Ding R, Levin S, et al. Crowding substantially delayed patients' waiting room and boarding times but not treatment time. Ann Emerg Med. 54(4):492-503, 2009.
Manski R, Cohen LA, Hooper FJ. Use of a hospital emergency rooms for dental care. General
Dentistry. 46(1):44-47, 2009.
Mouradian W, Wehr E, Crall J. Disparities in children’s oral health and access to dental care.
JAMA 284(20):2625-2630, 2000.
Nagarkar SR, Kumar JV, Moss ME. Early childhood caries: related visits to emergency
departments and ambulatory surgery facilities and associated charges in New York state.
JADA. 143(1):59-65.
Niska R, Bhuiya F, Xu J. National Hospital Ambulatory Medical Care Survey: 2007 emergency department summary. Natl Health Stat Report. 26:1-31, 2010.
Pettinato E, Webb M, Seale N. A comparison of Medicaid reimbursement for non-definitive
pediatric dental treatment in the emergency room versus periodic preventive care. Ped Dent
22:463-68, 2000.
Phillips DM. JCAHO Pain Management Standards Are Unveiled. AMA. 284(4):428-429, 2000.
Rowley ST, Sheller B, Williams BJ, Mancl L. Utilization of a hospital for treatment of pediatric
dental emergencies. Pediatric Dentistry. 28:10-17, 2006.
Schafermeyer RW, Asplin BR. Hospital and emergency department crowding in the United
States. Emerg Med. 15(1):22-7, 2003.
Schneider SM, Gallery ME, Schafermeyer R, Zwemer FL. Emergency department crowding: A
point in time. Ann Emerg Med. 42(2):167-72, 2003.
Schull MJ, Vermeulen M, Slaughter G, Morrison L, et al. Emergency department crowding and
thrombolysis delays in acute myocardial infarction. Annals of Emergency Medicine 44(6):577–
585, 2004.
Schull, MJ, Kiss A, Szalai JP. The effect of low-complexity patients on emergency department waiting times. Ann Emerg Med. 49(3):257-64, 2007.

33
Schwartz S. A one-year statistical analysis of dental emergencies in a pediatric hospital. J
Pediatric Dent 60:959-68, 1994.
Sheller B, Williams B, Lombardi S: Diagnosis and treatment of dental caries related
emergencies in a children’s hospital. Ped Dent 19:470-75, 1997.
Shelton R The emergency severity index 5-level triage system. Dimensions of Critical Care Nursing 28(1):9-12, 2009.
Slifkin RT, Silberman P, Freeman V. Moving from Medicaid to North Carolina Health Choice:
changes in access to dental care for NC children. NC Med Journal. 133:715-24, 2004.
Thompson KM and Glick DF. Cost Analysis of emergency room use by low-income patients.
Nursing Economics. 1999.
Travers DA, Waller AE, Katznelson J, Agans R. Reliability and validity of the emergency severity index for pediatric triage. Academic Emergency Medicine 16:843–849, 2009.
Trivedy C, Kodate N, Ross A, Al-Rawi H, Jaiganesh T, Harris T, Anderson J. The attitudes and
awareness of emergency department (ED) physicians towards the management of common
dentofacial emergencies. Dental Traumatology. 28:121-126, 2012.
Vergotine RJ and Koerber A. The relationship of dental visits to parental knowledge of
management of dental trauma. Jounral of Pediatric Dentistry. 32(4):329-332, 2010.
Zeng Y, Sheller B, Milgrom P. Epidemiology of dental emergency visits to an urban children’s
hospital. Ped Dent 16:419-23, 1994.

34
APPENDIX 1. Data recorded from each patient and emergency record.
Medical Record Number Date and time of service Date of birth Ethnicity Gender Zip code Interpreter status Payer ER triage acuity: 1, 2, 3, 4 Pain score: 1-10 Medical services provided: medical radiography, diagnostic imaging, laboratory tests,
extraoral sutures, sedation, medications, and prescriptions Dental treatment provided
Temporal data (see Figure 1 for timeline): Time of injury Arrival time at ER (Check-in) Triage time in ER Time to physician examination Dental treatment time Discharge time