Managing Oil Price Risk with Derivatives - World...
24
1 Managing Oil Price Risk Managing Oil Price Risk with Derivatives with Derivatives Tenzing Sharchok, Senior Financial Officer Ivan Zelenko, Head of Structured Finance and Derivatives The World Bank Treasury Stabilizing Oil Fiscal Revenues over the Short to Medium Term Oil Price Volatility Financial Forum March 11, 2008 Washington, DC 03/23/2008 2 Managing Oil Price Risk Managing Oil Price Risk Agenda Agenda Definition of a Stabilization Policy Risk Management with Derivatives Implementation Case Study: European Airlines
Transcript of Managing Oil Price Risk with Derivatives - World...

1
Managing Oil Price RiskManaging Oil Price Riskwith Derivativeswith Derivatives
Tenzing Sharchok, Senior Financial OfficerIvan Zelenko, Head of Structured Finance and DerivativesThe World Bank Treasury
Stabilizing Oil Fiscal Revenues over the Short to Medium Term
Oil Price Volatility Financial ForumMarch 11, 2008
Washington, DC
03/23/2008 2
Managing Oil Price RiskManaging Oil Price Risk
AgendaAgenda
Definition of a Stabilization Policy
Risk Management with Derivatives
Implementation
Case Study: European Airlines

2
03/23/2008 3
Managing Oil Price RiskManaging Oil Price Risk
AgendaAgenda
Definition of a Stabilization Policy
Risk Management with Derivatives
Implementation
Case Study: European Airlines
03/23/2008 4
Managing Oil Price Risk Managing Oil Price Risk Definition of a Stabilization PolicyDefinition of a Stabilization Policy
Oil price risk challenges fiscal policy
Oil exporting countries may derive a large share of their fiscalrevenues from oil sales
Exposure to oil price challenges fiscal policy:
shelving of planned projects, higher savings and lower investments, wasteful use of oil ‘windfall’
increased vulnerability of governments balance sheet
Exporting countries have set up policies to insulate budgetary revenues from oil price shocks
3
03/23/2008 5
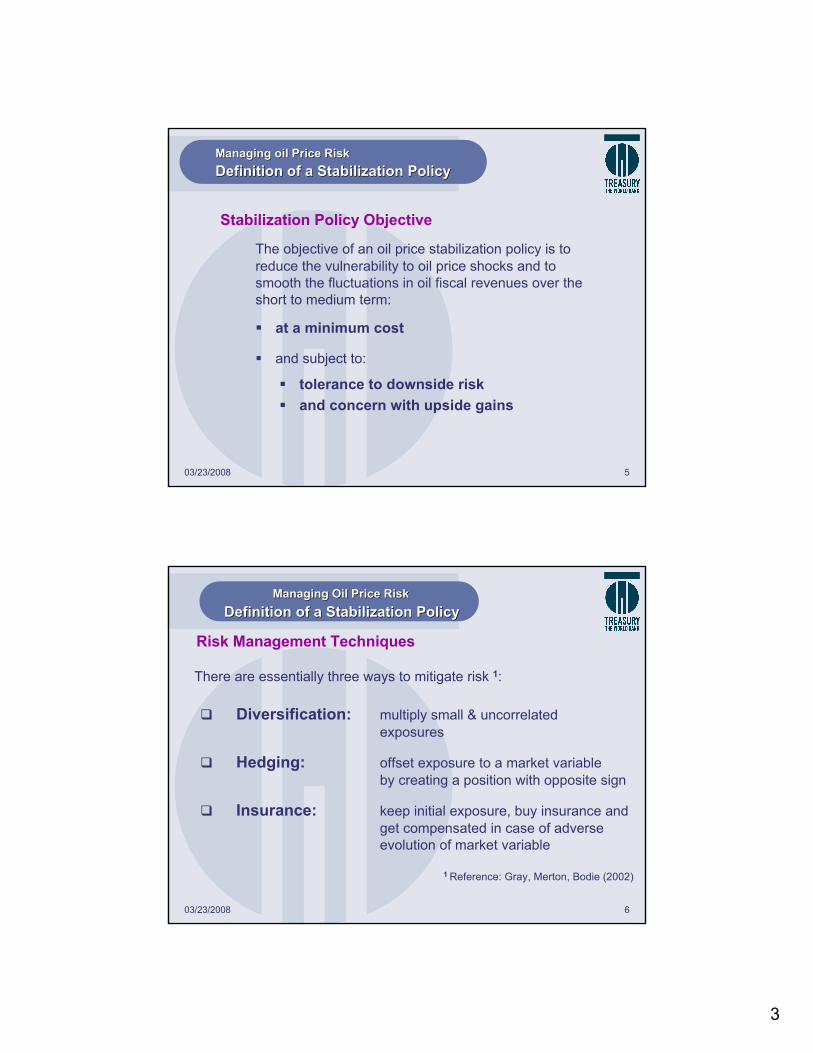
The objective of an oil price stabilization policy is to reduce the vulnerability to oil price shocks and to smooth the fluctuations in oil fiscal revenues over the short to medium term:
at a minimum cost
and subject to:
tolerance to downside riskand concern with upside gains
Managing oil Price RiskManaging oil Price RiskDefinition of a Stabilization PolicyDefinition of a Stabilization Policy
Stabilization Policy Objective
03/23/2008 6
There are essentially three ways to mitigate risk 1:
Diversification: multiply small & uncorrelated exposures
Hedging: offset exposure to a market variable by creating a position with opposite sign
Insurance: keep initial exposure, buy insurance and get compensated in case of adverse evolution of market variable
1 Reference: Gray, Merton, Bodie (2002)
Managing Oil Price RiskManaging Oil Price RiskDefinition of a Stabilization PolicyDefinition of a Stabilization Policy
Risk Management Techniques

4
03/23/2008 7
Managing Oil Price RiskManaging Oil Price Risk
Definition of a Stabilization PolicyDefinition of a Stabilization Policy
Approaches for a Stabilization Policy
Hedging
Self Insurance
Hedging and/or
Insurance
Issue oil Denominated Liabilities
Set up a Stabilization Fund
Transfer Risk to Markets
using Derivatives
03/23/2008 8
Stabilization Funds have been set up to immunize budgets
Oil revenues above a certain reference price are saved in the Fund. The Fund pays to the budget to ensure stable oil fiscal revenues based on the reference price.
BudgetOil Price sensitive Fiscal Revenues
Managing Oil Price RiskManaging Oil Price RiskDefinition of a Stabilization PolicyDefinition of a Stabilization Policy
Fluctuate
StabilizationFund
Stable

5
03/23/2008 9
Two categories of Funds with distinct objectives
Short to Medium Term Stabilization: “Stabilization Funds”
Savings and Stabilization over the Very Long Run: “Funds for the Future”
Smooth fiscal oil revenues & insulate budget against oil price shocks and volatility.
Transform depleting oil wealth into permanent & stable income through a diversified portfolio of financial assets
Managing Oil Price RiskManaging Oil Price RiskDefinition of a Stabilization PolicyDefinition of a Stabilization Policy
03/23/2008 10
Stabilization Funds have shortcomings
The initial capitalization of and the reference price should be properly set to avoid either exhaustion or over-accumulation
The reference price is difficult to determine as oil prices do not exhibit a natural long term average. It could, however, be defined as a moving average.
The accumulated savings may raise the question of their use.But the Fund may include a “Fund for the Future” tranche
Stabilization Funds require robust governance rules
Cost of carry if invested in short term liquid $ assets
Managing Oil Price RiskManaging Oil Price RiskDefinition of a Stabilization PolicyDefinition of a Stabilization Policy

6
03/23/2008 11
Transfer Risk to Markets using Oil Derivatives
Oil Derivatives enable hedging or insurance RM strategies. They do not require immobilization of capital. They can be combined with the Stabilization Fund approach.
Managing Oil Price RiskManaging Oil Price RiskDefining a Stabilization PolicyDefining a Stabilization Policy
BudgetStabilization Fund
Oil Price sensitive Fiscal Revenues
Transfer of Risk
Fluctuate Derivativestransaction
Stable
03/23/2008 12
Derivatives can increase efficiency in Risk Management
The use of derivatives in Risk Management has become much safer since the second half of the 90s
There are now standard rules and methods for safely setting up a derivatives trading platform with the appropriate procedures and controls
Derivatives such as swaps or forwards have become commoditized products that are increasingly used by central banks or government debt agencies
Hedging or buying insurance from the market should improve on a savings policy. But the safe use of derivatives requires an appropriate platform
Managing Oil Price RiskManaging Oil Price RiskDefinition of aDefinition of a Stabilization PolicyStabilization Policy

7
03/23/2008 13
Managing Oil Price RiskManaging Oil Price Risk
Definition of a Stabilization PolicyDefinition of a Stabilization Policy
ObjectiveGovernanceApproachTime HorizonRisk ToleranceBudgetInstrumentsImplementation infrastructure
Formulation of a Risk Management Policy
03/23/2008 14
Managing Oil Price RiskManaging Oil Price Risk
AgendaAgenda
Definition of a Stabilization Policy
Risk Management with Derivatives
Implementation
Lessons learned: Case Study of European Airlines

8
03/23/2008 15
Managing Oil Price Risk Managing Oil Price Risk RM with DerivativesRM with Derivatives
Basic Derivatives Instruments
Forward A Forward sale contract with a commodities dealer bank is the agreement to deliver oil in the future at a pre-determined price. Physically or cash settled.
Futures A Futures is a Forward contract with an exchange (NYMEX, IPE)
Swap A swap is a stream of [multiple] Forward contracts.
Options [Purchase of an Option (Put or Call) gives its owner the right but not the obligation to buy (Call) or sell (Put) oil in the future at a pre-determined price.]
03/23/2008 16
Generic Strategies with Derivatives
Remove uncertainty. Fix future oil prices. Low cost (but implied costs of margin calls). Do not permit upside gains
An insurance strategy placing a floor on future oil prices. Purchase payments (premiums) for buying puts is the cost of insurance. Permit upside gains.
Managing Oil Price Risk Managing Oil Price Risk RM with DerivativesRM with Derivatives
Forward sales
Purchase of puts
Hedging
Insurance

9
03/23/2008 17
Managing Oil Price RiskManaging Oil Price RiskRM with DerivativesRM with Derivatives
Forward
Initial exposure
Forward Oil Price
Revenues
Forward Sale
Initial exposure
Forward Oil Price
Net exposure
Revenues
Put
Floor future oil price at a costFix future oil priceHedging Insurance
Put
Cost of insurance
Net exposure
03/23/2008 18
Managing Oil Price RiskManaging Oil Price RiskRM with DerivativesRM with Derivatives
Buy Put + Sell Call
Initial exposure
Forward Oil Price
Revenues Initial exposure
Forward Oil Price
Revenues
Buy Put + Sell Put
But protection is lessenedBut upside gains are capped
PutNet exposure
Call
Forward Oil Price
Put
Net exposureSell Put

10
03/23/2008 19
Oil Prices have increased markedly since 2003
Managing Oil Price Risk Managing Oil Price Risk RM with DerivativesRM with Derivatives
WTI Oil Prices (monthly)
0
10
20
30
40
50
60
70
80
90
100
1995 1997 1999 2001 2003 2005 2007 2009
USD
/BB
L
03/23/2008 20
Oil Prices exhibit high volatility
Managing Oil Price Risk Managing Oil Price Risk RM with DerivativesRM with Derivatives
WTI Oil Prices (daily)
40
50
60
70
80
90
100
Jan-
05
Apr
-05
Jul-0
5
Oct
-05
Jan-
06
Apr
-06
Jul-0
6
Oct
-06
Jan-
07
Apr
-07
Jul-0
7
Oct
-07
US
D/B
BL
Vol = 31.62%
Vol = 38.67%
Vol = 32.38%
Vol = 26.40%
Vol = 31.24%
Vol = 29.12%
11
03/23/2008 21
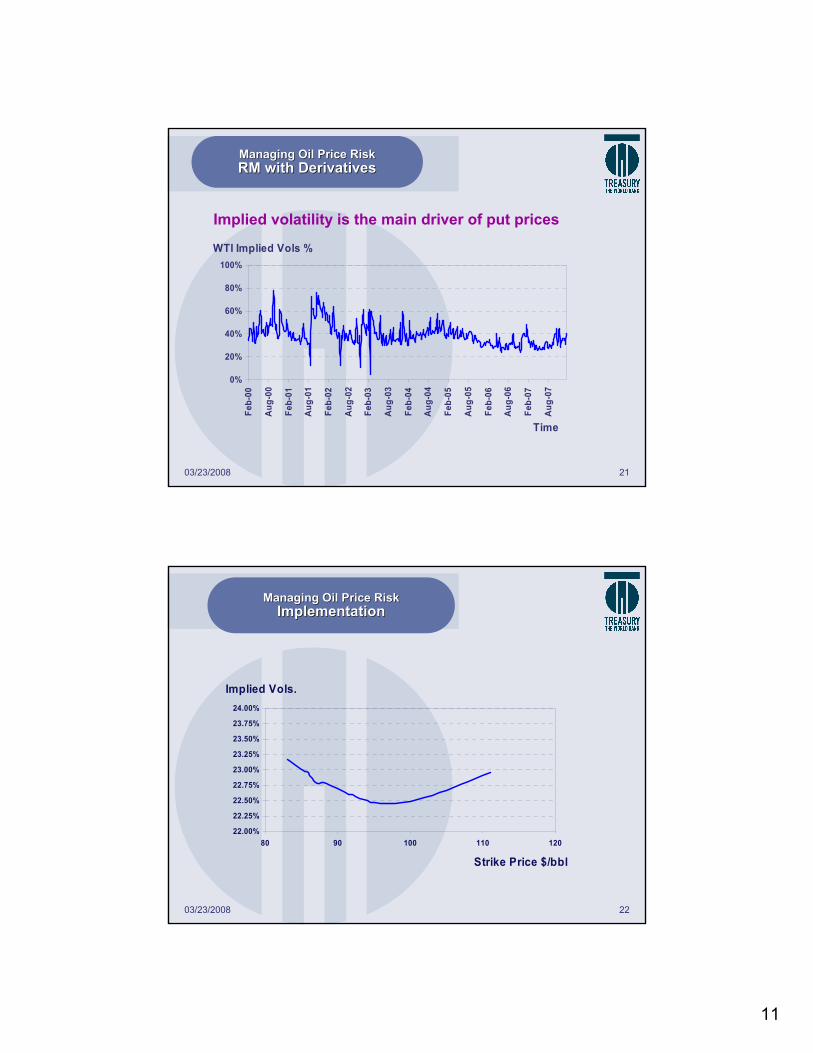
Implied volatility is the main driver of put prices
Managing Oil Price Risk Managing Oil Price Risk RM with DerivativesRM with Derivatives
WTI Implied Vols %
0%
20%
40%
60%
80%
100%
Feb-
00
Aug
-00
Feb-
01
Aug
-01
Feb-
02
Aug
-02
Feb-
03
Aug
-03
Feb-
04
Aug
-04
Feb-
05
Aug
-05
Feb-
06
Aug
-06
Feb-
07
Aug
-07
Time
03/23/2008 22
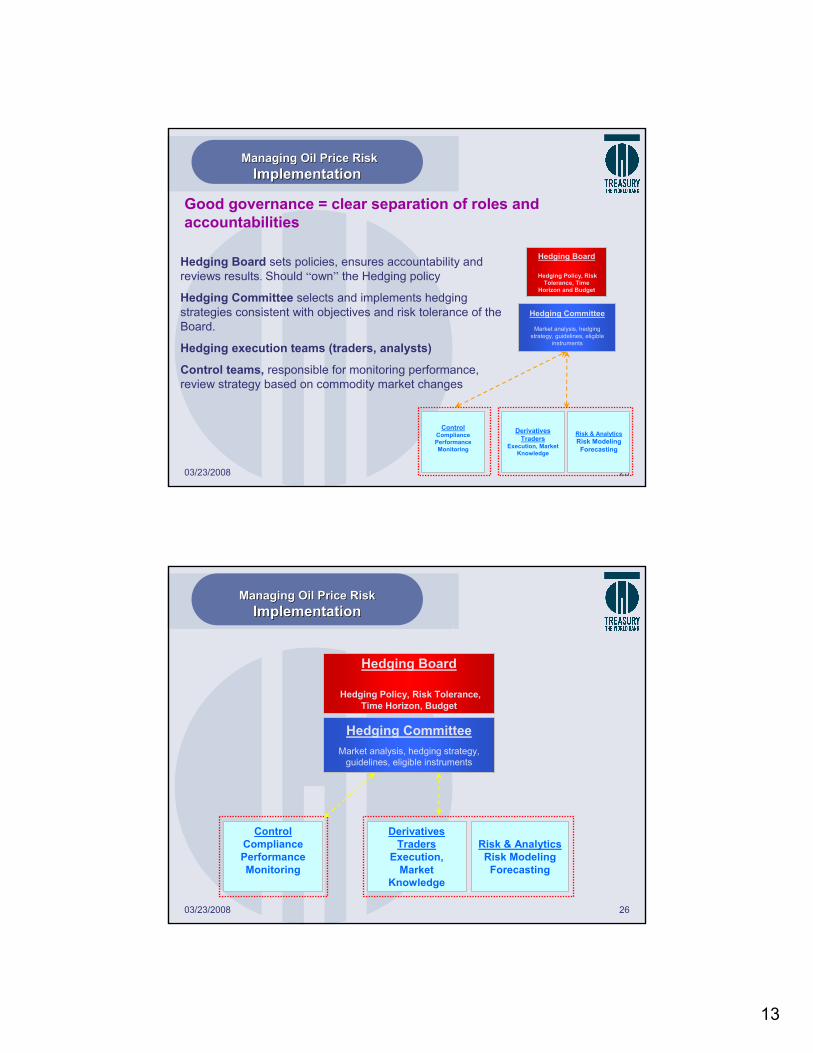
Managing Oil Price Risk Managing Oil Price Risk ImplementationImplementation
Implied Vols.
22.00%
22.25%
22.50%
22.75%
23.00%
23.25%
23.50%
23.75%
24.00%
80 90 100 110 120
Strike Price $/bbl

12
03/23/2008 23
Managing Oil Price RiskManaging Oil Price RiskImplementationImplementation
Capacity of Oil Derivatives Markets
The capacity of derivatives markets caps the maximum volume that can be hedged. The depth of markets has been increasing over the past three years.
As of October 2006, the following volumes of transactions, up to 5-year maturity, can be easily absorbed:
500 Million barrels / per year in forwards/futures 1 Billion barrels / per year in at-the-money puts
Some among the largest producers have fiscal revenues in excess of that capacity
03/23/2008 24
Managing Oil Price RiskManaging Oil Price Risk
AgendaAgenda
Definition of a Stabilization Policy
Derivatives: instruments, strategies and markets
Implementation
Lessons learned: Case Study of European Airlines
13
03/23/2008 25
Hedging Board sets policies, ensures accountability and reviews results. Should “own” the Hedging policy
Hedging Committee selects and implements hedging strategies consistent with objectives and risk tolerance of the Board.
Hedging execution teams (traders, analysts)
Control teams, responsible for monitoring performance, review strategy based on commodity market changes
Good governance = clear separation of roles and accountabilities
Managing Oil Price RiskManaging Oil Price RiskImplementationImplementation
Hedging Committee
Market analysis, hedging strategy, guidelines, eligible
instruments
Hedging Board
Hedging Policy, Risk Tolerance, Time
Horizon and Budget
Derivatives Traders
Execution, Market Knowledge
Risk & AnalyticsRisk Modeling
Forecasting
ControlCompliancePerformanceMonitoring
03/23/2008 26
Managing Oil Price RiskManaging Oil Price RiskImplementationImplementation
Hedging CommitteeMarket analysis, hedging strategy,
guidelines, eligible instruments
Hedging Board
Hedging Policy, Risk Tolerance, Time Horizon, Budget
Derivatives Traders
Execution, Market
Knowledge
Risk & AnalyticsRisk Modeling
Forecasting
ControlCompliancePerformanceMonitoring

14
03/23/2008 27
Review and monitor Hedging strategy and roll-over
Execute hedging strategy Determine forecasts and scenarios for oil prices. Select hedging strategy.
Establish guidelines for implementation
Hedging policy, time horizon, risk tolerance
Managing Oil Price RiskManaging Oil Price RiskImplementationImplementation
Operational Processes
03/23/2008 28
Managing Oil Price RiskManaging Oil Price RiskImplementationImplementation
Prob.-weighted scenarios
Hedging Strategy Selection Process
……
Hedging
Strategies
No hedge
Puts
…..
Annual Fiscal Oil Revenues net of hedging gains/losses
Present Value of oil revenues over the hedging time horizon
Select strategywith best gain profile subject to Risk Tolerance
Review scenarios

15
03/23/2008 29
A first look at possible strategies (Forward = $58.68)
Managing Oil Price RiskManaging Oil Price RiskImplementationImplementation
and:
$3.70$5.00$51.47Buy out-of-the-money put
$6.08$7.38$58.68Buy at-the-money put
-$1.30$88.02Sell call at 150% of forward
$5.00$5.00$51.47Buy out-of-the-money put
$7.38$7.38$58.68Buy at-the-money put
Total CostCostStrikeStrategy
Maturity for all options: 3 years
03/23/2008 30
Managing Oil Price RiskManaging Oil Price Risk
AgendaAgenda
Definition of a Stabilization Policy
Derivatives: instruments, strategies and markets
Implementation
Case Study: European Airlines

16
03/23/2008 31
Managing Oil Price RiskManaging Oil Price RiskCase StudyCase Study
Who hedges oil risk with derivatives?
Hedgers
Airline Companies: Southwest, Lufthansa
US independent oil producers
Some oil importers (large users in public sector)
Some oil exporters
Utilities
Non- Hedgers
Airline Companies. Some stopped hedging
Most oil exporters
Most oil importers
Oil companies (strategic decision)
Railways (can pass the oil bill on to their customers)
03/23/2008 32
Hedging of Jet fuel purchases among US airline companies
Significant economic impact of higher Jet fuel costs on US Airlines: second largest operating expense with about 1.6 million barrels consumed daily
Airlines found it difficult to raise air fares to reflect higher fuel costs. This lead many to file for bankruptcy. They now lack the cash or the creditworthiness to put on fuel hedges
Some US airlines have been hedging oil price volatility from an early stage, taking a risk management approach. They were able to plan budgets and earnings with greater accuracy
Southwest has been very successful and consistent with its hedging strategy overtime
Managing Oil Price RiskManaging Oil Price RiskLessons learnedLessons learned
Based on congressional hearings February 2006

17
03/23/2008 33
Fuel Hedging Activity of Major U.S. Airlines
0%0%0%0%Continental/Delta/Northwest
0%0%0%4% @$62 per barrelFrontier
0%0%0%13% @$67 per barrelUS Airways
0 %0%0%18% @$60 per barrelAmerican
0%0%0%16% @$68 per barrelJetBlue
0%0%16% @$59 per barrel
25% @$56 per barrelAirTran
0%7% @$49 per barrel
20% @$45 per barrel
45% @$40 per barrelAlaska
30% @$39 per barrel
35% @$37 per barrel
55% @$37 per barrel
70% @$36 per barrelSouthwest
2009200820072006
% of Total Annual Fuel Requirement Hedged and Hedge Level (Source: Air Transport Association )
Managing Oil Price RiskManaging Oil Price RiskCase StudyCase Study
03/23/2008 34
Managing Oil Price Risk Managing Oil Price Risk
Case Study: European AirlinesCase Study: European Airlines
Minimize variability in jet fuel purchase costsTwo years8 million tons of crude/jet fuel p.a. Tighter “cap” on oil price, but reducing the costs by selling out-of-money puts
Options (buying calls and selling puts)Hedging committee reporting to the Board
6 staff in Trading, Analytics, Risk Management, M/O & B/O functions, Systems Software bought & customized (~ $1 Mio)
Net price of calls = 5% Jet Fuel purchase costs
Objective:Time Horizon:Size:Risk Tolerance:
Instruments:Governance:ImplementationInfrastructure:
Budget:
Formulation of the Risk Management Policy

18
03/23/2008 35
Managing Oil Price RiskManaging Oil Price Risk
Case Study: European AirlinesCase Study: European Airlines
Generic Risk Management Strategy based on collars
Program: ~ 8 Mio tons purchase of Kerosene per year
Annual Cost: ~ $ 4 Bio
Budget: ~ 4% of purchase ~ $ 160 Mio ~ $3 / bbl
Upside Protection: ~ $ 2 / bbl above forward price
Downside OpportunityRisk: ~ - $ 10 $ / bbl
03/23/2008 36
Managing Oil Price RiskManaging Oil Price Risk
Case Study: European AirlinesCase Study: European Airlines
Basis Risk Management
The Airline Company is mainly exposed to Kerosene price risk.
However, Kerosene futures are much less liquid than Crude oil. An extra liquidity premium has to be paid. Estimated to be around $7 per ton (~ $ 56 Mio).
Kerosene is fairly well correlated with Crude although the two prices may deviate.
The Airline decided to hedge mainly on Crude oil derivatives
19
03/23/2008 37
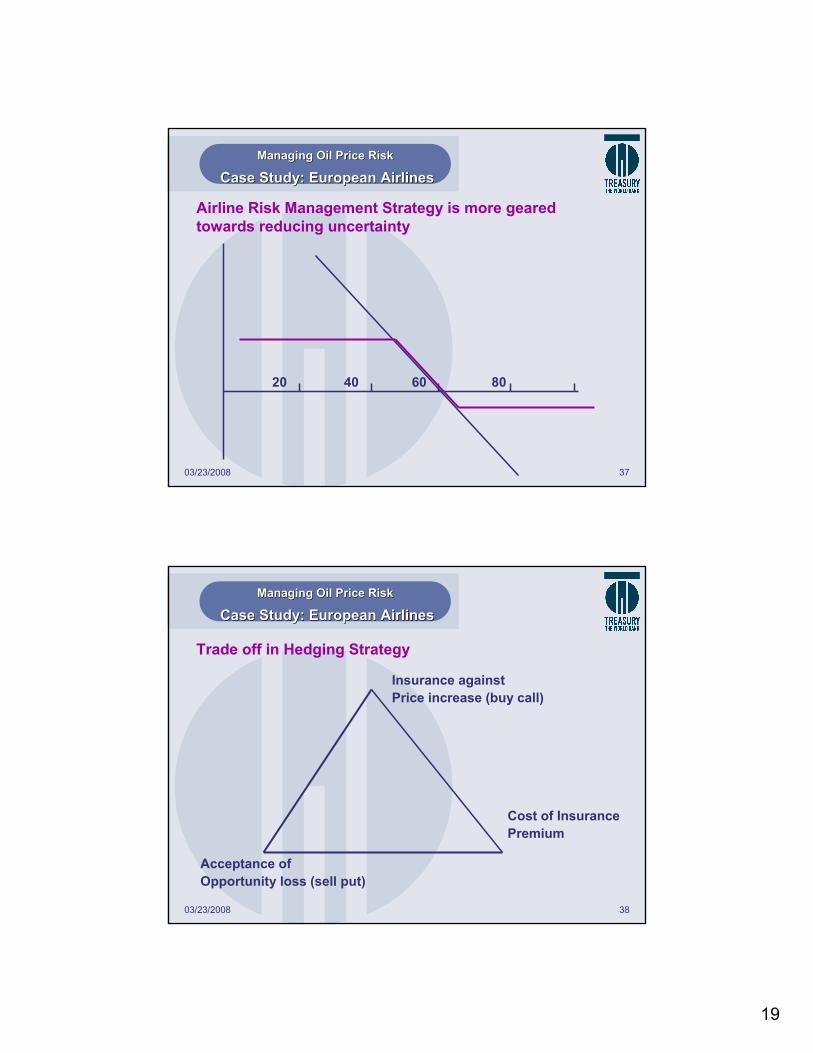
Managing Oil Price RiskManaging Oil Price Risk
Case Study: European AirlinesCase Study: European Airlines
Airline Risk Management Strategy is more geared towards reducing uncertainty
20 40 8060
03/23/2008 38
Managing Oil Price RiskManaging Oil Price Risk
Case Study: European AirlinesCase Study: European Airlines
Trade off in Hedging Strategy
Cost of InsurancePremium
Insurance againstPrice increase (buy call)
Acceptance ofOpportunity loss (sell put)

20
03/23/2008 39
Managing Oil Price RiskManaging Oil Price Risk
Case Study: European AirlinesCase Study: European Airlines
Hedging strategy is implemented over time in 18 layersTarget hedge ratio is 90%
Crude
+24m+23+22
.
.
.
.
+1 +2 +6
Kerosene
5%
10%15%
20%25%
7,5%
15,0%
22,5%
30,5%
03/23/2008 40
Managing Oil Price RiskManaging Oil Price RiskCase Study: European AirlinesCase Study: European Airlines
Implementation of Risk Management Policy
Mandatory/Automatic Trading
Computer-generated automatic trading program (works as a benchmark)Given budget and insurance parameter solves for the last value (strike of sold put)Price averaging approach
6 months 18 months (7th-24th)
90%
85% - 5%
Active Management•Can deviate from the mandatory hedging program to take advantage of market conditions •Provides flexibility to the hedging program•Within the pre-determined parameters such as stop-loss limits and tolerance range of the hedge ratio
6 months 18 months (7th-24th)
90%
85% - 5%
Deviation
+

21
03/23/2008 41
Managing Oil Price RiskManaging Oil Price RiskAnnexAnnex
Simulation model
7-year horizon. Annual data. Simulates future random oil prices. Enables to run scenarios for oil price evolutions and volatilities
The model uses market data: yield curve, oil forward rates, oil options volatilities
The present value of future oil sales net of hedging costs is computed for each 7-year oil price path
The model computes performance indicators. For each strategy, for each simulation, the mean and the 5% and 95% fractiles are computed.
03/23/2008 42
Managing Oil Price RiskManaging Oil Price RiskAnnexAnnex
22
03/23/2008 43
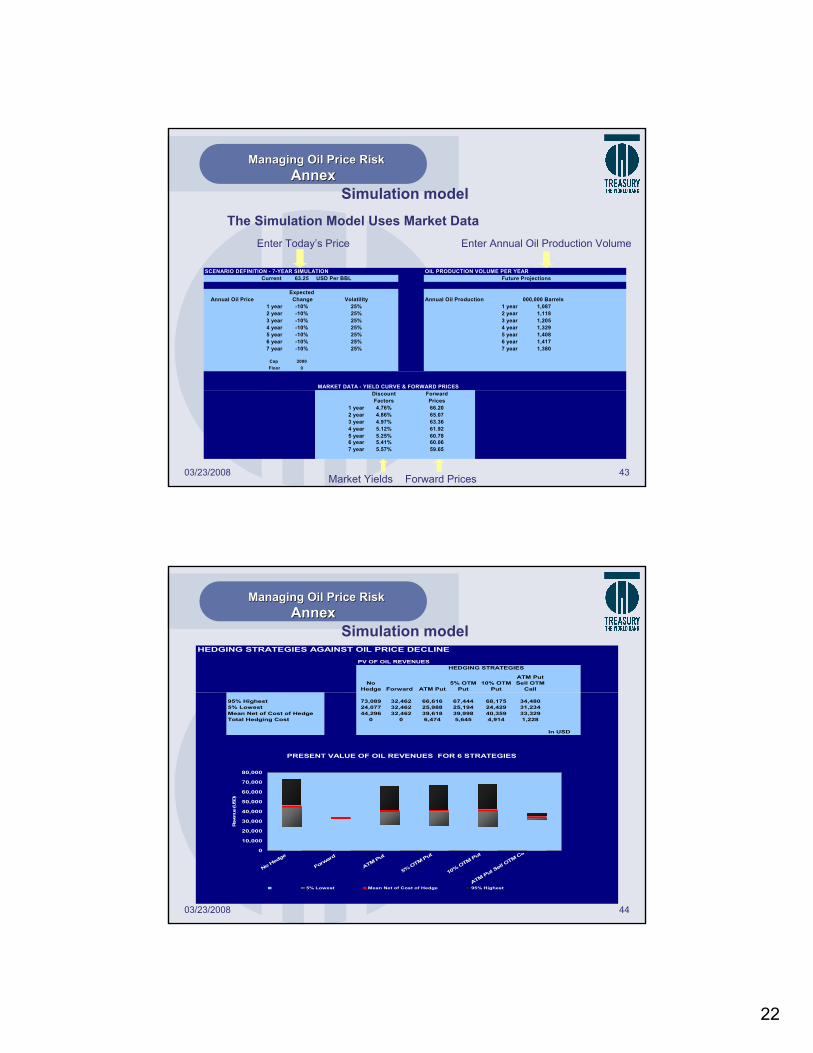
Managing Oil Price Risk Managing Oil Price Risk AnnexAnnex
Simulation model
SCENARIO DEFINITION - 7-YEAR SIMULATION OIL PRODUCTION VOLUME PER YEARCurrent 63.25 USD Per BBL Future Projections
Expected Annual Oil Price Change Volatility Annual Oil Production 000,000 Barrels
1 year -10% 25% 1 year 1,0872 year -10% 25% 2 year 1,1183 year -10% 25% 3 year 1,2054 year -10% 25% 4 year 1,3295 year -10% 25% 5 year 1,4086 year -10% 25% 6 year 1,4177 year -10% 25% 7 year 1,380
Cap 2000Floor 0
MARKET DATA - YIELD CURVE & FORWARD PRICESDiscount ForwardFactors Prices
1 year 4.76% 66.202 year 4.86% 65.073 year 4.97% 63.364 year 5.12% 61.925 year 5.25% 60.786 year 5.41% 60.067 year 5.57% 59.65
Enter Annual Oil Production Volume
Market Yields Forward Prices
Enter Today’s Price
The Simulation Model Uses Market Data
03/23/2008 44
Managing Oil Price RiskManaging Oil Price RiskAnnexAnnex
Simulation modelHEDGING STRATEGIES AGAINST OIL PRICE DECLINE
PV OF OIL REVENUES HEDGING STRATEGIES
No Hedge Forward ATM Put
5% OTM Put
10% OTM Put
ATM Put Sell OTM
Call
95% Highest 73,089 32,462 66,616 67,444 68,175 34,4805% Lowest 24,077 32,462 25,988 25,194 24,429 31,234Mean Net of Cost of Hedge 44,296 32,462 39,618 39,998 40,359 33,329Total Hedging Cost 0 0 6,474 5,645 4,914 1,228
In USD
PRESENT VALUE OF OIL REVENUES FOR 6 STRATEGIES
0
10,000
20,000
30,000
40,000
50,000
60,000
70,000
80,000
No Hedge
Forward
ATM Put
5% OTM Put
10% OTM Put
ATM Put Sell O
TM Ca
Rev
enue
(USD
)
5% Lowest Mean Net of Cost of Hedge 95% Highest

23
03/23/2008 45
Managing Oil Price RiskManaging Oil Price RiskAnnexAnnex
Simulation modelHEDGING STRATEGIES AGAINST OIL PRICE DECLINE
STRATEGY 1 : NO HEDGE AVERAGE ANNUAL OIL REVENUES in USD PV in USD
1 Year 2 Year 3 Year 4 Year 5 Year 6 Year 7 Year
95% Highest 8,713 10,441 12,178 13,862 15,718 18,063 19,406 73,0895% Lowest 4,502 4,071 3,838 3,727 3,644 3,570 3,492 24,077Mean 6,397 6,842 7,324 7,847 8,392 8,983 9,575 44,296
HEDGING COST in USD
Total 0Per BBL 0
STRATEGY 2 : FORWARD SALES AVERAGE ANNUAL OIL REVENUES in USD PV in USD
1 Year 2 Year 3 Year 4 Year 5 Year 6 Year 7 Year
95% Highest 6,129 5,937 5,746 5,591 5,491 5,427 5,415 32,4625% Lowest 6,129 5,937 5,746 5,591 5,491 5,427 5,415 32,462Mean 6,129 5,937 5,746 5,591 5,491 5,427 5,415 32,462
HEDGING COST in USD
Total 0Per BBL 0
STRATEGY 3 : ATM PUTS AVERAGE ANNUAL OIL REVENUES in USD PV in USD
1 Year 2 Year 3 Year 4 Year 5 Year 6 Year 7 Year
95% Highest 7,930 9,535 11,229 12,901 14,764 17,103 18,445 66,6165% Lowest 5,347 5,031 4,798 4,629 4,537 4,468 4,454 25,988Mean Net of Cost of Hedge 5,995 6,295 6,705 7,180 9,628 10,208 8,875 39,618
PUT STRIKES = FORWARD PRICES HEDGING COST in USD
Total 6,474Per BBL 64.74
03/23/2008 46
Managing Oil Price RiskManaging Oil Price RiskAnnexAnnex
Simulation modelPRESENT VALUE OF OIL REVENUES
HISTOGRAMS FOR 4 GENERIC STRATEGIES 7-YEAR SIMULATION
0%
5%
10%
15%
20%
25%
30%
35%
40%
45%
50%
12,15
1
20,82
1
29,49
1
38,16
1
46,83
1
55,50
1
64,17
1
72,84
1
81,51
1
90,18
0
98,85
0
107,5
20
116,1
90
Oil Revenues (USD) Net of Hedging Costs
Prob
abili
ty o
f Occ
urrin
g
Forward Expected Revenues-No Hedge No Hedge ATM Put ATM Put - OTM Call

24
03/23/2008 47
Managing Oil Price Risk Managing Oil Price Risk AnnexAnnex
Simulation modelANNUAL OIL REVENUES FOR DIFFERENT HEDGING STRATEGIES
NO HEDGE
0
5,000
10,000
15,000
20,000
25,000
30,000
35,000
1 2 3 4 5 6 7Years
USD
95% Highest 5% Lowest Mean
ATM PUTS
0
5,000
10,000
15,000
20,000
25,000
30,000
35,000
1 2 3 4 5 6 7Years
USD
95% Highest 5% Lowest Mean Net of Cost of Hedge
10% OTM PUTS
0
5,000
10,000
15,000
20,000
25,000
30,000
35,000
1 2 3 4 5 6 7Years
USD
95% Highest 5% Lowest Mean Net of Cost of Hedge
5% OTM PUTS
0
5,000
10,000
15,000
20,000
25,000
30,000
35,000
1 2 3 4 5 6 7Years
USD
95% Highest 5% Lowest Mean Net of Cost of Hedge