MANAGERS’ PERCEPTIONS OF CITIZEN PREPAREDNESS
106
ARE WE JUST GUESSING? AN EXPLORATORY STUDY OF MINNESOTA EMERGENCY MANAGERS’ PERCEPTIONS OF CITIZEN PREPAREDNESS A Thesis Submitted to the Graduate Faculty of the North Dakota State University of Agriculture and Applied Science By Breanna Colette Koval In Partial Fulfillment of the Requirements for the Degree of MASTER OF SCIENCE Major Department: Emergency Management November 2015 Fargo, North Dakota
Transcript of MANAGERS’ PERCEPTIONS OF CITIZEN PREPAREDNESS
ARE WE JUST GUESSING? AN EXPLORATORY STUDY OF MINNESOTA EMERGENCY
MANAGERS’ PERCEPTIONS OF CITIZEN PREPAREDNESS
A Thesis
Submitted to the Graduate Faculty
of the
North Dakota State University
of Agriculture and Applied Science
By
Breanna Colette Koval
In Partial Fulfillment of the Requirements
for the Degree of
MASTER OF SCIENCE
Major Department:
Emergency Management
November 2015
Fargo, North Dakota

North Dakota State University
Graduate School
Title
ARE WE JUST GUESSING? AN EXPLORATORY STUDY OF MINNESOTA
EMERGENCY MANAGERS’ PERCEPTIONS OF CITIZEN PREPAREDNESS
By
Breanna Colette Koval
The Supervisory Committee certifies that this disquisition complies with North Dakota State
University’s regulations and meets the accepted standards for the degree of
MASTER OF SCIENCE
SUPERVISORY COMMITTEE:
Jessica Jensen
Chair
George Youngs
Daniel J. Kelnow
Carol Cwiak
Mark Harvey
Approved:
11/5/2015 Daniel J. Klenow
Date Department Chair
iii
ABSTRACT
Emergency management research suggests that citizen preparedness is paramount to
household survival in disasters. Thus, having a citizenry that is well prepared is ideal for
individuals who work directly in emergency management and disaster response roles. At the
lowest governmental level, it is the local emergency manager who is tasked with the job of
promoting preparedness to their respective jurisdictions. However, to effectively promote
preparedness to citizens, it is presumed that an emergency manager would need a fairly accurate
perception of citizen preparedness. However, emergency managers rarely have data to determine
their jurisdiction’s level of preparedness. Without data to inform a perception, how does an
emergency manager determine the preparedness of his or her jurisdiction? This study explores
two possible cognitive heuristics that could play a role in how county-level emergency managers
form their perceptions of preparedness; the availability heuristic and the false consensus effect.
iv
ACKNOWLEDGEMENTS
This disquisition, which was intended to take three years and actually took six, would
never have been possible without the continued support from Dr. George Youngs. Without his
encouragement and upbeat attitude, I am not sure that I would have been able to do a project of
this magnitude and so far outside of my comfort zone. His guidance through this process was
invaluable. A “Thank You” will never express my gratitude!
I would also like to thank my husband for sticking with me on this long and crazy
graduate school adventure! He supported me through my victories and was a shoulder to cry on
when I hit a setback. Without his love and support I would have never been able to emotionally
survive this project. Thank You!
v
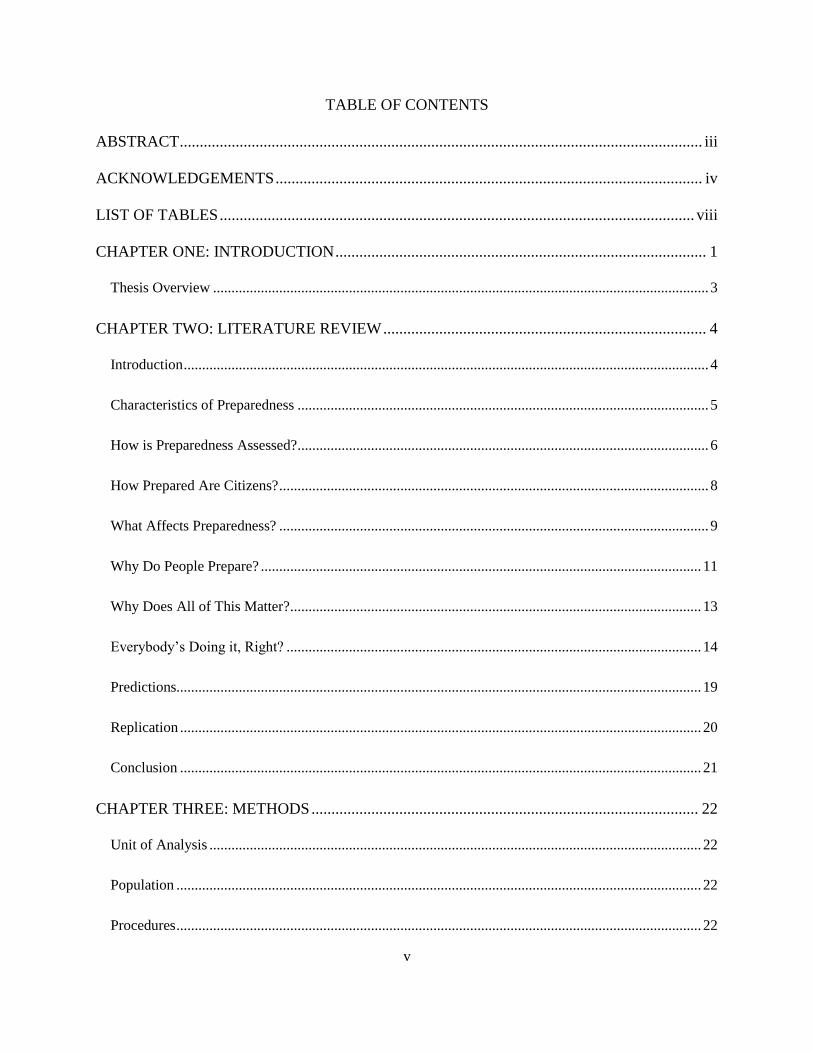
TABLE OF CONTENTS
ABSTRACT ................................................................................................................................... iii
ACKNOWLEDGEMENTS ........................................................................................................... iv
LIST OF TABLES ....................................................................................................................... viii
CHAPTER ONE: INTRODUCTION ............................................................................................. 1
Thesis Overview ....................................................................................................................................... 3
CHAPTER TWO: LITERATURE REVIEW ................................................................................. 4
Introduction ............................................................................................................................................... 4
Characteristics of Preparedness ................................................................................................................ 5
How is Preparedness Assessed? ................................................................................................................ 6
How Prepared Are Citizens? ..................................................................................................................... 8
What Affects Preparedness? ..................................................................................................................... 9
Why Do People Prepare? ........................................................................................................................ 11
Why Does All of This Matter? ................................................................................................................ 13
Everybody’s Doing it, Right? ................................................................................................................. 14
Predictions............................................................................................................................................... 19
Replication .............................................................................................................................................. 20
Conclusion .............................................................................................................................................. 21
CHAPTER THREE: METHODS ................................................................................................. 22
Unit of Analysis ...................................................................................................................................... 22
Population ............................................................................................................................................... 22
Procedures ............................................................................................................................................... 22

vi
Step One: Initial Contact ..................................................................................................................... 23
Step Two: Survey Invitation ............................................................................................................... 23
Step Three: Invitation Follow-ups ...................................................................................................... 23
Survey Design ......................................................................................................................................... 23
Dependent Variable Measures ............................................................................................................ 24
Independent Variable Measures .......................................................................................................... 27
County Emergency Manager Characteristics ...................................................................................... 28
Limitations .............................................................................................................................................. 30
CHAPTER FOUR: RESULTS ..................................................................................................... 32
Introduction ............................................................................................................................................. 32
Sample .................................................................................................................................................... 32
Hypotheses .............................................................................................................................................. 46
CHAPTER FIVE: DISCUSSION ................................................................................................. 51
Availability Heuristic .............................................................................................................................. 53
False Consensus Effect ........................................................................................................................... 54
Further Research ..................................................................................................................................... 56
REFERENCES ......................................................................................................................................... 60
APPENDIX A. IRB APPROVAL LETTER ........................................................................................ 66
APPENDIX B. INFORMATION SHEET ............................................................................................ 67
APPENDIX C. SURVEY INVITATION LETTER ............................................................................ 70
APPENDIX D. SURVEY INVITATION EMAIL .............................................................................. 72

vii
APPENDIX E. SURVEY ............................................................................................................. 74
APPENDIX F. SURVEY FOLLOW-UP EMAIL ........................................................................ 98
viii
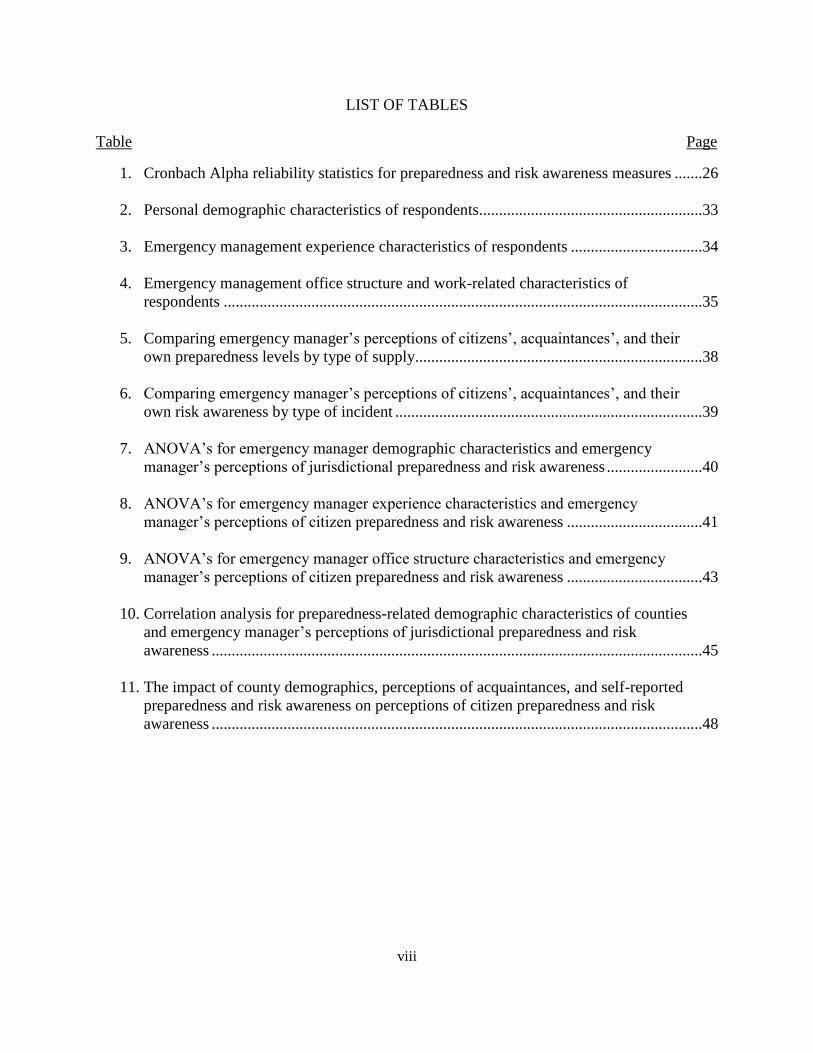
LIST OF TABLES
Table Page
1. Cronbach Alpha reliability statistics for preparedness and risk awareness measures .......26
2. Personal demographic characteristics of respondents........................................................33
3. Emergency management experience characteristics of respondents .................................34
4. Emergency management office structure and work-related characteristics of
respondents ........................................................................................................................35
5. Comparing emergency manager’s perceptions of citizens’, acquaintances’, and their
own preparedness levels by type of supply........................................................................38
6. Comparing emergency manager’s perceptions of citizens’, acquaintances’, and their
own risk awareness by type of incident .............................................................................39
7. ANOVA’s for emergency manager demographic characteristics and emergency
manager’s perceptions of jurisdictional preparedness and risk awareness ........................40
8. ANOVA’s for emergency manager experience characteristics and emergency
manager’s perceptions of citizen preparedness and risk awareness ..................................41
9. ANOVA’s for emergency manager office structure characteristics and emergency
manager’s perceptions of citizen preparedness and risk awareness ..................................43
10. Correlation analysis for preparedness-related demographic characteristics of counties
and emergency manager’s perceptions of jurisdictional preparedness and risk
awareness ...........................................................................................................................45
11. The impact of county demographics, perceptions of acquaintances, and self-reported
preparedness and risk awareness on perceptions of citizen preparedness and risk
awareness ...........................................................................................................................48
1
CHAPTER ONE: INTRODUCTION
The empirical literature in emergency management research consistently suggests that
household preparedness is vital to household survival in disasters (Federal Emergency
Management Agency, 2004; Paton, McClure, & Burgelt, 2006; Tierney, Lindell & Perry, 2001).
Thus, promoting preparedness is a key dimension of the local emergency manager’s job.
Presumably, an effective effort to promote preparedness requires an accurate perception of
citizen preparedness. However, emergency managers rarely have data (e.g. survey results) to
determine their jurisdiction’s level of preparedness. Little or no research has been conducted to
determine how emergency managers form their perceptions of citizen preparedness levels in the
face of this uncertainty. Unfortunately, social psychological research on perception has identified
a wide variety of factors that can bias perceptions including the use of a variety of cognitive
heuristics to fill the gaps of missing information. This study will initiate research on emergency
managers’ perceptions by examining the role of two closely related cognitive biases in social
psychology; the availability heuristic and the false consensus effect. Hypotheses are stated and
tested concerning the role of these heuristics in emergency managers’ perceptions of their
citizens’ level of preparedness. Support for these hypotheses would suggest the need for
emergency managers to be alert to possible bias in their perceptions and highlight the need for
the research community to further explore the role of these heuristics and others in emergency
managers’ perceptions. Finally, if perceptions are subject to systematic biases, further research
will need to explore the extent to which such biases ultimately affect the accuracy of emergency
managers’ perceptions. Are perceptions of preparedness just guesses that are only accurate by
chance?
2
This research begins with a focus on how two classic perception biases, the availability
heuristic and false consensus effect, may impact how emergency managers form their
perceptions. The goal of this research is to explore which factors impact emergency managers’
perceptions of citizen preparedness beyond the reality of actual citizen preparedness levels. In
other words, how much of an impact, if any, do such widely spread perceptual biases as the
availability heuristic and the false consensus effect have on the perception of the overall level of
citizen preparedness within an emergency manager’s jurisdiction?
In addition to examining the role of known cognitive heuristics such as the availability
heuristic and false consensus effect in emergency managers’ perceptions, this study explores two
additional sets of perceptions pertinent to effective preparedness promotion efforts. First,
considerable research (Brilly & Pollic, 2005; Grothmann & Reusswig, 2006; Kirschenbaum,
2005; Lindell & Hwang, 2008; Lindell & Whitney, 2000; Miceli, Sotgiu, & Settanni,
2007;Mishar & Saur, 2007; Paton, McClure, & Burgelt, 2006; Siegrist & Gutscher, 2006;)
suggests that preparedness is a product, at least in part, of risk perceptions. Thus, if an
emergency manager is going to understand variability in citizen preparedness then he or she
should have an accurate sense of citizen risk perception. Unfortunately, the same perceptual
biases noted earlier as confounding factors in emergency managers’ perception of citizen
preparedness may also impact perceptions of citizen risk perceptions.
Second, a similar logic suggests that an emergency manager should also be cognizant of
what socio-demographic factors are likely to impact citizens’ preparedness levels. Thus,
included in this study’s survey of emergency managers’ perceptions will be a series of questions
asking them to identify socio-demographic factors as relevant or not to citizen preparedness.
The test of accuracy will be a comparison of emergency managers’ answers to research based

3
answers. While this “test” is not a direct assessment of the accuracy of emergency managers’
perceptions of their jurisdictions preparedness level, it does offer a preliminary assessment of
emergency managers’ awareness of factors affecting citizen preparedness. Thus, this study
examines the cognitive heuristics that may impact both emergency managers’ perceptions of
citizen preparedness, citizen risk awareness perceptions and the emergency managers’
knowledge of the socio-demographic factors that affect citizens’ preparedness levels.
Thesis Overview
Chapter 2 reviews the empirical literature on individual and household preparedness and
the most salient indicators of individual preparedness. This chapter will also discuss prior
research on emergency managers’ perceptions of preparedness and will justify the importance of
the present research. There will also be an overview of two classic heuristics that may be
affecting how emergency managers form their perceptions of citizen preparedness. The
heuristics are the availability heuristic and the false consensus effect. These heuristics lead to
this study’s hypotheses. Chapter 3 explains the research design and the data collection process,
and the anticipated results of the study. Chapter 4 explains the results of the research study.
Finally, Chapter 5 discusses the implications of the results and future research needs.

4
CHAPTER TWO: LITERATURE REVIEW
Introduction
In the field of emergency management, there is a strong focus on individual and family
preparedness. Preparedness is viewed as the individual citizens’ first line of defense against the
effects of a disaster. Currently, the federal government relies largely on local emergency
managers to assist in the process of encouraging individuals to become prepared (Presidential
Policy Directive - 8). Therefore it is critical to assess how emergency managers’ are constructing
their perceptions of the overall preparedness levels of their jurisdictions.
Accurately assessing the overall preparedness level of sizable jurisdictions such as large
cities or counties is a challenging assignment. A variety of factors affect actual preparedness.
As jurisdictions differ in their characteristics, their overall preparedness is likely to differ as well.
In addition, research on perceptions in social psychology clearly demonstrates that perceptions
can be affected by cognitive biases that threaten perceptual accuracy. Thus, while the
importance of understanding how emergency managers assess preparedness is clear, little
attention has been given to this question. This study explores the relevance to emergency
manager’s assessments of two cognitive heuristics, the availability heuristic and the false
consensus effect. Both have received attention in social psychology and professional fields such
as medicine (Croskerry, 2002; Croskerry, 2003; Croskerry, 2005), criminal justice (Green &
Ellis, 2007), and risk communications (Keller, Siegrist & Gutscher, 2006; Finuace, Alhakami,
Slovic & Johnson, 2000; Johnson & Tversky, 1983). While the focus of the this study will be on
perceptions of preparedness, it will also pursue the role of these heuristics in a second perceptual
challenge focusing on emergency managers’ jurisdictions citizen risk awareness levels. This
5
second effort serves as an additional test of the relevance of these heuristics to emergency
managers’ perceptions of their citizens.
The following literature review will first attempt to explain what researchers assert are
the characteristics of preparedness, the basic activities that are suggested for preparing for
disasters, the factors that are most likely to prompt the adoption of preparedness activities, and
the challenges emergency managers face in assessing preparedness. Second, prior research on
emergency managers’ perceptions of citizen preparedness will be discussed. Despite the
importance of perceptual accuracy, little has been done to understand how emergency managers’
assess their jurisdictions’ level of individual preparedness given the absence in most cases, of
concrete data on preparedness. Challenges associated with determining actual accuracy will be
discussed. Third, the potential effects of the availability heuristic and false consensus effect on
perceptions of citizen preparedness will be discussed. These three sections will set the stage for
predictions about emergency manager’s possible perceptions and the expected role of cognitive
biases in impacting these perceptions.
Characteristics of Preparedness
Citizen preparedness is a seemingly simple concept that actually can be difficult to define
as a clear and a consistent definition of preparedness is absent from the literature. A general
definition of preparedness is performing activities in advance of a hazard event in an attempt to
minimize its effects and decrease the amount of time for recovery (Federal Emergency
Management Agency, 2004). According to Sutton and Tierney (2006) and echoed by numerous
governmental, international, and non-profit organizations (American Red Cross, World Health
Organization, Federal Emergency Management Agency), individual and household preparedness
activities include: “developing a planning process to ensure readiness, formulating disaster plans,

6
stockpiling resources necessary for effective response, and developing skills and competencies to
ensure effective performance of disaster-related tasks” (p. 3). Sutton and Tierney’s definition of
preparedness has been condensed by the Federal Emergency Management Agency (FEMA,
2014). FEMA promotes preparedness as a three step process in its Ready campaign: “get a kit,
make a plan, and be informed” (Ready.gov, 2014). FEMA’s three step process can be viewed as
a simplified, more user friendly version of the same principles stated by Sutton and Tierney.
FEMA explains in its publication “Are You Ready: An In-depth Guide to Citizen
Preparedness” that for an individual to become better prepared, he or she should complete a short
risk assessment to learn about risks, review insurance policies, develop a plan of action, and
assemble an emergency kit. The publication also recommends that a basic emergency kit contain
the following: a three-day supply of food and water, a battery-powered radio, a flashlight, first
aid kit, sanitation items, matches, a whistle, extra clothing, kitchen utensils and supplies,
photocopies of important documents, cash, and special needs items (p. 35). The
recommendations made by FEMA are common throughout the preparedness literature and for
the purposes of this research will be used as a baseline for defining the activities associated with
preparedness.
How is Preparedness Assessed?
Measuring citizen preparedness is challenging. This is predominately because, the
literature is lacking a concrete definition of preparedness, and thus there are varying methods for
assessing the multiple definitions. One method used by researchers to assess preparedness, which
is the focus of this study, is by using disaster preparedness checklists. The checklists reflect
Sutton and Tierney’s (2006) and other researchers (Andrews, 2001; Kapucu, 2008; Perman,
Shoaf, Kourouyan, & Kelly, 2011; Tierney, Lindell, & Perry, 2001) argument that one of the

7
steps to becoming prepared is to stockpile necessary resources to use during a disaster. FEMA
has a checklist that has been widely publicized through their “Are You Ready” campaign. The
same list was utilized for their multiple surveys (2005, 2007, 2009, and 2012) of nation-wide
citizen preparedness.
Although there are inherent issues relative to the checklist approach such as bias in self-
reported data and differing interpretations of items contained in the checklist, the method seems
to be the most widely used tool for assessing preparedness (in terms of supplies), and therefore
was utilized for this study. Several considerations are behind this decision. First, this method
fits into the extensive literature already using this approach. Second, the method was utilized by
FEMA four times in nation-wide random sample surveys and its use serves as a reference for this
study. Third, the knowledge “test” in this study reflects the findings in the FEMA surveys
concerning socio-demographic factors that consistently affect preparedness (as measured by the
checklist approach).
An additional method to assessing preparedness is by addressing citizen risk awareness.
For example, Paton (2003) argues that preparedness can only be achieved when individual risk
awareness increases to a level that the individual feels a need to prepare. However, a method for
assessing when an individual reaches the preparedness “tipping-point” was not mentioned. Still,
this argument suggests that emergency managers’ perceptions of their citizens’ risk awareness
are relevant to preparedness and this study will measure such perceptions.
Finally, the use of the same checklist in this study as used in the FEMA surveys provides
a reference point for understanding how the perceptions of emergency managers in this study
compare to self-reported citizens preparedness nationwide. This study is limited to studying
emergency managers in one state, Minnesota. To the author’s knowledge, little data exists on

8
self-reported citizen preparedness in Minnesota. The North Dakota State Data Center (2007)
conducted the only study known to the author with recent preparedness data on Minnesota. The
North Dakota State Data Center research explored healthcare behaviors and emergency
preparedness actions of individuals in an eight county region. Both the FEMA and the North
Dakota State Data Center surveys contained questions to collect data on how well individuals
feel they are prepared, the perceived level of risk their community faces specific to the
occurrence of an emergency or disaster, and the barriers that prevent an individual from
preparing. The results of the two studies are similar. Thus these results provide a reference point
for interpreting Minnesota emergency managers’ perceptions of citizen preparedness.
How Prepared Are Citizens?
The following section will highlight the results of both the Citizen Corps study of citizen
preparedness (2009) and the North Dakota State Data Center (2007) study of citizen
preparedness in west central Minnesota. Both of these surveys address self-reported citizen
preparedness.
First, the study conducted by the Citizen Corps in 2009 indicates that 35 percent of
individuals perceive themselves as prepared and have been for at least the past six months.
Sixteen percent of individuals have recently begun preparing, and nine percent have not begun
preparing, but intend to do so within the next month (pg. 33). Identical surveys were also
conducted in 2005, 2007 and 2012 (the latter only becoming available as this study was in
progress). The percentage data across all four surveys were very similar. Thus, the nationwide
data appears quite stable.
Second, research by the North Dakota State Data Center (2007) indicate on a 5-point
scale (1=”not at all prepared” to 5=”very prepared”) that 32 percent of individuals rated
9
themselves as “more prepared than not prepared” (3); 26 percent of individuals rated themselves
as “prepared” (4); and 14 percent of individuals feel they are “very prepared” (5).
There are major similarities between the overall citizen preparedness level collected by
FEMA (2009) and the North Dakota State Data Center (2007). According to FEMA (2009), 35
percent of individuals perceive themselves to be prepared based on self-assessed data (pg. 33)
and according to the North Dakota State Data Center (2007) roughly 40 percent self-assessed as
being prepared (combining those rating “prepared” and “very prepared”). Thus, the results
reported in the North Dakota State Data Center (2007) suggest that the FEMA (2009) data results
are likely to be similar to actual self-assessed preparedness levels in Minnesota should a
checklist survey be done specifically in that state. Thus, the FEMA (2009) data will be used as a
best estimate of Minnesota citizens’ preparedness statewide. The combination of these two
studies has created a rough but reasonable estimate of citizen preparedness for Minnesota. This
can be utilized as a comparison for the purposes of this study when Minnesota’s emergency
managers are asked for their perceptions of citizen preparedness.
What Affects Preparedness?
As mentioned, defining the exact activities that constitute preparedness is somewhat
difficult, and determining the factors that most influence preparedness is equally so. According
to Paton, McClure, and Burgelt (2006), the act of preparing is the end result of a cognitive
process that takes into account many different variables. Paton et. al. (2006) explain that there
are a number of cognitive stages before an individual will adopt a preparedness measure. The
study indicates the first stage is a motivating factor (i.e. an increase in perceived risk). The
second stage is forming an intention to prepare, based on critical awareness, preparedness
outcome expectancy, and the salience of the hazard. The third and final stage is “converting
10
intention to preparedness” (p. 120). Movement from one stage to the next is not automatic, and
there are numerous opportunities for failure within the cognitive preparedness process.
Paton et. al.’s findings suggest that in order to understand citizen preparedness it is
important to first understand risk perception. However, overall research on the role risk
perception plays in preparedness is inconclusive. Grothmann and Reusswig (2006), Lindell and
Whitney (2000), Siegrist and Gutscher (2006), and Brilly and Pollic (2005) assert that an
increased level of risk perception does not correlate with an increased level of preparedness.
Furthermore, Miceli et. al. (2007), Mishar and Saur (2007), and Kirschenbaum (2005) conclude
that risk perceptions have an impact but only have a partial impact on prompting risk reduction
activities and suggest that other variables may be involved in the decision making process.
However, Lindell and Hwang (2008) concluded that perceived personal risk relates positively
with risk reduction efforts (e.g., preparedness). These findings are the only ones that are entirely
congruent with Paton et. al.. (2006).
Thus, if risk perception is not a clear predictor of preparedness, what factors do predict
preparedness? These indicators include both ascribed and achieved attributes of the potential
preparer. According to the FEMA National Survey, “Personal Preparedness in America” (2009),
the attributes of age, education, employment and household income are all predictors of potential
preparedness. The survey results state that individuals between the ages of 18 and 54 are more
likely to be prepared and to rely less on emergency responders during and after an incident for
assistance (p. 20). Individuals who have less than a high school education are less likely to
prepare and cite their lack of knowledge of needing to prepare as a factor (p. 20). Retired
individuals were cited as less likely to prepare versus non-retired individuals (p. 20). Lastly,
households with an income of $25,000 or more were more likely to have food, water, and

11
supplies set aside (p. 8). Because the FEMA study used a national sample obtained through
random-digit dialing (n = 4,461), the predictors of preparedness can be generalized to the entire
nation which presumably includes the state of relevance to this study, Minnesota.
Why Do People Prepare?
As previously discussed, risk perceptions also can play a significant role in initiating the
preparedness process. While examining preparedness levels, both FEMA (2009) and the North
Dakota State Data Center (2007) addressed citizen risk perceptions by asking citizens about the
likelihood of a disaster occurring in their community. FEMA (2009) found that citizens perceive
the likelihood of different types of disasters occurring in their community as follows: natural
disaster (37%), chemical spills/hazardous materials accident (22%), disease outbreak (20%), and
act of terrorism (19%) (p. 25). Similarly, the North Dakota State Data Center (2007) found that
citizen perceptions for disaster likelihood are as follows: natural disasters (23%), chemical
spills/hazardous materials accident (12%), disease outbreak (23%), and act of terrorism (31%)
(p. 36). Both the data found by FEMA and the Minnesota specific data on perceptions of risk
were similar with the largest difference in perceived risk for natural disaster (only a 14%
different, 37% vs 23%). Overall, these studies suggest that the United States and Minnesota
citizens see some likelihood of any given event occurring within their community. This level of
risk perception is modest but it should be substantial enough to trigger a meaningful level of
preparedness across the jurisdiction.
FEMA (2009) also found that confidence in their knowledge and abilities to actively
prepare is vital. Of respondents, 61 percent viewed themselves as competent enough to
adequately prepare and 14 percent perceived themselves as not at all confident in their own

12
abilities (p. 31). FEMA found that increased confidence was related to higher education,
increased income levels, and past volunteerism in disaster response.
FEMA (2009) and the North Dakota State Data Center (2007) also sought to determine
the most prevalent barriers to preparedness. Results reported by FEMA (2009) indicated that 29
percent of respondents possessed the belief that emergency responders would be available to
assist during a disaster (p. 19). Other barriers for preparedness include lack of knowledge (24%),
and lack of time (26%) (p. 19). Additionally, it was noted that citizens aged 55 and older are
significantly more likely to rely on emergency responders than were younger individuals (p. 20).
Similarly, the North Dakota State Data Center (2007) reported significant preparedness barriers
as lack of knowledge (20.8%), lack of time (29.2%) and lack of importance (28.1%) (p.41).
Nationally and locally, roughly a quarter of citizens perceived obstacles to preparedness.
Thus, according to FEMA (2009), a barrier to individual preparedness is the way that the
public perceives both the utility and effectiveness of their own actions and their confidence in
their own competency to know how to prepare. Logically, if an individual does not see any
utility in preparing for emergencies/disasters the person is not likely to complete any
preparations. FEMA (2009) noted that 82 percent of respondents saw utility in completing
preparedness actions for natural disasters (p. 28). However, less utility was reported relative to
preparing for terrorism, hazardous materials accidents, and disease outbreaks (p. 28). Thus, it is
clear that the majority of the respondents viewed preparedness as a positive action, but many
were still skeptical of its effectiveness for individual threats.

13
Why Does All of This Matter?
A baseline understanding of the mental process of preparing, the factors that affect
preparedness and the barriers to citizen preparedness are information that an emergency manager
needs in order to assess the preparedness level of the citizens in their jurisdiction. Unfortunately,
such information is difficult to learn for a jurisdiction the size of a county. Nevertheless,
promoting preparedness activities is a goal that the state and federal government set forth for
jurisdictions (Presidential Policy Directive 8). Thus, emergency managers should have an
awareness of the level of individual and household preparedness in their jurisdictions. If this
awareness or perception is biased, an emergency manager may not be addressing the areas of
preparedness that are most needed or reaching the groups that are most in need of attention.
Research on this subject is vital to determine how emergency managers perceive preparedness
and what factors affect emergency managers’ perceptions. However, there is little research
specific to emergency managers on how they form their perceptions. The first goal of this study
is to address this in the research literature.
The nature of the challenge for emergency managers is decision making in the face of
great uncertainty. Recent research in social psychology suggests that decision making in the face
of uncertainty is often a product of a wide variety of cognitive heuristics. In the absence of
concrete information, research in social psychology suggests that we fill our information gaps
using cognitive shortcuts. Furthermore, the greater the uncertainty, the greater the effects of
cognitive biases are likely to be (Ross, Green, & House, 1977 and Tversky & Kahneman, 1973).
The implication is clear. Emergency managers may unintentionally base their estimates of
citizen preparedness in their jurisdiction using various cognitive shortcuts. Thus, this study turns
to a considerable body of social psychological research on perception to address this question.

14
As many as 30 cognitive heuristics have been identified but the shortcut that has received
more attention than most is the availability heuristic. The impact of this heuristic has been
explored in medicine (Croskerry, 2002; Croskerry, 2003; Croskerry, 2005; Groopman, 2007; and
Redelmeier, 2005), criminal justice (Greene & Ellis, 2007), and risk awareness (Pidot, 2013;
Richard-Eiser, Burton, Johnston, McClure, Paton, van der Pligt & White, 2012) and in citizen
perceptions of risk in the emergency management literature. I argue that emergency managers,
themselves, are likely to use the availability shortcut along with a second shortcut called the false
consensus effect. For example, emergency managers may project their sense of their own
behavior and/or that of immediately available associates on to the rest of society as a basis for
estimating what is happening in the larger population. Specifically, I argue that emergency
managers base their assessment on their own preparedness actions (the false consensus effect)
and/or the actions of those around them including family, friends, and acquaintances (the
availability heuristic). The next section introduces both heuristics and will explore the
implications that these heuristics may have for emergency managers’ perceptions.
Everybody’s Doing it, Right?
A frequent argument made by children with their parents is that they, the children, should
be allowed to engage in a behavior because “everybody else is doing it”. A typical response
from parents is to correct this perception with illustrations that everybody is not doing it (or at
least should not be). Literature on social perception from social psychology suggests that we still
misperceive what “everybody” is doing as adults based on what we perceive our associates,
friends, and family to be doing.
Two perceptual processes encourage the projection of perceptions of our immediate
social reality onto a larger stage, the “everybody stage.” These biases are the false consensus

15
effect and the availability heuristic. The false consensus effect suggests that individuals perceive
the choices and beliefs of others to be similar to their own. Ross, Green, and House (1977)
describe the bias as people seeing that “their own behavioral choices and judgments are
relatively common and appropriate to existing circumstances while viewing alternative responses
as uncommon, deviant, or inappropriate” (p. 280). In the context of this study, this would
indicate that the more prepared an individual is, the more prepared he or she is likely to think
those around them to be (Alicke & Largo, 1995; Dawes, 1989; Gilovich, 1900; Krueger &
Clement, 1994). In essence, they would be thinking “I do it, so everyone must be doing it too,
right?” To explore this effect in this study, emergency manager’s completed a checklist of their
own personal preparedness efforts and the results were compared to their estimates of citizen
preparedness using the same checklist.
The availability heuristic involves a similar shortcut process. According to Tversky and
Kahneman (1973) “a person is said to employ the availability heuristic whenever he estimates
frequency or probability by the ease with which instances or associations could be brought to
mind” (pg. 208). Relative to this study, the availability heuristic suggests that a person is likely
to assume that the behavior of one’s friends and family (i.e. information that is most readily
available) provides a reasonable basis for judgments about what everyone else is doing. The
difference to note between the false consensus effect and the availability heuristic is that the false
consensus effect is based on an internal judgment of one’s own actions being projected onto
others and the availability heuristic is based on ease of recall of the activity of others (Folkes,
1988; Macleod & Campbell, 1992; Rothman, 1997; Schwarz, Bless, Strack, Klumpp, Rittenauer-
Schatka, & Simmons, 1991; Schwarz & Vaughn, 2002).
16
Considerable research already exists in emergency management that has documented the
use of the availability heuristic in citizens’ perceptions of risk. Research suggests that risk is
largely interpreted through the use of cognitive heuristics and mental short-cuts to deduce the
probability of the event personally affecting them (Berger, Kousky, & Zeckhauser, 2008;
McClure, Doyle, & Velluppillai, 2014; Uscher-Pines, Chandra, Acosta, & Kellermann, 2012).
This study shifts the focus from citizens to emergency managers and expands the study of
heuristics in emergency management to include the false consensus effect and a focus of
perceived preparedness.
The availability heuristic has also been explored in numerous other professions.
Specifically, Croskerry (2002) found that in the medical field, heuristics “provide short cuts in
problem solving and clinical decision making, which for the majority of cases work well. When
they succeed, we describe them as economical, resourceful, and effective, and when they fail, we
refer to them as cognitive biases” (pg. 1201). Relative to the field of criminal justice, Green &
Ellis (2007), specific to members of a jury; “if the juror had been exposed to some kind of
pretrial information about the event in question, it may be highly accessible in memory and thus,
seem particularly memorable. Hence, the ease with which this event (or precise details about the
event that may be important in accessing guilt) can be recalled from memory may be completely
unrelated to its likelihood” (pg. 186). Specific to risk communications, it was found that the more
information an individual received about a hazard, the more risk is perceived for a given hazard
(Keller, Siegrist & Gutscher, 2006). Additionally, when under a time constraint there was a
greater reliance on cognitive heuristics (Finuace, Alhakami, Slovic, & Johnson, 2000). Finally,
when emotional events were added to the scenario, the estimated frequency of a given event
increases (Johnson & Tversky, 1983). Thus, there is considerable research in social psychology
17
supporting the existence of this shortcut; it has been seen as relevant to the decision making of
professionals in a variety of disciplines; and its role in citizen decision making with respect to
risk has been examined. What is missing is an empirical test of the role of this heuristic for
emergency managers facing uncertainty during the decision making process. This study
examines the impact of heuristics (availability and false consensus effect) on the emergency
managers’ perceptions of the citizens in their jurisdiction. Documenting the use of cognitive
shortcuts is important for the field. Unfortunately, while shortcuts may lead to the correct
perception, they may also misguide perceivers.
To complicate the issue of misguided perceptions of an emergency manager relative to
the preparedness level of their jurisdiction, there is research that suggests that citizens
overestimate their own preparedness and are in fact underprepared. Research suggests that
although emergency managers can promote preparedness activities in their jurisdiction, it really
does not affect whether or not the individual becomes more prepared (Donahue, Eckel, &
Wilson, 2014). If this is the case, the issue of emergency managers being able to reasonably
estimate the preparedness of their jurisdiction becomes increasingly complicated. However,
research relative to both individuals’ and professionals’ perceptions of risk awareness do align,
Siegrist, M. & Gutscher, H., (2006), state that “respondents’ risk perceptions were correlated
with experts’ risk assessments” and that the findings of their study suggest the presence of the
availability heuristic among citizens (pg. 971). Combined, these findings support Paton et. al
(2006), that the act of becoming prepared is a multi-step process that begins with risk awareness,
however there are many chances for failure throughout the process. This leads to one question
that this study may be able to answer and that is are perceptions of risk awareness formed
differently than perceptions of preparedness?

18
To explore the availability heuristic emergency manager’s were asked about the
preparedness of their acquaintances (e.g., friends and family members), and these data were
correlated with emergency managers’ perceptions of their jurisdiction to assess the similarity of
these two perceptions. To explore the false consensus effect, emergency managers were asked
about their own level of preparedness and these data were correlated with emergency managers’
perceptions of their jurisdictions. Both “correlations” were done while controlling on a number
of other factors to be discussed later. Combined, these perceptual processes suggest that our
perceptions of “everybody” are often subconsciously affected by our own actions and by those
around us. In other words, these processes, if apparent, suggest that emergency managers’
perceptions of their citizens reflect data from sources other than citizens themselves (i.e.,
perceptions of friends and family and/or perceptions of self). Emergency managers’ perceptions
of “everyone” could easily be inaccurate. If those around us or the emergency managers
themselves are really a perfect reflection of the “everybody,” this subconscious process will not
lead us astray. But, the process is not based on a systematic collection of data on what everyone
really is doing, so in those instances when one’s immediate circle of associates, friends, and
family does not reflect everyone, then our perceptions of everyone will be inaccurate. For those
making policy, implementing policy, and/or allocating resources based on assumptions about
what everyone is doing, the gap between one’s own behavior and/or one’s immediate circle
versus everyone else can lead to serious errors.
Thus, to account for the presence of either the availability heuristic or the false consensus
effect, it was necessary to first determine a self-assessed level of preparedness for the emergency
manager and then the emergency manager’s perception of the preparedness level of those with
whom they interact (i.e. friends, family and relatives). These two sets of assessments were then
19
examined relative to the emergency manager’s perceptions of county-wide preparedness. The
similarity of the first two assessments with emergency managers’ jurisdictional assessment
addressed the presence of these cognitive biases. The predicted outcomes of this study are stated
below.
Predictions
False Consensus Hypothesis: Emergency managers’ self-reports of their own risk
awareness level and preparedness level will correlate positively with emergency managers’
perceptions of their county citizen risk awareness level and preparedness level, respectively.
Availability Hypothesis: Emergency managers’ perceptions of their friends and family
risk awareness level and preparedness level well correlate positively with emergency managers’
perceptions of their county citizen risk awareness and preparedness level, respectively.
In addition to the expected role of cognitive biases, this study explored the extent to
which emergency manager’s perceptions are affected by individual demographics (i.e.
emergency management experience, office structure characteristics, and office-related activities).
For example, emergency management experience might affect perceptions of citizen
preparedness if more experience consistently leads to less optimistic expectations for citizen
preparedness. Such a pattern may exist with increased experience whether the more negative
perceptions are accurate or not. Experience may decrease a sense of uncertainty about their
jurisdictions and reduce emergency manager reliance on cognitive heuristics when making a
judgement. Each demographic category will be explained in detail in the next chapter.
Finally, this study includes a proxy reality test. While this study does not include county-
level surveys of citizen preparedness to directly check the accuracy of emergency managers’
perceptions, prior research (FEMA, 2009) has repeatedly shown correlations between a variety

20
of population demographics (e.g., age, education, and income) and preparedness thus allowing
this study to determine the impact of these census characteristics on emergency managers’
perceptions. To account for this, the fore mentioned demographic factors were obtained from the
US Census Bureau for each responding county and controlled for during the analyses. The
demographic factors that were controlled represent the percent of the population in each of the
demographic categories that were said to be the least prepared according to the earlier discussed
FEMA surveys. Presumably, variability in county-level demographics should lead to variations
in preparedness perceptions if indeed perceptions are accurate and unbiased. It should be noted,
that the study did not determine emergency managers individual exposure to the FEMA
preparedness surveys or preparedness literature thus, this proxy reality test is merely exploratory.
Finally, the emergency manager’s own demographic data (experience, office structure,
and office related activities) were used as controls to remove variability in the emergency
manager’s perceptions prior to assessing the role of cognitive biases.
Replication
This study included measures of risk awareness perceptions as well as citizen
preparedness perceptions. The risk awareness perception measures included the emergency
manager’s own risk awareness, his or her perception of the risk awareness level of friends and
family and the emergency managers’ perceptions of citizen risk awareness. The latter
perceptions were compared to identical data from the previously mentioned national survey.
Thus, the very same analysis was able to be done on risk awareness as earlier described for
citizen preparedness. While the emergency manager’s perceptions of their citizens is not a focus
of this study, doing this additional analysis will be a means of replicating the study internal to
itself through comparing the results of these two dependent variables, risk awareness, and

21
examining the extent to which the availability and false consensus heuristics appear to impact
both sets of perceptions.
Conclusion
As previously stated, an effective effort to promote preparedness requires both an
accurate perception of citizen preparedness and an understanding of the socio-demographic
factors that affect citizen preparedness. Yet, little research has been conducted to determine
what factors and to what extent emergency managers perceptions of citizen preparedness and/or
risk awareness are affected by such biases. This study has conducted research on the formation
of emergency managers’ perceptions of citizen preparedness by examining the role of two
closely related cognitive biases in social psychology: the availability heuristic and the false
consensus effect. Thus, this research examines the extent to which emergency managers’
perceptions of citizen preparedness are actually a product of limited, immediately available
information (e.g. emergency managers’ perception of their friends and family members
preparedness and/or emergency managers’ self-perceptions), rather than actual citizen
preparedness levels.

22
CHAPTER THREE: METHODS
This chapter explains the methodology for this research. The chapter is composed of
seven sections, which cover the following topics: the study’s population, the unit of analysis,
how the data were collected, survey design; measures, potential limitations of the research, and
lastly an overview of data analysis.
Unit of Analysis
The unit of analysis for this study is the county emergency manager in the state of
Minnesota. Minnesota was selected because the researcher, herself, is a county emergency
manager in Minnesota, and it was hoped that this connection would enhance the response rate to
the study. The focus of the study is to determine to what extent cognitive biases (Availability
Heuristics and False Consensus Effect) affect the formation of emergency managers’ perceptions
of preparedness and risk awareness for their respective jurisdictions. Due to the fact that the
majority of the 87 counties in Minnesota rely on the county emergency manager to promote
preparedness activities it is important to assess how county emergency managers are determining
the “actual” level of county-wide citizen preparedness.
Population
The population for this study is a census of all 87 county emergency managers in the state
of Minnesota, excluding the researcher’s own county. Contact information for each county
emergency manager was obtained from the Minnesota Department of Public Safety.
Procedures
The data collection method for this research was an internet-based survey. The survey
was disseminated through the online survey tool, Survey Monkey. After obtaining the
appropriate email addresses for each county emergency manager in the population and IRB

23
approval from the researcher’s own university (North Dakota State University, see Appendix A),
the following steps were taken to proceed with the data collection process.
Step One: Initial Contact
A research announcement letter was mailed to each Minnesota county emergency
manager. The letter informed the recipient that he or she had been selected to participate in a
survey on citizen preparedness (Appendix B). This initial contact letter contained additional
information about the study (Appendix C) and a statement letting the potential participant know
that he or she would receive a survey invitation via email within two weeks.
Step Two: Survey Invitation
Two weeks after the initial contact letter was mailed, a formal survey invitation was sent
via email to all Minnesota county emergency managers (Appendix D). The survey invitation
contained the same information that was disseminated in the initial contact letter in addition to
survey instructions and the link to complete the survey.
Step Three: Invitation Follow-ups
Consistent with Dillman’s (2009) advice on how to maximize response rates, one-week
and then four weeks after the survey invitation was sent, a reminder email was sent along with
the link to the survey (Appendix F).
Survey Design
The survey instrument was designed based on the FEMA (2009) survey Personal
Preparedness in America: Findings from the 2009 Citizen Corps National Survey (Appendix E).
This meant that question wording and response formats from the Citizen Corps survey were used
in this study. However, format issues involved in presenting this survey in internet form were
addressed following the recommendations of Dillman (2009). The recommendations were

24
followed to increase response rates and reduce survey error. The next section explains how the
dependent and independent variables were measured. Additionally, the potential limitations of
the study are also discussed.
Dependent Variable Measures
This research began with the collection of data on two sets of emergency managers’
perceptions which included their perceptions of citizen risk awareness and perceptions of citizen
preparedness. These measures generally paralleled similar measures as the FEMA’s Citizen
Corps survey (2009) however the preparedness and risk awareness questions in the Citizen Corps
survey asked citizens to self-report their preparedness and risk awareness while this study not
only asked emergency managers to self-report but also used similarly worded questions that
asked emergency managers how they perceive other’s preparedness and risk awareness levels to
be (i.e. emergency managers’ immediate friends and acquaintances as well as the citizens in their
respective jurisdictions).
Perceptions of Risk Awareness
Questions about risk awareness were asked three separate times. First, respondents were
asked about their perceptions of citizens in the respondents’ counties; second, respondents were
asked about their perceptions of their friends and family members’ risk awareness; and third,
respondents were asked about their own risk awareness. In each case, questions about risk
awareness focused on four risks: natural disasters, terrorism, hazardous materials, and disease
outbreak. The first two sets of questions followed a very similar format. The lead-in for the
questions asking emergency manager’s their perceptions of their county’s citizens asked, “please
indicate the percentage of citizens in your county that would predict each of the following events
to be likely or very likely to ever occur in your community” and the lead-in for the questions

25
asking emergency managers’ their perceptions of their friends and family members’ risk
awareness asked, “please indicate the percentage of people you personally know (non-resident
family members, relatives, friends, etc.) that would predict each of the following events to be
likely or very likely to ever occur in your community”. The response formats for these two sets
of questions were identical. Following the listing of each of the four risks, the response format
listed: 0%, 10%, 20%, 30%, 40%, 50%, 60%, 70%, 80%, 90%, and 100%. Each of these two
sets of questions were combined into an index by adding the scales for the four risks. Both sets
of indexes proved to be highly reliable with Cronbach Alphas of .72 and .79, respectively.
Finally, a third risk awareness set of questions asked emergency managers about their
own sense of risk for the same four risks. The lead-in for this set of questions asked, “please
indicate how likely you believe each of the following events are to occur in your county. The
response format ranged from “1” (Not at all likely) to “5” (Very likely to happen). Again,
responses across the four risks were added to create an index and the Cronbach Alpha of .71
indicated that the index was reliable.
Perceptions of Preparedness
Similar to risk awareness, questions about preparedness were asked three separate times.
First respondents were asked about their perceptions of citizens in their county; second,
respondents were asked about their perceptions of their friends and family members’
preparedness; and third, respondents were asked about their own preparedness. In each case,
questions mirrored those on the 2009 FEMA survey questionnaire. The first two sets of questions
followed a very similar format. The lead-in for the questions asking emergency managers’ their
perceptions of their county’s citizens asked “please indicate the percentage of citizens in your
jurisdiction that you feel have each of the following supplies reserved for a disaster/emergency”

26
and the lead-in for the questions asking emergency managers’ their perceptions of their friends
and family members’ preparedness asked, “please indicate the percentage of people you
personally know (family members, relatives friends, etc.) that you feel have each of the
following supplies reserved for a disaster/emergency”. The response formats for these two sets of
questions were identical. Each question individually listed the following preparedness items and
requested emergency manager’s to indicate the percentage of citizens/friends and family that
they believe possess each supply: bottled water, packaged food, flashlight, portable battery
powered radio, batteries, first-aid kit, eyeglasses, medications, photocopies of personal
identification, financial documents, and cash. Following the listing of the preparedness item, the
response format listed: 0%, 10%, 20%, 30%, 40%, 50%, 60%, 70%, 80%, 90%, and 100%. Each
of these two sets of questions were combined into an index (Table 1). Both sets of indexes
proved to be highly reliable with Cronbach Alphas of .93 and .94, respectively.
Table 1. Cronbach Alpha reliability statistics for preparedness and risk awareness measures.
Measures N Cronbach’s Alpha M SD
Preparedness Supplies
Citizen 63 .93 30.80 11.91
Acquaintance 64 .94 37.20 12.28
Self 63 .56 0.68 0.19
Risk Awareness
Citizen 66 .72 5.18 2.33
Acquaintance 65 .79 5.99 2.04
Self 66 .71 3.62 0.95
Note: Self-reported data in both the preparedness supplies and risk awareness categories are not
based on a percent. Additionally, the index for self-reported preparedness supplies does not take
into account responses for possessing a flashlight due to lack of variability as all emergency
managers stating having one.
Finally, a third set of preparedness questions asked emergency managers about their own
preparedness relative to the items asked in the 2009 FEMA survey questionnaire. The lead-in for
this set of questions asked, “please indicate which of the following supplies you personally have
reserved for a disaster/emergency” (Yes = 1, No = 0). Again, responses across the preparedness

27
items were added to create an index (Table 1). The Cronbach Alpha of .56 was disappointing.
Generally, the hope is for Alphas of .70 or larger. Nevertheless, given the advisability of
keeping all three indexes as similar as possible, this third index was kept. The main impact of
this decision is to add some measurement noise to the correlations assessed later in the study.
Independent Variable Measures
Finally, emergency managers’ perceptions of overall risk awareness and preparedness
among their friends and family and emergency managers’ data on their own risk awareness and
preparedness were used to test whether the availability heuristic and false consensus effect
affects emergency managers’ perceptions of overall risk awareness and citizen preparedness in
the county. The key questions to be addressed in the results are whether the availability
hypothesis, the false consensus hypothesis or both are supported by the results.
Testing these hypotheses necessitates identifying plausible independent variables that
need to be incorporated in the final analysis to isolate the predicted impact of the key
independent variables associated with the hypotheses. This study included several blocks of
independent variables including emergency managers’ demographic characteristics, emergency
managers’ work experience, the structural characteristics of emergency managers’ offices, the
level of emergency managers’ various work activities (e.g., hours spent promoting
preparedness), and the demographic characteristics of the emergency managers’ respective
counties. With the exception of the last block of independent variables, testing these additional
control variables is largely exploratory. The intent is to keep any independent variables that
proved to be significantly related to either of the two hypothesized dependent variables and enter
these significant variables as controls in multiple regressions analyses testing for the two
heuristics.
28
County Emergency Manager Characteristics
Questions were asked to help determine if emergency manager characteristics and weekly
time they devoted to promoting preparedness has an effect on perceptions of citizen risk
awareness and preparedness. All of the following questions were asked at the conclusion of each
survey.
Emergency Manager Demographics
To determine if individual demographic characteristics of an emergency manager predict
their perceptions of citizen preparedness and/or risk awareness the following questions were
asked: a) “How old are you?”(fill-in the blank); b) “What is your gender?” (female or male); c)
“What is the highest level of education you have completed?” (less than 12th
grade (no diploma),
high school graduate or GED, some college but no degree, associate degree in college,
bachelor’s degree, master’s degree, doctorate degree).
Emergency Manager Experience
To determine if years of experience as the emergency manager of their current county
and/or years of experience in emergency management predict perceptions of citizen preparedness
and/or risk awareness the following questions were asked: a) “How many years have you been
employed as a county emergency manager?” (fill-in the blank); b) “How many years have you
worked in the field of emergency management?” (less than 1 year, 1 to 5 years, 6 to 10 years, 11
to 15 years, 16 or more years); Additionally, to determine if specific experiences in their current
jurisdiction effect perceptions the following question was asked: a) “Since you have been
employed with your current county, has your jurisdiction experienced any presidentially declared
disasters that were granted individual assistance?”(Yes, No).

29
Emergency Management Office Structure Characteristics
To determine if emergency manager position responsibilities and structure of individual
emergency management offices predict perceptions of citizen preparedness and/or risk awareness
the following questions were asked: a)“Do you have any other county positions or
responsibilities in your county in addition to being the county emergency manager (e.g. sheriff,
fire chief, county assessor, veterans administration, 9-1-1 dispatch, etcetera)?” (Yes, No, if Yes
what additional position(s) are assigned to you; and b) “How many individuals are employed by
your county government to do emergency management?” (1, 2, 3, 4 or more).
Emergency Management Office Related Activities
To test if the number of hours spent on emergency management related activities and/or
the number of hours spent promoting citizen preparedness predicts perceptions of citizen
preparedness and/or risk awareness the following questions were asked: a) “In your current
position, how many hours per week are spent on emergency management activities” (fill-in the
blank); b) “In your current position, how many hours per week are spent on promoting individual
and household preparedness activities?”(fill-in the blank).
Variability in County Demographics
Lastly, only one research question (i.e., research question 5 to be described later in the
results section) concerning the block of control variables measuring variances in county
demographic characteristics has a strong basis for making a prediction related to emergency
manager perceptions of citizen preparedness and/or risk awareness, albeit not one of theoretical
concern in this study. This block of variables measured the percent of people in each county that
are in the least prepared category for each of six demographic characteristics: age; gender;
household income; education; race; and employment. Determination of the least prepared
30
category for each of these demographics was based on data from FEMA’s Citizen Survey (2009)
mentioned earlier. The percent of people in the least prepared category differs from county to
county, across Minnesota, and if emergency managers’ perceptions are driven by on-the-ground
reality rather than heuristics, these six “least prepared” demographic variables should
significantly impact emergency managers’ perceptions of their citizens. As the percentage of
people that fall in each of the least prepared categories increases, one would expect emergency
managers’ perceptions of preparedness to decrease from county-to-county. Data were collected
from the US Census Bureau on each of these demographic factors for the counties that
completed the survey. In order to ensure an accurate list of county demographics the following
question was asked in the final section of the survey: a) “Which Minnesota county are you
currently employed with?” (select county from the list).
Limitations
There are several inherent limitations to the findings of this study based on the population
chosen and the inability to directly measure the accuracy of emergency managers’ perceptions.
To begin, the population chosen focused on one state. The results will not be generalizable to all
states except by implication however significance testing was still conducted on the Minnesota
results as if random sampling had been used in selecting Minnesota emergency managers simply
to provide a non-subjective means of identifying correlations of interest in the given population.
Trends found in the data may lead to more generalizable results in the future if a study is
conducted with a random sample of County Emergency Managers across the United States.
Second, this study simply examines factors affecting emergency manager’s perceptions of their
citizens to test the role of the availability heuristics and the false consensus bias in these
perceptions. If these cognitive heuristics prove to play a role in emergency manager’s

31
perceptions, such findings would raise serious questions about the likely accuracy of emergency
manager’s knowledge of their citizens. Relying on information that is “available” from what
one’s own friends and acquaintances do and/or on what one does him or herself is fraught with
problems when using such perceptions as a basis for estimating what is happening with citizens
across an entire jurisdiction. Nevertheless, reliance on these heuristics does not automatically
mean that jurisdictional perceptions will be wrong. Thus, a limitation of this study is the absence
of a direct measure of accuracy. Do emergency managers’ perceptions of their jurisdictions
match what is really happening in their jurisdiction? To measure accuracy, however, would
require surveys of random samples of each jurisdiction. Accomplishing a task of that magnitude
is something far beyond the resources available for this study. Still, this study includes proxy
measures of accuracy including a “test” of emergency managers’ knowledge of factors affecting
citizen preparedness and the Census data measures discussed above that likely reflect variances
in county-level preparedness across Minnesota.

32
CHAPTER FOUR: RESULTS
Introduction
This study collected in-depth information by conducting a census of all Minnesota county
emergency managers. This effort addressed two goals. First, this background data provides a
description of the emergency managers along multiple dimensions. These data provide a
thorough profile of the respondents to this study. Second, this information also measures factors
that may impact emergency managers’ perceptions of citizen preparedness and risk awareness.
These factors were identified earlier in the discussion of research questions and hypotheses. The
factors fall into the following general categories: demographic characteristics, emergency
management experience, office structure characteristics and emergency manager office related
activities. In addition, this section will report descriptive data on the preparedness and risk
awareness measures relevant to this study’s hypotheses.
Sample
First, demographic information for Minnesota county emergency managers in this study
is presented in Table 2. The overall response rate for the survey (N=65) was 75.5%. The data
revealed that the majority of the 65 county emergency managers responding to the survey are
male (70.8%) and between the ages of 41-60 years (Mean = 47.54, SD = 10.81). Nearly all
respondents reported having some type of college degree (84.6%) including 30.8% who have an
associate degree, 40.0% who have a bachelor’s degree, and 13.8% who have a master’s degree.
Second, data on aspects of the emergency manager’s experience in emergency
management were collected (Table 3). Respondents on average have been employed as a county
emergency manager for over five years (Mean = 5.74, SD = 5.10). Overall, years of experience
in emergency management range from less than one year to 16 years or more with nearly one

33
third of respondents possessing 16 years or more of experience (31.3%). It should be noted that
there were no qualifiers given during the survey process that would indicate what was meant by
“experience in emergency management” and the data may not be accurate as many different
types of work may be self-interpreted as emergency management.
Table 2. Personal demographic characteristics of respondents.
Demographic Characteristics N Percentage
Age (in years)
20-30
31-40
41-50
51-60
61 and older
Total
5
13
13
29
5
65
7.7%
20.0%
20.0%
44.6%
7.7%
100.0%
Gender
Male
Female
Total
46
19
65
70.8%
29.2%
100.0%
Highest Level of Education Completed
Less than 12th
grade (no diploma)
High school graduate or GED
Some college but no degree
Associate degree in college
Bachelor’s degree
Master’s degree
Doctorate degree
Total
- -
2
8
20
26
9
- -
65
- -
3.1%
12.3%
30.8%
40.0%
13.8%
- -
100.0%
Note: The measurement for age is a continuous variable and was collapsed into categories for
this table. The following is the mean and standard deviation for age (M = 47.54, SD = 10.81).
34
Table 3. Emergency Management experience characteristics of respondents.
Emergency Manager Experience N Percent
Years Employed as a County Emergency Manager
1 to 5 years
6 to 10 years
11 to 15 years
16 or more years
Total
39
15
8
4
66
59.1%
22.7%
12.1%
6.1%
100.0%
Years of work in Emergency Management
Less than 1 year
1 to 5 years
6 to 10 years
11 to 15 years
16 or more years
Total
3
19
12
10
20
64
4.7%
29.7%
18.8%
15.6%
31.3%
100.0%
Note: The measurement for years employed as a county emergency manager is a continuous
variable and was collapsed into four categories. The following is the respective mean and
standard deviation (M=5.74, SD=5.10).
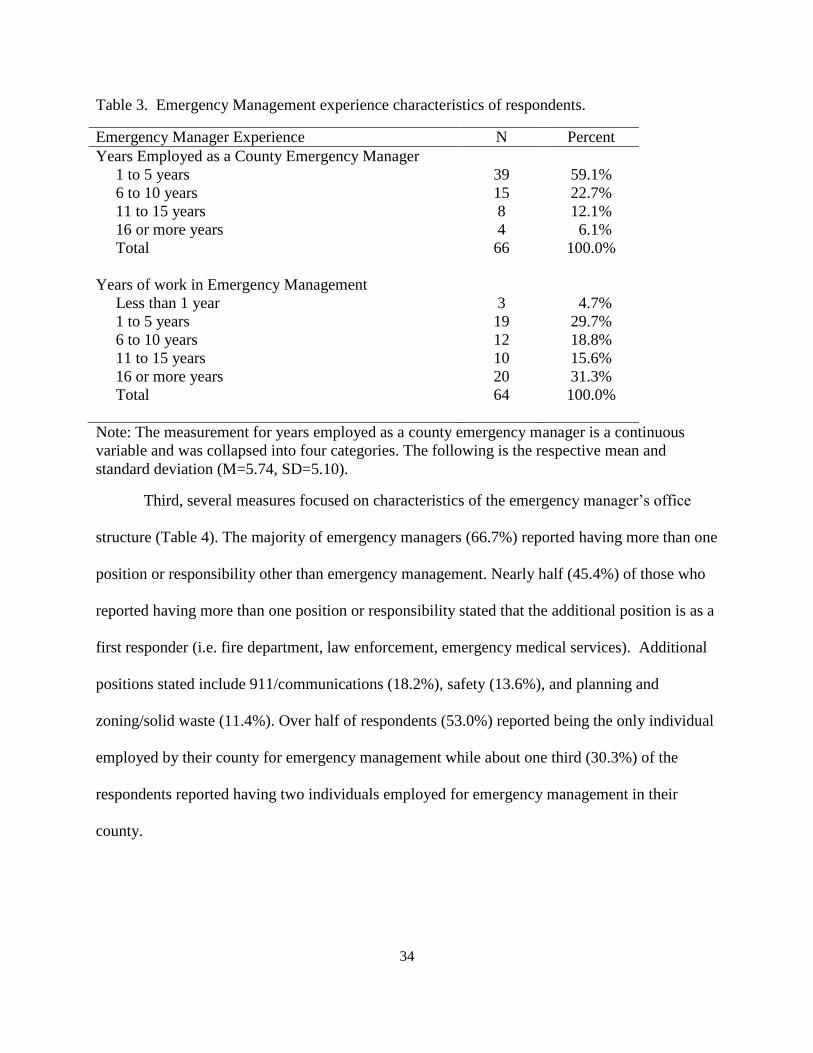
Third, several measures focused on characteristics of the emergency manager’s office
structure (Table 4). The majority of emergency managers (66.7%) reported having more than one
position or responsibility other than emergency management. Nearly half (45.4%) of those who
reported having more than one position or responsibility stated that the additional position is as a
first responder (i.e. fire department, law enforcement, emergency medical services). Additional
positions stated include 911/communications (18.2%), safety (13.6%), and planning and
zoning/solid waste (11.4%). Over half of respondents (53.0%) reported being the only individual
employed by their county for emergency management while about one third (30.3%) of the
respondents reported having two individuals employed for emergency management in their
county.

35
Table 4. Emergency Management office structure and work-related characteristics of
respondents.
EM Office Structure Characteristics and Activities N Percent
Percent of EM’s with Other Positions or
Responsibilities
Yes
No
Total
Other Positions (N=44)
911 Dispatch/Communications
Safety
First Responder (Fire, Law Enforcement, EMS)
Planning and Zoning/Solid Waste
Other
Did Not Specify
Total
44
22
66
8
6
20
5
4
1
44
66.7%
33.3%
100.0%
18.2%
13.6%
45.4%
11.4%
9.1%
2.3%
100.0%
Number of Hours per Week Spent on Emergency
Management Activities
0-10 hours
11-20 hours
21-30 hours
31-40 hours
40 or more hours
Total
13
11
17
21
4
66
19.7%
16.7%
25.8%
31.8%
6.0%
100.0%
Percent of Emergency Managers Who Have
Experienced a Presidentially Declared Disaster in Their
Current County that was Granted Individual Assistance
Yes
No
Total
33
33
66
50.0%
50.0%
100.0%
Note: The measurements for hours per week spent on emergency management activities and
hours spent per week on preparedness are continuous variables and were collapsed into
categories to display their distributions. The following is the respective means and standard
deviations for both variables (M=27.50, SD=14.09) and (M=4.19, SD=4.50).
Fourth, the survey asked about emergency manager’s office, work-related activities
(Table 4). On average, respondents spend 27.5 hours a week on emergency management
activities (M=27.50, SD=14.09). Of those hours spent on emergency management activities,
36
emergency managers reported spending on average 4.19 hours a week on preparedness activities
(M=4.19, SD=4.50). Lastly, half of respondents (50.0%) reported having experienced a
presidentially declared disaster in their current county that included a grant of individual
assistance.
Lastly, data were collected on data directly related to this study’s hypotheses –
emergency managers’ self-reported preparedness and risk awareness, emergency managers’
perceptions of their friends and acquaintances preparedness and risk awareness, and manager’s
perceptions of their jurisdictions’ preparedness and risk awareness. To begin, the preparedness
measures used the preparedness checklist from the FEMA (2009) survey. Results for emergency
managers’ perceptions of citizen preparedness, acquaintances preparedness, and a self-reported
preparedness are summarized in Table 5. The Table shows the percent of emergency managers
selecting one of the eleven percentage points (from 0% to 100% in increments of 10) as
representative of emergency managers’ perceptions of the percent of citizens or acquaintances
possessing a given supply and shows the percent of emergency managers’ self-reporting their
own possession of a given supply. For all supply items that were addressed by the supplies
checklist, the overall data summary shows that emergency managers perceive the general
citizenry to be the least prepared of the three groups assessed, followed by acquaintances and
then emergency managers themselves. These results were not surprising. Emergency managers
should be expected to be more prepared than the general citizenry and likely to perceive friends
and families as sharing similar interests in preparedness compared to citizens overall.
Similarly, results for emergency managers’ perceptions of citizens’ risk awareness
(likelihood of hazard occurrence), of acquaintances’ risk awareness, and managers’ self-reported
risk awareness are summarized in Table 6. Results show the percent of emergency managers

37
selecting one of the eleven percentage points as representative of the percent of citizens or
acquaintances who judge the given hazard as likely or very likely to occur and percent of
emergency managers’ self-reporting the incident as likely or very likely to occur. For all hazards
that were assessed, the overall data summary shows that the emergency manager perceives that
the general citizenry is less likely to perceive various hazard-related events to occur than
emergency managers perceive acquaintances or themselves to expect such events to be likely or
very likely to occur. This ranking of awareness suggests that emergency managers whose job it is
to think about risk are more likely to expect such events than perhaps their friends, family, and
acquaintances and their general citizenry are.
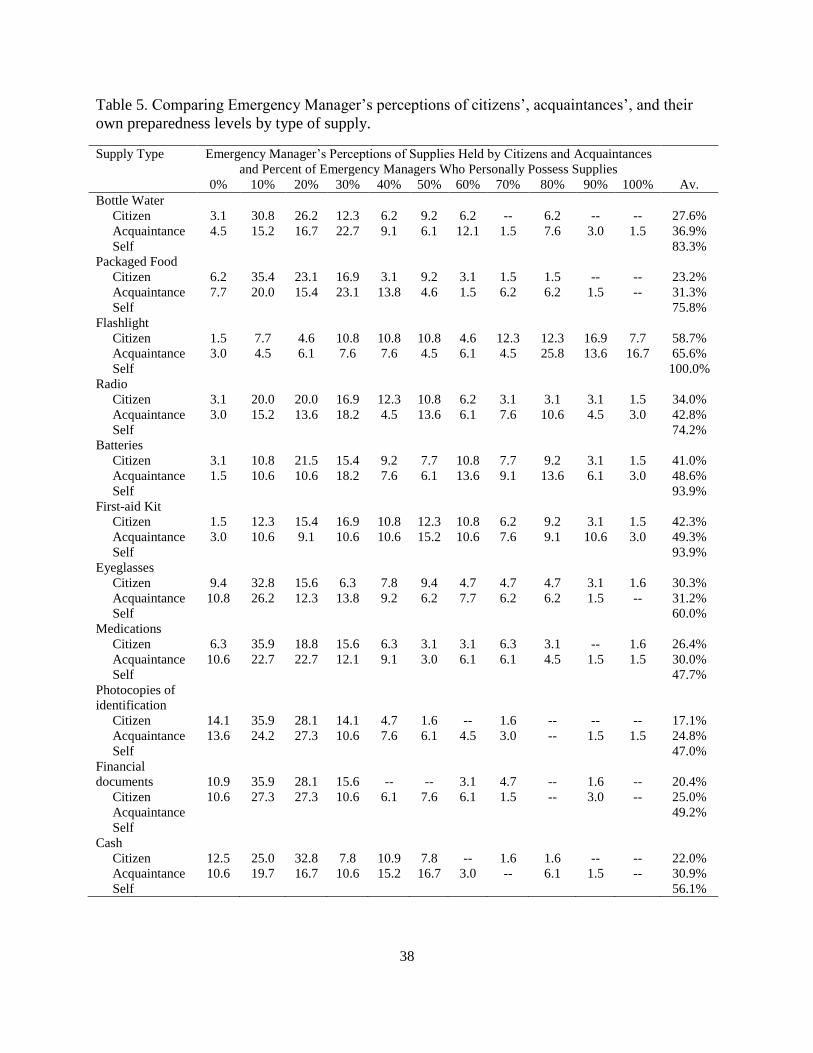
38
Table 5. Comparing Emergency Manager’s perceptions of citizens’, acquaintances’, and their
own preparedness levels by type of supply.
Supply Type Emergency Manager’s Perceptions of Supplies Held by Citizens and Acquaintances
and Percent of Emergency Managers Who Personally Possess Supplies
0% 10% 20% 30% 40% 50% 60% 70% 80% 90% 100% Av.
Bottle Water
Citizen
Acquaintance
Self
3.1
4.5
30.8
15.2
26.2
16.7
12.3
22.7
6.2
9.1
9.2
6.1
6.2
12.1
--
1.5
6.2
7.6
--
3.0
--
1.5
27.6%
36.9%
83.3%
Packaged Food
Citizen
Acquaintance
Self
6.2
7.7
35.4
20.0
23.1
15.4
16.9
23.1
3.1
13.8
9.2
4.6
3.1
1.5
1.5
6.2
1.5
6.2
--
1.5
--
--
23.2%
31.3%
75.8%
Flashlight
Citizen
Acquaintance
Self
1.5
3.0
7.7
4.5
4.6
6.1
10.8
7.6
10.8
7.6
10.8
4.5
4.6
6.1
12.3
4.5
12.3
25.8
16.9
13.6
7.7
16.7
58.7%
65.6%
100.0%
Radio
Citizen
Acquaintance
Self
3.1
3.0
20.0
15.2
20.0
13.6
16.9
18.2
12.3
4.5
10.8
13.6
6.2
6.1
3.1
7.6
3.1
10.6
3.1
4.5
1.5
3.0
34.0%
42.8%
74.2%
Batteries
Citizen
Acquaintance
Self
3.1
1.5
10.8
10.6
21.5
10.6
15.4
18.2
9.2
7.6
7.7
6.1
10.8
13.6
7.7
9.1
9.2
13.6
3.1
6.1
1.5
3.0
41.0%
48.6%
93.9%
First-aid Kit
Citizen
Acquaintance
Self
1.5
3.0
12.3
10.6
15.4
9.1
16.9
10.6
10.8
10.6
12.3
15.2
10.8
10.6
6.2
7.6
9.2
9.1
3.1
10.6
1.5
3.0
42.3%
49.3%
93.9%
Eyeglasses
Citizen
Acquaintance
Self
9.4
10.8
32.8
26.2
15.6
12.3
6.3
13.8
7.8
9.2
9.4
6.2
4.7
7.7
4.7
6.2
4.7
6.2
3.1
1.5
1.6
--
30.3%
31.2%
60.0%
Medications
Citizen
Acquaintance
Self
6.3
10.6
35.9
22.7
18.8
22.7
15.6
12.1
6.3
9.1
3.1
3.0
3.1
6.1
6.3
6.1
3.1
4.5
--
1.5
1.6
1.5
26.4%
30.0%
47.7%
Photocopies of
identification
Citizen
Acquaintance
Self
14.1
13.6
35.9
24.2
28.1
27.3
14.1
10.6
4.7
7.6
1.6
6.1
--
4.5
1.6
3.0
--
--
--
1.5
--
1.5
17.1%
24.8%
47.0%
Financial
documents
Citizen
Acquaintance
Self
10.9
10.6
35.9
27.3
28.1
27.3
15.6
10.6
--
6.1
--
7.6
3.1
6.1
4.7
1.5
--
--
1.6
3.0
--
--
20.4%
25.0%
49.2%
Cash
Citizen
Acquaintance
Self
12.5
10.6
25.0
19.7
32.8
16.7
7.8
10.6
10.9
15.2
7.8
16.7
--
3.0
1.6
--
1.6
6.1
--
1.5
--
--
22.0%
30.9%
56.1%

Table 6. Comparing emergency manager’s perceptions of citizens’, acquaintances’, and their own risk awareness by type of incident
1Emergency Managers were asked what percent of their acquaintances or friends would judge an incident as likely or very likely, so
percentages in this column for acquaintances and citizens are simple averages. For self-reports, the percentages are the average
percent of emergency managers who said that they believe an incident as likely or very likely on a 5-point scale.
Incident Type Emergency Managers’ Perceptions of the Percent of their Citizens or Acquaintances Who Judge an
Incident as Likely or Very Likely to Occur and Percent of Emergency Managers’ Who Judge an
Incident as Likely or Very Likely to Occur
0% 10% 20% 30% 40% 50% 60% 70% 80% 90% 100% Av.1
Natural Disaster
Citizen
Acquaintance
EMs
--
--
3.0
1.5
7.6
3.1
4.5
3.1
3.0
4.6
1.5
6.2
6.1
7.7
16.7
7.7
21.2
21.5
19.7
24.6
16.7
20.0
71.8%
76.0%
94.0%
Terrorism
Citizen
Acquaintance
EMs
9.1
9.2
42.4
26.2
30.3
23.1
6.1
6.2
6.1
7.7
--
9.2
3.0
6.2
1.5
3.1
--
7.7
--
1.5
1.5
--
18.9%
30.1%
13.6%
Hazardous
Materials
Citizen
Acquaintance
EMs
--
--
7.6
4.6
7.6
10.8
18.2
6.2
9.1
9.2
22.7
16.9
15.2
12.3
3.0
16.9
12.1
13.8
4.5
4.6
--
4.6
47.7%
55.6%
80.3%
Disease Outbreak
Citizen
Acquaintance
EMs
1.5
--
24.2
20.0
24.2
15.4
18.2
13.8
7.6
7.7
18.2
18.5
3.0
10.8
1.5
10.8
1.5
3.1
--
--
--
--
28.9%
38.0%
25.7%
39

40
Research Question 1- Demographic Characteristics: Do selected demographic
characteristics of emergency managers predict emergency managers’ perceptions of their own
county’s citizen preparedness and/or risk awareness?
Results of ANOVA tests for the influence of emergency manager demographics for both
perceptions of citizen preparedness index and citizen risk awareness index suggest that the
demographic variables (i.e., gender and education) do not predict either dependent variable (see
Table 7).
Table 7. ANOVA’s for emergency manager demographic characteristics and emergency
managers’s perceptions of jurisdictional preparedness and risk awareness.
Demographic Characteristics Perceived Citizen
Preparedness
Perceived Citizen Risk
Awareness
M SD F p M SD F p
Gender
Male 31.50 18.07 .24 .62 41.06 1.57 .04 .82
Female 29.23 13.27 41.91 1.38
Education
High School Graduate or
GED
21.81 -- .96 .43 45.00 1.06 .39 .81
Some college but no degree 35.90 10.73 36.56 0.83
Associate degree in college 32.72 20.43 41.63 1.79
Bachelor’s degree 31.23 14.63 43.30 1.57
Master’s degree 21.91 17.09 38.61 1.29
Note: Means for perceived preparedness report the average perceived citizen preparedness level
by emergency managers in that demographic category. Similarly, the means for risk awareness
report the perceived level of citizen risk awareness by emergency managers in that demographic
category.
Similarly, a correlation analysis was conducted for the continuous independent variable
age and both dependent variables. The results are as follows: age and perceived preparedness, r
= .18, ns; age and perceived risk awareness, r = .02, ns; indicating that age was not significantly
related to either dependent variable. Thus, the demographic characteristics in this study do not
predict the perceptions of county-wide preparedness or risk awareness. Future research outside
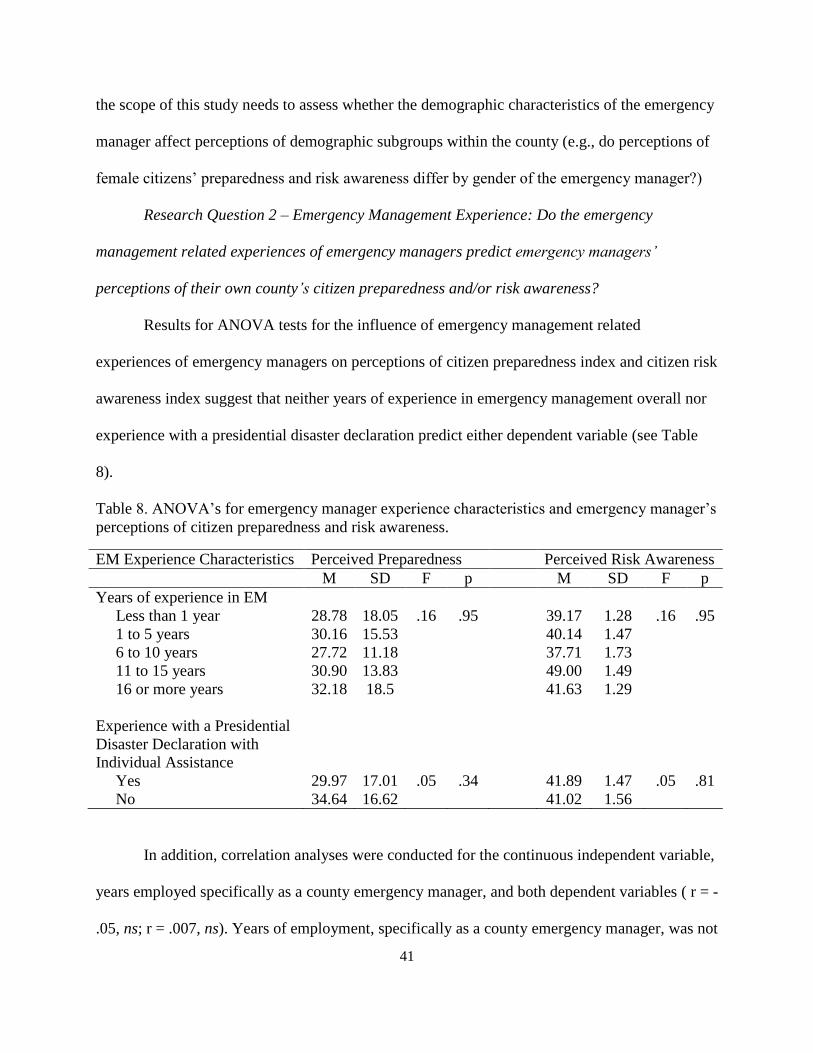
41
the scope of this study needs to assess whether the demographic characteristics of the emergency
manager affect perceptions of demographic subgroups within the county (e.g., do perceptions of
female citizens’ preparedness and risk awareness differ by gender of the emergency manager?)
Research Question 2 – Emergency Management Experience: Do the emergency
management related experiences of emergency managers predict emergency managers’
perceptions of their own county’s citizen preparedness and/or risk awareness?
Results for ANOVA tests for the influence of emergency management related
experiences of emergency managers on perceptions of citizen preparedness index and citizen risk
awareness index suggest that neither years of experience in emergency management overall nor
experience with a presidential disaster declaration predict either dependent variable (see Table
8).
Table 8. ANOVA’s for emergency manager experience characteristics and emergency manager’s
perceptions of citizen preparedness and risk awareness.
EM Experience Characteristics Perceived Preparedness Perceived Risk Awareness
M SD F p M SD F p
Years of experience in EM
Less than 1 year 28.78 18.05 .16 .95 39.17 1.28 .16 .95
1 to 5 years 30.16 15.53 40.14 1.47
6 to 10 years 27.72 11.18 37.71 1.73
11 to 15 years 30.90 13.83 49.00 1.49
16 or more years 32.18 18.5 41.63 1.29
Experience with a Presidential
Disaster Declaration with
Individual Assistance
Yes 29.97 17.01 .05 .34 41.89 1.47 .05 .81
No 34.64 16.62 41.02 1.56
In addition, correlation analyses were conducted for the continuous independent variable,
years employed specifically as a county emergency manager, and both dependent variables ( r = -
.05, ns; r = .007, ns). Years of employment, specifically as a county emergency manager, was not

42
significantly related to either dependent variable. Thus, neither experience in emergency
management, overall, specific experience as an emergency manager in a given county, nor
experience at some point with a presidentially declared disaster affected emergency managers’
perceptions of citizen preparedness or risk awareness. As noted earlier, research on self-reported
citizen preparedness is disappointing and one might expect more seasoned emergency managers’
perceptions to be enhanced by encountering this reality first-hand, but this does not appear to be
the case.
Research Question 3 – Emergency Management Office Structure: Do the structural
characteristics of the emergency managers’ county office predict emergency managers’
perceptions of their own county’s citizen preparedness and/or risk awareness?
Results for ANOVA tests for the influence of structural characteristics of emergency
manager’s county office for both perceptions of citizen preparedness and citizen risk awareness
suggest that structural characteristics do not predict either dependent variable (see Table 9).
Emergency managers’ perception of county preparedness and risk awareness did not differ for
emergency managers who did or did not hold other positions nor did these perceptions differ by
the size of emergency manager’s office.
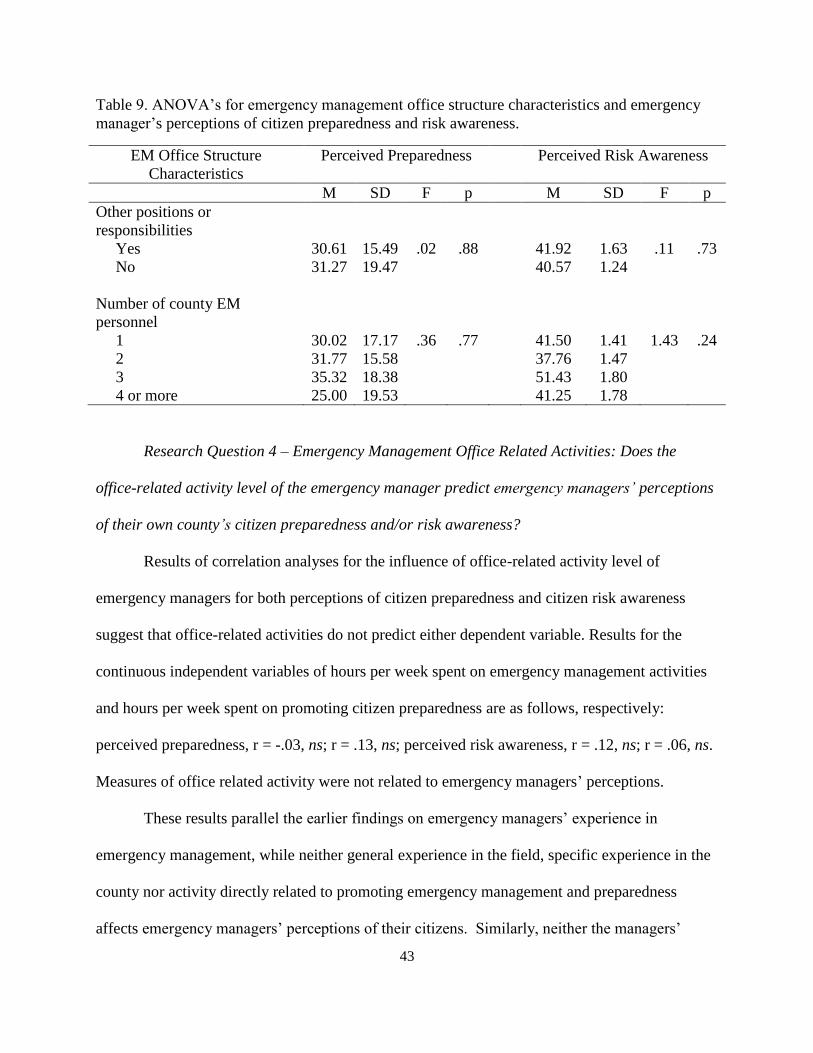
43
Table 9. ANOVA’s for emergency management office structure characteristics and emergency
manager’s perceptions of citizen preparedness and risk awareness.
EM Office Structure
Characteristics
Perceived Preparedness Perceived Risk Awareness
M SD F p M SD F p
Other positions or
responsibilities
Yes 30.61 15.49 .02 .88 41.92 1.63 .11 .73
No 31.27 19.47 40.57 1.24
Number of county EM
personnel
1 30.02 17.17 .36 .77 41.50 1.41 1.43 .24
2 31.77 15.58 37.76 1.47
3 35.32 18.38 51.43 1.80
4 or more 25.00 19.53 41.25 1.78
Research Question 4 – Emergency Management Office Related Activities: Does the
office-related activity level of the emergency manager predict emergency managers’ perceptions
of their own county’s citizen preparedness and/or risk awareness?
Results of correlation analyses for the influence of office-related activity level of
emergency managers for both perceptions of citizen preparedness and citizen risk awareness
suggest that office-related activities do not predict either dependent variable. Results for the
continuous independent variables of hours per week spent on emergency management activities
and hours per week spent on promoting citizen preparedness are as follows, respectively:
perceived preparedness, r = -.03, ns; r = .13, ns; perceived risk awareness, r = .12, ns; r = .06, ns.
Measures of office related activity were not related to emergency managers’ perceptions.
These results parallel the earlier findings on emergency managers’ experience in
emergency management, while neither general experience in the field, specific experience in the
county nor activity directly related to promoting emergency management and preparedness
affects emergency managers’ perceptions of their citizens. Similarly, neither the managers’

44
ascribed (gender and age), nor his or her achieved (education) characteristics affect managers’
perceptions of their citizens. However, Tables 5 and 6 clearly showed variations in emergency
managers’ perceptions but the results so far provided little insight into the source of that
variability. The variability is not due to the emergency managers’ personal demographic
characteristics, nor his or her office structure, nor the manager’s experience in his or her office,
nor in his or her level of activity in the office. Perhaps the variability is simply due to the actual
preparedness levels and levels of risk awareness really being different from county-to-county.
This possibility is explored in the next research question.
Research Question 5 – Variability in County Demographics: Do the preparedness-
related demographic characteristics of the counties predict emergency managers’ perceptions of
their own county’s citizen preparedness and/or risk awareness?
This research question is basically asking whether emergency managers’ perception of
their counties reflect the reality of what is happening at the county level. To directly answer this
question would require surveys to be conducted in each county so that there could be a direct
comparison of survey results with emergency managers’ perceptions. As noted earlier such a
project would be costly and time prohibitive. Alternatively, it was possible to identify from the
FEMA survey (Federal Emergency Management Agency, 2009), the category in each of several
demographics that actually reflected the least prepared group nationally and then determine the
percent of each county’s population in that category. If emergency managers’ perceptions of
preparedness were reality-based their perceptions should vary with variations from county-to-
county in the percentage of county citizens in the least prepared category for any given
demographic characteristic mentioned in the FEMA surveys.

45
Results of correlation analyses for the influence of preparedness-related county
demographic characteristics relative to emergency managers’ perception of their citizens’
preparedness and risk awareness suggest that only the independent variables of county gender (%
female) and county employment (% retired) influence perceptions of preparedness and that none
of the county demographics (as mentioned above) affect perceptions of risk awareness (see Table
10).
Table 10. Correlation analysis for preparedness-related demographic characteristics of counties
and emergency manager’s perspectives of jurisdictional preparedness and risk awareness.
County Percent in least prepared
demographic category
Perceived
Preparedness
Perceived
Risk Awareness
r p r p
Age (% 55+) .08 .25 - .18 .07
Gender (% female) - .20 .05 - .10 .19
Income (% < $25,000) - .001 .49 - .19 .06
Education (% with HS degree only or less) - .01 .45 - .15 .10
Race (% Black or African American) - .14 .13 .09 .23
Employment (% Retired) .39 .00 - .01 .46
The relationship of percent female in each county with perceived preparedness shows that
emergency managers perceive preparedness to be less in counties with higher percentages of
females and the FEMA survey did show a relationship between gender and preparedness.
However, the sign for the significant percent retired correlation is the opposite of what research
suggests. As the percent of retired people grows from county to county, research suggests that
preparedness should be perceived to be less. Instead, emergency managers perceived
preparedness to be greater.
Overall, the general absence of significant correlations between emergency managers’
perceptions and known predictors of preparedness is troubling. While it is clearly a difficult task
to accurately estimate the exact level of preparedness and risk awareness in a county, one could

46
still anticipate sensitivity to demographic predictions of preparedness in a county such that there
would be correlations across counties between estimates of citizen preparedness and county-level
demographic predictions of such. This generally was not the case. So, are emergency managers’
perceptions simply random guesses unrelated to experience and/or on the ground reality or is
there some other source of data used by emergency managers that might suggest a pattern behind
what otherwise appears to be mere guessing?
The hypotheses to follow predict that emergency managers’ perceptions are patterned and
based on data, but on data sources much closer to home. The hypotheses are independent of the
research questions. They would be offered whether the research questions were found to be
answered positively or negatively. Still the hypotheses become more interesting if supported,
given the pattern of findings so far.
Hypotheses
False Consensus Hypothesis: Emergency managers’ self-reports of their own risk
awareness level and preparedness level will correlate positively with emergency managers’
perceptions of their own county’s citizen risk awareness level and preparedness level,
respectively.
Availability Hypothesis: Emergency managers’ perceptions of their friends’ and family’s
risk awareness level and preparedness level well correlate positively with emergency managers’
perceptions of their own county’s citizen risk awareness and preparedness level, respectively.
Correlational data support both the False Consensus Hypothesis and the Availability
Hypothesis. For risk awareness, the correlations of emergency managers’ self-perception of risk
awareness (False Consensus Hypothesis) and their perceptions of their friends’ and family’s risk
awareness (Availability Hypothesis) are both significantly related to emergency managers’
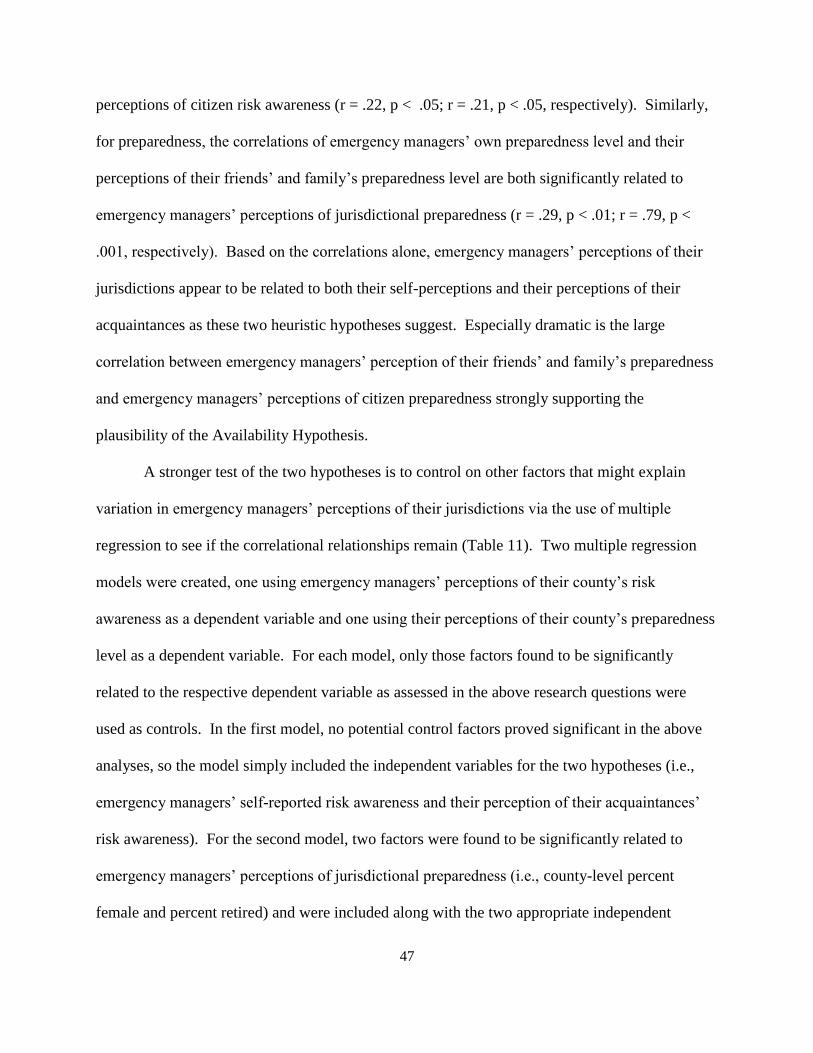
47
perceptions of citizen risk awareness (r = .22, p < .05; r = .21, p < .05, respectively). Similarly,
for preparedness, the correlations of emergency managers’ own preparedness level and their
perceptions of their friends’ and family’s preparedness level are both significantly related to
emergency managers’ perceptions of jurisdictional preparedness (r = .29, p < .01; r = .79, p <
.001, respectively). Based on the correlations alone, emergency managers’ perceptions of their
jurisdictions appear to be related to both their self-perceptions and their perceptions of their
acquaintances as these two heuristic hypotheses suggest. Especially dramatic is the large
correlation between emergency managers’ perception of their friends’ and family’s preparedness
and emergency managers’ perceptions of citizen preparedness strongly supporting the
plausibility of the Availability Hypothesis.
A stronger test of the two hypotheses is to control on other factors that might explain
variation in emergency managers’ perceptions of their jurisdictions via the use of multiple
regression to see if the correlational relationships remain (Table 11). Two multiple regression
models were created, one using emergency managers’ perceptions of their county’s risk
awareness as a dependent variable and one using their perceptions of their county’s preparedness
level as a dependent variable. For each model, only those factors found to be significantly
related to the respective dependent variable as assessed in the above research questions were
used as controls. In the first model, no potential control factors proved significant in the above
analyses, so the model simply included the independent variables for the two hypotheses (i.e.,
emergency managers’ self-reported risk awareness and their perception of their acquaintances’
risk awareness). For the second model, two factors were found to be significantly related to
emergency managers’ perceptions of jurisdictional preparedness (i.e., county-level percent
female and percent retired) and were included along with the two appropriate independent
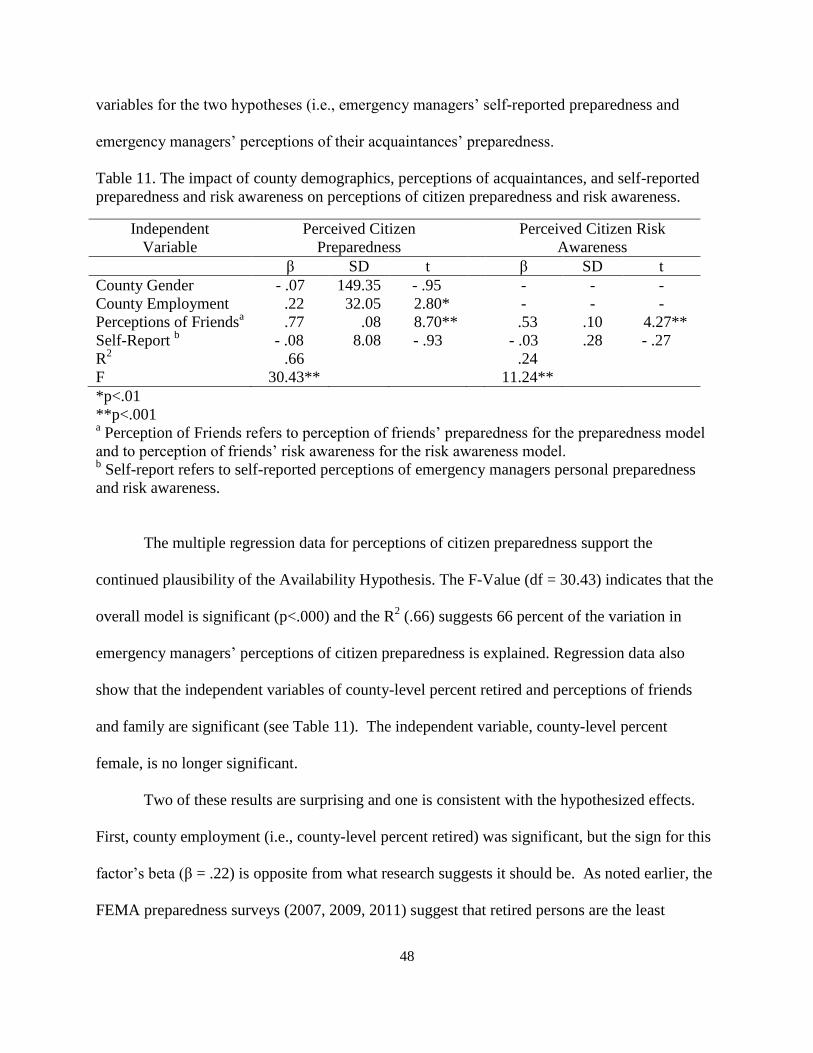
48
variables for the two hypotheses (i.e., emergency managers’ self-reported preparedness and
emergency managers’ perceptions of their acquaintances’ preparedness.
Table 11. The impact of county demographics, perceptions of acquaintances, and self-reported
preparedness and risk awareness on perceptions of citizen preparedness and risk awareness.
Independent
Variable
Perceived Citizen
Preparedness
Perceived Citizen Risk
Awareness
β SD t β SD t
County Gender - .07 149.35 - .95 - - -
County Employment 0.22 32.05 02.80* - - -
Perceptions of Friendsa
0.77 000.08 008.70** 0.53 .10 04.27**
Self-Report b
- .08 008.08 - .93 - .03 .28 - .27
R2
F
0.66
30.43**
0.24
011.24**
*p<.01
**p<.001 a Perception of Friends refers to perception of friends’ preparedness for the preparedness model
and to perception of friends’ risk awareness for the risk awareness model. b Self-report refers to self-reported perceptions of emergency managers personal preparedness
and risk awareness.
The multiple regression data for perceptions of citizen preparedness support the
continued plausibility of the Availability Hypothesis. The F-Value (df = 30.43) indicates that the
overall model is significant (p<.000) and the R2 (.66) suggests 66 percent of the variation in
emergency managers’ perceptions of citizen preparedness is explained. Regression data also
show that the independent variables of county-level percent retired and perceptions of friends
and family are significant (see Table 11). The independent variable, county-level percent
female, is no longer significant.
Two of these results are surprising and one is consistent with the hypothesized effects.
First, county employment (i.e., county-level percent retired) was significant, but the sign for this
factor’s beta (β = .22) is opposite from what research suggests it should be. As noted earlier, the
FEMA preparedness surveys (2007, 2009, 2011) suggest that retired persons are the least
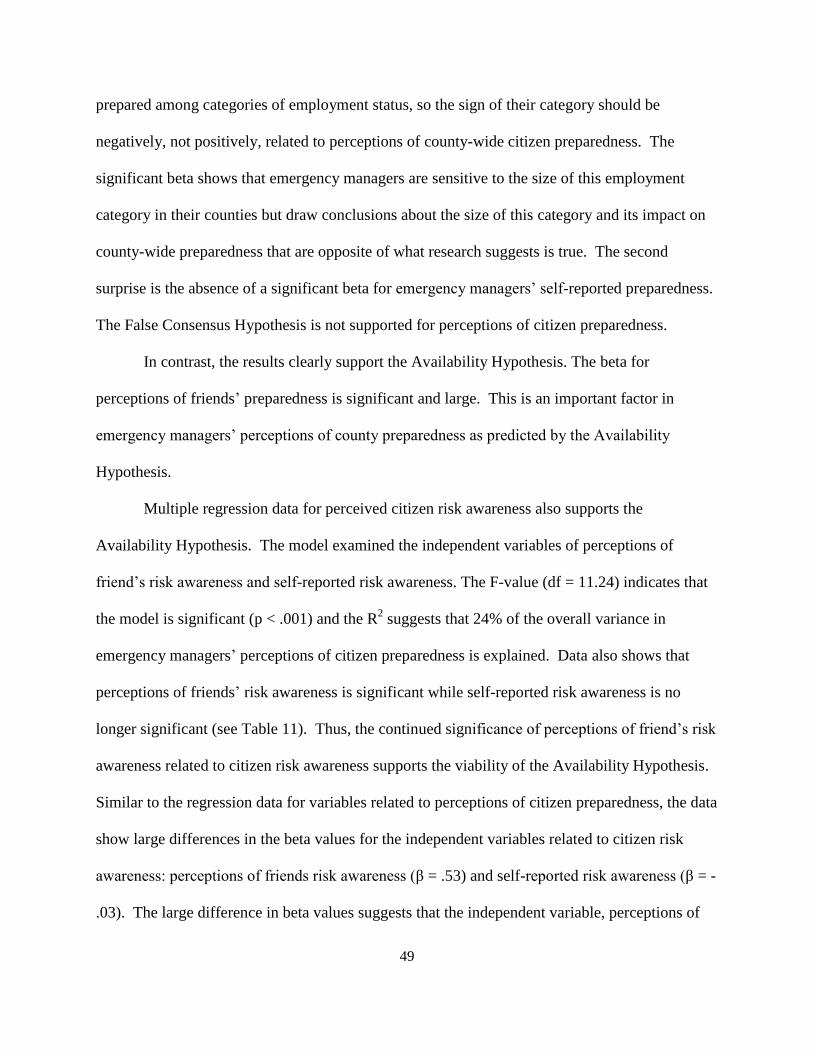
49
prepared among categories of employment status, so the sign of their category should be
negatively, not positively, related to perceptions of county-wide citizen preparedness. The
significant beta shows that emergency managers are sensitive to the size of this employment
category in their counties but draw conclusions about the size of this category and its impact on
county-wide preparedness that are opposite of what research suggests is true. The second
surprise is the absence of a significant beta for emergency managers’ self-reported preparedness.
The False Consensus Hypothesis is not supported for perceptions of citizen preparedness.
In contrast, the results clearly support the Availability Hypothesis. The beta for
perceptions of friends’ preparedness is significant and large. This is an important factor in
emergency managers’ perceptions of county preparedness as predicted by the Availability
Hypothesis.
Multiple regression data for perceived citizen risk awareness also supports the
Availability Hypothesis. The model examined the independent variables of perceptions of
friend’s risk awareness and self-reported risk awareness. The F-value (df = 11.24) indicates that
the model is significant (p < .001) and the R2 suggests that 24% of the overall variance in
emergency managers’ perceptions of citizen preparedness is explained. Data also shows that
perceptions of friends’ risk awareness is significant while self-reported risk awareness is no
longer significant (see Table 11). Thus, the continued significance of perceptions of friend’s risk
awareness related to citizen risk awareness supports the viability of the Availability Hypothesis.
Similar to the regression data for variables related to perceptions of citizen preparedness, the data
show large differences in the beta values for the independent variables related to citizen risk
awareness: perceptions of friends risk awareness (β = .53) and self-reported risk awareness (β = -
.03). The large difference in beta values suggests that the independent variable, perceptions of
50
friends risk awareness, has a substantial impact on the dependent variable compared to self-
reported risk awareness.
Thus, the multiple regression analyses for both perceptions of citizen preparedness and
perceptions of citizen risk awareness support the Availability Hypothesis, but not the False
Consensus Hypothesis. In both regression runs, the independent variables for emergency
managers’ self-reported preparedness and risk awareness were shown as not significant. There is
little evidence that emergency managers are using either their own preparedness level or their
own risk awareness as a basis for estimating the preparedness level or risk awareness of citizens
in their jurisdiction.
Finally, comparing the regression models for preparedness and risk awareness estimates
reveal interesting similarities and differences. Both models are significant and much of the
variability in emergency manager’s perceptions for both dependent variables can be explained.
However, far more variability can be explained for perceptions of citizen preparedness (i.e., 66%
of the variance in perceived jurisdictional preparedness is explained by its model while only 24%
of variance in perceived jurisdictional risk awareness is explained by the model). There is much
left to be done beyond verifying the relevance of the availability heuristic in identifying strong
predictors of emergency managers’ perceptions of their county’s risk awareness, especially since
none of the factors examined as part of the earlier discussed exploratory research questions
proved to be a significant predictor.

51
CHAPTER FIVE: DISCUSSION
Research in social psychology suggests that human perceptions of social reality are often
incorrect. A particularly promising approach to understanding this accuracy gap is our use of
cognitive heuristics such as the availability heuristic and false consensus effect. This study
examined whether these cognitive heuristics impact how county emergency managers perceive
citizen risk awareness and citizen preparedness. The research sample for this study was county
emergency managers in the state of Minnesota. The research addressed the following five
questions: 1) Do demographic characteristics of emergency managers’ predict their perceptions
of their county’s preparedness and/or risk awareness; 2) Do emergency management-related
experiences of emergency managers’ predict their perceptions of their county’s preparedness
and/or awareness; 3) Do the structural characteristics of the emergency manager’s county office
predict perceptions of county preparedness and/or risk awareness; 4) Does the office-related
activity level of emergency managers predict their perceptions of their county’s preparedness
and/or risk awareness; and 5) Do the preparedness-related demographic characteristics of the
counties predict emergency managers’ perceptions of their county’s preparedness and/or risk
awareness. The data analysis revealed that emergency manager’s demographic characteristics do
not predict their perceptions of county preparedness or risk awareness. Similarly, neither general
experience in emergency management, specific experience as an emergency manager in a given
county, experience at some point with a presidentially declared disaster, structural characteristics
of emergency managers’ county office, nor office-related activity levels predict perceptions of
citizen preparedness or risk awareness. Thus, none of the emergency manager’s background
characteristics, office structure characteristics, or emergency management-related activity levels
play a role in perceptions of citizens’ preparedness or risk awareness.

52
Finally, shifting the focus from the emergency manager to citizen characteristics, still
only two significant correlations emerged. County-level gender (percent female citizens) and
employment (percent retired citizens) were significantly correlated to perceptions of citizen
preparedness but not risk awareness. In sum, the exploratory research questions in this study
were generally answered in the negative.
Two hypotheses were tested in this study. Both dealt with how emergency managers
were expected to formulate perceptions of their jurisdictions in the face of uncertainty or lack of
information to confirm their perceptions. The hypotheses are the False Consensus Hypothesis
and the Availability Hypothesis. The False Consensus Hypothesis predicts that emergency
managers’ self-reports of their own risk awareness level and preparedness level will correlate
positively with emergency managers’ perceptions of their county’s risk awareness level and
preparedness level, respectively. The Availability Hypothesis predicts that emergency
managers’ perceptions of their friends and family’s risk awareness level and preparedness level
will correlate positively with emergency managers’ perceptions of their county’s risk awareness
and preparedness level, respectively. The multiple regression analysis shows that the Availability
Hypothesis is supported and the False Consensus Hypothesis is not. The analysis revealed
exceptionally high impacts of perceptions of friends and family preparedness and risk awareness
levels on perceptions of citizen preparedness and risk awareness. The models for citizen
preparedness and citizen risk awareness were significant with substantial R2 values (66%, citizen
preparedness; 24%, citizen risk awareness). Thus, the Availability Hypothesis is supported
across two perceptual phenomena, preparedness and risk awareness, with perceptions of ones’
friends’ and family’s behavior as the most important predictor of both perceptual phenomena.

53
Availability Heuristic
Because there is no prior research exploring cognitive heuristics utilized by emergency
managers when forming perceptions of citizen preparedness or risk awareness, it was prudent to
start this exploration with a very commonly used heuristic, the availability heuristic. As stated
by Tversky and Kahneman (1973) “a person is said to employ the availability heuristic
whenever he estimates frequency or probability by the ease with which instances or associations
could be brought to mind” (pg. 208). In other words, individuals base their own perceptions of
others behavior, its frequency or probability, on their ability to recall instances when the
behavior was previously seen, for example, in their own social circle. These perceptions would
then be used to describe the behaviors of an unknown group. Previous research conducted by
Folkes (1988), on how consumers perceive risks of product failure states that “consumers may
estimate product failure by determining how easy it is to recall such incidents. When retrieval
seems easy, the event will be judged probable; when retrieval seems difficult, the event will be
judged improbable” (pg. 13). The present research worked to see if the same cognitive bias
could be applied to the way emergency managers view citizen preparedness and risk awareness
in their jurisdictions. To make that determination it was necessary to see if emergency managers
were basing their perceptions of citizen preparedness, an outside group where the actual level of
preparedness is likely to be an undetermined quantity, on their perceptions of the behaviors of
emergency managers’ acquaintances, an in-group where behaviors are likely to be much easier to
recall.
It was predicted that the results of the study would indeed indicate that emergency
managers are basing their perceptions of citizen preparedness and risk awareness on the
behaviors of their acquaintances (friends and family) because the behaviors of acquaintances

54
would be much easier to recall than those of the general public. The results suggest that the
availability heuristic plays a significant role in the way emergency managers form their
perceptions of both citizen preparedness and risk awareness.
The support for the availability hypothesis in this study sends a warning message to
professionals who are placed in the role of making judgments about the frequency or likelihood
of an event or behavior in uncertain situations. Such judgments are not automatically incorrect.
It may be that the level of preparedness, in the case of emergency management, is the same for
citizens as for the emergency manager’s acquaintances. However, the concern is the possibility
that the source of the data being used to make such a judgment (i.e., behaviors of friends and
acquaintances rather than the general public) is either unrecognized by the professional as the
source of his or her perceptions and possibly incorrect as a prediction of how prepared the
general public is.
False Consensus Effect
Another heuristic that was examined in this study that was speculated to play a role in the
formation of an emergency manager’s perception of citizen preparedness and risk awareness was
the false consensus effect. In a broad sense, the false consensus effect is described by Ross,
Green, and House (1977) as the tendency for individuals to perceive “their own behavioral
choices and judgments are relatively common and appropriate to existing circumstances while
viewing alternative responses as uncommon, deviant, or inappropriate” (p. 280). In other words,
individuals tend to perceive the behaviors of others to be similar to their own.
It was predicted that the results of the study would support the False Consensus
Hypothesis. The expectation was that there would be correlation between emergency managers’
self-reports of preparedness or risk awareness and the managers’ perceptions of their citizens’
55
preparedness or risk awareness, respectively. However this Hypothesis also implies a correlation
between emergency managers’ self-perceptions and managers’ perceptions of their friends and
acquaintances. In fact, Dawes’ research (1989) would lead us to expect an even stronger
correlation for the latter as opposed to the former relationship. The results offered no support for
these expectations. Thus, the results of the data suggest that the false consensus effect does not
play a significant role in the way emergency managers form their perceptions of both citizen
preparedness and risk awareness.
It is interesting to speculate that there may be an integrative explanation for why the
Availability Hypothesis worked and the False Consensus Hypothesis did not. The integrative
notion is to suggest that the emergency manager’s fundamental viewpoint of his or her county’s
residents is as an outsider or a uniquely trained individual that should be expected to see the
world differently than others do. Support for the Availability Hypothesis makes sense from this
perspective because the support shows that the emergency manager sees both their
friends/acquaintances and the rest of the county’s residents as similar to each other, that is, both
groups are “outsider” to the emergency manager’s world so that information on one group
(acquaintances) generalizes in the emergency manager’s mind to the other groups. Similarly, the
lack of support for the False Consensus Hypothesis is consistent with the emergency manager
seeing himself or herself as an outsider and dissimilar to all the others (i.e., both friends and
family, and citizens). The emergency manager does not see his or her own experience as
applicable to “outsiders” whether friends, acquaintances or the general citizenry. It may be that
the False Consensus Hypothesis is only predictive when the person perceives others and
themselves as part of the same in-group. This interpretation is consistent with Dawes’ (1989)
speculation about the false consensus effect. Dawes (1989) argued that the false consensus effect
56
is most likely to work if there is “a positive correlation across subjects (within items) between
their own endorsements of a behavior or attitude item and their estimates of the endorsement
frequency in a specified group of which they are a member” (italics added) (pg. 1). Thus,
according to Dawes (1989) the false consensus effect would be unlikely to apply to a situation
where the perceiver is an expert and both friends and family and citizens are outgroup, non-
experts. In contrast, the emergency manager may feel comfortable (at least subconsciously) in
using his/her own available group (i.e. friends and family) to predict behavior of another less
available outside group, the citizens, thus supporting the prediction of the Availability
Hypothesis.
Further Research
This study opens the door for much additional research on the role of cognitive heuristics
in the many important decisions an emergency manager makes. For example, the optimism bias
(DeJoy, 1989; McKenna, 1993;Weinsten, 1908) could be causing an over estimation of
preparedness or risk awareness based on emergency managers’ desire to see well prepared
citizens, especially after working with citizen groups on preparedness. A related bias, the
confirmation bias (Koslwski & Mariano, 1993; Mynatt, Doherty, & Tweney, 1977; Nickerson,
1998), could be a factor if the initial expectations or beliefs of the emergency managers are
affecting their subsequent perceptions. Group attribution error is another possibility. The effects
of this bias could cause an emergency manager to believe that the characteristics of one
individual or group are reflective of an entire group or community, even when there is
information that suggests that the perception is incorrect (Allison & Messick, 1985; Jellison &
Green, 1981; Mackie & Allison, 1987).
57
All of the above heuristics have in common the use of cognitive shortcuts to evaluate
one’s environment and such shortcuts are most likely to be used precisely in the kinds of settings
that can face emergency managers—settings where information is limited, where a quick
decision is needed, or where both conditions exist (e.g., in a disaster setting). This study just
scratches the surface of what still needs to be done in applying cognitive heuristics to decision-
making in emergency management.
More narrowly, there are several avenues for future research to pursue focusing just on
the availability heuristic. These include both methodological refinements (the first three
suggestions below) and theoretical expansions on this study (the final suggestion). First, future
research could expand the population studied. This study only included a census of county
emergency managers in the state of Minnesota, thus the results of this study are not
generalizable. While there is no apparent reason to suspect that cognitive heuristics would
operate differently for emergency mangers from other areas and/or countries that possibility
needs to be explored, especially considering how strong of correlations the significance testing
revealed.
Second, future research could expand the list of dependent variables to be studied from
perceptions of county-level citizens’ preparedness and risk awareness to include measures of
perceptual accuracy. This study focused on factors affecting emergency managers’ perceptions
in an effort to understand the extent to which these perceptions are affected by the use of
cognitive heuristics. This is the appropriate focus for a study of cognitive heuristics, but it leaves
an important question unanswered. No effort was made to directly determine whether the
measured perceptions ultimately were accurate or not. The use of cognitive shortcuts clearly
increases the likelihood of inaccurate perceptions although poor decision-making does not

58
automatically lead to poor decisions. Additionally, this study did not make an effort to determine
how much exposure emergency managers have had to the FEMA preparedness survey
information and/or additional research on citizen preparedness. Increased exposure and
knowledge of citizen preparedness may also have the ability to impact the accuracy of
perceptions. However, this study has documented that the availability heuristic significantly
impacts perceptions, so the next logical step is to determine the extent to which the accuracy of
these perceptions are negatively affected.
Such a study will not be easy. It will require the collection of data from random samples
of citizens and from emergency managers’ friends and acquaintances. In addition, a focus on
accuracy should include a study of predictors which did not play a role in this study’s analysis of
perceptions (e.g., factors such as an emergency managers’ knowledge of relevant research).
There is undeniably a wealth of knowledge that could be revealed from exploring this topic
further, but the logistics of such a task may drastically impede the process.
Third, future research should include more sophisticated measures of citizen
preparedness. As noted earlier, the measure used in this study is one of the more popular
measures in the literature, but the preparedness literature contains inconsistent information
(Andrews, 2001; Kapucu, 2008; Perman, Shoaf, Kourouyan, & Kelly, 2011; Tierney, Lindell, &
Sutton, 2001; Tierney & Sutton, 2006). Better measures of risk awareness would be of value as
well.
Fourth, this study has focused on only one aspect of emergency management, estimating
population characteristics within an emergency manager’s jurisdiction. Cognitive heuristics can
play a role in many other aspects of the emergency manager’s role including one area of
particular concern. As noted above, shortcuts are especially likely to be used when making

59
decisions under stress and these conditions certainly exist during disasters. Many decisions have
to be made often with little data, and it is in such situations of high pressure and great uncertainty
that decisions may be more a product of cognitive heuristics than of rational analysis. Future
research should explore the role of cognitive heuristics in such settings, the consequences of
using such heuristics, and how to avoid possible negative consequences of their use.
Finally, a substantive expansion of this study would be to study the role of other
cognitive heuristics in emergency managers’ perceptions and decision-making. As noted above,
many other cognitive heuristics may contribute to the judgments emergency managers have to
make but further research is needed to make that determination. In addition, research should
explore factors that increase or decrease emergency managers’ reliance on any one or more of
these heuristics.
The above suggestions focus on cognitive heuristics and emergency management.
However, several articles were citied earlier about the role of cognitive heuristics in other fields,
such as medicine, where professionals make very important decisions in the face of uncertainty
(e.g. in an emergency room). Surprisingly, most of these articles simply state the likely
relevance of cognitive heuristics in the decision making of these professional groups but provide
little or no relevant data other than anecdotal examples. This study, albeit modest in scope and
sample size, appears to be one of the first to actually demonstrate the role and importance of
cognitive heuristics in the context of one’s professional responsibilities. It can be painful to have
one’s perceptions and/or decisions as a professional critiqued as non-rational, but it is better to
understand this is a predictable event than to ignore it regardless of one’s profession. Hopefully,
this study will trigger more direct research on cognitive heuristics in professional decision-
making not only in emergency management but other professions as well.

60
REFERENCES
Alicke, M., & Largo, E. (1995). The role of self in the false consensus effect. Journal of
Experimental Social Psychology, 31(1), 28-47.
Allison, S., & Messick, D. (1985). The group attribution error. Journal of Experimental Social
Psychology, 21(6), 563-579.
Andrews, J. A. (2001). Safe in the 'hood: Earthquake preparedness measures in mid-city Los
Angeles. Natural Hazards Review, 2(1), 1-11.
Berger, A., Kousky, C. & Zeckhauser, R. (2008). Obstacles to clear thinking about natural
disasters: Five lessons for policy. In Quigley, J. & Rosenthal, L. (Eds.), Risking House
and Home: Disasters, Cities, Public Policy (pp. 73-94). Berkeley, CA: Berkeley Public
Policy Press.
Brilly, M. & Polic, M. (2005). Public perception of flood risk, flood forecasting and mitigation.
Natural Hazards and Earth System Sciences, 5, 345-355.
Croskerry, P. (2002). Achieving quality in clinical decision making: Cognitive strategies and
detection of bias. Academic Emergency Medicine, 9(11), 1184-1204.
Croskerry, P. (2003). The importance of cognitive errors in diagnosis and strategies to minimize
them. Academic Medicine, 78(8), 775-780.
Croskerry, P. (2005). The theory and practice of clinical decision making. Canadian Journal of
Anesthesia, 52(1), R1-R8.
Dawes, R. (1989). Statistical criteria for establishing a truly false consensus effect. Journal of
Experimental Social Psychology, 25(1), 1-17.
DeJoy, D. (1989). The optimism bias and traffic accident risk perception. Accident Analysis &
Prevention, 21(4), 333-340.

61
Dillman, D. (2009). Internet, mail, and mixed-mode surveys: The tailored design method (3rd
ed.). Hoboken, New Jersey: John Wiley & Sons, Inc.
Donahue, A., Eckel, C. & Wilson, R. (2014). Ready or not? How citizens and public officials
perceive risk and preparedness. American Review of Public Administration, 44(4s), 89S-
111S.
Federal Emergency Management Agency. (2004). Are you ready?: An in-depth guide to citizen
preparedness. Washington, DC: Federal Emergency Management Agency, Department of
Homeland Security.
Federal Emergency Management Agency. (2014). Home: Ready.gov. Retrieved from
http://www.ready.gov
Federal Emergency Management Agency. (2009, December). Personal preparedness in
america: Findings from the 2009 citizen corps national survey. Retrieved from https://s3-
us-gov-west-1.amazonaws.com/dam-production/uploads/20130726-1859-25045-
2081/2009_citizen_corps_national_survey_findings___full_report.pdf
Finuacae, M., Alhakami, A., Slovic, P., & Johnson, S. (2000). The affect heuristic in judgments
of risks and benefits. Journal of Behavioral Decision Making, 13(1), 1-17.
Folkes, V. (1988). The availability heuristic and perceived risk. Journal of Consumer Research,
15(1), 13-23.
Gilovich, T. (1990). Differential construal and the false consensus effect. Journal of Personality
and Social Psychology, 59(4), 623-634.
Greene, E. & Ellis, L. (2007). Decision making in criminal justice. In Carson, D., Milne, B.,
Pakes, F., Shalev, K. & Shawyer, A. (Eds.), Applying psychology to criminal justice
(pp.183-200). West Sussex, England: John Wiley & Sons.

62
Groopman, Jerome (2007). How doctors think. Boston: Houghton Mifflin.
Grothmann, T., & Reusswig, F., (2006). People at risk of flooding: Why some residents take
precautionary action while others do not. Natural Hazards, 38, 101-120.
Jellison, J., & Green, J. (1981). A self-presentation approach to the fundamental attribution error:
The norm of internality. Journal of Personality and Social Psychology, 40(4), 643-649.
Johnson, E., & Tversky, A. (1983). Affect, generalization, and the perception of risk. Journal of
Personality and Social Psychology, 45(1), 20-31.
Kapucu, Naim (2008). Culture of preparedness: Household disaster preparedness. Disaster
Prevention and Management, 17(4), 526-535.
Keller, C., Siegrist, M., & Gutscher, H. (2006). The role of the affect and availability heuristics
in risk communication. Risk Analysis, 26(3), 631-639.
Kirschenbaum, A. (2005). Preparing for the inevitable: Environmental risk perceptions and
disaster preparedness. International Journal of Mass Emergencies and Disasters, 23(2),
97-127.
Koslowski, B, & Maqueda, M. (1993). What is confirmation bias and when do people actually
have it?. Merrill-Palmer Quarterly, 39(1), 104-130.
Krueger, J., & Clement, R. (1994). The truly false consensus effect: An ineradicable and
egocentric bias in social perception. Journal of Personality and Social Psychology, 67(4),
596-610.
Lindell, M. & Hwang, S. (2008). Households’ perceived personal risk and response in a
multihazard environment. Risk Analysis, 28(2), 539-556.
Lindell, M. & Whitney, D. (2000). Correlates of household seismic hazard adjustment adoption.
Risk Analysis, 20(1), 13-25.

63
Mackie, D., & Allsion, S. (1987). Group attribution errors and the illusion of group attitude
change. Journal of Experimental Social Psychology, 23(6), 460-480.
MacLeod, C., & Campbell, L. (1992). Memory accessibility and probability judgements: An
experimental evaluation of the availability heuristic. Journal of Personality and Social
Psychology, 63(6), 890-902.
McClure, J., Doyle, E. & Velluppillai, J. (2014). A tale of two cities: Judgements about
earthquake and aftershock probabilities across time windows. International Journal of
Disaster Risk Reduction. Retrieved from: http://dx.doi.org/10.1016/j.ijdrr.2014.11.010.
McKenna, F. (1993). It won’t happen to me: Unrealistic optimism or illusion of control?. British
Journal of Psychology, 84(1), 39-50.
Miceli, R., Sotgiu, I., Settanni, M. (2007). Disaster preparedness and perception of flood risk: A
study in an alpine valley in Italy. Journal of Environmental Psychology, 28, 164- 173.
Mishar, S., & Suar, D. (2007). Do lessons people learn determine disaster cognition and
preparedness. Psychology and Developing Societies, 19 (2), 143-159.
Mynatt, C., Doherty, M., & Tweney, R. (1977). Confirmation bias in a simulated research
environment: An experimental study of scientific inference. Quarterly Journal of
Experimental Psychology, 29(1), 85-95.
Nickerson, R. (1998). Confirmation bias: A ubiquitous phenomenon in many guises. Review of
General Psychology, 2(2), 175-220.
North Dakota State Data Center. (2007, September). Environmental health survey for central
and western Minnesota: June 2007 survey results. Retrieved from https://www.ndsu.edu
/sdc/publications/reports/EightCountyEnvHealth_FINALREPORT.pdf

64
Paton, D. (2003). Disaster preparedness: A social-cognitive perspective. Disaster Prevention and
Management, 12(3), 210-216.
Paton, D., McClure, J., & Burgelt, P. (2006). Natural hazard resilience: The role of individual
and household preparedness. In Disaster Resilience: An integrated approach (pp. 105-
127). Springfield, Illinois: Charles C Thomas.
Perman, J., Shoaf, K., Kourouyan, A., Kelly, M. (2011). Disaster kit contents: A comparison of
published guidelines for household preparedness supplies. International Journal of Mass
Emergencies and Disasters, 29(1), 1-25.
Pidot, Justin R. (2012). Deconstructing Disaster. 2013 Brigham Young University Law Review
213 (2013); U Denver Legal Studies Research Paper No. 12-43.
Redelmeier, D. (2005). The cognitive psychology of missed diagnoses. Improving Patient Care,
142(2), 115-120.
Richard Eiser, J., Bostrom, A, Burton, I., Johnston, D., McClure, J., Paton, D., van der Pligt, J.,
& White, M. (2012). Risk interpretation and action: A conceptual framework for
response to natural hazards. International Journal of Disaster Risk Reduction, 1(2012), 5-
16.
Ross, L., Greene, D., & House, P. (1977). The “false consensus effect”: An egocentric bias in
social perception and attribution processes. Journal of Experimental Social Psychology,
13(3), 279-301.
Rothman, A. (1997). Differential use of the availability heuristic in social judgment. Personality
and Social Psychological Bulletin, 23(2), 123-138.

65
Schwarz, N., Bless, H., Strack, F., Klumpp, G., Rittenauer-Schatka, H., & Simons, A. (1991).
Ease of retrieval as information: Another look at the availability heuristic. Journal of
Personality and Social Psychology, 61(2), 195-202.
Schwarz, N. & Vaughn, L. (2002). The availability heuristic revisited: Ease of recall and content
of recall as distinct sources of information. In Gliovich, T., Griffin, D., & Kahneman, D.
(Eds.), Heuristics and biases: The psychology of intuitive judgement (pp. 103-119). New
York, NY: Cambridge University Press.
Siegrist, M., Gutscher, H. (2006). Flooding risks: A comparison of lay people’s perceptions and
expert’s assessments in Switzerland. Risk Analysis, 26(4), 971-979.
Sutton, J., & Tierney, K. (2006, November). Disaster preparedness: Concepts, guidance, and
research. Paper presented at Fritz institute assessing disaster preparedness conference,
Sebastopol, California. Retrieved from http://
www.fritzinstitue.org/PDFs/WhitePaper/DisasterPreparedness-Concepts.pdf
Tierney, K., Lindell, M., Perry, R. (2001). Facing the unexpected: Disaster preparedness and
response in the united states. Washington, DC: Joseph Henry Press.
Tversky, A. & Kanenham, D. (1973). Availability: A heuristic for judging frequency and
probability. Cognitive psychology 5(1), 207-233.
Uscher-Pines, L., Chandra, A., Acosta, J., & Kellermann, A. (2012). Citizen preparedness for
disasters: Are current assumptions valid? Disaster Medicine and Public Health
Preparedness, 6(2), 170-173.
Weinstein, N. (1980). Unrealistic optimism about future life events. Journal of Personality and
Social Psychology, 39(5), 806-820.
66
APPENDIX A. IRB APPROVAL LETTER

67
APPENDIX B. INFORMATION SHEET
An Exploratory Study of Minnesota Emergency Managers’ Perceptions of Citizen Preparedness
Information Sheet
Research Study:
You are being invited to participate in an electronic survey for an exploratory study of Minnesota
emergency managers’ perceptions of citizen preparedness.
This study is being conducted under the auspices of the Emergency Management Program at
North Dakota State University. The actual survey process will be conducted electronically and
the data collected will be analyzed to fulfill the thesis research requirement of a graduate student
in Emergency Management at North Dakota State University.
Purpose of Study:
The purpose of this research study is to determine the perceived level of citizen preparedness by
county emergency managers and how that perception is the same or differs from the real-life
citizen preparedness. Additionally, factors that may influence an emergency managers’
perception of citizen preparedness will be explored.
Basis for Participant Selection:
You have been invited to participate in this research project because you are a county emergency
manager in Minnesota.
Explanation of Procedures:
Should you choose to participate in this study you may complete the survey at anytime by
following the URL link in the invitation email. Multiple pretests of the survey with county
emergency managers outside Minnesota have found that the survey will take 10-15 minutes at
most. Upon request, the final results of the study can be provided.

68
Potential Risks and Discomforts:
There should be no potential discomfort or physical, social, psychological, legal or economic risk
to you due to your participation in this study.
Potential Benefits:
At this time, the available research literature is inconclusive as to the level of accuracy
emergency management professionals have when assessing citizen preparedness and what
factors may affect their level of accuracy. It is the intent of this study to be able to make general
conclusions as to why county emergency managers feel their citizens may be more or less
prepared than the average citizen. These conclusions will be based on a myriad of facets
including: perceptions of citizen risk awareness and preparedness, perceptions of the
preparedness of friends and family, county characteristics, emergency manager characteristics,
workplace capacity and effort to promote preparedness. These conclusions will assist in creating
a broad understanding of how citizen preparedness is perceived by the professionals who are
tasked with ensuring its continuing advancement.
Assurance of Confidentiality:
All survey data will be kept confidential. During the data analysis process any identifiable
characteristics of a participant, both personal and geographic, that could be linked to an
individual will be removed. Each participant’s personal information will be kept confidential and
will not be used in the reports that may be written from this research project.
Voluntary Participation and Withdrawal from the Study:
Your participation in this study is entirely voluntary and you may withdraw at any time. Your
decision whether or not to participate will not affect your present or future relationship with

69
North Dakota State University or any of its affiliates. If you choose to participate, you are free to
withdraw your consent and terminate your participation at any time.
Offer to Answer Questions:
If you have questions about this research project, please feel free to contact me: Breanna Koval
at (701)388-7412 or [email protected] or my research advisor: Dr. George Youngs at
(701)231-8941 or [email protected]. If you have any question about the rights of
human research participants, or wish to report a research-related grievance, contact the North
Dakota State University Institutional Review Board Office at (701)231-8908 or

70
APPENDIX C. SURVEY INVITATION LETTER
[Insert Date]
Dear [insert participant name here],
My name is Breanna Koval. I am the emergency management director for Wilkin
County, MN and am also completing graduate work at North Dakota State University. I am
contacting you to ask for your help in a study of citizen preparedness. The study is an
exploratory study of Minnesota emergency managers’ perceptions of citizen preparedness. This
study will help to understand how we as emergency managers perceive the preparedness of
citizens in our jurisdictions.
I am contacting all county emergency management directors in the state of Minnesota to
explore this topic.
At this at time, the available research says very little about how our perceptions of
preparedness match actual preparedness levels especially for areas as large as counties. This
study will assist in creating a broad understanding of how citizen preparedness is perceived by
the professionals who are tasked with ensuring its continuing advancement.
Your answers to this survey will be kept confidential and will be released only as
summarized data in which no individual’s data can be identified. Each participant’s personal
information will be kept confidential and will not be used in any reports. Although your
participation in this survey is voluntary, your assistance would be greatly appreciated.
In about two weeks you will receive an email containing the link to the survey. Multiple
pretests of the survey with county emergency managers outside of Minnesota have found that the
survey will take 10-15 minutes to complete at most. If desired, the final results of the study can
be provided.

71
If you have any questions about this study feel free to contact us: [email protected] or
(701)388-7412 and Dr. George Youngs at [email protected] or (701)231-8941.
I would like to thank you in advance for your participation in this research project.
Sincerely,
Breanna Koval
Emergency Management Program
North Dakota State University
72
APPENDIX D. SURVEY INVITATION EMAIL
[Insert Date]
Dear [insert participant name here],
Two weeks ago I sent you a letter asking for your help in a study of how we as county
emergency management directors perceive citizen preparedness. This study will help to
understand how county emergency managers perceive the preparedness of the citizens in their
jurisdiction and what factors may affect perceptions.
Thus, I am contacting all county emergency managers in the state of Minnesota to gather
a substantial number of participants. The data will assist in creating a broad understanding of
how citizen preparedness is perceived by the professionals who are tasked with ensuring its
continuing advancement.
Your answers to this survey will be kept confidential and will be released only as
summarized data in which no individual’s data can be identified. Each participant’s personal
information will be kept confidential and will not be used in the reports that may be written from
this research. Although your participation in this survey is voluntary, your assistance would be
greatly appreciated.
It is my hope that you will complete the survey and assist in this research project. As
noted in my earlier letter to you, multiple pretests of the survey with county emergency managers
outside of Minnesota have found that the survey will take 10-15 minutes to complete at most. If
you would like to participate, please complete the survey by [insert completion date].
Please access the survey at:[insert link here] Thank you!
If you have any questions about this study feel free to contact us: [email protected] or
(701)388-7412 and Dr. George Youngs at [email protected] or (701)231-8941.

73
I would like to thank you in advance for your participation in this research project.
Sincerely,
Breanna Koval
Emergency Management Program
North Dakota State University
74
APPENDIX E. SURVEY

75

76
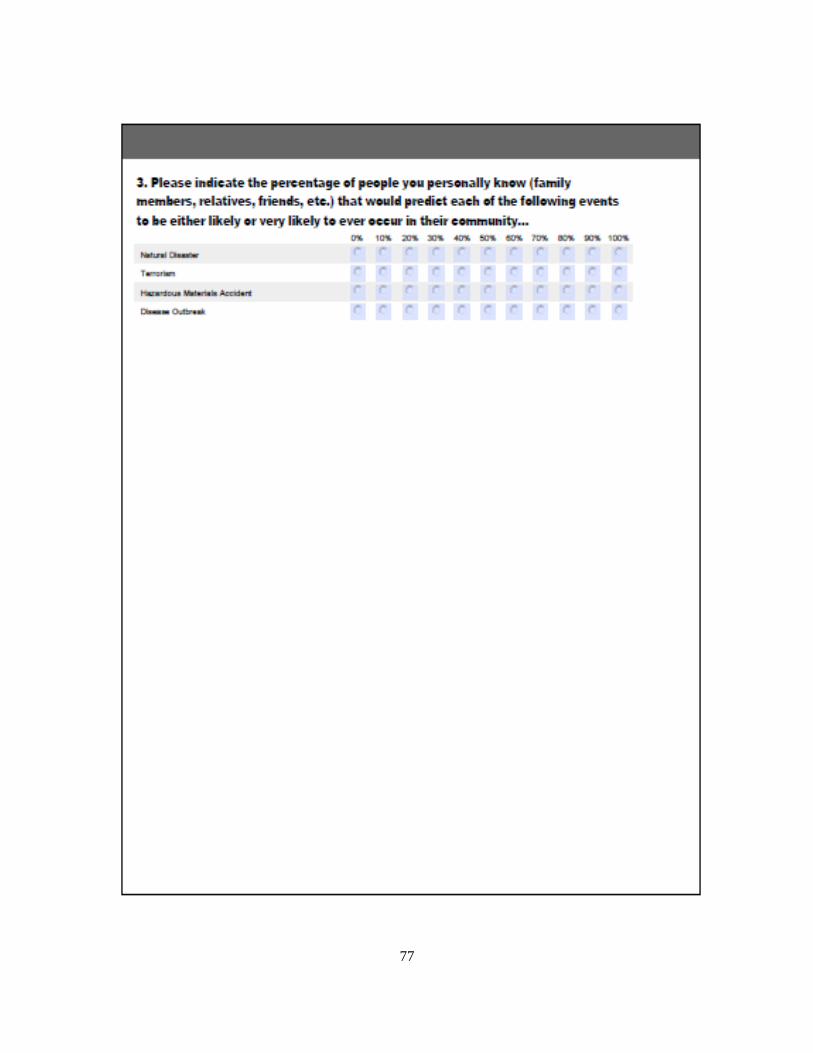
77

78

79
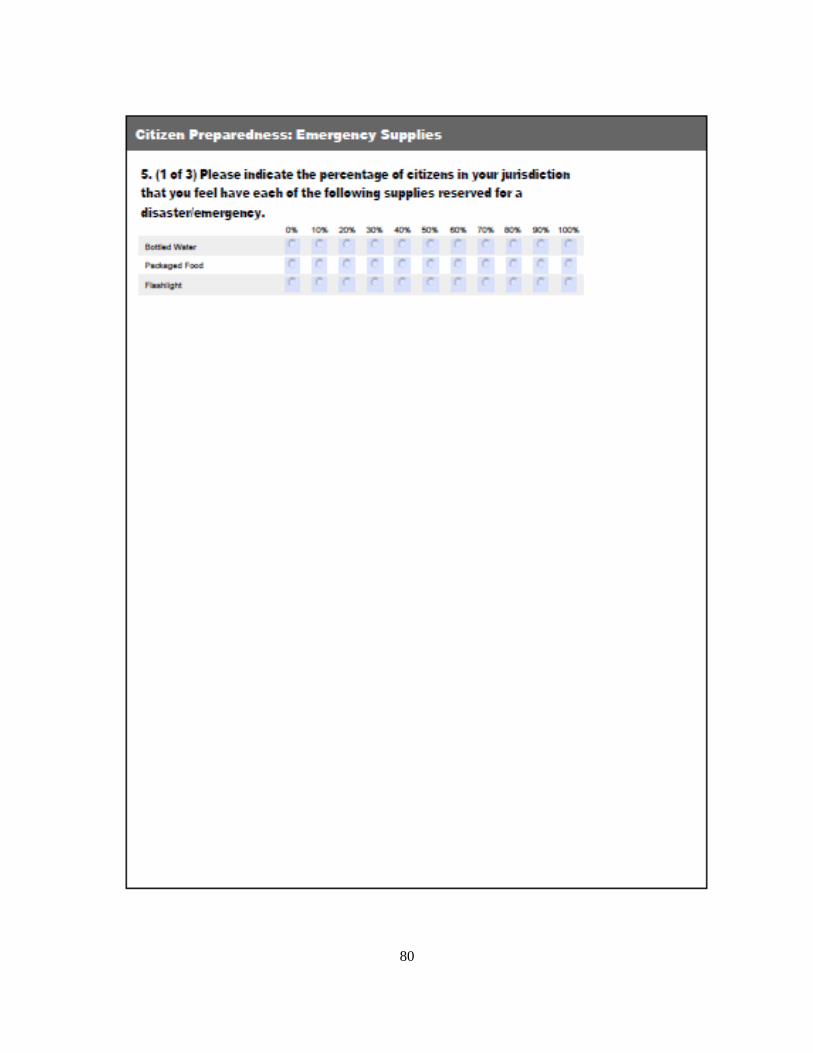
80

81

82

83

84

85
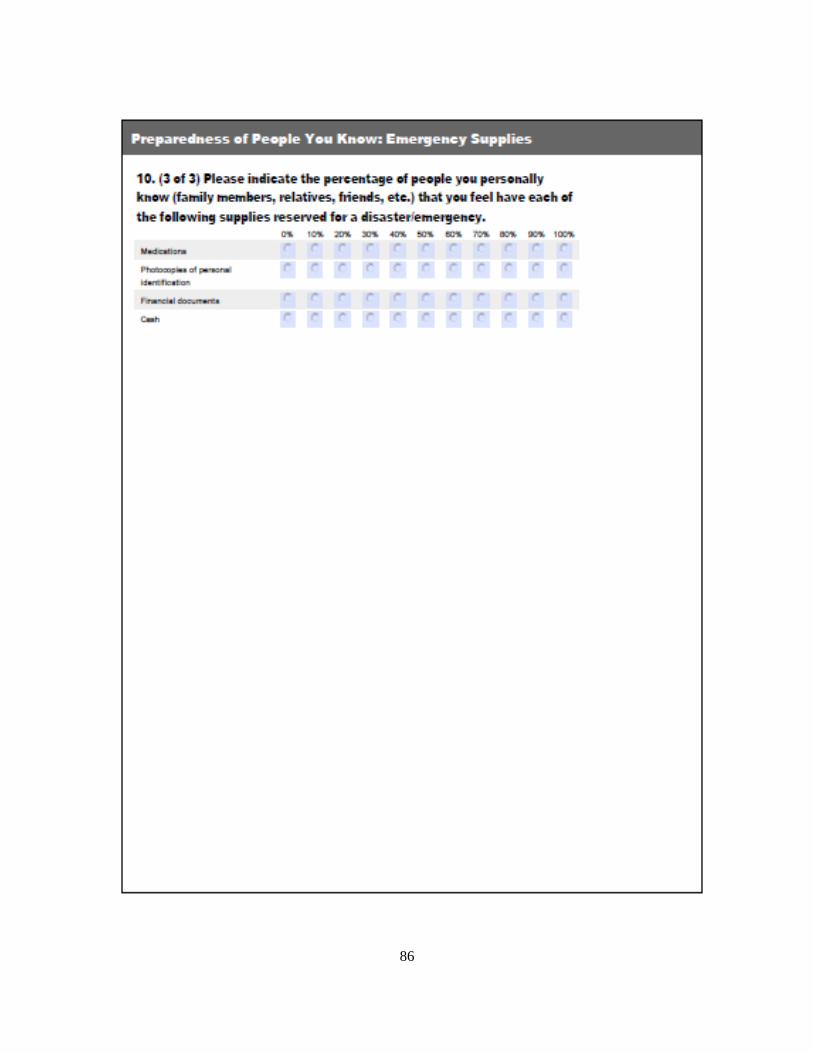
86
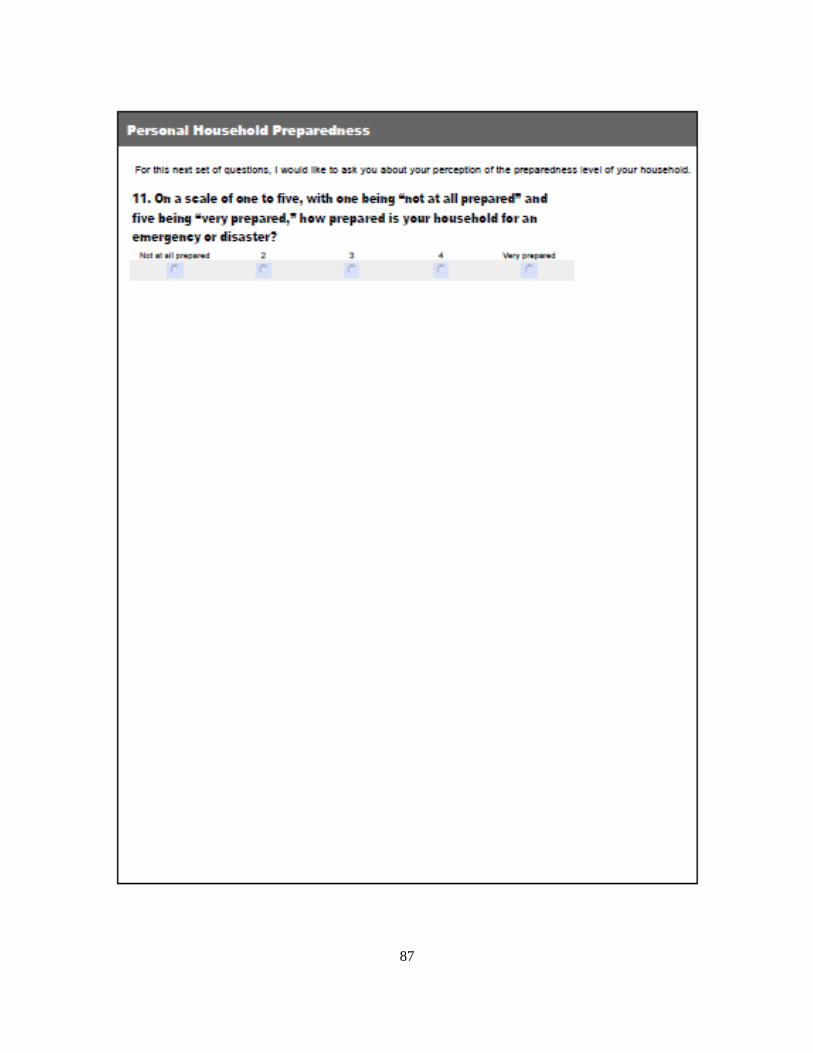
87
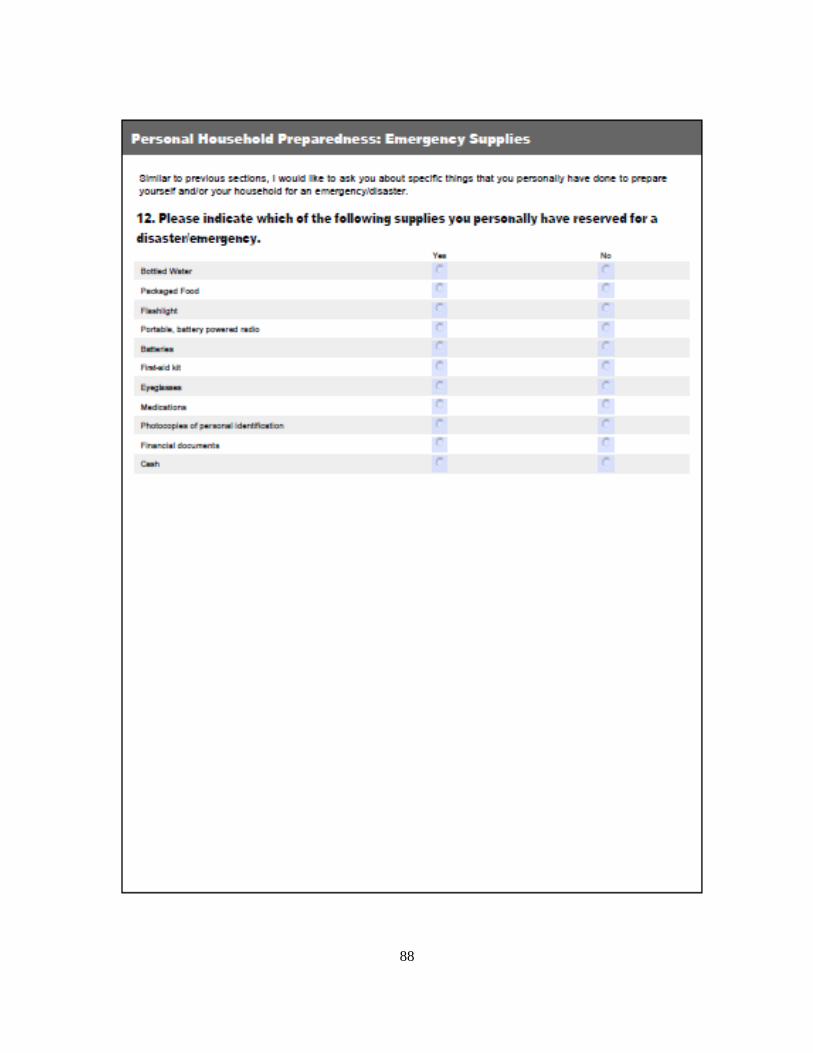
88

89
90

91

92
93

94

95
96
97

98
APPENDIX F. SURVEY FOLLOW-UP EMAIL
March 24th
, 2014
Dear [insert participant name here],
Last week I sent you an email invitation to participate in a study of how we as county emergency
management directors perceive citizen preparedness.
If you have already completed the survey, please accept my sincere thanks. If not, please do so
today. I am especially grateful for your help because it is only by asking people like you to share
your thoughts that we can understand how emergency managers view preparedness at the local
level.
If you did not receive the survey link, or if you misplaced the link here it is:
https://www.surveymonkey.com/s/mnemergency
Sincerely,
Breanna Koval
Emergency Management Program
North Dakota State University