
Managerial.pdf
94
Managerial economics Managerial Economics : Means to an end to managers in any business, in terms of finding the most efficient way of allocating scare organizational resources and reaching stated objectives
-
Upload
praba-karan -
Category
Documents
-
view
214 -
download
0
description
qqqqqqqqqqqqqqqqqqqqqwwwwwwwwwwwwwwwwweeeeeeeeeeeeeeeeerrrrrrrrrrrrrrrrrrtttttttttttttttttttyyyyyyyyyyyyyffffffffffffffffffffffffffffffffffffffffffffffffffffffffffffffffffffffffffffffffffffffffffffffggggggggggggggggggggggggggggggggggggggggggggggggggffffffffffffffffffffffffffffffffffffffffffffggggggggggggggggvvvvvvvvvvvvvvvvvvvvvvvvvvvvvvfffffffffffffffffffffffffggggggggggggggggggggggggggggggggggggggggggffffffffffffffffffffffffffffffggggggggggggggggggggggvvvvvvvvvvvvvvvvvvvvvvvvvvvvvvvvvvvvvvvvvvvvvvvvvvvvvvvvvvvvvvvvvvvvvvvvvvvvffffffffffffffffffffgggggggggggggggggggggggggggggggggggggggfffffffffffffffffffffffffffffffffffffffffffffffffffffffffffgggggggggggggggggggggggggggggggggggffffffghhhhhhhhhhhhhhhhhhjjjjjjjjjjjjjjjjjjjjjjkkkkkkkkkkkkkkkkkkkkkkkkkkkkkkkkkkkk,mmmmmmmmmmmmmmmmmmmmmmmmbbbbbbbbbbbbbbbbbbbhhhhhhhhhhhhhhhhhhhjjjjjjjjjjjjjjjjjuuuuuuuuuuuuuuuuuyyyyyyyywwwwwwwwwwwwwwwwwwwwwwwwwwwwwwwwwwwwwwwwwwwwwwwwwwwwwweeeeeeeeeeeeeeeeeeeeeeeeeeeee
Transcript of Managerial.pdf

Managerial economics Managerial Economics: Means to an end to managers in any business, in
terms of finding the most efficient way of allocating scare organizational
resources and reaching stated objectives

• Economics is defined as a body of knowledge or study that discuses how a society tries to solve the human problems of unlimited wants and scare resources.

• It is based on the economic analysis for identifying problems, organizing information and evaluating alternatives.

DEFINITIONS OF MANAGERIAL ECONOMICS
• “Managerial economics is the economic modes of thought to analyse business situation”
• -Mc.Nair and Meriam

• Nature and Scope of Economics:• Some six main scope of economics are:• Demand Analysis and Forecasting • Cost Analysis• Production and Supply Analysis• Pricing decisions, Policies and procedures• Profit management• Capital Management
SIGNIFICANCE OF MANAGERIAL ECONOMICS
• It helps in decision making• Decision making means a balance
between simplification of analysis to be manageable and complication of factors in hand

• It helps the manager to become an more competent builder
• It helps in providing most of the concepts that are needed for the analysis of business problems,the concepts such as elasticity of demand ,fixed, variable cost, SR and LR costs (short run and long run cost), opportunity costs,NPV etc.,
• It helps in making decisions.

ROLE OF MANAGERIAL ECONOMIST IN BUSINESS
• Task of making Specific decisions• Task of making General decisions

• Specific decisions include • • Production scheduling• Demand forecasting• Market research• Economic analysis of the industry• Investment appraisal

• Security management appraisal• Advice on trade• Advice on foreign exchange management• Pricing and related decisions

• General decisions include• Analysing the general economic condition of
the economy• Analyzing the demand for the product• Analysing the general market condition of the
economy

• Goods:• Goods and services have to be produced with
the help of factors of production. So production is another important branch of economics.
• Goods produced by one are exchanged for the goods produced by the other. So exchange forms another important branch of economics. Goods and services are produced with efforts

Utility:
• It is the want satisfying power of a Commodity or a service, which determines the demand for commodity. Jevons called this as ‘Utility’
• Two main types of utility are Cardinal and Ordinal utility and Total and Marginal Utility.

Concepts of Total and Marginal Utility:
• Marginal utility is defined as the change in total utility resulting from one unit change in the consumption of the goods in question per unit of time. To put it shortly, total utility is the total satisfaction derived in consuming all the quantities of a commodity in possession or purchased. et

• Ex: Suppose consumer purchases a packet of biscuits. Total utility or satisfaction derived refers to the utilities of all biscuits in the packet. If all biscuits in the packet are alike, the marginal utility may be represented as follows, assuming there are ‘m’ units of biscuits in the pack

• Marginal utility = Total Utility of ‘M’ units of biscuits minus total utility of (m-1) units of biscuits. Suppose consumer ‘n’ units of oranges, the marginal utility are the difference between total utility of ‘n’ units and (n-1) units. In general, we can say that marginal utility is the difference between total utilities of ‘n’ units of a commodity and (n-1) units or (n+1) units of the commodity.

• Marginal utility is the rate of change of total utility caused by a small given change in the quantity of a commodity”.
• This can be expressed by using formula mathematically
• MUx = Dux • Dqx

• Where MUx is the marginal utility of a commodity X. Dux is the change in the total utility of X, Dqx stands for the change in the total quantity of X.

• Marginal Utility Analysis (Cardinal):• The principle behind the law of diminishing
marginal utility is that as wet more of a thing, the intensity of our desire for that thing diminishes or tends to diminish.

• Marginal Utility Analysis (Cardinal):• The principle behind the law of diminishing
marginal utility is that as wet more of a thing, the intensity of our desire for that thing diminishes or tends to diminish.

• According to this law, as a person purchases more and more units of a commodity, its marginal utility decreases. Prof. Boulding defines the law if diminishing marginal utility in the following words: “As a consumer increases the consumption of any one of the commodity keeping constant the consumption of all other commodities.

• Illustration of the Law:• Suppose a man is hungry, a loaf of bread will give him
immense pleasure as it has great utility for him. The second loaf though agreeable to him would not give him as much as the satisfaction as the first one. This means utility of the second loaf would be less than first loaf. If he consumes the third loaf, it would give him some satisfaction or but not extent of the previous loaf. So with the fourth, fifth, and sixth loves of bread goes on diminishing. This can well illustrated by using utility table.

Number of Products Marginal Utility Total Utility
1 20 20
2 16 36
3 12 48
4 8 56
5 4 60
6 0 60
7 -4 56
• From the utility table, it is clear that the total utility (sum of the utilities of all the units consumed) goes on increasing and after a certain state begins to decline. The marginal utility (addition made to the total utility) on the other hand goes on diminishing till it reaches zero and then it becomes negative. So long as the marginal utility is tending towards zero, the total utility is increasing and it is at the maximum when the marginal utility is zero and afterwards it declines.
• The relationship between total utility and marginal utility can be illustrated by means of a graph based on the utility table given.


• The successive units of the commodity consumed are represented in ‘X’ axis and utility in units are represented in ‘Y’ axis. With the help of the data available in the utility table, the total utility and marginal utility at various levels of consumption are pointed and then the total utility and marginal utility curve are drawn. As the figure shows, total utility curve ascends, reaches the maximum point at the fifth and sixth units of consumption and then begins to decline. Marginal utility declines and it comes to zero at the consumption of sixth unit and afterwards it becomes negative.

• Demand ;• • Defined as “a desire for a commodity backed by
willingness and ability to pay a price”. And is always relates to price. The desire for the commodity should be backed by necessary purchasing power. (Money). 3 types of demand are Recurring and Replacement demand, Direct and Derived demand, Complementary and Competing Demand

• Demand Schedule and Demand Curve:• • Demand schedule is the table for statement showing
how much of a commodity is demanded (Purchased) in a particular market at different prices.
• A demand schedule is one of the Alfred Marshall’s contributions to the techniques of price theory.
• A demand schedule that states relationship between Price and the quantity demanded.
• Statement showing the quantity demanded of a commodity is called “demand schedule of a commodity

Point on Demand Curve Price (Per Cup) Demand (1000 Cups)
a 15 50
b 20 40
c 25 30
d 30 15
e 35 10

• Demand Curve:• The demand curve shows the relationship
between price of a good and the quantity demanded by consumers.
• It is the graphical presentation of the demand schedule of any commodity. It is customary to plot the quantity demanded on the horizontal axis and the price on the vertical axis

• Elasticity of Demand:• States as direction of change. The
relationship between the small changes in price and consequent changes in amount demanded is known as elasticity of demand.
• States as the rate of change. The elasticity of demand shows the extent of response in demand to change in price.
• Price Elasticity of Demand:• Defines elasticity as the ratio of relative
change in quantity to a relative change in price. If E stands for elasticity, then
• E = Relative change in quantity• Relative change in price

• Price elasticity of demand is the ratio of proportionate change in quantity demanded of a commodity to a given proportionate change in its price. This means
• E = Proportionate change in quantity demanded • Proportionate change in price • E = Change in the quantity demanded /
• Quantity Demanded /Change in Price/
• Price

• Divided in to five main types:• Perfectly or Infinity elasticity Demand• Perfectly Inelastic Demand• Relatively Elasticity Demand• Relatively Inelasticity Demand• Unit elasticity Demand

• Perfectly or Infinite Elasticity of Demand: • This is a condition in which a very small
change in price will result in infinitely large response in the demand. A small rise in price may result in the contraction of demand even to zero and a small drop in price may result in extension of demand of unimaginable quantity. Hence the type of elasticity is called perfectly elastic or infinite demand. Where E = ∞


• Perfectly Inelastic Demand:• This is a case in which the response in
demand to change in price is almost nil. Even a large fall in price will not induce the quantity of demand to be more, nor will a large rise in price prevent the consumers from buying less. The demand is inert (Static) to the changes in price. In this case E = 0.


• The demand curve DD2 shows that a fixed quantity will be purchased whatever changes take place in price. The curve is vertical showing no change in quantity demanded.

• 3 Relatively elastic Demand:• This refers to a condition when a small change in
price will lead to very big change in the quantity demanded. In this case E > 1. Hence it is called elastic demand. And to be more precise, it is relatively a elastic demand. A small fall in price of luxury or comfort commodity will expand for that commodity largely. Similarly rise in price will contract the demand. The figure depicts the relative elastic nature of demand curve.


• M M1• The demand curve DD3 is rather
flatter where the slope is not steep, but gentle, showing that the quantities demanded are larger to a change in price. The drop in the from P to P1 has resulted in extension of demand from M to M1 which is comparatively larger than the fall in price. Hence the demand is said to be relatively elastic.

• 4. Relatively Inelastic Demand:• - This is with reference to situations where a larger
change in the quantity demanded. In this case E < 1. Hence it is called inelastic demand. Many commodities which are necessaries of life will have inelastic demand as they are essential requirements. In the case of inelastic demand, the demand curve will be steeper as shown in figure. The demand curve DD4 is steeper showing that in spite of steep fall in price the quantity demanded has gone up only very little. For a price change of P1P2 the quantity has changed from X1X2 which is smaller than P1P2.


• 5. Unit Elasticity Demand: • - This is a case in which the change in
price will result in exactly equal change in the quantity demanded. If both are equal then E = 1 and the elasticity is said to be unitary. The figure indicates the unit elasticity


• Factors Determining Elasticity and its Measurement and Significance:
• - Some 8 main factors influencing demand are • 1. Nature of Commodity• 2. Uses of Commodity• 3. Existence of Substitutes• 4. Postponement of Demand• 5. Amount of Money Spent• 6. Habits• 7. Range of Prices of Commodity 8. Time Factor in
Elasticity• 17

• Supply:• Prof: Mac Connel defines supply as “Supply is
the schedule which shows the various amounts of products which a producer is willing to and able produce and make available for safe in the market at each specific price in the set of possible prices during some given period.
• Supply depends on scarcity, just as demand depends on usefulness.
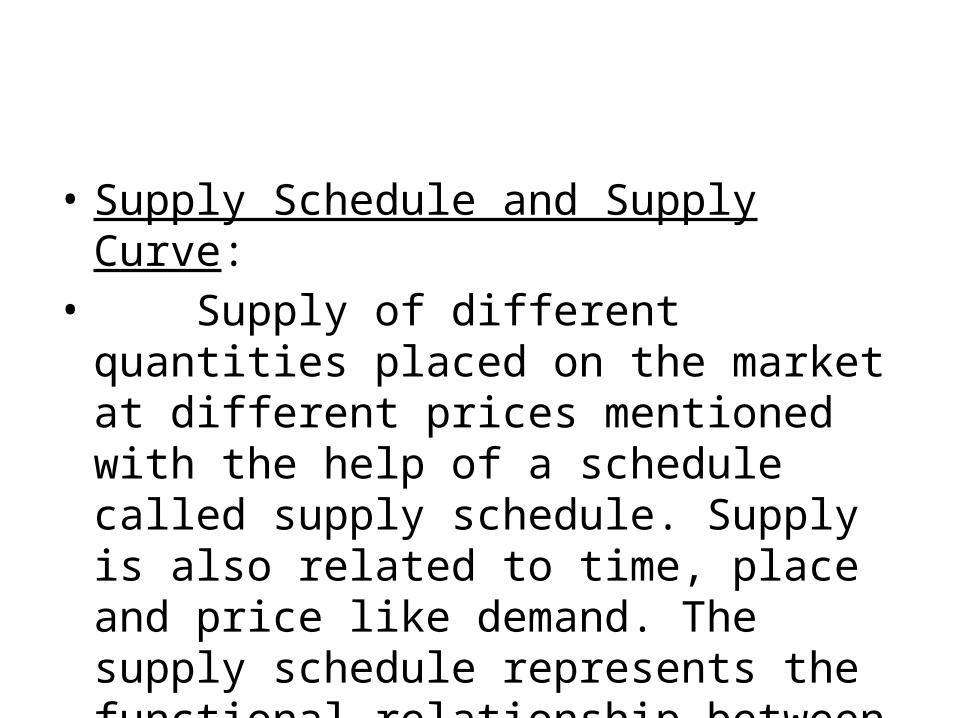
• Supply Schedule and Supply Curve:• Supply of different quantities placed on the
market at different prices mentioned with the help of a schedule called supply schedule. Supply is also related to time, place and price like demand. The supply schedule represents the functional relationship between he quantity supplied and the prices.

Price in Rs. Quantity supplied in Units
3 40
4 50
5 60
6 70
7 90

• 2. Supply Curve:• - On the basis of schedule given, we can
draw the supply curve taking quantities supplied on the X axis and price on the Y axis as shown in the figure.


• The supply curve SS slopes upwards from left to right showing larger supplies at a higher price.
• Perfect Competition:• Prof. Frank Knight defines as ‘ Perfect
competition as a condition of market in which there will be fluidly and mobility of factors of production so that the number of firms and the size of firms can freely increase or decrease.
• According to him perfect competition entails “ rational conduct on the part of buyers and sellers, full factors of production and completely static conditions”

• Features: 7 Main Features of perfect competition are
• Large no of Buyers and Sellers 2. Homogeneous Product 3. Free entry and exit barriers 4. Perfect Knowledge on the part of buyers and Sellers 5. Perfect mobility of Factors of Production 6. Absence of transport Cost 7. Absence of Governmental or Artificial Restriction.
• 24

• Monopoly:• Monopoly means absence of competition. It is
an extreme situation in imperfect competition. It denotes a single seller or producer having the control over the market.
• A monopoly can be defined as the condition of production in which a single person or a number of people acting in combination have the power to fix the price of the commodity or the output of the commodity.

• Should have some 4 main features: 1. It should have only single control 2. The commodity produced should not have any close substitutes. If it is so, then the monopoly power is lost as the people can choose the substitutes commodity produced
• Relation Between Economic Decision and Technical Decision:
• Economical Decision:• Economic Decision means financing the
project within approved design and environmental framework.
• Has an economic impact on Investment in excess, Opportunity cost of unused commodity, Cost of power capacity.

• Technical Decision:• Done by rural development by increasing
the opportunity and improving the quality. • Project Eligibility• Technical Requirements • Energy Audit

Types of Financing
• The three types of financial management decisions are capital budgeting, capital structure, and working capital.
Short Term and Long Term Borrowing:
• Short-term loans can be for periods as short as 90 days
• Long-term loans of greater than three years require a more detailed analysis the lending institution

• External Commercial Borrowings:• External Commercial Borrowings (ECB) refer to
commercial loans [in the form of bank loans, buyers’ credit, suppliers’ credit, securitised instruments (e.g. floating rate notes and fixed rate bonds)] availed from non-resident lenders with minimum average maturity of 3 years.
• Foreign Currency Convertible bonds (FCCBs) mean a bond issued by an Indian company expressed in foreign currency, and the principal and interest in respect of which is payable in foreign currency

• Assistance from government budgeting support and international finance corporations:
• Promotes sustainable private sector investment in developing countries.
• IFC is a member of the World Bank Group and is headquartered in Washington, DC. It shares the primary objective of all World Bank Group institutions: to improve the quality of the lives of people in its developing member countries.

Analysis of Financial Statement
• Financial statement analysis is defined as the process of identifying financial strengths and weaknesses of the firm by properly establishing relationship between the items of the balance sheet and the profit and loss account.

• There are various methods or techniques that are used in analyzing financial statements, such as comparative statements, schedule of changes in working capital, common size percentages, funds analysis, trend analysis, and ratios analysis.

• Balance Sheet, Profit and Loss Account and Funds Flow Statement:

• In financial accounting, a balance sheet or statement of financial position is a summary of the financial balances of a sole proprietorship, a business partnership or a company. Assets, liabilities and ownership equity are listed as of a specific date, such as the end of its financial year

Profit and Loss Account:
• The purpose of the profit and loss account is to:
• Show whether a business has made a PROFIT or LOSS over a financial year.
• Describe how the profit or loss arose – e.g. categorizing costs between “cost of sales” and operating costs.

• A profit and loss account starts with the TRADING ACCOUNT and then takes into account all the other expenses associated with the business.

• Funds Flow Statements: (FFS):• It is the statement of changes in financial
position prepared to determine only the sources and uses of working capital between dates of 2 balance sheets.
• •

Types of Costing:
• Some 8 types of costing 1. Real cost of Production 2. Opportunity Cost or Production Cost 3. Past Cost or Future Cost 4. Pocket Cost or Book Cost 5. Incremental Cost and Sunk Cost 6. Shut Down Cost and Abandonment Cost 7. Replacement Cost and Historical Cost 8. Private and Social Cost 9. Short run and Long run cost.

Traditional Costing Approach:
• The traditional method of cost accounting refers to the allocation of manufacturing overhead costs to the products manufactured
Activity Base Costing
• Activity-based costing (ABC) is a costing model that identifies activities in an organization and assigns the cost of each activity resource to all products and services according to the actual consumption by each: it assigns more indirect costs (overhead) into direct costs.

Fixed Cost:
• A cost that remains constant, regardless of any change in a company's activity.
• A good example is a lease payment. If you are leasing a building at $2,000 per month, then you will pay that amount each month, no matter how well or how poorly the business is doing.

• Variable Cost:• Marginal Cost:• Cost output relationship in short and long run:• Pricing Practice;• Full Cost pricing and Marginal Cost Pricing;

• Total cost of all recourse used or consumed in production, including direct, indirect, and investing cost.
• Going Rate pricing:• All firms do have the power to fix a price ,but
instead of doing so, in a competitive market situation firms fix a price which is equal to the average price charged by all firms in an industry,ie,it collects all the prices firms with same product and compute the average

• Bid Pricing:• A bid price is the highest price that a buyer
(i.e., bidder) is willing to pay for a good. It is usually referred to simply as the "bid."

• Pricing for a Rate of return:• Target rate of return pricing is a pricing
method used almost exclusively by market leaders or monopolists. You start with a rate of return objective, like 5% of invested capital, or 10% of sales revenue

• Apprising Project Profitability• Assessment of project in terms of economic,
social and financial feasibility.
– Economic Aspects– Technical Aspects– Organization Aspects– Financial Aspects– Market Aspects

Capital Budgeting
• Non Discounted Technique Methods • Payback Period:• Accounting Rate of return• Discounted Cash Flow Technique Methods• NPV- Net Present Value Method• PI –Profitability Index• IRR-Internal Rate of Return

Cost Benefit Analysis:
• Cost benefit analysis is a term that refers both to:
• Helping to appraise, or assess, the case for a project, programme or policy proposal;
• An approach to making economic decisions of any kind

• Under both definitions the process involves, whether explicitly or implicitly, weighing the total expected costs against the total expected benefits of one or more actions in order to choose the best or most profitable option. The formal process is often referred to as either CBA (Cost-Benefit Analysis) or BCA (Benefit-Cost Analysis).

• Benefits and costs are often expressed in money terms, and are adjusted for the time value of money, so that all flows of benefits and flows of project costs over time (which tend to occur at different points in time) are expressed on a common basis in terms of their “present value

• Closely related, but slightly different, formal techniques include cost-effectiveness analysis, economic impact analysis, fiscal impact analysis and Social Return on Investment (SROI) analysis

• A cost benefit analysis is done to determine how well, or how poorly, a planned action will turn out. Although a cost benefit analysis can be used for almost anything, it is most commonly done on financial questions
• Example Cost Benefit Analysis• As the Production Manager, you are
proposing the purchase of a $1 Million stamping machine to increase output. Before you can present the proposal to the Vice President, you know you need some facts to support your suggestion, so you decide to run the numbers and do a cost benefit analysis.
•

Feasibility Reports:(conveniently/perfectly)
• This is formal document for management use, briefly enough and sufficiently non technical to be understandable by high level management. There is no standard or formal format for the preparation of feasibility report. Analyst usually decides on a format that suits particular user and system.

Appraisal Process:
• The first step in the process of performance appraisal is the setting up of the standards which will be used to as the base to compare the actual performance of the employees.
• Technical, Economical, and Financial Feasibility:• A series of indicators of economic or financial
worth are then derived, including net present values, benefit-cost ratios, net present
• value/capital cost ratios, internal rates of return,
discounted payback periods and cost-effectiveness ratios, which allow the comparison of alternative proposals over their economic life.

• In finding out financial feasibility, the following facts should be taken into account:
• 1 Cost of Project.• 2 Means of Financing.• 3 Costs of Production and Profitability.• 4 Cash Flow Estimates.• 5) Proforma Balance Sheets.


