Managerial Optimism, Investment Efficiency, and Firm ... · This study investigates the...
44
1 Managerial Optimism, Investment Efficiency, and Firm Valuation* I-Ju Chen Yuan Ze University, Taiwan Shin-Hung Lin Yuan Ze University, Taiwan This study investigates the relationship between managerial optimism, investment efficiency, and firm valuation. This study follows the Campbell’s measurement for managerial optimism and investigates the influences of the different levels of managerial optimism on improving investment efficiency and firm value when firms tend to under-invest or over-invest. The results indicate that an under-invested firm with a CEO who has a higher level of managerial optimism can improve the firm’s investment efficiency by reducing the degree of underinvestment, which further increases the firm’s value. However, when firms tend to overinvest, there is insufficient evidence to show that a firm with a lower level of CEO managerial optimism will effectively improve the firm’s investment efficiency and increase firm value by reducing the degree of overinvestment. The results generated in this study help scholars and practitioners understand how managerial optimism affects the investment efficiency of firms. (JEL: G02, G30) Keywords: Managerial optimism, Investment efficiency, Overinvestment, Underinvestment * I-Ju Chen acknowledges the partial financial support of the National Science Council of Taiwan (NSC). The authors are also grateful for the feedback from an anonymous referee, Editor-in-Charge Hersh Shefrin, and Editor-in-Chief Panayiotis Theodossiou. Previous version of this paper has been presented at the 2nd Annual International Conference on Accounting and Finance (Singapore, 2012). I. Introduction The behavioral finance literature suggests that people make systematic errors in the way that they think. They may be optimistic or overconfident about the outcomes of decisions. Optimism means that individuals systematically overestimate the future outcome of an event (Heaton, 2002, Lin et al., 2005, Barros and Silveira, 2009, Shefrin, 2001). Overconfidence, similar to optimism, means that individuals overestimate their personal
Transcript of Managerial Optimism, Investment Efficiency, and Firm ... · This study investigates the...
1
Managerial Optimism, Investment Efficiency, and Firm Valuation*
I-Ju Chen
Yuan Ze University, Taiwan
Shin-Hung Lin
Yuan Ze University, Taiwan
This study investigates the relationship between managerial optimism, investment
efficiency, and firm valuation. This study follows the Campbell’s measurement for
managerial optimism and investigates the influences of the different levels of managerial
optimism on improving investment efficiency and firm value when firms tend to under-invest
or over-invest. The results indicate that an under-invested firm with a CEO who has a higher
level of managerial optimism can improve the firm’s investment efficiency by reducing the
degree of underinvestment, which further increases the firm’s value. However, when firms
tend to overinvest, there is insufficient evidence to show that a firm with a lower level of CEO
managerial optimism will effectively improve the firm’s investment efficiency and increase
firm value by reducing the degree of overinvestment. The results generated in this study help
scholars and practitioners understand how managerial optimism affects the investment
efficiency of firms. (JEL: G02, G30)
Keywords: Managerial optimism, Investment efficiency, Overinvestment, Underinvestment
* I-Ju Chen acknowledges the partial financial support of the National Science Council of Taiwan (NSC). The authors are also grateful for the feedback from an anonymous referee, Editor-in-Charge Hersh Shefrin, and Editor-in-Chief Panayiotis Theodossiou. Previous version of this paper has been presented at the 2nd Annual International Conference on Accounting and Finance (Singapore, 2012).
I. Introduction
The behavioral finance literature suggests that people make systematic errors in the
way that they think. They may be optimistic or overconfident about the outcomes of
decisions. Optimism means that individuals systematically overestimate the future outcome
of an event (Heaton, 2002, Lin et al., 2005, Barros and Silveira, 2009, Shefrin, 2001).
Overconfidence, similar to optimism, means that individuals overestimate their personal
2
ability and thus put too much weight on their personal information or viewpoint (Barros and
Silveira, 2009; Malmendier and Tate, 2005a; Hirshleifer et al., 2012). Either way, their
preferences may create distortions. Though these individual behavioral preferences,
documented in many studies, affect asset pricing in the stock market (Barberis, Shlerifer,
and Vishny, 1998; Daniel, David, and Subrahmanyam, 1998; Barberis and Thaler, 2003),
only a handful of studies, Malmendier and Tate (2005a, b), Ben-David, Graham, and Harvey
(2011), and Hirshleifer, Teoh, and Low (2012), investigate how these individual biases
affect corporate investment decisions and investment efficiency,
Malmendier and Tate (2005a, b) develop measures of CEO optimism and empirically
confirm that the investment distortions of firms are associated with managerial personal
attributes or behavioral biases. Ben-David, Graham, and Harvey (2011) compute the
magnitude of CFO miscalibration about future stock market return as the measure of
overconfidence and conclude that top executives miscalibrate and that their miscalibrations
significantly affect the investment behavior of their firms. Hirshleifer, Teoh, and Low (2012)
using options- and press-based proxies for CEO overconfidence, further document that
firms with overconfident CEOs invest more in innovation activities and achieve greater
innovative success for given research and development expenditures. Making investment
decisions is an integral and vital part of managing a firm. An efficient investment decision
may be expected to enhance firm valuation. Although previous studies provide evidence that
corporate investment is affected by managerial personal preference or behavior biases, these
studies do not further address how managerial optimism affects a firm’s investment
efficiency, or whether managerial optimism helps to improve corporate investment
efficiency and its association with firm valuation. Our study aims to fill this gap.
We hypothesize that an under-invested firm with a higher level of managerial optimism
tends to invest more, given that an optimistic manager is usually willing to invest more
(Glaser et al. 2008). If this is the case, then we will observe that an under-invested firm with
3
a higher level of managerial optimism will have higher capital investment, enhancing the
firm’s investment efficiency. We follow the research of Campbell et al. (2011), which
extends the work of Malmendier and Tate (2005), and develop a measure of CEO optimism.
We also follow Biddle et al. (2009), using an aggregated measure of ex-ante characteristics
of a firm’s cash and leverage ratios, to classify the under- and over- investment level of
sample firms.
The main findings are summarized as follows: First, based on our optimism
measurement, we find almost 40% of CEOs are optimistic in our sample, which is
consistent with the prior studies (e.g., Campbell et al., 2011). In addition, a firm with a
highly optimistic CEO will invest more than firms whose CEOs have lower levels of
optimism; this finding remains after implementing many robustness checks. Last, our
findings indicate that an under-invested firm with a CEO that has a higher level of
managerial optimism improves the firm’s investment efficiency by reducing the amount of
underinvestment, thereby increasing firm value. This is consistent with our hypotheses.
However, our results do not provide sufficient evidence to support the other hypothesis
when firms over-invest. That is, for an over-invested firm, a CEO with a lower level of
managerial optimism does not appear to effectively improve the firm’s investment efficiency
and further increase firm value by reducing the level of overinvestment. We also investigate
how CEO optimism affects investment decisions for firms under financial constraints. We
find that optimistic CEOs in financially-constrained firms are still willing to increase their
capital expenditure, also leading to increases in firm valuation.
Our study contributes to the literature that firms with a higher level of managerial
optimism help to improve firm investment efficiency, especially when these firms are
under-invested. Our study also complements the research in behavioral finance showing that
corporate investment policy is affected by managerial psychological biases which might
improve firm efficiency when firms do not have enough capital investment. Several studies
4
are also related to our research. Heaton (2002) is the first study to examine whether
managerial optimism affects corporate investment decisions. They find that an optimistic
manager may avoid negative net present value projects which must be financed externally
yet be more willing to undertake risky projects if they are loyal to shareholders and have the
funds to do so. Campbell et al. (2011) find that CEO turnover is related to the level of CEO
optimism. Boards terminate low-optimism and high-optimism CEOs more frequently than
moderately-optimistic CEOs. They interpret this result as evidence that a moderate level of
CEO optimism is more likely to choose a first-best investment level. Their findings
provide further justification for our efforts to explore how CEO optimism affects firm
investment efficiency and firm value.
The remainder of this study is organized as follows: section 2 summarizes the literature
and proposes the hypotheses statements; section 3 describes the data and variables; section 4
discusses the empirical methodology; section 5 presents the main empirical analyses and
results; and section 6 concludes.
II. Literature Review and Hypotheses Development
The major issue in this study is how managers with different levels of optimism affect
the investment efficiency of their firms, and what the effect is for firms that are prone to
under- or over-invest. To explore these ideas and develop our hypotheses, we summarize the
literature below.
Researchers generally find that an optimistic manager is likely to believe and
overestimate the probability that a good thing will happen, but underestimate the probability
that a bad thing will happen (Heaton, 2002; Lin et al., 2005; Barros and Silveira, 2009;
Shefrin, 2001; Glaser, 2008). The managerial optimism tendency of systematically
overestimating the future average cash flow of a firm is related to corporate policies
regarding decisions such as investments, financing, dividend payouts, or acquisitions, and
5
results in managerial decisions with a certain degree of irrationality.
Heaton (2002) find that optimistic managers prefer internal financing to external
financing because they believe market investors underestimate the value of their firm and
thus hesitate to raise funds from the financial markets. Several empirical studies, such as Lin
et al. (2008) and Hackbarth (2008), confirm this theoretical prediction by Heaton (2002) and
show that managerial optimism can explain pecking order preferences in financial decisions.
Barros and Silveira (2009) further show that firms with optimistic managers will choose a
more aggressive financing policy, resulting in firms that have higher leverage ratios,
affecting their capital structure.
Managerial behavior tendencies may not only affect a firm’s financing decisions but
also impact its investment decisions. Jensen (1986), using the concept of agency cost of free
cash flow, predicts that managers may invest in negative NPV projects due to self-interest.
This agency cost between managers and shareholders may thus cause overinvestment,
resulting in investment distortions. Myers and Majluf (1984) posit that the existence of
information asymmetry between a firm’s managers and outsiders will cause distorted
investments, thus reducing the efficiency of capital investments.
The above studies, though they explore whether a firm’s investment decision is
associated with managerial attitudes, do not specifically investigate whether the investment
distortion is affected by managerial psychological preferences, such as optimism.
Malmendier and Tate (2005a) is the first study to consider managerial optimism in corporate
investment decisions. They measure the timing of CEO’s stock option exercise as the proxy
for CEO optimism and find that overoptimistic CEOs are significantly more responsible for
the firm’s cash flow. By hand-collecting data on how the press portrays each CEO as the
measure of managerial optimism, Malmendier and Tate (2005b) reconfirm their findings
that managerial overoptimism accounts for corporate investment distortions. Using a unique
database of German companies to proxy for managerial optimism, Glaser et al.(2008) show

6
that the investment-cash flow sensitivity is higher for firms with optimistic managers, which
again supports the findings of Malmendier and Tate (2005a, b). Malmendier and Tate (2008)
further find that a highly optimistic CEO does not necessarily predict an acquisition decision,
but that firms with highly optimistic CEOS and plentiful internal cash flow tend to make
lower-quality acquisitions. This implies that optimistic managers may cause a firm to invest
more than a firm with less optimistic managers, thereby exposing the firm to risk (Glaser et
al., 2008; Malmendier and Tate, 2008).
A distorted investment, such as an over- or under-investment, may reduce the
investment efficiency of a firm (Biddle et al., 2009). Minimizing the investment distortion
helps improve investment efficiency. In a perfect market all projects with positive net
present value should be funded, thus enhancing firm valuation. Therefore, implementing a
positive NPV project enhances investment efficiency (Stein, 2003). However, in the real
world in which investors do not have same information as corporate managers, investment
efficiency may be distorted either by limiting firms’ ability to finance a potential project
(Hubbard, 1998; Bertrand and Mullainathan, 2003) or by inferior project selections,
diversion of funds to perquisites, or even expropriation of resources by managers (Stein,
2003).
Several papers investigate how to improve investment efficiency in the context of
market imperfection. Biddle and Hilary (2006) and Biddle et al. (2009) show that either
improvement in accounting quality or reporting quality aids in alleviating information
asymmetries that reduce both over- and under- investment possibility. However, no financial
study to date directly examines how to improve investment efficiency, with the exception of
studies of accounting approaches. This study seeks to understand whether managerial
optimism affects the investment efficiency of a firm and in what circumstances managerial
optimism minimizes investment distortion.
Studies indicate that managers with higher level of optimism are more sensitive to cash
7
flows and may forgo positive net present value projects if internal funds are insufficient.
Meanwhile, research also suggests that managers with a certain degree of optimism tend to
undertake riskier projects because they overestimate the future payoff, meaning that they
increase investment (Heaton, 2002; Barros and Silveira, 2009; Shefrin, 2001; Goel and
Thakor, 2008). Based on the above analyses, we predict that an optimistic CEO of a firm
with plenty of cash flow (under-investing) will be less concerned about costly external
financing and thus more willing to undertake a risky project expected to have higher returns.
On the other hand, an over-invested firm with a less optimistic CEO should follow more
conservative investment policies, resulting in decreased capital expenditure. Thus, we
propose the first hypothesis:
H1a: A firm with a high possibility of underinvestment and whose CEO is highly optimistic
will invest more than a similar firm whose CEO has a low level of optimism.
H1b: A firm with a high possibility of overinvestment and whose CEO has a low level of
optimism will invest less than a similar firm whose CEO is highly optimistic.
When a distorted investment may reduce the investment efficiency of a firm,
managerial sentiment may thus impact a firm’s value. Gervais et al. (2002) is the first paper
to provide a theory showing that moderately optimistic managers are more likely to take on
risky investment projects which are in the best interest of shareholders than rational
managers. Goel and Thakor (2008) explain theoretically the reason that a CEO with
moderate overoptimism helps diminish underinvestment inefficiency. This is because an
overoptimistic CEO may overestimate the probability of a high payoff and thus be more
willing to bear risks in accepting projects. Because an overoptimistic CEO is more willing
to invest in projects with low probabilities of high payoff, this may improve investment
efficiency for an underinvested firm, enhancing shareholders’ wealth. Campbell et al. (2011)
follows a logic similar to that of Gervais et al. (2002) and Goel and Thakor (2008) and finds
8
that CEOs with relatively moderate optimism help maximize firm valuation. Based on the
above analyses, we predict that managerial optimism is associated with firm investment
efficiency and firm valuation. Thus, we propose the second hypothesis:
H2a: The value of a firm with a high possibility for underinvestment and whose CEO is
highly optimistic will be greater than that of a similar firm whose CEO has a low level
of optimism.
H2b: The value of a firm with a high possibility for overinvestment and whose CEO has a
low level of optimism will be greater than that of a similar firm whose CEO is highly
optimistic.
III. Data and Variables
3.1. Sample and Data
The variable of interest is CEO optimism and the main dependent variables include
investment (Invest) and Firm value (Value). To measure CEO optimism, we rely on the data
collected from ExecuComp database which provides information about CEO compensation in
terms of salary, bonus, and stock options granted from 1992 to 2009. Investment is
measured by the sum of research and development expenditure, capital expenditures, and
acquisition expenditure minus cash receipts from sales of property, plant, and equipment, then
divided by lagged total assets (Biddle et al., 2009). Firm value is defined as Tobin’s Q.
Tobin’s Q is sum of market value of equity plus total assets minus book value of equity
divided by total asset (Baker et al., 2003).
We collect the data on ownership structure from the Compact D/SEC database, Thomson
Reuters, and the Corporate Library. The measure provided by Gompers et al. (2003) is used as
a proxy for external governance. A higher score indicates a higher level of anti-takeover
provisions imposed, implying that shareholders’ rights in those firms is weaker. The number
of analysts following is collected from the I/B/E/S database.
9
Accounting data is collected from Compustat database. We delete firm-year observations
that have missing data related to our dependent variables, independent variables and any of
our optimism measures. We further exclude firms in the utilities industry (SIC codes
4900-4999) and firms in financial industries (SIC codes between 6000 and 6999) due to their
special capital structure and investment characteristics. All variables used in this study are
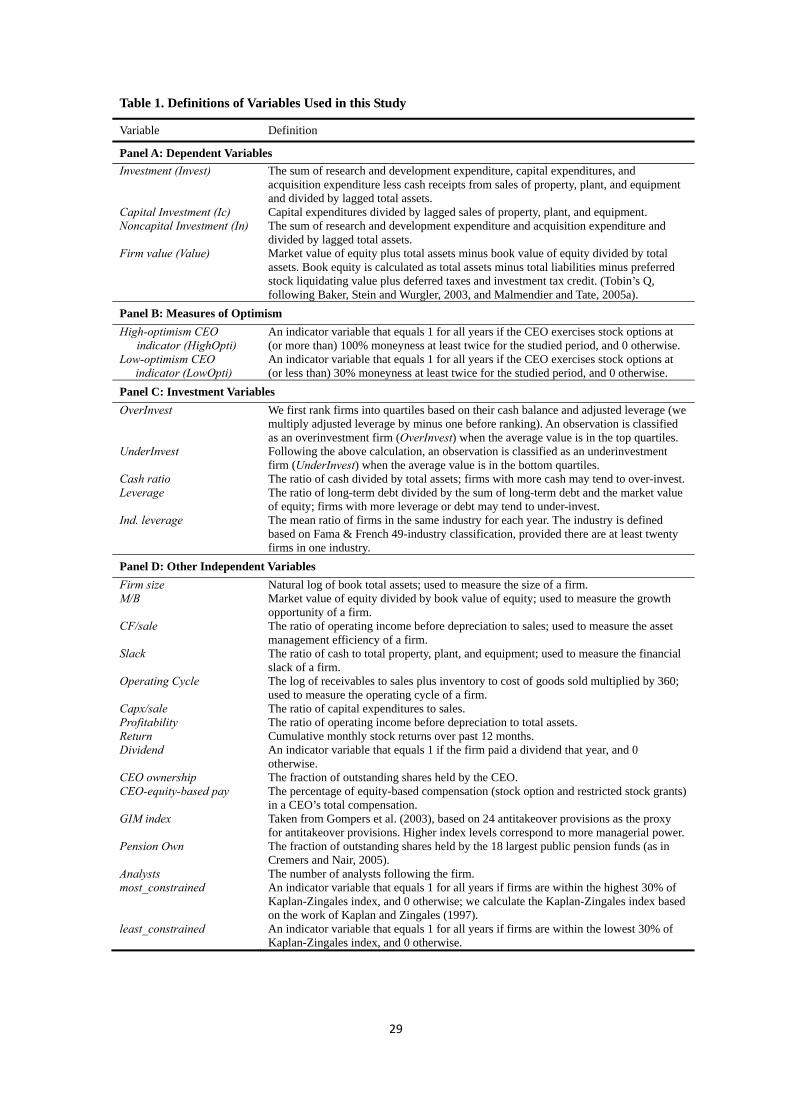
defined in Table 1.
[Table 1 is inserted about here]
3.2. The Measurement of Managerial Optimism
As mentioned, previous studies have applied a variety of proxies for managerial
optimism as this phenomenon of managerial bias is not only difficult to directly observe but
also difficult to measure (Malmendier and Tate, 2005a, b; Campbell et al., 2011). We follow
Campbell et al. (2011) and apply optimism measures based on stock option holdings and
exercise data constructed from ExecuComp database. Campbell et al. (2011) classify CEO
optimism measure into three levels of low, moderate, and high. This allows us to investigate
the relationship between different levels of managerial optimism and investment efficiency
(or firm value). For each CEO-firm-year, we first calculate the realizable value per option as
the exercisable option’s total realizable value (OPT_UNEX_EXER_EST_VAL) divided by
the number of exercisable options (OPT_UNEX_EXER_NUM) held by the CEO. We then
use the stock price at the fiscal year end (PRCCF) to minus the realizable value per option to
get the estimated average exercise price. Finally, we use the realizable value per option
divided by the estimated average exercise price and obtain the average percent moneyness.
CEOs who hold stock options more than 100% deep in the money are identified as highly
optimistic.
In terms of the low- and moderate-optimism measures (indicators of CEOs with a
10
lower or moderate level of optimism, respectively) we estimate the average percent
moneyness of the exercised options. For each CEO-firm-year observation, we first calculate
the per option realized exercise value as the exercising option’s total realized value (OPT_
EXER _VAL) divided by the exercised option’s number (OPT_ EXER _NUM) held by the
CEO. We then use the stock price at the fiscal year end (PRCCF) and deduct per option
realized exercise value to obtain the estimated average exercise price of exercised options.
Finally, we use the per option realized exercise value and divide it by the estimated average
exercise price of exercised options to obtain the average percentage moneyness of exercised
options. When a CEO’s exercised stock options are less than 30% in the money and the
CEO does not hold other exercisable options that are more than 30% in the money, the CEO
is identified as having a low level of optimism. Furthermore, when a CEO holds and/or
exercises options with average percentage moneyness between 30% and 100% the CEO is
identified as being moderately optimistic.
We begin with 29,829 CEO-year observations from 1992 to 2009 from the Compustat
Execucomp database. The sample size decreases to 23,683 after the financial industry
(2-digit SIC=60-69) and utilities (2-digit SIC code=49) are excluded. We further only
include those CEOs who have the option granted, reducing the sample to 16,285. Finally we
are left with 7,890 CEO-year observations when the sample must have the valid realizable
value and realized exercise value per option. Similar to Campbell et al. (2011), we require
that CEOs show the relevant exercise behavior at least twice in the sample period and
classify them as high/low optimism beginning with the first time they do.
3.3. The Measurement of Over- and Underinvestment
Although firms might deviate their optimal investment ratio due to the defects of
market imperfection, the measure of such deviation is conceptually and empirically difficult.
In this paper, we postulate that certain firm-specific characteristics are likely to affect the
11
possibility of firms to over- or under-invest. Several studies indicate that a higher cash ratio
increases the possibility of managers deciding to make inefficient investments (Jensen, 1986;
Opler et al., 1999; Stein, 2003). By the same token, firms with higher leverage ratio may
suffer more severe problems of bankruptcy or debt overhang, forcing them to under-invest
(Myers, 1977, 1984; Stein, 2003). Since the cash balance and leverage ratio may affect
firm’s investment level, we adopt the method used by Biddle et al. (2009) and use these two
variables to proxy for over- and under- investment. We first multiply leverage by -1 so that
it resembles cash in that when it increases the tendency is towards overinvestment. We then
rank the firms into deciles by each of these two variables for each year. Because the general
leverage level across industries may vary over time, we also consider industry effects across
the sample period (Lang et al., 1996) and rank firms within the industry1. Next we re-scale
this to a range of 0 to 1. Based on the average ranked value of cash and leverage, we can
obtain a composite score measure which is computed as the average of the ranked values of
the two variables2. We further define two dummy variables: OverInvest (representing firms
that are more prone to over-invest) when the composite score is near 1 (the top 25% of the
sample firm), and UnderInvest (representing firms that are more prone to under-invest)
when the composite score is near 0 (the lowest 25% of the sample firm).
4. Methodology
4.1 Difference Test
To test the hypotheses, we first classify all sample firms into two subsamples: firms
prone to under-invest and firms prone to over-invest, based on their ex-ante characteristics
1 We followed the method of Fama and French (1997) in classifying industries. Currently, they classify industry into 49 categories. We are grateful to them for making this data accessible on their website: http://mba.tuck.dartmouth.edu/pages/faculty/ken.french/data_library.html.
2 The average is taken in order to help reduce the measurement error in our variables.
12
of firm cash balance and firm leverage. We then conduct a difference test on each of these
subsamples, comparing investment ratio and firm value between high- and low-optimism
CEOs. We predict that the average investment or firm value of firms with highly optimistic
CEOs will significantly be higher than those of firms with CEOs low in optimism.
4.2. Regression Specifications
We further apply multiple panel regressions to test the relation between investment and
CEO optimism when firms are more prone to under- or over-invest in the overall sample.
The estimated models are:
ititititititit ControlstUnderInvesHighOptitUnderInvesHighOptiInvest *3210 (1a)
ititititititit ControlsOverInvestLowOptiOverInvestLowOptiInvest *3210 (1b)
where Invest is the investment ratio, our main dependent variable, measured by capital
expenditures divided by lagged total assets. HighOpti is the high-optimism CEO indicator,
which is 1 if CEOs are classified as having a high level of optimism and 0 otherwise.
LowOpti is the low-optimism CEO indicator, which is 1 if CEOs are classified as having a
low level of optimism and 0 otherwise. OverInvest and UnderInvest are respectively used to
classify firms as being more prone to over- or under-invest as described in section 3.3. We
use the OLS method to estimate Models (1a) and (1b). We adjust the standard errors for
heteroskedasticity, serial-, and cross-sectional correlation using a one dimensional cluster at
the firm level (Petersen, 2009). We also include industry and year fixed-effects in the
regression specifications. 49-industry classification provided by Fama and French (1997) is
used to control the industry shocks to the investment.
These control variables include financial variables, such as firm size, market to book
ratio, industry leverage, operating cash flow to sales, slack, operating cycle, dividend, past
one-year stock return, and other governance variables, including CEO ownership,
13
CEO-equity-based pay, institutional ownership, analyst following, and Gomper et al. (2003)
index (Amihud and Lev, 1981; Biddle et al., 2009; Glaser et al., 2008; Heaton, 2002;
Hubbard, 1998; Jensen, 1986, 1993; Lin et al., 2005; Malmendier and Tate, 2005a, b;
Shleifer and Vishny, 1989). Previous studies indicated that the level of investment depends
on the cash flow sensitivity and growth opportunities (Hubbard, 1998; Heaton, 2002; Lin et
al., 2005; Malmendier and Tate, 2005a, b). Firms may forgo positive net present value
projects if they do not have sufficient internal funds. They tend to increase investment if
they see plentiful growth opportunities. Therefore we control for the effect of internal
funding and growth opportunities on investment. The operating cash flow to sales, operating
cycle, the level of slack, and dividend are used to proxy for internal funding. A higher level
of firm leverage more easily induces the problem of debt-overhang and leads to
underinvestment (Myers, 1977, 1984; Stein, 2003), therefore we control for the leverage
effect in the regression. Lamont (2000) argues that changes in the discount rate will affect
the level of investment. Their empirical evidence finds that investment is positively
associated with stock return. Therefore, we control for past stock returns in the regression.
Agency conflicts between managers and shareholders have been documented to have a
significant impact on the optimal investment of firms. The empire building tendency or
entrenchment behaviors of managers may lead firms to deviate from their optimal
investment choices, affecting investment level (Amihud and Lev, 1981; Biddle et al., 2009;
Jensen, 1986, 1993; Shleifer and Vishny, 1989). Therefore, we also include governance
variables in the regression as the controls.
Our first hypothesis states that different levels of CEO optimism will reduce under-
and over-investment when firms are more prone to under- or over-invest. Thus we use
Model (1a) to test H1a by estimating whether the coefficient 3a is larger than zero, and we
use Model (1b) to test H1b by estimating whether the coefficient 3 is smaller than zero.
14
(H1a: 3 >0 when firms are prone to under-invest; H1b: 3 <0 when firms are prone to
over-invest.)
To test the relation between firm value and CEO optimism when firms are more prone
to over- or under-invest, we use models similar to those presented above, but the dependent
variable is firm value, which is represented by Tobin’s Q. Thus the estimated models are:
ititititititit ControlstUnderInvesHotUnderInvesHighOptiValue *3210 (2a)
ititititititit ControlsOverInvestLowOptiOverInvestLowOptiValue *3210 (2b)
where Value is the firm value measured by Tobin’s Q.
According to our second hypothesis, CEO optimism contributes to the value of a firm
when firms are classified as more prone to over- or under-invest. We use Model (2a) to test
H2a by estimating whether the coefficient 3 is larger than zero, and we use Model (2b) to
test H2b by estimating whether the coefficient 3 is larger than zero (H2a : 3 >0 when firms
are prone to under-invest; H2b : 3 >0 when firms are prone to over-invest.). We also control
the governance variables and other financial variables such as firm size, the level of capital
expenditure (Capex/size), Profitability, and Leverage which have been shown to be
significantly related to firm performance in the literature (Lemmon and Lins, 2003; Baek, et
al., 2004).
5. Empirical Analysis
5.1 Summary Statistics
Table 2 presents the summary statistics of CEOs with different levels of optimism.
Panel A of Table 2 presents the distribution of CEO optimism across two different sample
periods. We first test whether the distribution of CEO optimism is similar to that of
Campbell et al. (2011). We find that 37.61% of the CEOs have a high level of optimism and
10.23% of the CEOs have a low level of optimism for the period 1992 to 2005. The
15
distribution of CEO optimism is close to that of Campbell et al. (2011).
[Table 2 is inserted about here]
Panel B of Table 2 extends our analysis from 1992 to 2009 based on CEO-firm-year
data. The total number of CEOs and the proportion of high- and low-optimism CEOs are
presented by year. For the entire sample period, the average proportion of high- and
low-optimism CEOs are 39.75% and 10.22%, respectively. Overall, the proportion of
high-optimism CEOs is greater than the proportion of low-optimism CEOs every year,
consistent with the findings of Malmendier and Tate (2005a) and Glaser et al. (2008). We
also find that the proportion of high-optimism CEOs decreases in 2009, while the proportion
of low-optimism CEOs increases in 2009. This dramatic increase in low-optimism CEOs for
those two years may be due to the effect of the financial crisis. During economic downturns
or dramatic economic instability, managers become more uncertain about the future and thus
less likely overestimate the payoff of a portfolio. Therefore we observe that the proportion
of low-optimism CEOs increases after 2008. Similar reasoning can be applied to the
observed patterns in 2001 and 2002, as many financial scandals happened which affected
attitudes toward expected payoffs of investment projects.
Table 3 shows the summary statistics of the firm data and Pearson correlation for all
variables from 1992 to 2009. All variables are winsorized at the 5th and 95th percentiles to
reduce the influence of outliers. The mean (median) of our main dependent variables,
investment and firm value, are 17.09% (12.39%) and 2.42 (1.92), respectively, which is
similar to the figures reported by Biddle et al. (2009) and Glaser et al. (2008).
[Table 3 is inserted about here]
16
5.2 Univariate Analyses
Table 4 presents the mean (median) differences in investment ratio and firm value for
firms with different levels of CEO optimism. The mean (median) investment ratio of firms
with high-optimism CEOs is significantly higher than for firms with low-optimism CEOs.
This indicates that firms with high-optimism CEOs invest more than firms with
low-optimism CEOs. If we divide the investment ratio into two proportions, capital
investment (Ic) and noncapital investment (In), and compare the investment ratios under
different levels of CEO optimism, we also find that both the capital investment ratio and
noncapital investment ratio of firms with high-optimism CEOs are significantly higher than
those of firms with low-optimism CEOs.
The mean (median) firm value of firms with high-optimism CEOs is also significantly
higher than those with low high-optimism CEOs. This implies that such firms generally
have higher firm valuations if they have high-optimism CEOs. The univariate comparisons
show that managerial optimism could affect the investment behavior and firm valuations as
well.
[Table 4 is inserted about here]
5.3 Multivariate Regression Analyses
5.3.1 Conditional test
5.3.1.1 Relationship between investment and CEO optimism
Table 5 presents the regression coefficients and p-value results for the tests of
hypotheses H1a and H1b. We find the coefficient of HighOpti is 1.29 in Model 2, which is
statistically significant at the 5% level, indicating that a firm with a high-optimism CEO will
invest more than firms with other levels of CEO optimism. Our main prediction is that the
coefficient of the interaction term HighOpti*UnderInvest will be positive. The results in
17
Models 3 and 4 show that the coefficients of the interaction term are significantly positive.
In terms of the economic significance, increasing CEO optimism by one standard deviation
increases investment by approximately 0.5826% among firms that are under-investing.3
Given that the mean investment equals 17.09%, this effect represents an increase of 3.41%.
These findings provide consistent support for Hypothesis H1a. On the other hand, the
coefficient of the interaction term LowOpti*OverInvest is not significant in Models 5 and 6,
which is inconsistent with our prediction under H1b. In sum, we find that the empirical
evidence partially supports our hypothesis that when firms are more prone to under-invest,
high levels of CEO optimism will help improve a firm’s investment efficiency. On the other
hand, when firms are more prone to over-invest, low levels of CEO optimism will not
significantly affect a firm’s investment efficiency.
[Table 5 is inserted about here]
5.3.1.2 Relationship between firm valuation and CEO optimism
Table 6 presents the regression coefficients and p-value results for the test of
hypotheses H2a and H2b. The coefficient of HighOpti is 0.29 in Model 2 and statistically
significant at the 1% level, indicating that firms with a high-optimism CEO on average have
higher valuations than firms with CEOs with other levels of optimism. The interaction terms
HighOpti*UnderInvest in Models 3 and 4 are significantly positive, which are consistent
with our prediction. In terms of the economic significance, increasing CEO optimism by one
standard deviation increases firm valuation by approximately 11.07% among firms that are
under-investing. Given that the mean firm value equals 2.42, this effect represents an
increase of 4.58%. However, the coefficients of interaction term LowOpti*OverInvest in
Models 5 and 6 are not significant, which fails to support H2b. In sum, when firms are prone
3 The standard deviation of CEO optimism is 0.4815 for the period from 1992 to 2009.
18
to under-invest, their firm value increases when they have a highly optimistic CEO, but
when firms are prone to over-invest, there is insufficient evidence to demonstrate that firm
value will increase when their CEO has a low level of optimism.
[Table 6 is inserted about here]
5.3.2 Unconditional test
Our analysis thus far has been conditional on the firm being in a setting where over- or
under-investment is more likely. However, it is possible that firms with certain firm
characteristics choose optimistic CEOs or induce higher levels of optimism in their CEOs.
To explore this issue, we conduct the following tests: first, we investigate the changes in
investment ratio and firm value surrounding a high/low optimistic CEO turnover or when
CEO optimism becomes high/low; second, we examine the relation between the firm
investment ratio and high/low optimism CEOs before they show their optimism attitudes.
Explicitly, we replace the dependent variable with the firm’s investment in the years prior to
the optimistic CEO joining the firm and limit the sample to firm-years prior to the CEO
joining. Finally, we estimate a multinomial logistic regression that tests the association
between the CEO optimism and the likelihood of over- or under- investing. The empirical
results are reported in Tables 7 to 9.
Table 7 presents the results for the changes in investment ratio and firm value
surrounding a high/low optimistic CEO turnover or when CEO optimism becomes high/low.
Year t is defined as the year in which a high/low optimism CEO is turned over or when CEO
optimism becomes high/low. Panels A and B of Table 7 report the change in investment ratio
and firm value relative to year t1 when a high/low optimistic CEO turnover. The mean and
median changes in investment ratio and firm value between year t–1 and years t+1, t+2, and
t+3 are negative and statistically significant at the 10% level or better in Panel A, indicating
19
that investment ratio and firm value decrease significantly after a high optimism CEO leaves.
Panel B reports that the mean and median changes in investment ratio and firm value
between year t–1 and years t+1 are positive but statistically not significant for those firms
with a low optimism CEO turnover. We also investigate the changes in investment ratio and
firm value when CEO optimism becomes high/low. The results from Panel C indicate that
investment ratio and firm value significantly increase when CEO optimism becomes high,
except for the non-significant increase in investment ratio in year t+3. However, no
significant decrease is observed in Panel D when CEO optimism becomes low. The
empirical analyses from Table 7 indicate that the investment ratio and firm value are
partially affected by the level of CEO optimism, especially when the CEOs have a high
level of optimism. The investment ratio and firm value are both observed to significantly
decrease when a high optimism CEO leaves the firm, but both significantly increase when
CEO optimism becomes high.
[Table 7 is inserted about here]
We further limit our sample to firm-years prior to when CEO optimism becomes
high/low and examine the relation between the firm investment ratio and high/low
optimistic CEOs as they exhibit their optimism attitudes. The results from Table 8 report
that the coefficients on HighOpti and LowOpti are both not significant, indicating that firm’s
investment behavior in past years is not significantly associated with the level of CEO
optimism.
[Table 8 is inserted about here]
The results of testing the association between the CEO optimism and the likelihood of
20
over- or under- investing are reported in Table 9. The coefficient associated with HighOpti
(high CEO optimism) in Model 1 of Panel A is significantly negative, indicating that high
CEO optimism significantly decreases the possibility of underinvestment, which is also
consistent with our main results, reported in previous tables. However, the coefficient
associated with LowOpti (low CEO optimism) in Model 4 of Panel B is not significant,
indicating that low CEO optimism does not significantly decrease the possibility of
overinvestment. The results from Table 5 to Table 9 generally support our hypothesis H1a
that firms with a high optimism CEO are more likely to decrease the possibility of
underinvestment and improve the investment efficiency of the firm, but the above
implication does not apply to CEOs with a low level of optimism.
[Table 9 is inserted about here]
5.3.3 Robustness checks
5.3.3.1 Another metric of over- or under-investment
We further implement several tests to ensure that the above results are not
contaminated by other important factors and bias our results. First, we use another approach
to classify the tendency of firms to over- or under-invest. Similar to Biddle et al. (2009), we
estimate a firm-specific model of investment as a function of growth opportunities (as
measured by sales growth of previous year) for each industry-year based on the Fama and
French 49-industry classification for all industries with at least 20 observations in a given
year. The deviations from predicted investment each year from the regression are used to
classify firms as under- or over-invested. Firm-year observations in the bottom quartile (i.e.,
the most negative residuals) are classified as under-investment, and observations in the top
quartile (i.e., the most positive residuals) are classified as over-investment. We then
re-estimate the regression specifications (1) and (2), reporting the results in section A
21
(Models 1 and 2) of Panel A(B) in Table 10. The coefficients of the interaction term
HighOpti*UnderInvest are still significantly positive in Model 1 for both panels, consistent
with the results in Table 5 and Table 6.
[Table 10 is inserted about here]
5.3.3.2 Other top executives’ optimism and different sample period
We also wondered whether there is a correlation between the CEO optimism and other
top executives’ optimism. Because the ExecuComp database also provides information
about the stock option holdings and exercise data for top executives of a firm, we can solve
this query by identifying the optimism of other top executives within the firm using a
method similar to that for calculating CEO optimism and investigate the relation between
the investment efficiency and other top executives’ optimism.4 Section B (Models 3 and 4)
of Panel A(B) in Table 10 shows that a high level of optimism among other top executives
in firms exhibiting underinvestment will significantly improve the investment efficiency and
therefore enhance firm valuation. We also implement the same test during the period from
1992 to 2005 in the section C (Models 5 and 6) to avoid the sample selection problem, and
the results still hold.5
5.3.3.3 Different measures of investment ratio
Our measure of investment spending includes both capital expenditures and
non-capital expenditures. As a robustness check, we decompose the overall investment ratio
and consider two components, Capital investment, which is defined as the capital
4 We also find that the correlation coefficient between CEO optimism and other top executives’ optimism is 0.2443 during the sample period. 5 The reason we set the test period from 1992 to 2005 is because Campbell et al. (2011) is the first to use this measure of CEO optimism and investigate firm performance based on CEO turnover. Their study implies that the level of CEO optimism is associated with investment level of a firm.
22
expenditures, scaled by lagged property, plant, and equipment of the previous year, and
Noncapital investment, defined as the sum of R&D expenditures and acquisitions, scaled by
lagged total assets. We then re-estimate our main model using these two measures of
investment ratios. Table 11 still shows findings similar to those of the main results displayed
in Table 5.
[Table 11 is inserted about here]
5.3.3.4 Relationship between CEO optimism, investment efficiency, and firm valuation
We have so far examined how CEO optimism affects the investment efficiency and
firm value. However, we wonder whether the correlation between high firm value and high
CEO optimism is due to high investment in these firms. To explore this issue, we use the
two-stage least squares (2SLS) method by first estimating Eq. (1), then we use the fitted
value from Eq. (1) to estimate the following model:
ititiitit controlsmenttinvesValue ˆ10 (3)
Table 12 reports the estimates of our 2SLS regressions. We find that the coefficient of
menttinvesˆ is significantly positive in Model 1, indicating that underinvested firms with
high CEO optimism exhibit more efficient investment decisions, which in turn increase firm
value. However, we do not find a significant relation between the improvement in
investment efficiency and firm value for an over-invested firm with low CEO optimism.
[Table 12 is inserted about here]
5.3.4. Relationship between investment/firm value, financial constraints, and CEO optimism
Previous studies show that high-optimism CEOs display greater investment-cash flow
sensitivity in financially constrained firms (Heaton, 2002; Lin et al., 2005). However, it is
unclear how CEO optimism affects investment decisions under financial constraints. We
23
conjecture that high-optimism optimism CEOs of financial constrained firms will still be
willing to invest because they may overestimate the payoff the projects and underestimate
the risk. Table 13 reports the OLS regression coefficients of investment on CEO optimism
and financial constraints. We measure an index of financial constraints for each firm based
on the work of Kaplan and Zingales (1997). Each year we measure the Kaplan-Zingales
index as the proxy for firm’s financial constraints and then rank firms by level of constraint,
from the smallest to largest. We define the lowest 30% firms based on the Kaplan-Zingales
index as the least financially constrained firms and the highest 30% of firms as the most
financially constrained firms. The most_constrained dummy and least_constrained dummy
are included in the regression model to investigate how CEO optimism affects investment
under financial constraints. The results of Models 1 and 2 in panel A of Table 13 indicate
that CEOs with high optimism (HighOpti) will tend to invest more than those with less
optimism, which is consistent with our prediction. We observe that the coefficient of
most_constrained is significantly negative at the 5% level. As expected, highly constrained
firms will spend less on capital expenditure. The interaction term
HighOpti*most_constrained is also significantly positive at the 5% level, which indicates
that a highly optimistic CEO is more willing to increase capital expenditure even when the
firm is financially constrained. This finding is consistent with our conjecture that an
optimism CEO of financially constrained firms are still willing to invest because they may
overestimate the payoff of projects and underestimate the risks.
[Table 13 is inserted about here]
Models 3 and 4 in panel A report the results of the investment level for firms with low
optimism CEOs and with the least financial constraints. We find that firms with the least
financial constraints will tend to invest more than firms with more financial constraints.

24
However, we found no significant evidence showing that low optimism CEOs in less
financially constrained firms will decrease firm investment. The general results from
Panel A of Table 13 indicate that high optimism CEOs tend to increase their capital
expenditure, but this tendency still exists when firms face high financial constraints, while
low optimism CEOs are not observed to significantly affect firm investment level even
when firms are less financially constrained.
Panel B of Table 13 also reports the association among firm valuation, CEO optimism
and firm financial constraints. The results of Table 13 report that the coefficient of HighOpti
is significantly positive at the 1% level, indicating that high-optimism CEOs contribute to
higher firm valuation. If firms are financially constrained, they have significantly lower firm
value than those without financial constraints. Interestingly, we find that CEO optimism
significantly increases firm valuation when firms are financially constrained. This
corresponds to the findings in Panel A of Table 13 and indicates that an optimistic CEO
tends to increase firm investment even under financial constraints, which may lead to an
increase in firm valuation. In addition, we also find that firms with the least financial
constraints tend to have higher firm values than firms with high financial constraints.
However, there is no significant evidence showing that low optimism CEOs in less
financially constrained firms will increase firm value.
[Table 13 is inserted about here]
6. Discussion and Conclusions
Studies suggest that corporate investment is affected by managerial personal
preferences and behavior biases, but these studies do not directly address how managerial
optimism affects a firm’s investment efficiency, or whether managerial optimism helps to
improve corporate investment efficiency. In this study, we focus on how managerial
25
optimism affects a firm’s investment efficiency and its association to firm valuation. We first
measure the level of CEO optimism (Campbell et al., 2011) and identify firms that are prone
to under-invest or over-invest (Biddle et al., 2009). We find that almost 40% of CEOs are
optimistic in our sample, which is consistent with prior studies (e.g., Glaser 2008). Firms
with a highly optimistic CEO will invest more than firms whose CEOs have lower levels of
optimism. In addition, our findings indicate that an under-invested firm with a CEO that has
a high level of managerial optimism improves the firm’s investment efficiency by reducing
the amount of underinvestment, thereby increasing firm value, consistent with our
hypotheses. However, when firms tend to over-invest, our results do not provide sufficient
evidence to support the other hypotheses. An over-invested firm that has a low optimism
CEO is not found to effectively improve the firm’s investment efficiency and increase firm
value by reducing the level of overinvestment. Our main empirical results still hold after
several tests of robustness. We also find that an optimistic CEO tends to increase firm
investment even under financial constraints and also leads to an increase in firm valuation.
26
References
Amihud, Y., and Lev, B. 1981. Risk Reduction as a Managerial Motive for Conglomerate
Mergers. Bell Journal of Economics 12: 605− 617.
Baek, J. S., Kang, J. K., and Park, K. S. 2004. Corporate Governance and Firm Value:
Evidence from the Korean Financial Crisis. Journal of Financial Economics 71: 265-313.
Baker, M., Stein, J., and Wurgler, J. 2003. When Does the Market Matter? Stock Prices and
the Investment of Equity-Dependent Firms. Quarterly Journal of Economics 118:
969–1005.
Barberis, N., and Thaler, R. 2003. A Survey of Behavioral Finance. In Handbook of the
Economics of Finance, edited by G.M. Constantinides, M. Harris and R. Stulz, Elsevier
2003: 1053-1128.
Barberis, N., Shleifer, A., and Vishny, R. 1998. A Model of Investor Sentiment. Journal of
Financial Economics 49: 307-343.
Barros, L., and Silveira, A. 2009. Overconfidence, Managerial Optimism, and the
Determinants of Capital Structure. Brazilian Review of Finance 6(3), 293-335.
Ben-David, I.T., Graham, J. R. and Harvey, C. R., “Managerial Miscalibration.“ SSRN,
Working Paper No.1640552.
Bertrand, M., and Mullainathan, S. 2003. Enjoying the Quiet Life? Corporate Governance and
Managerial Preferences. Journal of Political Economy 111: 1043–1075.
Biddle, G., and Hilary, G. 2006. Accounting Quality and Firm-Level Capital Investment. The
Accounting Review 81: 963–982.
Biddle, G., Hilary, G., and Verdi, R. 2009. How Does Financial Reporting Quality Relate to
Investment Efficiency? Journal of Accounting and Economics 48: 112-131.
Campbell, T. C., Gallmeyer, M., Johnson, S. A., Rutherford, J., and Stanley, B. W. 2011. CEO
Optimism and Forced Turnover. Journal of Financial Economics 101: 695-712.
Cremers, K., and Nair, V. 2005. Governance Mechanisms and Equity Prices. The Journal of
Finance 60: 2859-2894.
Daniel, K., Hirshleifer, D., and Subrahmanyam, A. 1998. Investor Psychology and Security
Market Under- and Over-reactions. The Journal of Finance 53: 1839-1885.
Fama, E. F., and French, K. R. 1997: Industry Costs of Equity, Journal of Financial
Economics 43: 153–193.
Gervais, S., Heaton, J., and Odean, T. 2002. the Positive Role of Overconfidence and
Optimism In Investment Policy. Working paper, University of California, Berkeley.
Glaser, M., Schafers, P., and Weber, M. 2008. Managerial Optimism and Corporate
Investment: Is the CEO Alone Responsible For the Relation? AFA 2008 New Orleans
Meetings Paper. Available at SSRN: http://ssrn.com/abstract=967649.
Goel, A. M., and Thakor, A. V 2008. Overconfidence, CEO Selection, and Corporate
Governance. The Journal of Finance 63: 2737–2784.
27
Gompers, P., Ishii, J., and Metrick, A. 2003. Corporate Governance and Equity Prices.
Quarterly Journal of Economics 118: 107-155.
Hackbarth, D. 2008. Managerial Traits and Capital Structure Decisions. Journal of Financial
and Quantitative Analysis 43: 843-882.
Heaton, J. B. 2002. Managerial Optimism and Corporate Finance. Financial Management 31:
33-45.
Hirshleifer, D. A., Teoh, S. H., and Low, A. 2012. Are Overconfident CEOs Better
Innovators?. The Journal of Finance, 67: 1457-1498.
Hubbard, R.G. 1998. Capital Market Imperfections and Investment. Journal of Economic
Literature 36: 193-225.
Jensen, M. 1986. Agency Costs of Free Cash Flow, Corporate Finance, and Takeovers.
American Economic Review 76: 323-329.
Jensen, M. 1993. the Modern Industrial Revolution, Exit, and the Failure of Internal Control
Systems. The Journal of Finance 48: 831-880.
Kaplan, S. N., and Zingales, L. 1997. Do Investment-Cash Flow Sensitivities Provide Useful
Measures of Financing Constraints. Quarterly Journal of Economics, 112(1), 169-215.
Lamont, O. 2000. Investment Plans and Stock Returns. The Journal of Finance, 55:
2719–2745.
Lang, L., Ofek, E., and Stulz, R. 1996: Leverage, Investment, and Firm Growth, Journal of
Financial Economics, 40: 1996: 3-29.
Lemmon, M., and Lins, K. 2003. Ownership Structure, Corporate Governance, and Firm
Value: Evidence from the East Asian Financial Crisis. The Journal of Finance, 58:
1445-1468.
Lin, Y. H., Hu, S. Y., and Chen, M. S. 2005. Managerial Optimism and Corporate Investment:
Some Empirical Evidence from Taiwan. Pacific-Basin Finance Journal 13: 523–546.
Lin, Y. H., Hu, S. Y., and Chen, M. S. 2008. Testing Pecking Order Prediction from the
Viewpoint of Managerial Optimism: Some Empirical Evidence from Taiwan,
Pacific-Basin Finance Journal 16: 160–181.
Malmendier, U., and Tate, G. 2005a, CEO Overconfidence and Corporate Investment. Journal
of Finance 60: 2661–2700.
Malmendier, U., and Tate, G. 2005b. Does Overconfidence Affect Corporate Investment?
CEO Measures Revisited, European Financial Management 11: 649-659.
Malmendier, U., and Tate, G. 2008. Who Makes Acquisitions? CEO Overconfidence and the
Market’S Reaction. Journal of Financial Economics 89: 20-43.
Myers, S. 1977. Determinants of Corporate Borrowing, Journal of Financial Economics 5:
147− 175.
Myers, S. 1984. the Capital Structure Puzzl, Journal of Finance 39: 575− 592.
Myers, S., and Majluf, N. 1984. Corporate Financing and Investment Decisions When Firms
28
Have Information That Investors Do Not Have. Journal of Financial Economics 13:
187-221.
Opler, T., Pinkowitz, L., Stulz, R., and Williamson, R. 1999. The Determinants and
Implications of Corporate Cash Holdings. Journal of Financial Economics 52: 3-46.
Petersen, M. 2009. Estimating Standard Errors In Finance Panel Data Sets: Comparing
Approaches. Review of Financial Studies 22: 435–480.
Shefrin, H. 2001. Behavioral Corporate Finance. Journal of Applied Corporate Finance 14:
113–124.
Shleifer, A., and Vishny, R. 1989. Management Entrenchment: The Case of Manager-Specific
Investments. Journal of Financial Economics 25: 123-139.
Stein, J. C. 2003. Agency, Information and Corporate Investment. In Handbook of the
Economics of Finance, edited by G.M. Constantinides, M. Harris and R. Stulz, Elsevier
2003: 111-165.
29
Table 1. Definitions of Variables Used in this Study
Variable Definition
Panel A: Dependent Variables
Investment (Invest) The sum of research and development expenditure, capital expenditures, and acquisition expenditure less cash receipts from sales of property, plant, and equipment and divided by lagged total assets.
Capital Investment (Ic) Capital expenditures divided by lagged sales of property, plant, and equipment. Noncapital Investment (In) The sum of research and development expenditure and acquisition expenditure and
divided by lagged total assets.Firm value (Value) Market value of equity plus total assets minus book value of equity divided by total
assets. Book equity is calculated as total assets minus total liabilities minus preferred stock liquidating value plus deferred taxes and investment tax credit. (Tobin’s Q, following Baker, Stein and Wurgler, 2003, and Malmendier and Tate, 2005a).
Panel B: Measures of Optimism
High-optimism CEO indicator (HighOpti)
An indicator variable that equals 1 for all years if the CEO exercises stock options at (or more than) 100% moneyness at least twice for the studied period, and 0 otherwise.
Low-optimism CEO indicator (LowOpti)
An indicator variable that equals 1 for all years if the CEO exercises stock options at (or less than) 30% moneyness at least twice for the studied period, and 0 otherwise.
Panel C: Investment Variables
OverInvest We first rank firms into quartiles based on their cash balance and adjusted leverage (we multiply adjusted leverage by minus one before ranking). An observation is classified as an overinvestment firm (OverInvest) when the average value is in the top quartiles.
UnderInvest Following the above calculation, an observation is classified as an underinvestment firm (UnderInvest) when the average value is in the bottom quartiles.
Cash ratio The ratio of cash divided by total assets; firms with more cash may tend to over-invest.Leverage The ratio of long-term debt divided by the sum of long-term debt and the market value
of equity; firms with more leverage or debt may tend to under-invest. Ind. leverage The mean ratio of firms in the same industry for each year. The industry is defined
based on Fama & French 49-industry classification, provided there are at least twenty firms in one industry.
Panel D: Other Independent Variables
Firm size Natural log of book total assets; used to measure the size of a firm. M/B Market value of equity divided by book value of equity; used to measure the growth
opportunity of a firm. CF/sale The ratio of operating income before depreciation to sales; used to measure the asset
management efficiency of a firm. Slack The ratio of cash to total property, plant, and equipment; used to measure the financial
slack of a firm. Operating Cycle The log of receivables to sales plus inventory to cost of goods sold multiplied by 360;
used to measure the operating cycle of a firm. Capx/sale The ratio of capital expenditures to sales.Profitability The ratio of operating income before depreciation to total assets. Return Cumulative monthly stock returns over past 12 months.Dividend An indicator variable that equals 1 if the firm paid a dividend that year, and 0
otherwise. CEO ownership The fraction of outstanding shares held by the CEO. CEO-equity-based pay The percentage of equity-based compensation (stock option and restricted stock grants)
in a CEO’s total compensation. GIM index Taken from Gompers et al. (2003), based on 24 antitakeover provisions as the proxy
for antitakeover provisions. Higher index levels correspond to more managerial power. Pension Own The fraction of outstanding shares held by the 18 largest public pension funds (as in
Cremers and Nair, 2005). Analysts The number of analysts following the firm. most_constrained An indicator variable that equals 1 for all years if firms are within the highest 30% of
Kaplan-Zingales index, and 0 otherwise; we calculate the Kaplan-Zingales index based on the work of Kaplan and Zingales (1997).
least_constrained An indicator variable that equals 1 for all years if firms are within the lowest 30% of Kaplan-Zingales index, and 0 otherwise.
30
TABLE 2. Sample Distribution by CEO and CEO-Year Observations
Year(s) CEOs
N Low Optimism High Optimism
Panel A: Distributions by CEO
1992-2005 1534 10.23% 37.61%
1992-2009 1737 10.25% 37.36%
Panel B: Distributions by CEO-Year
1992 99 8.08% 20.20%
1993 321 6.85% 29.90%
1994 378 9.52% 35.97%
1995 402 10.69% 40.29%
1996 472 9.32% 40.04%
1997 536 7.08% 44.96%
1998 550 8.18% 45.63%
1999 568 6.69% 45.77%
2000 529 9.82% 47.63%
2001 473 11.20% 44.82%
2002 397 13.09% 37.02%
2003 513 10.33% 41.32%
2004 579 12.78% 35.92%
2005 522 11.87% 36.39%
2006 493 11.96% 36.30%
2007 459 8.49% 35.94%
2008 295 11.86% 36.94%
2009 304 17.76% 35.52%
1992-2005 6339 9.78% 40.63%
1992-2009 7890 10.22% 39.75%
Note: This table shows the distribution of low and high optimism CEOs by CEO observations (Panel A) and by CEO-year observations (Panel B), respectively, from 1992 to 2009. The data are collected from ExecuComp database. Low CEO optimism and high CEO optimism are as defined in Table 1.
31
TABLE 3. Descriptive Statistics and Pearson Correlation for Variables Used in this Study
N Mean Std Median 1 2 3 4 5 6 7 8 9 10 11 12 13 14 15 16 17 18
1 Investment (Invest) (%) 7803 17.09 15.66 12.39 1.00
2 Firm value (Value) 7095 2.42 1.57 1.92 0.28 1.00
3 Cash ratio (%) 7777 10.14 11.35 5.92 0.11 0.38 1.00
4 Firm size 7881 7.23 1.43 7.20 -0.22 -0.25 -0.34 1.00
5 M/B 7095 3.69 2.90 2.80 0.22 0.87 0.27 -0.13 1.00
6 Ind. leverage (%) 7890 10.04 9.18 9.44 -0.19 -0.33 -0.35 0.19 -0.25 1.00
7 CF/Sale (%) 7874 11.13 22.55 11.21 -0.12 -0.02 -0.10 0.20 -0.04 0.04 1.00
8 Slack (%) 7753 109.73 238.99 25.13 0.04 0.22 0.67 -0.22 0.16 -0.27 -0.08 1.00
9 Operating Cycle 7762 2.03 0.29 2.06 0.06 0.09 0.03 -0.05 0.08 -0.34 -0.02 0.03 1.00
10 Capex/sale (%) 7807 8.31 11.11 4.80 0.35 0.03 -0.05 -0.01 0.00 0.10 0.01 -0.14 -0.05 1.00
11 Profitability (%) 7851 15.42 9.22 16.12 -0.12 0.14 -0.15 0.09 0.13 0.09 0.60 -0.19 -0.06 -0.13 1.00
12 Return (%) 7461 26.71 49.46 18.43 0.12 0.40 0.15 -0.13 0.36 -0.11 -0.01 0.10 0.02 0.02 0.02 1.00
13 Dividend 7819 0.54 0.50 1.00 -0.23 -0.24 -0.34 0.42 -0.13 0.28 0.07 -0.26 -0.01 -0.06 0.16 -0.12 1.00
14 CEO ownership (%) 5614 2.07 4.11 0.52 0.05 0.08 0.08 -0.18 0.03 0.04 -0.02 0.04 -0.05 0.01 0.03 0.07 -0.12 1.00
15 CEO-equity-based pay (%) 6162 53.44 22.89 54.80 0.18 0.33 0.23 0.05 0.28 -0.28 0.01 0.18 0.01 0.09 -0.11 0.02 -0.32 -0.04 1.00
16 GIM index 5607 9.35 2.50 9.00 -0.09 -0.15 -0.16 0.15 -0.10 0.13 0.00 -0.15 0.02 -0.05 0.01 -0.06 0.29 -0.15 -0.18 1.00
17 Pension Own. (%) 6698 2.86 1.43 2.80 -0.07 -0.12 -0.05 0.12 -0.12 -0.01 0.04 -0.05 0.00 -0.07 0.02 -0.08 0.08 -0.11 -0.03 0.10 1.00
18 Analyst 6851 10.68 5.70 10.00 0.01 0.13 -0.09 0.60 0.15 0.00 0.16 -0.06 -0.07 0.08 0.15 -0.03 0.11 -0.13 0.20 -0.01 0.15 1.00
Note: This table shows the descriptive statistics and Pearson correlation coefficients for the variables in this study from 1992 to 2009. All variables are as defined in Table 1 and are winsorized at the 5th and 95th percentiles.
32
TABLE 4. Mean and Median Differences in Investment and Firm Value for Firms with Different Levels of CEO Optimism
Low CEO Optimism High CEO Optimism Differences
N Mean Median N Mean Median Mean Median
Investment (Invest) (%) 795 12.41 9.13 3109 19.56 14.47 7.15*** 5.34***
Firm value (Value) 731 1.76 1.48 2805 2.84 2.24 1.08*** 0.76***
Capital Investment (Ic) (%) 792 25.17 17.65 3089 41.66 30.62 16.49*** 12.97***
Noncapital Investment (In) (%) 487 7.61 3.73 2000 13.62 9.22 6.01*** 5.49***
Note: This table presents the mean and median differences in investment and firm value for the CEOs with different levels of optimism. All variables are as defined in the Table 1 and winsorized at the 5th and 95th percentiles. Differences in means and medians are assessed using t-tests and Wilcoxon rank-sum tests. The number of observations varies due to data availability. *** represents 1% significance level.
33
TABLE 5. Relationship between Firm Characteristics, CEO Optimism, and Investment
Variables Model 1 Model 2 Model 3 Model 4 Model 5 Model 6
Intercept 10.31 18.95 11.46 20.27 11.58 20.95 (7.55)*** (4.38)*** (8.34)*** (4.84)*** (8.60)*** (4.91)***
HighOpti 2.37 1.29 0.74 1.21
(5.15)*** (2.13)** (2.47)** (2.32)**
UnderInvest -4.14 -3.98 (-5.38)*** (-2.87)***
HighOpti *UnderInvest
9.33 10.46 (6.63)*** (4.40)***
LowOpti -2.22 -1.87 (-3.98)*** (-2.44)**
OverInvest 0.50 2.45 (0.96) (3.11)***
LowOpti *OverInvest
0.13 -0.10 (0.09) (-0.07)
Firm size -2.68 -0.94 -1.20 (-3.43)*** (-2.61)*** (-3.21)***
M/B 0.01 0.36 0.49 (1.15) (2.79)*** (3.87)***
Ind. leverage 0.14 0.11 0.15 (1.52) (1.36) (1.63)
CF/Sale 0.04 0.04 0.05 (1.98)** (2.04)** (2.34)**
Operating Cycle -0.85 -1.55 -1.03 (-0.55) (-1.02) (-0.67)
Dividend -2.68 -2.32 -2.66 (-3.43)*** (-2.98)*** (-3.40)***
Return 0.01 0.01 0.01 (1.15) (0.87) (1.12)
Slack -0.01 -0.01 -0.01 (-5.82)*** (-5.67)*** (-4.76)***
CEO ownership 0.08 0.06 0.10 (1.10) (0.85) (1.39)
CEO-equity-based pay
0.02 0.02 0.02 (1.54) (1.67)* (1.61)
GIM index -0.03 -0.05 -0.04 (-0.20) (-0.41) (-0.29)
Pension Own -0.15 -0.11 -0.14 (-0.88) (-0.63) (-0.80)
Analyst 0.09 0.08 0.12 (1.27) (1.17) (1.61)
Year/Industry FE Yes Yes Yes Yes Yes Yes Firm cluster Yes Yes Yes Yes Yes Yes
N 7741 2812 7741 2812 7741 2812 R2 0.172 0.194 0.187 0.230 0.169 0.197
Note: This table presents the OLS regression estimates of firm characteristics and CEO optimism on investment. All variables are as defined in the Table 1 and winsorized at the 5th and 95th percentiles. The model includes year and industry fixed-effects based on the Fama-French 49 industry classifications. t-Statistics are presented in parenthesis below the coefficients and are corrected for heteroskedasticity, and cross-sectional and time-series correlation using a one-way cluster at the firm level. The number of observations varies because of data unavailability. ***, **, and * represent the 1%, 5%, and 10% significance levels, respectively.
34
TABLE 6. Relationship between Firm Characteristics, CEO Optimism, and Firm Value.
Variables Model 1 Model 2 Model 3 Model 4 Model 5 Model 6
Intercept 1.67 2.08 1.80 2.04 1.62 1.93
(10.26)*** (5.19)*** (11.59)*** (5.28)*** (13.75)*** (5.03)***
HighOpti 0.51 0.29 0.41 0.23
(9.06)*** (4.61)*** (6.15)*** (3.05)***
UnderInvest -0.99 -0.46 (-13.80)*** (-5.99)***
HighOpti *UnderInvest
0.58 0.56 (2.69)*** (3.54)***
LowOpti -0.28 -0.04 (-4.53)*** (-0.58)
OverInvest 1.17 0.59 (18.39)*** (7.60)***
LowOpti *OverInvest
-0.78 -0.34 (-1.16) (-1.05)
Firm size 0.00 -0.27 -0.24 (0.34) (-7.46)*** (-6.52)***
Capex/Sale 0.01 -0.00 -0.00 (7.77)*** (-0.49) (-0.29)
Profitability 0.06 0.06 0.06 (9.28)*** (8.82)*** (9.10)***
Return 0.01 0.01 0.01 (13.06)*** (13.31)*** (12.61)***
Ind. leverage -0.02 -0.02 -0.02 (-2.95)*** (-3.52)*** (-3.53)***
CEO ownership 0.00 0.00 0.00 (0.34) (0.39) (0.29)
CEO-equity-based pay
0.01 0.01 0.01 (7.77)*** (7.59)*** (7.63)***
GIM index 0.00 0.00 -0.00 (0.26) (0.43) (-0.01)
Pension Own -0.04 -0.04 -0.05 (-1.87)* (-1.90)* (-2.92)***
Analyst 0.08 0.07 0.07 (10.84)*** (10.34)*** (10.04)***
Year/Industry FE Yes Yes Yes Yes Yes Yes Firm cluster Yes Yes Yes Yes Yes Yes
N 7042 2901 7042 2901 7042 2901 R2 0.270 0.540 0.317 0.551 0.331 0.551
Note: This table presents the OLS regression estimates of firm characteristics and CEO optimism on firm value. All variables are as defined in the Table 1 and winsorized at the 5th and 95th percentiles. The model includes year and industry fixed-effects based on the Fama-French 49 industry classifications. t-Statistics are presented in parenthesis below the coefficients and are corrected for heteroskedasticity, and cross-sectional and time-series correlation using a one-way cluster at the firm level. The number of observations varies because of data unavailability. ***, **, and * represent the 1%, 5%, and 10% significance levels, respectively.
35
TABLE 7. Changes in Investment and Firm Value Surrounding a High/Low Optimistic CEO Turnover or when CEOs Become High/Low Optimism
year(t-1) year(t) year(t+1) year(t+2) year(t+3)
Difference
(year(t+1)-year(t-1))
Difference
(year(t+2)-year(t-1))
Difference
(year(t+3)-year(t-1))
Mean Median Mean Median Mean Median Mean Median Mean Median Mean Median Mean Median Mean Median
Panel A: Change in investment ratio and firm value when high optimism CEO turnover
Investment (Invest) (%) 20.48 15.78 19.81 15.41 18.91 13.42 20.37 14.2 17.14 12.61 -1.57 ** -2.36 ** -0.11 ** -1.58 *** -3.34 ** -3.17 **
Firm value (Value) 2.64 2.10 2.70 2.14 2.41 1.93 2.17 1.74 2.04 1.71 -0.23 ** -0.17 ** -0.47 *** -0.36 *** -0.60 * -0.39 ***
Panel B: Change in investment ratio and firm value when low optimism CEO turnover
Investment (Invest) (%) 11.60 9.19 13.91 7.65 12.94 9.44 12.3 8.03 13.25 6.95 1.34 0.25 0.70 -1.16 1.65 -2.24
Firm value (Value) 1.52 1.33 1.63 1.38 1.57 1.33 1.54 1.24 1.54 1.29 0.05 0.00 0.02 -0.09 0.02 -0.04
Panel C: Change in investment ratio and firm value when CEO become high optimism
Investment (Invest) (%) 14.51 11.61 15.58 10.8 16.22 12.29 16.46 13.42 14.44 14.14 1.71 *** 0.68 *** 1.95 ** 1.81 ** -0.07 2.53 **
Firm value (Value) 1.91 1.61 2.40 1.99 2.49 2.12 2.38 2.03 2.32 1.87 0.58 *** 0.51 *** 0.47 ** 0.42 ** 0.41 ** 0.26 *
Panel D: Change in investment ratio and firm value when CEO become low optimism
Investment (Invest) (%) 17.1 12.33 11.25 8.78 11.18 7.32 13.55 11.41 10.6 8.79 -5.92 -5.01 * -3.55 -0.92 -6.50 -3.54
Firm value (Value) 1.60 1.45 1.58 1.42 1.54 1.51 1.53 1.44 1.53 1.38 -0.06 0.06 -0.07 -0.01 -0.07 -0.07
Note: This table presents mean and median changes in investment and firm value between the year preceding a high/low optimistic CEO turnover or when CEO optimism becomes high/low (year -1) and three years following the changes (years +1 to +3). Panels A and B show the changes in investment and firm value as a high/low optimism CEO turns over, respectively. Panels C and D show the changes in investment and firm value when moderate optimism CEOs become high/low optimism CEOs, respectively. All variables are as defined in the Table 1 and winsorized at the 5th and 95th percentiles. Differences in means and medians are assessed using t-tests and Wilcoxon rank-sum tests. ***, **, and * represent the 1%, 5%, and 10% significance levels, respectively.
36
TABLE 8. Relationship between Prior Investment Ratio and CEO Optimism Variables Model 1 Model 2
Intercept 36.53 36.57
(2.22)** (2.22)**
HighOpti 0.31
(0.25)
LowOpti -0.71 (-0.53)
Firm size -1.43 -1.43
(-3.10)*** (-3.09)***
M/B 0.65 0.65
(1.89)* (1.89)*
Ind. leverage -0.11 -0.11
(-1.15) (-1.17)
CF/Sale 0.06 0.06
(1.10) (1.10)
Operating Cycle -1.17 -1.18
(-0.69) (-0.70)
Dividend -1.49 -1.46
(-1.34) (-1.32)
Return 0.00 0.00
(0.46) (0.47)
Slack -0.01 -0.01
(-2.62)*** (-2.61)***
CEO ownership 0.01 0.01
(0.13) (0.11)
CEO-equity-based pay 0.01 0.01
(0.97) (0.96)
GIM index -0.19 -0.19
(-1.24) (-1.23)
Pension Own -0.02 -0.02
(-0.08) (-0.08)
Analyst 0.24 0.24
(2.57)** (2.57)** Year/Industry FE Yes Yes
Firm cluster Yes Yes
N R2
1277 1277
0.193 0.194 Note: This table presents the OLS regression estimates of the CEO optimism (year t) on prior
firm investment (year t-1). The dependent variable is firm investment prior to the year when CEO optimism becomes high/low. We limit our sample to firm-year observations prior to when a CEO shows her/his optimism attitude. All variables are as defined in the Table 1 and winsorized at the 5th and 95th percentiles. The model includes year and industry fixed-effects based on the Fama-French 49 industry classifications. t-Statistics are presented in parenthesis below the coefficients and are corrected for heteroskedasticity, and cross-sectional and time-series correlation using a one-way cluster at the firm level. The number of observations varies because of data unavailability. ***, **, and * represent the 1%, 5%, and 10% significance levels, respectively.
37
TABLE 9. Multi-Nominal Regressions Analyses of the Relationship between CEO Optimism and the Likelihood of Over- or Under- Investing
Panel A Panel B
Model 1 Model 2 Model 3 Model 4
Under Investment Over Investment Under Investment Over Investment
Intercept -2.13 0.483 -2.177 0.624
(8.64)*** (0.59) (9.09)*** (1)
HighOpti -0.118 0.274
(6.9)*** (5.5)**
LowOpti 0.065 0.047 (0.16) (0.05)
Firm size 0.459 -0.691 0.458 -0.68
(46.39)*** (104.03)*** (46.05)*** (101.8)***
M/B -0.345 0.059 -0.352 0.063
(67.84)*** (8.93)*** (71.31)*** (10.22)***
Ind. leverage -0.043 0.065 -0.043 0.065
(30.34)*** (84.3)*** (30.77)*** (84.09)***
CF/Sale -0.012 0.016 -0.013 0.017
(4.87)** (10.8)*** (5.14)** (11.57)***
Operating Cycle 0.22 -0.008 0.23 -0.033
(0.91) (0.01) (1) (0.03)
Dividend -0.188 0.088 -0.177 0.055 (1.78) (0.42) (1.59) (0.17)
Return -0.003 0.001 -0.003 0.001 (2.55) (0.49) (2.54) (0.55)
Slack -0.048 0.003 -0.048 0.003
(154.47)*** (72.9)*** (155.64)*** (73.7)***
CEO ownership 0.014 0.041 0.012 0.043 (0.65) (9.74)*** (0.52) (11.18)***
CEO-equity-based pay
0.006 0.004 0.005 0.005 (4.13)** (2.34) (4.06)** (2.69)
GIM index 0.04 0.018 0.04 0.012
(2.94)* (0.53) (2.95)* (0.24)
Pension Own 0.032 0.111 0.035 0.102 (0.61) (8.26)*** (0.76) (7.06)***
Analyst -0.06 0.058 -0.06 0.058
(22.66)*** (20.71)*** (22.27)*** (20.84)***
Firm cluster Yes Yes
N Under Investment = 616 Over Investment = 491
(References = 1742)
Under Investment = 616 Over Investment = 491
(References = 1742)
Pseudo R2 0.341 0.339 Note: This table presents the results from multinomial logit pooled regressions. The dependent
variable is based on the level of firm over- or under-investment. Firm-year observations in the bottom quartile of firm average ranked value of cash and leverage are classified as under-investment, observations in the top quartile are classified as over-investment, and the observations in the middle two quartiles are classified as the benchmarking group. Panel A(B) presents the results for a model predicting the likelihood that a firm is likely to under- or overinvest when a firm has high(low) optimism CEO. Other variables are as defined in the Table 1 and winsorized at the 5th and 95th percentiles. t-Statistics are presented in parenthesis below the coefficients and are corrected for heteroskedasticity, and clustering of observations by firm. ***, **, and * represent the 1%, 5%, and 10% significance levels, respectively.

38
TABLE 10. Relationship between Firm Characteristics, CEO Optimism, and Investment/Firm Value: Robustness Checks
Panel A: Investment
Section A: Another
measure of under- or over- investment
Section B: Other top executives’ optimism
Section C: Sample period from 1992 to 2005
Variables Model 1 Model 2 Model 3 Model 4 Model 5 Model 6
Intercept 19.54 17.32 21.20 22.42 21.77 22.76 (4.87)*** (4.18)*** (6.06)*** (6.39)*** (5.16)*** (5.36)***
HighOpti 1.24 1.86 1.45
(2.67)*** (2.29)** (2.85)***
UnderInvest -10.85 -5.39 -4.06
(-6.80)*** (-2.29)** (-7.05)*** HighOpti
*UnderInvest 8.29 3.27 6.60
(2.84)*** (2.68)*** (2.82)***
LowOpti -1.56 -1.83 -1.77 (-2.14)** (-2.94)*** (-2.26)**
OverInvest 4.97 2.45 2.41 (7.90)*** (4.07)*** (3.03)***
LowOpti *OverInvest
-1.00 2.23 -0.14 (-0.65) (0.51) (-0.10)
Firm size -0.82 -0.63 -0.92 -1.15 -1.12 -1.19
(-2.34)** (-1.81)* (-3.15)*** (-3.91)*** (-3.13)*** (-3.11)***
M/B 0.36 0.41 0.46 0.52 0.43 0.48
(2.97)*** (3.43)*** (3.41)*** (4.04)*** (3.27)*** (3.74)***
Ind. leverage 0.11 0.06 0.04 0.05 0.15 0.16
(1.25) (0.64) (0.57) (0.66) (1.62) (1.60)
CF/Sale 0.03 0.03 0.02 0.02 0.05 0.05
(1.61) (1.67)* (0.60) (0.77) (2.09)** (2.26)**
Operating Cycle 0.00 -0.21 -1.42 -1.04 -1.82 -1.45
(0.00) (-0.14) (-1.12) (-0.83) (-1.18) (-0.94)
Dividend -2.57 -2.40 -2.56 -2.67 -2.42 -2.72
(-3.40)*** (-3.23)*** (-4.25)*** (-4.41)*** (-3.04)*** (-3.41)***
Return 0.00 0.01 0.01 0.01 0.01 0.01
(0.54) (0.72) (1.89)* (2.06)** (1.14) (1.10)
Slack -0.01 -0.01 -0.01 -0.01 -0.01 -0.01
(-5.24)*** (-5.58)*** (-6.85)*** (-6.14)*** (-5.08)*** (-4.49)***
CEO ownership 0.09 0.08 -0.02 0.00 0.05 0.09
(1.14) (1.10) (-0.42) (0.01) (0.77) (1.22) CEO-equity-based
pay 0.01 0.02 0.02 0.02 0.02 0.02
(1.08) (1.42) (1.95)* (2.14)** (1.69)* (1.64)
GIM index -0.03 -0.06 -0.08 -0.05 -0.04 -0.02
(-0.27) (-0.50) (-0.78) (-0.47) (-0.27) (-0.19)
Pension Own -0.11 -0.17 -0.10 -0.09 -0.17 -0.18
(-0.66) (-1.08) (-0.70) (-0.64) (-1.00) (-1.03)
Analyst 0.05 0.05 0.12 0.13 0.11 0.12
(0.65) (0.65) (1.94)* (2.22)** (1.56) (1.59) Year/Industry FE Yes Yes Yes Yes Yes Yes
Firm cluster Yes Yes Yes Yes Yes Yes N 2812 2812 4146 4146 2734 2734 R2 0.242 0.214 0.199 0.195 0.211 0.197
(Continued)
39
TABLE 10. (Continued)
Panel B: Firm Value
Section A: Another
measure of under- or over-investment
Section B: Other top executives’ optimism
Section C: Sample period from 1992 to 2005
Variables Model 1 Model 2 Model 3 Model 4 Model 5 Model 6
Intercept 2.12 2.17 2.28 2.23 1.97 1.83
(5.42)*** (5.47)*** (6.65)*** (6.49)*** (5.19)*** (4.72)***
HighOpti 0.24 0.18 0.25
(3.79)*** (2.29)** (3.39)***
UnderInvest -0.63 -0.47 -0.44
(-3.13)*** (-7.28)*** (-5.92)***
HighOpti *UnderInvest
0.65 0.26 0.21
(2.88)*** (2.34)** (2.03)**
LowOpti -0.06 -0.11 -0.04
(-1.08) (-2.34)** (-0.64)
OverInvest 0.20 0.53 0.59
(2.49)** (7.60)*** (7.52)***
LowOpti *OverInvest
-0.25 -0.12 -0.34
(-0.97) (-0.73) (-2.22)**
Firm size -0.30 -0.30 -0.24 -0.23 -0.27 -0.24
(-8.33)*** (-8.02)*** (-7.60)*** (-7.10)*** (-7.38)*** (-6.41)***
Capex/Sale -0.00 -0.00 -0.00 -0.00 -0.00 -0.00
(-1.31) (-0.91) (-0.01) (-0.12) (-0.54) (-0.33)
Profitability 0.06 0.06 0.05 0.05 0.06 0.06
(9.19)*** (9.49)*** (9.11)*** (9.13)*** (8.55)*** (8.83)***
Return 0.01 0.01 0.01 0.01 0.01 0.01
(14.35)*** (12.98)*** (14.75)*** (14.02)*** (13.11)*** (12.53)***
Ind. leverage -0.02 -0.02 -0.02 -0.02 -0.02 -0.02
(-2.76)*** (-3.27)*** (-4.15)*** (-4.38)*** (-3.24)*** (-3.35)***
CEO ownership 0.00 0.01 0.01 0.01 0.00 0.00
(0.24) (0.61) (1.28) (1.20) (0.42) (0.35)
CEO-equity-based pay
0.01 0.01 0.00 0.00 0.01 0.01
(7.71)*** (7.84)*** (4.29)*** (3.93)*** (7.47)*** (7.41)***
GIM index 0.00 0.00 -0.02 -0.02 0.01 0.00
(0.21) (0.03) (-1.61) (-1.88)* (0.60) (0.14)
Pension Own -0.03 -0.04 -0.04 -0.05 -0.04 -0.05
(-1.73)* (-2.37)** (-2.69)*** (-3.19)*** (-1.89)* (-2.97)***
Analyst 0.07 0.08 0.08 0.08 0.07 0.07
(10.75)*** (10.81)*** (12.61)*** (12.26)*** (10.29)*** (10.00)***
Year/Industry FE Yes Yes Yes Yes Yes Yes
Firm cluster Yes Yes Yes Yes Yes Yes
N 2901 2901 4278 4278 2822 2822
R2 0.549 0.533 0.520 0.519 0.551 0.550 Note: This table presents the robustness analyses of firm characteristics and CEO optimism on
investment (panel A) and firm value (panel B). In Section A, we test our hypotheses by using a new metric of over- or under-investment. We first estimate a firm-specific model of investment as a function of growth opportunities (as measured by sales growth) in each industry, which is based on Fama and French 49-industry classification:
40
investmenti,t+1 =θ0+θ1* sales_growthi,t +εi,t+1 sales_growthi,t is the change in sale (from year t-1 to year t). We further classified firms based on the calculated residuals (difference from the predicted investment) and sort them yearly based in the residuals from the above equation. Firm-year observations in the top quartiles are classified as over investment (OverInvest) whereas those in the bottom quartiles are classifies as under investment (UnderInvest). In Section B, we replace CEO optimism with other top executives’ optimism in the regression analyses. In Section C, we repeat the analyses in the period from 1992 to 2005, the same studied period as Campbell et al. (2011). All variables are as defined in the Table 1 and winsorized at the 5th and 95th percentiles. The model includes year and industry fixed-effects based on the Fama-French 49 industry classifications. t-Statistics are presented in parenthesis below the coefficients and are corrected for heteroskedasticity, and cross-sectional and time-series correlation using a one-way cluster at the firm level. The number of observations varies because of data unavailability. ***, **, and * represent the 1%, 5%, and 10% significance levels, respectively.
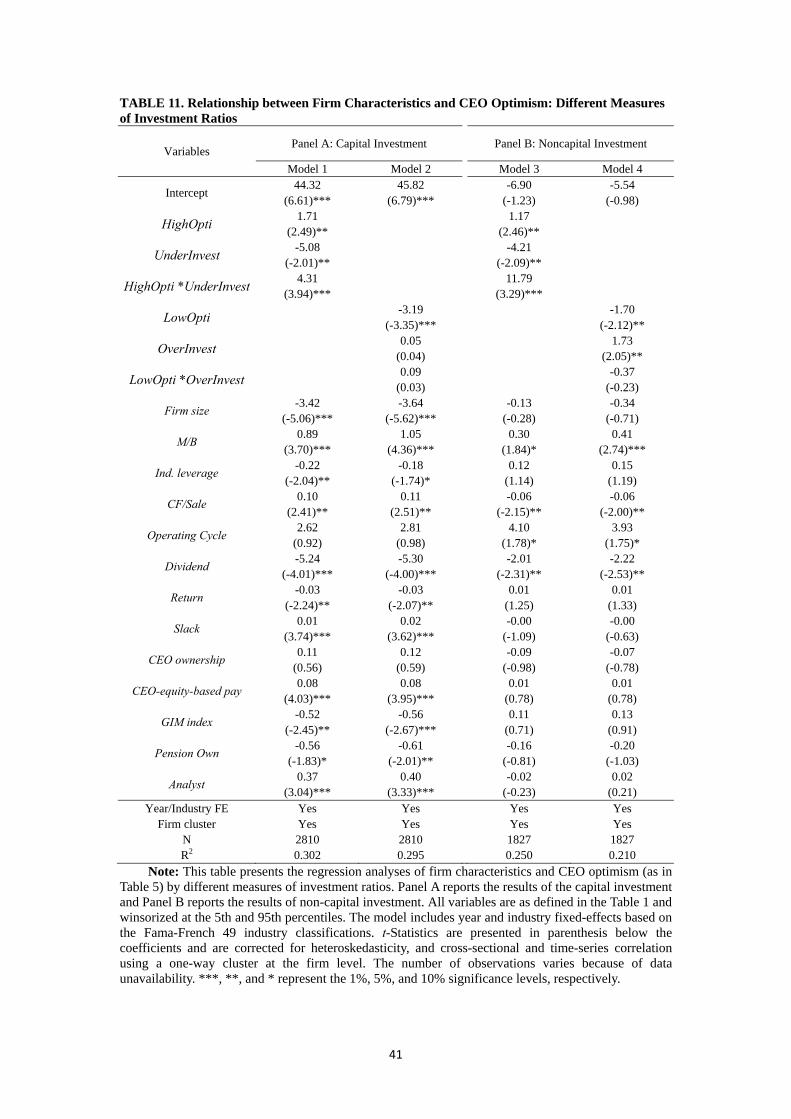
41
TABLE 11. Relationship between Firm Characteristics and CEO Optimism: Different Measures of Investment Ratios
Variables Panel A: Capital Investment Panel B: Noncapital Investment
Model 1 Model 2 Model 3 Model 4
Intercept 44.32 45.82 -6.90 -5.54
(6.61)*** (6.79)*** (-1.23) (-0.98)
HighOpti 1.71 1.17
(2.49)** (2.46)**
UnderInvest -5.08 -4.21
(-2.01)** (-2.09)**
HighOpti *UnderInvest 4.31 11.79
(3.94)*** (3.29)***
LowOpti -3.19 -1.70 (-3.35)*** (-2.12)**
OverInvest 0.05 1.73 (0.04) (2.05)**
LowOpti *OverInvest 0.09 -0.37 (0.03) (-0.23)
Firm size -3.42 -3.64 -0.13 -0.34
(-5.06)*** (-5.62)*** (-0.28) (-0.71)
M/B 0.89 1.05 0.30 0.41
(3.70)*** (4.36)*** (1.84)* (2.74)***
Ind. leverage -0.22 -0.18 0.12 0.15
(-2.04)** (-1.74)* (1.14) (1.19)
CF/Sale 0.10 0.11 -0.06 -0.06
(2.41)** (2.51)** (-2.15)** (-2.00)**
Operating Cycle 2.62 2.81 4.10 3.93
(0.92) (0.98) (1.78)* (1.75)*
Dividend -5.24 -5.30 -2.01 -2.22
(-4.01)*** (-4.00)*** (-2.31)** (-2.53)**
Return -0.03 -0.03 0.01 0.01
(-2.24)** (-2.07)** (1.25) (1.33)
Slack 0.01 0.02 -0.00 -0.00
(3.74)*** (3.62)*** (-1.09) (-0.63)
CEO ownership 0.11 0.12 -0.09 -0.07
(0.56) (0.59) (-0.98) (-0.78)
CEO-equity-based pay 0.08 0.08 0.01 0.01
(4.03)*** (3.95)*** (0.78) (0.78)
GIM index -0.52 -0.56 0.11 0.13
(-2.45)** (-2.67)*** (0.71) (0.91)
Pension Own -0.56 -0.61 -0.16 -0.20
(-1.83)* (-2.01)** (-0.81) (-1.03)
Analyst 0.37 0.40 -0.02 0.02
(3.04)*** (3.33)*** (-0.23) (0.21) Year/Industry FE Yes Yes Yes Yes
Firm cluster Yes Yes Yes Yes N 2810 2810 1827 1827 R2 0.302 0.295 0.250 0.210
Note: This table presents the regression analyses of firm characteristics and CEO optimism (as in Table 5) by different measures of investment ratios. Panel A reports the results of the capital investment and Panel B reports the results of non-capital investment. All variables are as defined in the Table 1 and winsorized at the 5th and 95th percentiles. The model includes year and industry fixed-effects based on the Fama-French 49 industry classifications. t-Statistics are presented in parenthesis below the coefficients and are corrected for heteroskedasticity, and cross-sectional and time-series correlation using a one-way cluster at the firm level. The number of observations varies because of data unavailability. ***, **, and * represent the 1%, 5%, and 10% significance levels, respectively.
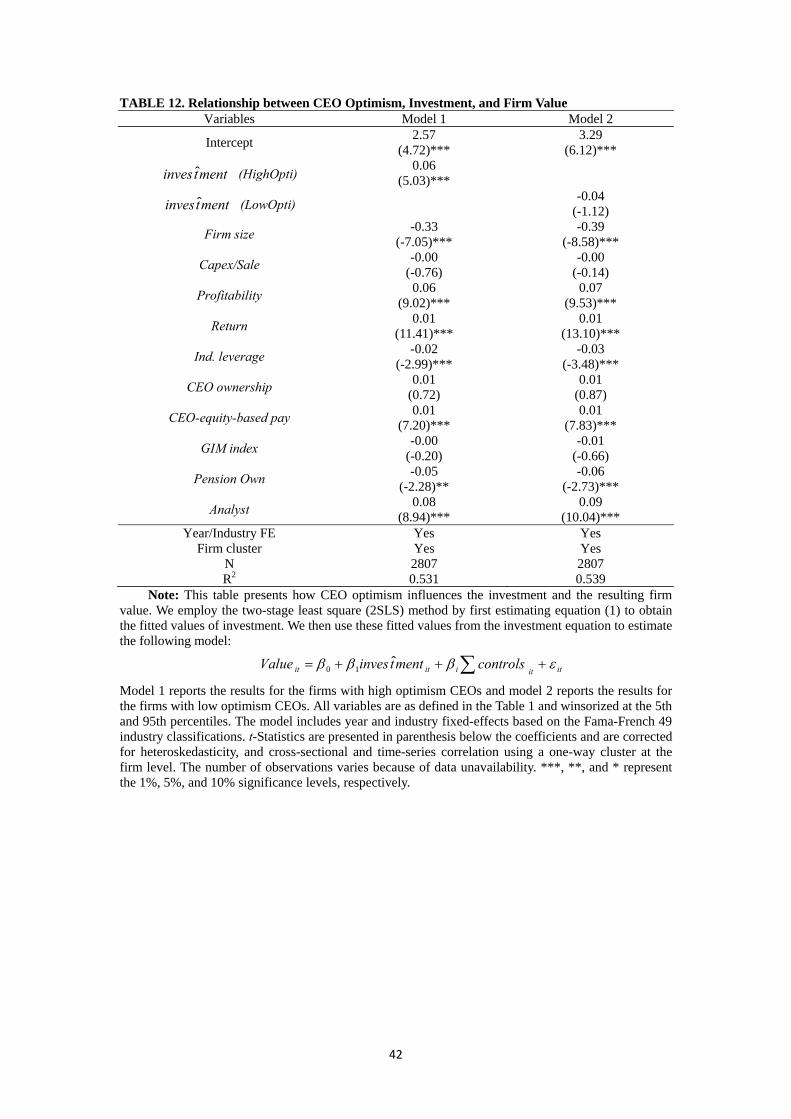
42
TABLE 12. Relationship between CEO Optimism, Investment, and Firm Value Variables Model 1 Model 2
Intercept 2.57 3.29
(4.72)*** (6.12)***
menttinves ˆ (HighOpti) 0.06
(5.03)***
menttinves ˆ (LowOpti) -0.04 (-1.12)
Firm size -0.33 -0.39
(-7.05)*** (-8.58)***
Capex/Sale -0.00 -0.00
(-0.76) (-0.14)
Profitability 0.06 0.07
(9.02)*** (9.53)***
Return 0.01 0.01
(11.41)*** (13.10)***
Ind. leverage -0.02 -0.03
(-2.99)*** (-3.48)***
CEO ownership 0.01 0.01
(0.72) (0.87)
CEO-equity-based pay 0.01 0.01
(7.20)*** (7.83)***
GIM index -0.00 -0.01
(-0.20) (-0.66)
Pension Own -0.05 -0.06
(-2.28)** (-2.73)***
Analyst 0.08 0.09
(8.94)*** (10.04)*** Year/Industry FE Yes Yes
Firm cluster Yes Yes N 2807 2807 R2 0.531 0.539
Note: This table presents how CEO optimism influences the investment and the resulting firm value. We employ the two-stage least square (2SLS) method by first estimating equation (1) to obtain the fitted values of investment. We then use these fitted values from the investment equation to estimate the following model:
ititiitit controlsmenttinvesValue ˆ10
Model 1 reports the results for the firms with high optimism CEOs and model 2 reports the results for the firms with low optimism CEOs. All variables are as defined in the Table 1 and winsorized at the 5th and 95th percentiles. The model includes year and industry fixed-effects based on the Fama-French 49 industry classifications. t-Statistics are presented in parenthesis below the coefficients and are corrected for heteroskedasticity, and cross-sectional and time-series correlation using a one-way cluster at the firm level. The number of observations varies because of data unavailability. ***, **, and * represent the 1%, 5%, and 10% significance levels, respectively.
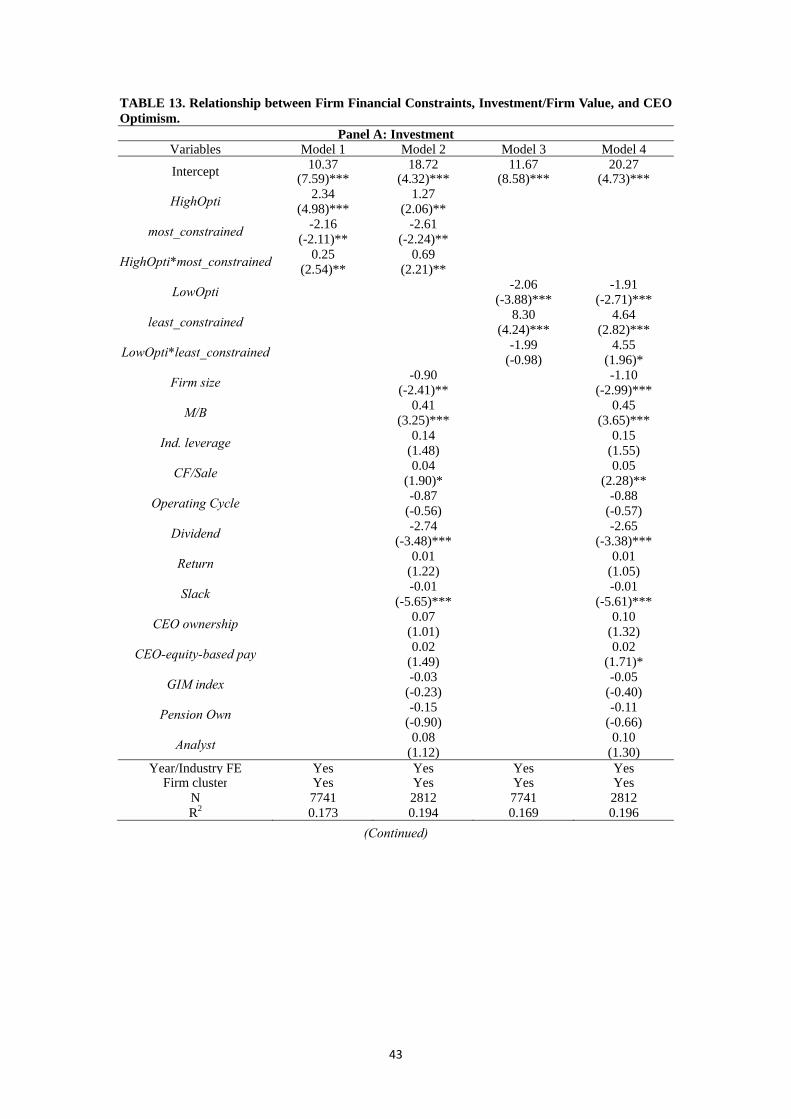
43
TABLE 13. Relationship between Firm Financial Constraints, Investment/Firm Value, and CEO Optimism.
Panel A: InvestmentVariables Model 1 Model 2 Model 3 Model 4
Intercept 10.37 18.72 11.67 20.27 (7.59)*** (4.32)*** (8.58)*** (4.73)***
HighOpti 2.34 1.27
(4.98)*** (2.06)**
most_constrained -2.16 -2.61
(-2.11)** (-2.24)**
HighOpti*most_constrained 0.25 0.69
(2.54)** (2.21)**
LowOpti -2.06 -1.91 (-3.88)*** (-2.71)***
least_constrained 8.30 4.64 (4.24)*** (2.82)***
LowOpti*least_constrained -1.99 4.55 (-0.98) (1.96)*
Firm size -0.90 -1.10 (-2.41)** (-2.99)***
M/B 0.41 0.45 (3.25)*** (3.65)***
Ind. leverage 0.14 0.15 (1.48) (1.55)
CF/Sale 0.04 0.05 (1.90)* (2.28)**
Operating Cycle -0.87 -0.88 (-0.56) (-0.57)
Dividend -2.74 -2.65 (-3.48)*** (-3.38)***
Return 0.01 0.01 (1.22) (1.05)
Slack -0.01 -0.01 (-5.65)*** (-5.61)***
CEO ownership 0.07 0.10 (1.01) (1.32)
CEO-equity-based pay 0.02 0.02 (1.49) (1.71)*
GIM index -0.03 -0.05 (-0.23) (-0.40)
Pension Own -0.15 -0.11 (-0.90) (-0.66)
Analyst 0.08 0.10 (1.12) (1.30)
Year/Industry FE Yes Yes Yes Yes Firm cluster Yes Yes Yes Yes
N 7741 2812 7741 2812 R2 0.173 0.194 0.169 0.196
(Continued)
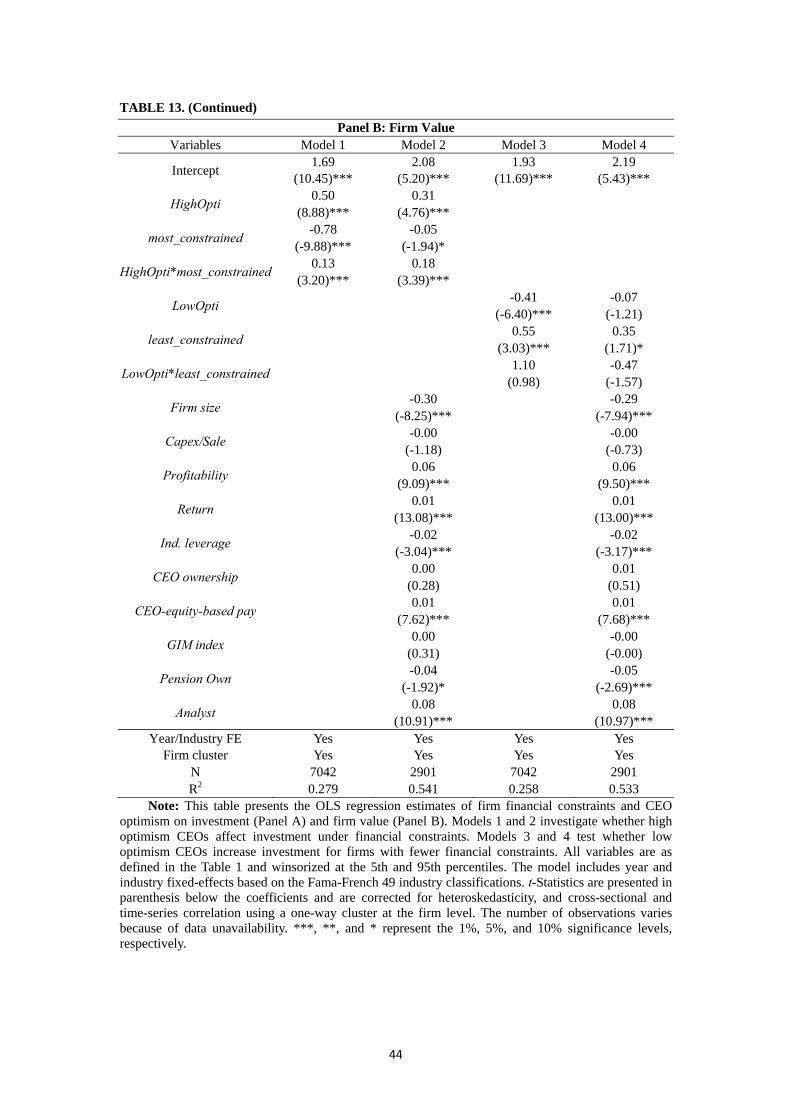
44
TABLE 13. (Continued)
Panel B: Firm ValueVariables Model 1 Model 2 Model 3 Model 4
Intercept 1.69 2.08 1.93 2.19
(10.45)*** (5.20)*** (11.69)*** (5.43)***
HighOpti 0.50 0.31
(8.88)*** (4.76)***
most_constrained -0.78 -0.05
(-9.88)*** (-1.94)*
HighOpti*most_constrained 0.13 0.18
(3.20)*** (3.39)***
LowOpti -0.41 -0.07 (-6.40)*** (-1.21)
least_constrained 0.55 0.35 (3.03)*** (1.71)*
LowOpti*least_constrained 1.10 -0.47 (0.98) (-1.57)
Firm size -0.30 -0.29 (-8.25)*** (-7.94)***
Capex/Sale -0.00 -0.00 (-1.18) (-0.73)
Profitability 0.06 0.06 (9.09)*** (9.50)***
Return 0.01 0.01 (13.08)*** (13.00)***
Ind. leverage -0.02 -0.02 (-3.04)*** (-3.17)***
CEO ownership 0.00 0.01 (0.28) (0.51)
CEO-equity-based pay 0.01 0.01 (7.62)*** (7.68)***
GIM index 0.00 -0.00 (0.31) (-0.00)
Pension Own -0.04 -0.05 (-1.92)* (-2.69)***
Analyst 0.08 0.08 (10.91)*** (10.97)***
Year/Industry FE Yes Yes Yes Yes Firm cluster Yes Yes Yes Yes
N 7042 2901 7042 2901 R2 0.279 0.541 0.258 0.533
Note: This table presents the OLS regression estimates of firm financial constraints and CEO optimism on investment (Panel A) and firm value (Panel B). Models 1 and 2 investigate whether high optimism CEOs affect investment under financial constraints. Models 3 and 4 test whether low optimism CEOs increase investment for firms with fewer financial constraints. All variables are as defined in the Table 1 and winsorized at the 5th and 95th percentiles. The model includes year and industry fixed-effects based on the Fama-French 49 industry classifications. t-Statistics are presented in parenthesis below the coefficients and are corrected for heteroskedasticity, and cross-sectional and time-series correlation using a one-way cluster at the firm level. The number of observations varies because of data unavailability. ***, **, and * represent the 1%, 5%, and 10% significance levels, respectively.