Management’s Discussion and Analysis - Reliance … AR 2013-14...the domestic macro-economic...
42
46 Reliance Industries Limited Annual Report 2013-14 Growth is Life... FORWARD-LOOKING STATEMENT The report contains forward-looking statements, identified by words like ‘plans’, ‘expects’, ‘will’, ‘anticipates’, ‘believes’, ‘intends’, ‘projects’, ‘estimates’ and so on. All statements that address expectations or projections about the future, but not limited to the Company’s strategy for growth, product development, market position, expenditures and financial results, are forward-looking statements. Since these are based on certain assumptions and expectations of future events, the Company cannot guarantee that these are accurate or will be realised. The Company’s actual results, performance or achievements could thus differ from those projected in any forward-looking statements. The Company assumes no responsibility to publicly amend, modify or revise any such statements on the basis of subsequent developments, information or events. OVERVIEW The global economy began its modest recovery in FY 2013- 14 with improved demand from OECD economies in the second half of 2013. While the trend is expected to accelerate in the current year, the positive outlook is subdued by the potential consequences of ‘tapering’ of some of the US Federal Reserve’s Quantitative Easing (QE) policies which were undertaken in the aftermath of global financial crises. Emerging markets like India faced multiple challenges: capital outflows, intense exchange rate pressures and volatile current account movement. A combination of persistent inflation, fiscal imbalances, external sector vulnerabilities and low investments resulted in sluggish domestic demand growth. Fiscal and monetary initiatives taken by the Indian government and the Reserve Bank of India (RBI) helped stabilise financial market conditions, but the domestic macro-economic environment still remains challenging. Economic recovery in the US and Europe had a positive impact on oil demand, which increased by 1.3 million barrels per day (MMBPD) in 2013. Crude oil prices fluctuated extensively, driven by supply concerns in Libya, South Sudan, West Africa and Iraq. Higher US shale oil production helped offset the impact of these disruptions with Brent crude oil prices averaging marginally lower at $ 108.7 per barrel in 2013. Operating in a volatile and uncertain environment, Reliance Industries Limited (RIL) demonstrated the resilience of its business model. RIL’s best-in-class refining configuration and integrated petrochemical business enabled it to deliver robust profits in FY 2013-14. The Company achieved: z Highest ever Revenue of ` 4,01,302 crore ($ 67.0 billion) and Net profit of ` 21,984 crore ($ 3.7 billion) z Record Exports of ` 2,75,825 crore ($ 46.0 billion) z Record Refining business EBIT ` 13,220 crore ($ 2.2 billion) z Highest ever consolidated Revenue and Net profit of ` 4,46,339 crore ($ 74.5 billion) and ` 22,493 crore ($ 3.8 billion) respectively z Dividend of 95%, highest ever payout of ` 3,268 crore ($ 545 million) Operationally, downstream segments continued to deliver superior performance with operating rates of over 100%. RIL processed 68.0 million tonnes (MMT) of crude oil at its Jamnagar refinery complex. The KG-D6 (JV) facility produced 2.31 million barrels (MMBL) of crude and condensate and 178.3 billion cubic feet (BCF) of natural gas. RIL’s share of gross JV production in US Shale was 154 BCFe in 2013 reflecting a growth of 52% over previous year. The Company featured in the Fortune Global 500 list of the world’s largest corporations for the tenth consecutive year and was ranked 107 th in terms of revenues and 128 th in terms of profits. HIGHLIGHTS AND KEY EVENTS RIL delivered strong results across its refining, petrochemicals and international E&P businesses whilst continuing to grow and invest in its energy value chain. In addition, substantial progress was made in consumer-facing businesses - retail and telecom. Management’s Discussion and Analysis ` 4,46,339 crore ($ 74.5 billion) highest ever consolidated revenue Record Revenues
Transcript of Management’s Discussion and Analysis - Reliance … AR 2013-14...the domestic macro-economic...

4702-33 Company Overview
165-270 Financial Statements
271-284 Shareholders’ Referencer
34-164 Statutory Reports46
Reliance Industries LimitedAnnual Report 2013-14 Growth is Life...
FORWARD-LOOKING STATEMENTThe report contains forward-looking statements, identified by words like ‘plans’, ‘expects’, ‘will’, ‘anticipates’, ‘believes’, ‘intends’, ‘projects’, ‘estimates’ and so on. All statements that address expectations or projections about the future, but not limited to the Company’s strategy for growth, product development, market position, expenditures and financial results, are forward-looking statements. Since these are based on certain assumptions and expectations of future events, the Company cannot guarantee that these are accurate or will be realised. The Company’s actual results, performance or achievements could thus differ from those projected in any forward-looking statements. The Company assumes no responsibility to publicly amend, modify or revise any such statements on the basis of subsequent developments, information or events.
OVERVIEWThe global economy began its modest recovery in FY 2013-14 with improved demand from OECD economies in the second half of 2013. While the trend is expected to accelerate in the current year, the positive outlook is subdued by the potential consequences of ‘tapering’ of some of the US Federal Reserve’s Quantitative Easing (QE) policies which were undertaken in the aftermath of global financial crises. Emerging markets like India faced multiple challenges: capital outflows, intense exchange rate pressures and volatile current account movement. A combination of
persistent inflation, fiscal imbalances, external sector vulnerabilities and low investments resulted in sluggish domestic demand growth. Fiscal and monetary initiatives taken by the Indian government and the Reserve Bank of India (RBI) helped stabilise financial market conditions, but the domestic macro-economic environment still remains challenging.
Economic recovery in the US and Europe had a positive impact on oil demand, which increased by 1.3 million barrels per day (MMBPD) in 2013. Crude oil prices fluctuated extensively, driven by supply concerns in Libya, South Sudan, West Africa and Iraq. Higher US shale oil production helped offset the impact of these disruptions with Brent crude oil prices averaging marginally lower at $ 108.7 per barrel in 2013.
Operating in a volatile and uncertain environment, Reliance Industries Limited (RIL) demonstrated the resilience of its business model. RIL’s best-in-class refining configuration and integrated petrochemical business enabled it to deliver robust profits in FY 2013-14. The Company achieved:
zz Highest ever Revenue of ` 4,01,302 crore ($ 67.0 billion) and Net profit of ` 21,984 crore ($ 3.7 billion)
zz Record Exports of ` 2,75,825 crore ($ 46.0 billion)
zz Record Refining business EBIT ` 13,220 crore ($ 2.2 billion)
zz Highest ever consolidated Revenue and Net profit of ` 4,46,339 crore ($ 74.5 billion) and ` 22,493 crore ($ 3.8 billion) respectively
zz Dividend of 95%, highest ever payout of ` 3,268 crore ($ 545 million)
Operationally, downstream segments continued to deliver superior performance with operating rates of over 100%. RIL processed 68.0 million tonnes (MMT) of crude oil at its Jamnagar refinery complex. The KG-D6 (JV) facility produced 2.31 million barrels (MMBL) of crude and condensate and 178.3 billion cubic feet (BCF) of natural gas. RIL’s share of gross JV production in US Shale was 154 BCFe in 2013 reflecting a growth of 52% over previous year.
The Company featured in the Fortune Global 500 list of the world’s largest corporations for the tenth consecutive year and was ranked 107th in terms of revenues and 128th in terms of profits.
HIGHLIGHTS AND KEY EVENTSRIL delivered strong results across its refining, petrochemicals and international E&P businesses whilst continuing to grow and invest in its energy value chain. In addition, substantial progress was made in consumer-facing businesses - retail and telecom.
Management’s Discussion and Analysis
` 4,46,339
crore
($ 74.5 billion)highest ever consolidated revenue
Record Revenues

4702-33 Company Overview
165-270 Financial Statements
271-284 Shareholders’ Referencer
34-164 Statutory Reports46
Reliance Industries LimitedAnnual Report 2013-14 Growth is Life...
Refining – Record earnings The refining business had a record performance during the year delivering the highest ever annual contribution to the Company’s EBIT. RIL’s refining margins at $ 8.1/bbl significantly outperformed regional benchmarks as the superior configuration of its refineries enabled it to benefit from stable middle distillate margins and widening light-heavy crude oil differentials.
Petrochemicals – New PFY plant commissioned Petrochemical business EBIT margins improved to 8.9% from 8.3% in the previous year driving a 17.5% growth in EBIT to ̀ 8,612 crore, with an improvement in polymer chain margins.
Polyester Filament Yarn (PFY) plant at Silvassa was commissioned successfully during FY 2013-14. Three products Partially Oriented Yarn (POY), Fully Drawn Yarn (FDY) and Polyester Textured Yarn (PTY) are being produced at the site and all units are now fully operational. The new PFY plant at Silvassa is one of the most automated and environment friendly plants globally. It is co-located with RIL’s existing texturizing facility at Silvassa eliminating the packaging and logistics costs. The entire production from this facility has been successfully placed in the domestic and international markets. With the commissioning of this ultra-modern PFY facility, RIL’s total PFY capacity, including the facilities at Recron (wholly owned subsidiary in Malaysia) is now in excess of 1.5 MMTPA. The polyester
facility is the first amongst a series of projects which will add significantly to RIL’s petrochemical volumes and enhance cost-competitiveness.
Oil & Gas – New discoveries and growth in ShaleThe US shale gas business is now a material contributor to RIL’s consolidated profits. The shale business delivered revenues of $ 819 million and EBITDA of $ 616 million in 2013 on the back of a 52% growth in volumes to 154 BCFe. Proved reserves of shale gas increased 43% to 2.66 TCFe.
In May 2013, RIL and its partners made a significant gas and condensate discovery (MJ-1) in the KG-D6 block of Krishna Godavari basin, off the eastern coast of India. This discovery is expected to add to the hydrocarbon resources in the KG-D6 block.
In August 2013, RIL and BP also announced a new gas condensate discovery off India’s east coast in the Cauvery basin. The discovery, in the deepwater block CY-D5, is situated 62 kilometres from the coast in the Cauvery Basin and is the second gas discovery in the block.
Retail business – India’s largest retail chainReliance Retail has become India’s largest retailer by revenues. FY 2013-14 revenues grew 34% to ` 14,496 crore, while EBITDA was at ` 363 crore. The retail business also achieved two major milestones in FY 2013-14. It crossed 10 million square feet of retail space and broke even on a net profit basis during the year. The Company enhanced its presence across various format sectors. Reliance Retail now operates 1,691 stores across 146 cities.
Reliance Jio – accelerated efforts to roll-out 4G servicesReliance Jio Infocomm Ltd. (RJIL) successfully acquired the right to use spectrum in 14 key circles across India in the 1,800 MHz band in the spectrum auction conducted by Department of Telecommunications (DoT), Government
New polyester facility at Silvassa
Record Earnings
` 22,493crore
($ 3.8 billion)highest ever consolidated net profit
Management’s Discussion and Analysis (Continued)
4902-33 Company Overview
165-270 Financial Statements
271-284 Shareholders’ Referencer
34-164 Statutory Reports48
Reliance Industries LimitedAnnual Report 2013-14 Growth is Life...
of India (GoI). RJIL will use this spectrum in conjunction with its pan India 2,300 MHz spectrum acquired earlier to provide seamless 4G services using FDD-LTE on 1,800 MHz and TDD-LTE on 2,300 MHz through an integrated ecosystem. Following the acquisition, RJIL holds the largest quantum of liberalised spectrum, with the longest residual spectrum life.
Earlier in the year, RJIL received Unified License for all 22 Service Areas across India and became the first telecom operator in the country to get a pan India license. The license allows RJIL to offer all telecom services including voice telephony under a single license. The Company has migrated from its existing ISP license, along with Broadband Wireless Access (BWA) spectrum, to the Unified License.
FINANCIAL PERFORMANCE AND REVIEW
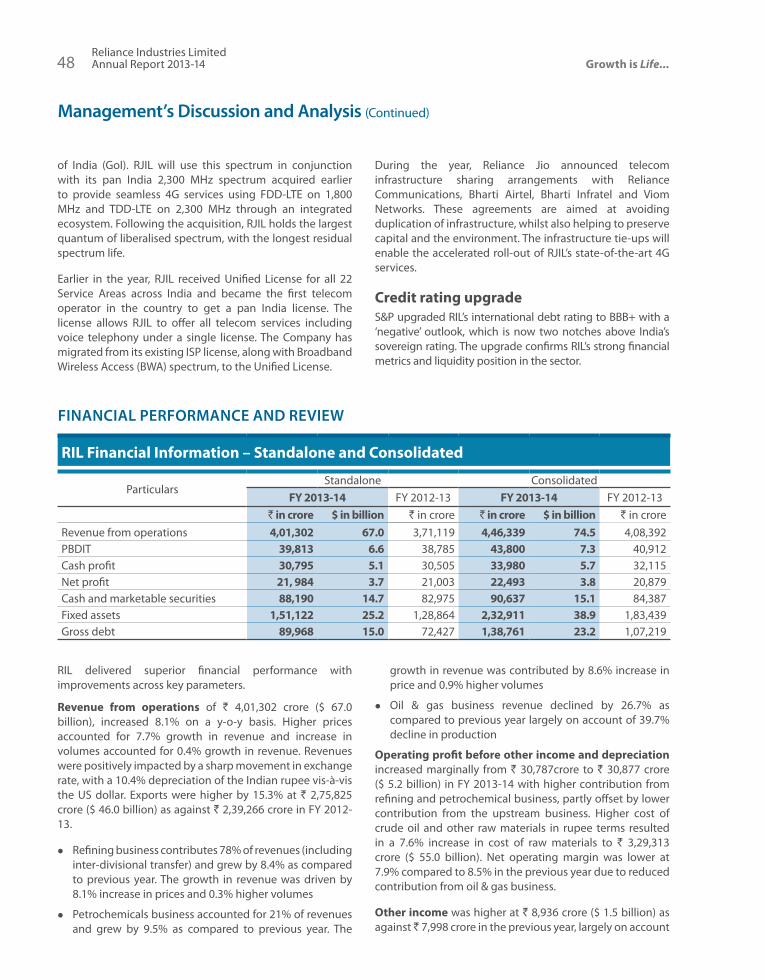
RIL Financial Information – Standalone and Consolidated
ParticularsStandalone Consolidated
FY 2013-14 FY 2012-13 FY 2013-14 FY 2012-13` in crore $ in billion ` in crore ` in crore $ in billion ` in crore
Revenue from operations 4,01,302 67.0 3,71,119 4,46,339 74.5 4,08,392PBDIT 39,813 6.6 38,785 43,800 7.3 40,912Cash profit 30,795 5.1 30,505 33,980 5.7 32,115Net profit 21, 984 3.7 21,003 22,493 3.8 20,879Cash and marketable securities 88,190 14.7 82,975 90,637 15.1 84,387Fixed assets 1,51,122 25.2 1,28,864 2,32,911 38.9 1,83,439Gross debt 89,968 15.0 72,427 1,38,761 23.2 1,07,219
During the year, Reliance Jio announced telecom infrastructure sharing arrangements with Reliance Communications, Bharti Airtel, Bharti Infratel and Viom Networks. These agreements are aimed at avoiding duplication of infrastructure, whilst also helping to preserve capital and the environment. The infrastructure tie-ups will enable the accelerated roll-out of RJIL’s state-of-the-art 4G services.
Credit rating upgradeS&P upgraded RIL’s international debt rating to BBB+ with a ‘negative’ outlook, which is now two notches above India’s sovereign rating. The upgrade confirms RIL’s strong financial metrics and liquidity position in the sector.
RIL delivered superior financial performance with improvements across key parameters.
Revenue from operations of ` 4,01,302 crore ($ 67.0 billion), increased 8.1% on a y-o-y basis. Higher prices accounted for 7.7% growth in revenue and increase in volumes accounted for 0.4% growth in revenue. Revenues were positively impacted by a sharp movement in exchange rate, with a 10.4% depreciation of the Indian rupee vis-à-vis the US dollar. Exports were higher by 15.3% at ` 2,75,825 crore ($ 46.0 billion) as against ` 2,39,266 crore in FY 2012-13.
zz Refining business contributes 78% of revenues (including inter-divisional transfer) and grew by 8.4% as compared to previous year. The growth in revenue was driven by 8.1% increase in prices and 0.3% higher volumes
zz Petrochemicals business accounted for 21% of revenues and grew by 9.5% as compared to previous year. The
growth in revenue was contributed by 8.6% increase in price and 0.9% higher volumes
zz Oil & gas business revenue declined by 26.7% as compared to previous year largely on account of 39.7% decline in production
Operating profit before other income and depreciation increased marginally from ` 30,787crore to ` 30,877 crore ($ 5.2 billion) in FY 2013-14 with higher contribution from refining and petrochemical business, partly offset by lower contribution from the upstream business. Higher cost of crude oil and other raw materials in rupee terms resulted in a 7.6% increase in cost of raw materials to ` 3,29,313 crore ($ 55.0 billion). Net operating margin was lower at 7.9% compared to 8.5% in the previous year due to reduced contribution from oil & gas business.
Other income was higher at ` 8,936 crore ($ 1.5 billion) as against ̀ 7,998 crore in the previous year, largely on account
4902-33 Company Overview
165-270 Financial Statements
271-284 Shareholders’ Referencer
34-164 Statutory Reports48
Reliance Industries LimitedAnnual Report 2013-14 Growth is Life...
of higher investible surplus. Other income includes interest income of ` 6,472 crore and investment income of ` 2,348 crore.
Interest cost was higher at ` 3,206 crore ($ 535 million) as against ` 3,036 crore in FY 2012-13. With majority of the Company’s borrowing in foreign currency, sharp rupee depreciation during the year negatively impacted interest costs. This resulted in gross interest cost being higher at ` 3,907 crore ($ 652 million) as against ` 3,421 crore in FY 2012-13. Interest capitalised was higher at ` 701 crore ($ 117 million) as against ` 385 crore last year, on account of the large on-going capex programme.
Depreciation (including depletion and amortisation) was lower by 7.1% at ` 8,789 crore ($ 1.5 billion) as against ` 9,465 crore in FY 2012-13. This was primarily due to lower depletion charges, in-line with decline in upstream oil & gas production.
Tax expenses for the year increased to ` 5,834 crore ($ 974 million) as compared to ` 5,281 crore in the previous year.
Profit after tax for the year was at ` 21,984 crore ($ 3.7 billion) an increase of 4.7% over ` 21,003 crore in the previous year. Growth in net profit was led by higher operating income from the refining and petrochemical businesses, higher other income and lower depreciation.
The basic and diluted EPS for the year was ` 68.0 per share as compared to ` 64.8 per share in FY 2012-13 registering a growth of 4.9%.
The Board of Directors have recommended, subject to approval of shareholders, a dividend of 95% amounting to ` 3,268 crore ($ 545 million), including dividend distribution tax. This shall be the highest payout ever by RIL and balances on-going capex commitments and shareholder interests.
Return on capital employed was at 11.5% and return on equity was at 12.9%. Return ratios improved marginally compared to the previous year with stronger performance in refining and petrochemical businesses.
RIL’s consolidated revenue from operations for FY 2013-14 was ` 4,46,339 crore ($ 74.5 billion), an increase of 9.3% on a y-o-y basis. Consolidated profit after tax was at ` 22,493 crore ($ 3.8 billion), an increase of 7.7% against ` 20,879 crore in the previous year. EPS on consolidated basis for the year was at ` 76.5 as against ` 70.7 in the previous year. Key contributors to incremental consolidated revenues and profit were the US shale operations and domestic retail business.
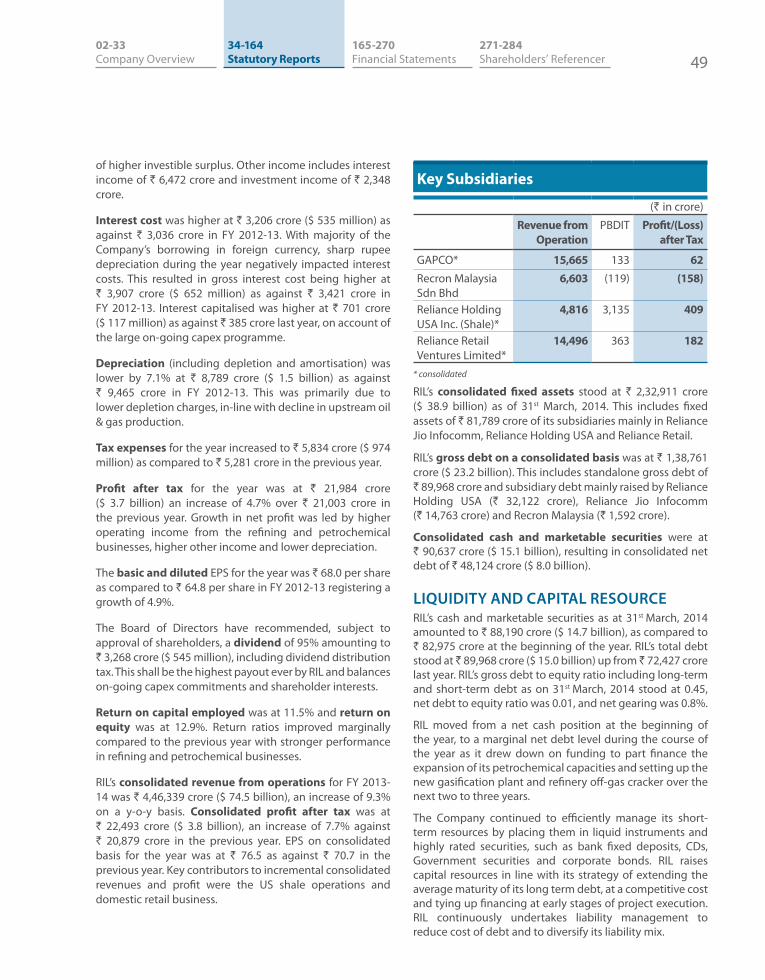
Key Subsidiaries
(` in crore)
Revenue from Operation
PBDIT Profit/(Loss) after Tax
GAPCO* 15,665 133 62Recron Malaysia Sdn Bhd
6,603 (119) (158)
Reliance Holding USA Inc. (Shale)*
4,816 3,135 409
Reliance Retail Ventures Limited*
14,496 363 182
* consolidated
RIL’s consolidated fixed assets stood at ` 2,32,911 crore ($ 38.9 billion) as of 31st March, 2014. This includes fixed assets of ` 81,789 crore of its subsidiaries mainly in Reliance Jio Infocomm, Reliance Holding USA and Reliance Retail.
RIL’s gross debt on a consolidated basis was at ` 1,38,761 crore ($ 23.2 billion). This includes standalone gross debt of ` 89,968 crore and subsidiary debt mainly raised by Reliance Holding USA (` 32,122 crore), Reliance Jio Infocomm (` 14,763 crore) and Recron Malaysia (` 1,592 crore).
Consolidated cash and marketable securities were at ` 90,637 crore ($ 15.1 billion), resulting in consolidated net debt of ` 48,124 crore ($ 8.0 billion).
LIQUIDITY AND CAPITAL RESOURCERIL’s cash and marketable securities as at 31st March, 2014 amounted to ` 88,190 crore ($ 14.7 billion), as compared to ` 82,975 crore at the beginning of the year. RIL’s total debt stood at ̀ 89,968 crore ($ 15.0 billion) up from ̀ 72,427 crore last year. RIL’s gross debt to equity ratio including long-term and short-term debt as on 31st March, 2014 stood at 0.45, net debt to equity ratio was 0.01, and net gearing was 0.8%.
RIL moved from a net cash position at the beginning of the year, to a marginal net debt level during the course of the year as it drew down on funding to part finance the expansion of its petrochemical capacities and setting up the new gasification plant and refinery off-gas cracker over the next two to three years.
The Company continued to efficiently manage its short-term resources by placing them in liquid instruments and highly rated securities, such as bank fixed deposits, CDs, Government securities and corporate bonds. RIL raises capital resources in line with its strategy of extending the average maturity of its long term debt, at a competitive cost and tying up financing at early stages of project execution. RIL continuously undertakes liability management to reduce cost of debt and to diversify its liability mix.

Management’s Discussion and Analysis (Continued)
5102-33 Company Overview
165-270 Financial Statements
271-284 Shareholders’ Referencer
34-164 Statutory Reports50
Reliance Industries LimitedAnnual Report 2013-14 Growth is Life...
RIL’s financial discipline and prudence is reflected in the strong credit ratings ascribed by rating agencies.
In May 2013, S&P upgraded RIL’s international debt rating to BBB+ with a ‘negative’ outlook which is two notches above India’s sovereign rating. S&P’s rating upgrade took cognizance of RIL’s plans to invest significantly in growing its businesses over the next 3 years. S&P believes that the expansion program would further strengthen RIL’s competitive position and profitability. The upgrade confirms RIL’s strong financial metrics and liquidity position in the sector.
Moody’s has rated RIL’s international debt at investment grade Baa2, with ‘positive’ outlook which is one notch above India’s sovereign rating.
RIL’s long-term debt is rated AAA by CRISIL and ‘Ind AAA’ by Fitch, the highest rating awarded by both these agencies. Similarly, RIL’s short-term debt is rated P1+ by CRISIL, the highest credit rating assigned in this category.
RIL’s superior credit profile is reflected in its lending relationships, with over 100 banks and financial institutions having commitments to RIL.
In continuation of the fund raising programme initiated in FY 2012-13, RIL tied up facilities of around $ 3.15 billion equivalent to part finance the petrochemical expansions and petcoke gasification projects through landmark transactions.
During FY 2013-14, RIL signed $ 500 million equivalent facilities backed by two Export Credit Agencies (ECAs) which included $ 300 million facility from Export Credits Guarantee Department (ECGD), the UK ECA, and $ 200 million equivalent facility from The Compagnie Française d’Assurance pour le Commerce Extérieur (COFACE), the French ECA. These facilities will be drawn over the next two to three years as the projects progress and will have a door-to-door tenor of over 10 to 13 years. These deals were accorded ‘Better than Sovereign’ rating by both the ECAs. This is the first time these agencies accorded such a rating to any corporate in their history, re-emphasising RIL’s creditworthiness in international debt markets.
For the ECA deals, RIL has received the ‘TFR Deals of the Year’ award for 2013 from Trade and Forfaiting Review, ‘Deals of the Year 2013’ award from Trade Finance Magazine and ‘GTR Best Deal of 2013’ award from Global Trade Review and ‘TFX Perfect 10 Deals of the Year’ award for 2013 from Trade and Export Finance.
The syndicated loan deal of $ 1.75 billion equivalent completed during the year represented the largest bank group in Asia in the last two years. The deal enjoyed a strong participation of 30 international banks, despite turbulent market conditions. This unsecured syndicated loan has a tenor in excess of five years and has one of the longest tenors for a senior unsecured corporate loan in Asia this year.
Additionally, loans aggregating $ 900 million were raised through a mix of club and bilateral loans during a period of extreme volatility in INR/USD currency with the INR witnessing sharp depreciation. One of the loans (8.75 years tenor) probably has the longest tenor for a senior unsecured corporate loan in Asia in 2013.
During FY 2013-14, Reliance Holding USA Inc. (RHUSA) through its wholly owned subsidiary tied up five year revolving reserve based lending facility with a maximum commitment of $ 300 million to finance the capital expenditure. With this, the total reserve based lending commitments of RHUSA across its subsidiaries aggregates to a maximum of $ 1.3 billion. In addition to this, another wholly owned subsidiary of RHUSA executed a five year unsecured term loan facility with a maximum commitment of $ 350 million.
Superior Financial Strength
Investment grade ratings from S&P and Moody’s
5102-33 Company Overview
165-270 Financial Statements
271-284 Shareholders’ Referencer
34-164 Statutory Reports50
Reliance Industries LimitedAnnual Report 2013-14 Growth is Life...
During FY 2013-14, Reliance Jio Infocomm Limited raised financing from banks and other institutions aggregating over ` 3,700 crore to part finance the capital expenditure.
RIL has also been awarded the ‘Best Borrower of the Year 2013 in Asia’ by Finance Asia and ‘Best Issuer of the Year 2013 in Asia’ by The Asset, two of Asia’s leading financial publications.
97.0% of long-term debt and 62.3% of RIL’s short-term debt were denominated in foreign currencies. The proportion of long-term debt to total debt is 74.7%.
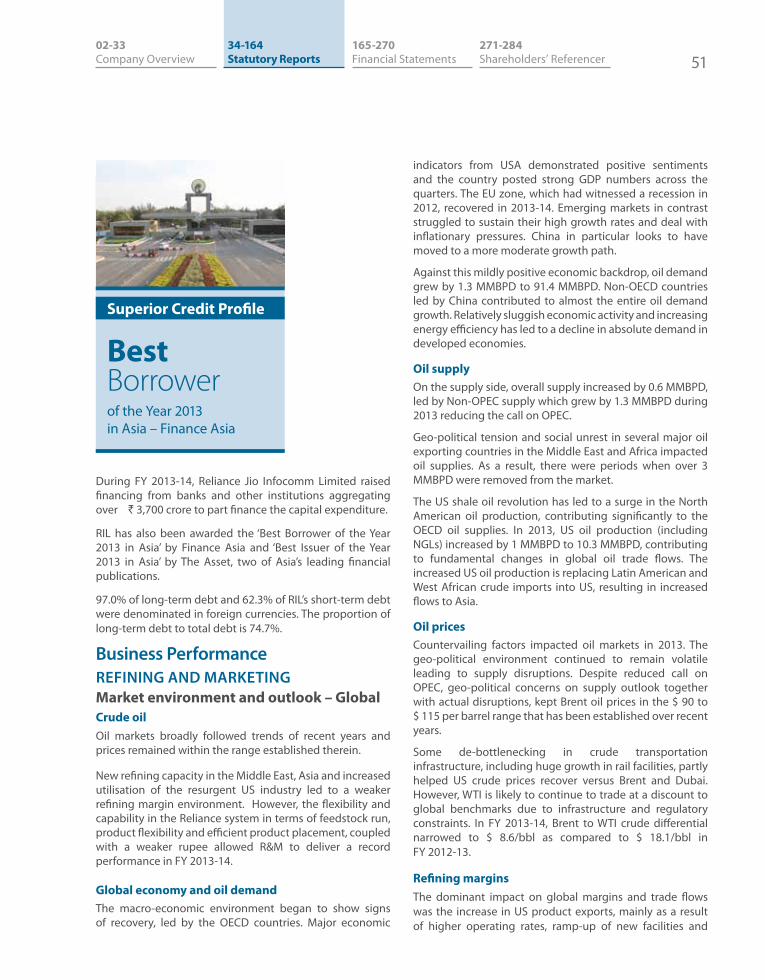
Business PerformanceREFINING AND MARKETINGMarket environment and outlook – Global Crude oilOil markets broadly followed trends of recent years and prices remained within the range established therein.
New refining capacity in the Middle East, Asia and increased utilisation of the resurgent US industry led to a weaker refining margin environment. However, the flexibility and capability in the Reliance system in terms of feedstock run, product flexibility and efficient product placement, coupled with a weaker rupee allowed R&M to deliver a record performance in FY 2013-14.
Global economy and oil demand The macro-economic environment began to show signs of recovery, led by the OECD countries. Major economic
indicators from USA demonstrated positive sentiments and the country posted strong GDP numbers across the quarters. The EU zone, which had witnessed a recession in 2012, recovered in 2013-14. Emerging markets in contrast struggled to sustain their high growth rates and deal with inflationary pressures. China in particular looks to have moved to a more moderate growth path.
Against this mildly positive economic backdrop, oil demand grew by 1.3 MMBPD to 91.4 MMBPD. Non-OECD countries led by China contributed to almost the entire oil demand growth. Relatively sluggish economic activity and increasing energy efficiency has led to a decline in absolute demand in developed economies.
Oil supplyOn the supply side, overall supply increased by 0.6 MMBPD, led by Non-OPEC supply which grew by 1.3 MMBPD during 2013 reducing the call on OPEC.
Geo-political tension and social unrest in several major oil exporting countries in the Middle East and Africa impacted oil supplies. As a result, there were periods when over 3 MMBPD were removed from the market.
The US shale oil revolution has led to a surge in the North American oil production, contributing significantly to the OECD oil supplies. In 2013, US oil production (including NGLs) increased by 1 MMBPD to 10.3 MMBPD, contributing to fundamental changes in global oil trade flows. The increased US oil production is replacing Latin American and West African crude imports into US, resulting in increased flows to Asia.
Oil prices Countervailing factors impacted oil markets in 2013. The geo-political environment continued to remain volatile leading to supply disruptions. Despite reduced call on OPEC, geo-political concerns on supply outlook together with actual disruptions, kept Brent oil prices in the $ 90 to $ 115 per barrel range that has been established over recent years.
Some de-bottlenecking in crude transportation infrastructure, including huge growth in rail facilities, partly helped US crude prices recover versus Brent and Dubai. However, WTI is likely to continue to trade at a discount to global benchmarks due to infrastructure and regulatory constraints. In FY 2013-14, Brent to WTI crude differential narrowed to $ 8.6/bbl as compared to $ 18.1/bbl in FY 2012-13.
Refining marginsThe dominant impact on global margins and trade flows was the increase in US product exports, mainly as a result of higher operating rates, ramp-up of new facilities and
Superior Credit Profile
Best Borrower of the Year 2013 in Asia – Finance Asia

Management’s Discussion and Analysis (Continued)
5302-33 Company Overview
165-270 Financial Statements
271-284 Shareholders’ Referencer
34-164 Statutory Reports52
Reliance Industries LimitedAnnual Report 2013-14 Growth is Life...
addition of some simple refining capacity. New capacity also came on-stream in China and in the Middle East – with the Jubail refinery ramping up production during the year.
On the positive side - impact of material closures in the Atlantic region last year, high incidences of unplanned outages and delayed commissioning of refineries, provided some support to margins. Demand for refined products was also higher than estimates at the beginning of the year. On an annualised basis margins were weaker as compared to the previous year.
The year witnessed significant divergence in regional margins. US refineries benefitted from low energy and cheap feedstock prices. While the narrowing of Brent-WTI differential had a negative impact, absolute refining margins in the US continue to be at high levels. Growth in demand emanated largely from the Eastern hemisphere, providing support to Asian margins, including Reliance. European refining margins witnessed dual pressure on account of increased import availability from the US and ME region and weak local demand. Continued margin pressure on European refining system could lead to further capacity rationalisation.
RIL refining margins outperformed Singapore benchmark, widening the premium over the benchmark to $ 2.2/bbl during FY 2013-14. RIL benefited from its ability to run advantaged feedstock, flexibility to upgrade low value products and the capacity to switch production to the most valuable product as the market evolved.
Product Cracks
Asian Cracks - $/bbl 1Q 2Q 3Q 4Q FY
2013-14FY
2012-13Naphtha -7.1 -5.8 -3.0 -1.5 -4.3 -5.0Gasoline 14.6 12.4 9.2 14.6 12.7 15.4Jet 15.3 17.0 17.3 17.0 16.7 18.9Gasoil 16.8 17.3 17.7 17.8 17.4 19.5Fuel Oil -3.6 -10.7 -10.4 -8.5 -8.3 -5.0Singapore Complex GRM
6.7 6.0 5.4 6.2 5.9 7.7
RIL GRM 8.4 7.7 7.6 9.3 8.1 9.2Rotterdam (Brent) GRM
5.7 1.8 3.8 4.2 3.9 6.9
USGC (WTI) GRM
16.2 6.1 8.5 11.7 10.6 23.1
Source : Reuters
Middle distillatesMiddle distillates (diesel and jet/kerosene) continued to remain the key contributors to complex refining margins. In 2013, middle distillate demand grew by over 450 KBD,
contributing almost 35% of global oil demand growth. In line with seasonal patterns, gasoil cracks started low in the first quarter but gained strength through the year as demand picked up. Demand for gasoil remained supported by growing industrial activity and a colder-than-expected winter in the US. Subsidies on diesel in most of the emerging Asian economies continue to support strong demand growth.
Jet witnessed a low margin environment throughout the year amid ample supplies and warmer weather in North Asia, where kerosene is used for heating.
Indian diesel demand shrank by 1%, the first decline in over a decade. This was partly in response to the slowdown in industrial activity and in part due to the removal of subsidies to the commercial sector.
Light distillatesLight ends witnessed a mixed year. Gasoline cracks remained subdued through the major part of the year, except the US driving season and the last quarter of the year. The cracks averaged lower at $ 12.7/bbl during the year as compared to $ 15.4/bbl in the previous year. Naphtha cracks held relatively stable during the first half of the FY 2013-14 amid an increase in naphtha demand from Asian petrochemical sector while the overall naphtha supply swelled. Cracks improved during the second half of the year on back of firm petrochemical demand.
Freezing temperatures across US provided significant support to light-ends during the winter period. Material increase in use of propane for heating in US resulted in higher LPG prices globally. This supported naphtha prices as an alternate feedstock for crackers.
Fuel oil Fuel Oil (FO) cracks were strong in the first quarter of FY 2013-14, due to restricted supply of blending components to produce on-spec marine fuels. Cracks were also supported by reduction in Russian exports of Straight Run Fuel Oil due to the start of new upgrading capacities. On
Port facility at Jamnagar

5302-33 Company Overview
165-270 Financial Statements
271-284 Shareholders’ Referencer
34-164 Statutory Reports52
Reliance Industries LimitedAnnual Report 2013-14 Growth is Life...
the demand side, teakettle refineries reduced throughput and used crude as feedstock due to poor margins, capping further gains. However, FO cracks collapsed in the second half of the year, on account of weak bunker demand in Asia, higher stocks and below average Japanese power sector demand. Cracks improved marginally in January due to seasonal winter demand, lower inflows from west and improved demand as feedstock from teakettle refineries ahead of Lunar New Year. Subsequently, cracks have drifted lower on flat bunker demand.
RIL is able to upgrade its heavy liquid products into higher value products, and largely tends to benefit in weakness of fuel oil as it lowers the prices of heavy crude oil.
Crude differentialsA key determinant of complex refining margins has been the differential between light and heavy crudes. Arab Light – Heavy crude differential widened to $ 4.2/bbl in FY 2013-14 as compared to $ 3.6/bbl in the previous year. Heavier crudes, particularly from Latin American sources were also available at significantly higher differentials during FY 2013-14 with incremental light oil supply in North America. While new refineries that are getting built are increasingly complex and require heavy crudes as feedstock, crude production increase is more on the lighter side over the next few years supporting wider Light-Heavy differentials in the coming years.
New refinery additions and expansions in existing refineries were partly offset by closures in the US, Europe and Japan, leading to a net capacity addition of about 0.9 MMBPD; oil demand growth was higher at 1.3 MMBPD, with a reversal of the declining trend in OECD demand witnessed over the last three years.
These refinery closures also resulted in improved average refinery utilisation rates in North America (84.8% in 2013 compared to 84.1% in 2012). However, in Europe, utilisation rates (76.4% compared to 79.8% in 2012) decreased due to weak margins. Asian operating rates were at 85.4%.
Refining business and competitive positionRIL’s core business model for R&M segment is to acquire the most advantageous crudes from across the world, process them optimally using its complex refining assets and place high quality products in the most profitable markets using its supply chain/logistics infrastructure. Along with this, RIL manages operational, financial (business) and regulatory risks efficiently, which helps outperformance over its regional peers.
Scale and complexityThe scale and complexity of RIL’s assets strongly support its business model. The Jamnagar supersite, which processes
close to 1.4 MMBPD of crude, is among the largest and most complex refining assets in the world. It is composed of two refinery systems, one of which caters to domestic and export demand while the other is dedicated to the export market. The configuration of the refinery gives RIL the technical ability to process almost all grades of crude oil produced and meet the increasingly differentiated and more demanding product specifications.
Sourcing the most advantageous crudeThe crude and supply trading teams select a crude diet using processes that are optimised against the tremendous flexibility of the system, and then source the most advantageous crudes across the globe. To date, the refinery has processed 128 different grades of crudes in addition to other semi-refined feedstock from simple refineries.
Flexibility to alter the productsThe configuration of RIL’s assets also allows for tremendous amount of flexibility to alter the product slate and thus adapt to the changing market dynamics. The facilities at Jamnagar enable RIL to produce products capable of meeting the most stringent environmental norms, even after processing high sulphur feedstock. This gives RIL a competitive advantage in catering to the needs of many markets across the world. This year Jamnagar produced seven new product grades, catering to specific needs, helping RIL penetrate into high value niche markets. Significant flexibility to increase the production by a scale of 2-3 times in Jet and Alkylate and grade switching capabilities in gasoil help RIL capture market opportunities.
Integrated supply and tradingRIL’s integrated Supply and Trading team works with the refinery on a real time basis to optimise the asset utilisation and place RIL’s products most profitably across the globe. RIL’s global footprint includes trading offices in Houston, London, Singapore and Mumbai which gives it a global coverage for crude supplies and market outlets. The product trading team identifies the market shorts and collectively places the products in the highest netback regions. Tankage
Aerial view of refinery at Jamnagar
Management’s Discussion and Analysis (Continued)
5502-33 Company Overview
165-270 Financial Statements
271-284 Shareholders’ Referencer
34-164 Statutory Reports54
Reliance Industries LimitedAnnual Report 2013-14 Growth is Life...
at the major trading hubs allows RIL to move its selling point closer to market, helping to serve customers better, benefit from the seasonality capturing the upside from the resulting market structure and taking advantage of prompt local opportunities.
World class logistics infrastructureJamnagar refineries are supported by world-class logistics infrastructure, including a marine facility, giving access to the world’s largest crude and product vessels. This allows berthing of ships ranging from small chemical carriers to VLCCs. On the refined product side, the ability to load LR2 sized vessels allows RIL to optimise on the freight for delivery to its storage locations, helping maintain cost competitiveness at distant locations.
Asset optimisation modelIn addition to installing world-class assets, RIL excels in managing and utilising its assets most efficiently to generate greater value for its shareholders. RIL’s asset optimisation model is based on the principles of Safety, Operational Excellence and Continuous Improvement.
Safety focusRIL’s foremost priority is safe and reliable operations. RIL extensively utilises DuPont’s safety processes and programmes, the recognised leader in the industry. A better safety performance, not only enhances life and effectiveness of human and capital assets, but also improves their availability and reduces losses due to safety incidents.
RIL’s HSE systems are aligned with recognised management systems and global best practices. Most manufacturing units have been awarded ISO 14001:2004 and OHSAS 18001:2007 certifications.
Operational excellence and continuous improvementRIL implements a culture of continuous improvement, sponsored by top management and supported by technology excellence and innovation. Centres of Excellence (CoE) ensure that RIL adopts the latest and best industry standards, processes, tools and applications available. The adoption of such global standards and processes has enabled RIL’s refinery utilisation rates to consistently surpass global averages and maintain operating costs per barrel which are amongst the lowest in the world. In pursuit of achieving excellence in operations and energy conservation, several profitability improvement and energy conservation projects are identified and executed on an on-going basis.
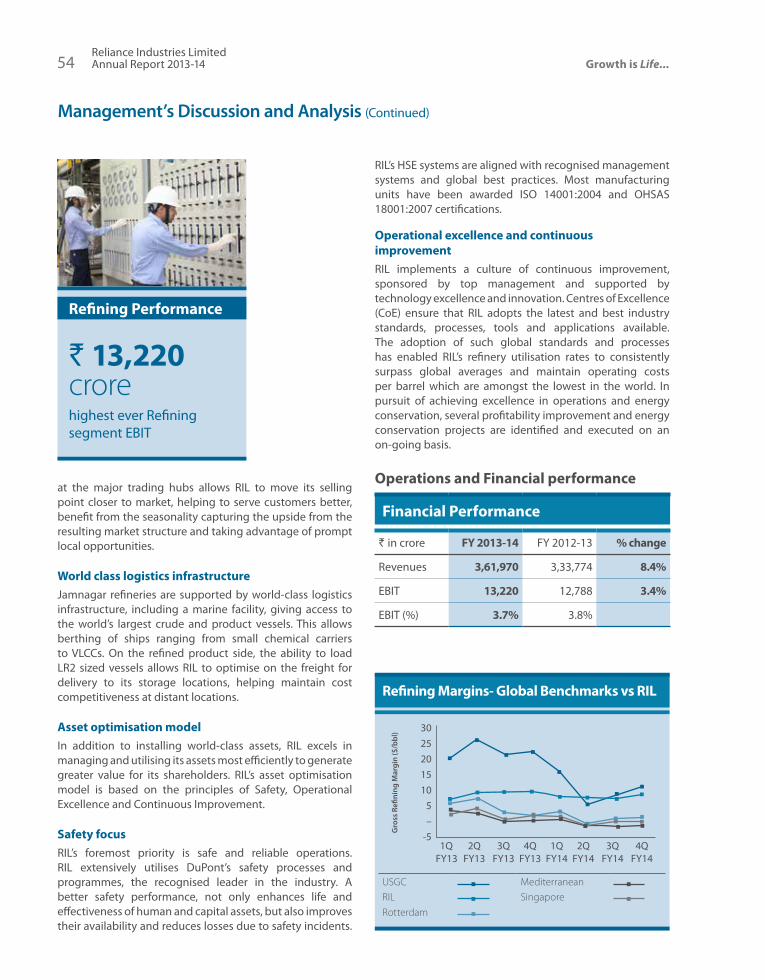
Operations and Financial performance
Financial Performance
` in crore FY 2013-14 FY 2012-13 % change
Revenues 3,61,970 3,33,774 8.4%
EBIT 13,220 12,788 3.4%
EBIT (%) 3.7% 3.8%
Refining Margins- Global Benchmarks vs RIL
USGC MediterraneanRIL SingaporeRotterdam
Gro
ss R
efini
ng M
argi
n ($
/bbl
) 3025201510
5–
-5 1Q 2Q 3Q 4Q 1Q 2Q 3Q 4Q FY13 FY13 FY13 FY13 FY14 FY14 FY14 FY14
Refining Performance
` 13,220 crorehighest ever Refining segment EBIT

5502-33 Company Overview
165-270 Financial Statements
271-284 Shareholders’ Referencer
34-164 Statutory Reports54
Reliance Industries LimitedAnnual Report 2013-14 Growth is Life...
R&M segment had a record year with the highest ever annual EBIT of ` 13,220 crore. Gross Refining Margin (GRM) averaging $ 8.1/bbl, as against $ 9.2/bbl in FY 2012-13. EBIT increased on account of stable middle distillate cracks, improved light-heavy crude differentials and favourable currency movement. Though refining margins remained weaker compared to last year, RIL performed significantly better than the benchmark Singapore GRM which averaged at $ 5.9/bbl during the year. RIL refineries processed 68 MMT of crude oil during the year, at an operating rate of 110%. It processed 10 new crude grades during the year, taking the total number of crudes processed to 128.
Total exports of refined products reached $ 41.1 billion during the year compared to $ 39.3 billion for the previous year.
Overall, effective utilisation of secondary processing units, innovative approach to optimise logistics cost and utilisation, production flexibility to swing to higher net-back products and sourcing of best value feed stock enabled RIL to sustain its performance even in a challenging margin environment.
Retail distribution network GAPCO group owns and operates large storage facilities and has a retail distribution network in Tanzania, Uganda, Rwanda and Kenya. It has significantly improved its standing in the East African market and has emerged as a key supplier to the neighbouring countries. During 2013, 3.2 million Kilo Litres (mkLs) of petroleum products were sold, up from 1.74 mkLs in 2012.
On the domestic retail side, nearly 300 retail outlets are operational, mainly in Southern and Western India. There have been some positive signs in the market, with step-wise price deregulation, but resuming operations in all geographies and scaling up of sales will be possible after complete implementation of market determined prices for gasoline and diesel.
Capex and growth plansPetcoke gasification project – utilising the “bottom of barrel”One of RIL’s key strategies, going forward, is setting up the petcoke gasification project which is expected to put RIL’s energy and hydrogen costs at par or better than the refineries in the US, where natural gas prices have fallen dramatically with the shale revolution. The project is designed to deliver a step change reduction in energy costs, substituting imported LNG with Coke /Coal.
The project is based on the “E-gas technology” (owned by CB&I) and is currently in the execution stage. Engineering and Procurement activities are nearing completion and construction activities are progressing rapidly. Delivery of key units has started at the site. Construction of the petcoke storage dome in Gasification complex is in the final stages of completion. RIL is aiming for a phased start-up of the gasifiers. Manpower resources and construction plans are aligned to execute the project on schedule.
The coke gasification project is designed to run on both coal and petcoke, giving RIL the flexibility to optimise based on relative economics. RIL is looking for various sourcing options for petcoke from the refiners in India, Middle East and North America. RIL is also evaluating coal import options from key coal exporting countries – Australia, Indonesia and South Africa.
The gasification assets, delivered with Reliance’s project execution capabilities, are expected to enhance its refining profitability significantly. This project is expected to make RIL’s energy costs competitive with the best in the industry.
R&M Investment
Petcoke Gasificationproject to deliver a step change reduction in energy cost

Management’s Discussion and Analysis (Continued)
5702-33 Company Overview
165-270 Financial Statements
271-284 Shareholders’ Referencer
34-164 Statutory Reports56
Reliance Industries LimitedAnnual Report 2013-14 Growth is Life...
PETROCHEMICALSRIL is one of the most integrated petrochemicals producers globally, with operations ranging from the production of feedstock and intermediates to end products in both the polyester and polymer chain. This vertical integration from refining to petrochemical end products imparts RIL with the fundamental strength of feedstock safety, scalability, product diversification and economies of scale.
RIL has a balanced portfolio of naphtha and gas based crackers, along with matching downstream capacities. RIL’s petrochemical products portfolio includes polymers (PE, PP, PVC), fibre intermediates (PX, PTA, MEG), polyester products (PFY, PSF, PET), elastomers and solvents.
The combination of world-scale capacity and deep integration has a positive impact on the Company’s operating margins and reduces exposure to the cyclicality of markets and raw material prices. The Company believes that this strategy is also important in maintaining domestic market leadership in its major product lines and is a source of competitive advantage.
RIL constantly focuses on technology, cost improvements and safe practices, whilst continuing to invest in high growth opportunities.
Market EnvironmentOlefins and Polymers Ethylene is the base raw material used in manufacturing of polymers like Polyethylene (PE), Polyvinyl chloride (PVC) and polystyrene, and chemicals like ethylene oxide and ethylene glycols.
The development of US shale gas reserves has had a profound impact on the global chemical industry. With prices for ethane, the primary US ethylene feedstock, down 60% versus its historical averages, the US is today the second lowest cost region in the world to produce chemicals (after the Middle East). Today, 69% of US ethylene is produced from ethane versus 17% from propane and 6% from naphtha. In contrast, Europe and Asia, which have limited amounts of natural gas, developed as crude oil based chemical producing regions. Naphtha, a derivative of crude oil, is the primary ethylene feedstock in these regions.
Global ethylene operating rates improved marginally to 85.8% in 2013, higher than the five-year average of 85.4%. Ethylene prices and margins increased globally, supported by stable crude oil and naphtha prices, along with tight supply due to regional cracker turnarounds. Asian ethylene margins improved during the year led by firm PE demand, despite high ethylene prices.
Global Ethylene Supply/Demand 2013
Production by FeedstockProduction : 131.7 MMT
Demand by End UseDemand : 133.1 MMT
Naphtha 47% PE 60%
Ethane 36% Ethylene Oxide 15%
Propane 9% EDC 10%
Butane 4% EBZ 6%
Others 4% Others 9%
Source: IHS
Global incremental ethylene supplies are likely to be constrained in 2014 due to project delays. The current expectation for incremental capacities in 2014 is 37% lower as compared to early 2013 estimates of 7.3 MMTPA. Major project delays are largely in the North East Asian region. The global ethylene cycle is likely to stay strong over the next 3-4 years with the next major wave of capacity addition (US shale gas based) expected from 2017-18. This could be further delayed due to engineering and construction bottlenecks. Even with key pieces of equipment likely to be built offshore, availability of skilled labour is likely to be a limiting factor for the rate and cost at which new US ethylene capacity comes on-line.
The global thermoplastics market in 2013 was estimated at 208 MMT. PE accounted for 39%, Polypropylene (PP) 27% and PVC 19%, respectively, of the global thermoplastic market. Demand for these polymers (PE, PP, PVC) grew by 3.4% during 2013 driven by North America, China and marginal improvement in European market. The demand for these polymer products is likely to grow at CAGR of approximately 4% over the next five year period.
Global Polyolefin and PVC Demand
(In MMT) 2013 2012 % Growth
PE 81 79 4%
PP 56 54 3%
PVC 39 37 3%
Ethylene 133 129 3%
Propylene 84 81 4%Source: IHS

5702-33 Company Overview
165-270 Financial Statements
271-284 Shareholders’ Referencer
34-164 Statutory Reports56
Reliance Industries LimitedAnnual Report 2013-14 Growth is Life...
South East Asia Polymers Deltas
($/MT) FY 2013-14 FY 2012-13
HDPE-Naphtha 595 482
PP-Propylene 150 134
PVC-EDC-Naphtha 468 535Source: Platts
PP deltas improved (from $ 134/MT to $ 150/MT) during FY 2013-14. Year-average deltas were positively impacted as higher propylene inventories in the region and lower downstream activity in China which kept feedstock prices lower. In 2014, propylene supply is expected to lengthen in Asia as new crackers in China and Taiwan start production.
HDPE deltas improved significantly during the year from $ 482/MT to $ 595/MT. Deltas were strong due to firm product prices with limited supply and range bound naphtha prices. Ethylene prices were higher due to lower supply from South East Asia on account of heavy cracker maintenance schedule. Additionally, olefin shipments from Middle East were limited due to port congestion and start-up of downstream polymer units. China’s drive for self-sufficiency continues to reshape Asia’s olefin trade and margin environment with increased regional availability. However, the global ethylene cycle continues to be poised favourably with operating rates likely to remain high to meet demand growth.
PVC deltas declined (from $ 535/MT to $ 468/MT) as there was substantial rise in EDC prices due to higher ethylene prices on account of higher feedstock cost and tight supply. EDC prices and supply were also affected by lower chlorine availability in the US market (co-product chlorine was impacted due to weak caustic markets) amidst rising US PVC demand. Globally, improvement in the US construction sector is likely to enhance manufacturing activity and demand for PVC-based products like profiles, among others.
Polyester and Fibre IntermediatesPolyester markets faced challenges during the year as capacity growth outpaced demand growth.
Despite price declines of 6-7%, downstream polyester deltas were stable to marginally lower than last year on account of lower feedstock costs. Higher cotton price (up 6% y-o-y) was also a major factor during the year, as it led to widening of the price differential in favour of polyester.
Amongst the downstream polyester products, PET had a relatively better year. The global overcapacity has forced a few large producers to shut operations at some sites in USA and Europe. Heavy rationalisation of operations resulted
in steady prices during the year, and supported higher margins of $ 221/MT against $ 171/MT in the previous year.
Polyester markets are expected to witness capacity growth in excess of demand growth. These excess capacities are likely to impact operating rates and profitability. Polyester producers having presence in end products and fibre intermediates are relatively better placed due to integrated chain economics.
Across western economies demand improved, but it was still marked by discretionary buying and cautious optimism. Asia’s share in global consumption stands at 37%. China accounts for 30% of the global capacity and 55% of the global capacity growth of 2.8 MMT in 2013.
Recycled PET usage growth almost halved with only North America witnessing stable growth. PET markets are likely to witness higher capacity growth over demand, which may result in softening of deltas. The key consuming sector – beverages – is sensitive to discretionary spending trends and weather, which could have an adverse impact on consumption.
South East Asia Polyester Deltas
($/MT) FY 2013-14 FY 2012-13POY-PTA-MEG 183 205PSF-PTA-MEG 132 133PET-PTA-MEG 221 171PX-Naphtha 514 615PTA-PX 98 106MEG-Naphtha 432 458
Source: Platts, ICIS
Fibre intermediates: During the year, overcapacity in the fibre intermediate markets led to a decline in prices and margins.
Paraxylene (PX) market was dislocated due to excess supply and difference between contract and spot prices. As a result, contract prices remained unsettled several times during
Polyester storage at Hazira
Management’s Discussion and Analysis (Continued)
5902-33 Company Overview
165-270 Financial Statements
271-284 Shareholders’ Referencer
34-164 Statutory Reports58
Reliance Industries LimitedAnnual Report 2013-14 Growth is Life...
the year. The margins declined from the previous year as naphtha prices remained firm, and acceptability of PX prices by the strained PTA sector remained weak, amidst divergent views about the impact of the impending new capacity start-up. Large-scale PX capacity expansions are planned for 2014. However many of the new capacities are based on high cost feedstock such as heavy condensate, heavy naphtha and mixed xylenes which would impair operations, leaving primarily the integrated and the low cost based operations with a competitive advantage.
High industry capacity impacted prices and margins for PTA, which for most part of the year remained below break-even levels, exerting severe pressure on operating economics. PTA capacity growth is expected to continue to surpass demand growth, albeit at a slower rate. Plant operations not falling under the top two quartiles of cost curve would continue to witness rationalisation, either as shut downs or lower operating rates. Operating rates are likely to remain low; however, margins could improve as increased supply of PX will ease price pressure.
MEG markets were balanced with a capacity growth of 1.5 MMT against a demand growth of 1.2 MMT in 2013. Average prices and margins remained stable and operating rates were slightly higher at 82%. Though markets remained balanced, it was subject to speculation and polyester buyers resorted to holding lower stocks along with co-feedstock PTA. Chinese port stocks increased steadily during the year, reaching around 1 MMT at year end. This increase pressurised margins, pulling them below the five-year average. MEG markets are expected to maintain a stable operating rate.
Chemicals and Elastomers During the year, the global chemical business scenario was mixed with high feedstock prices and low demand growth; but with low capacity addition.
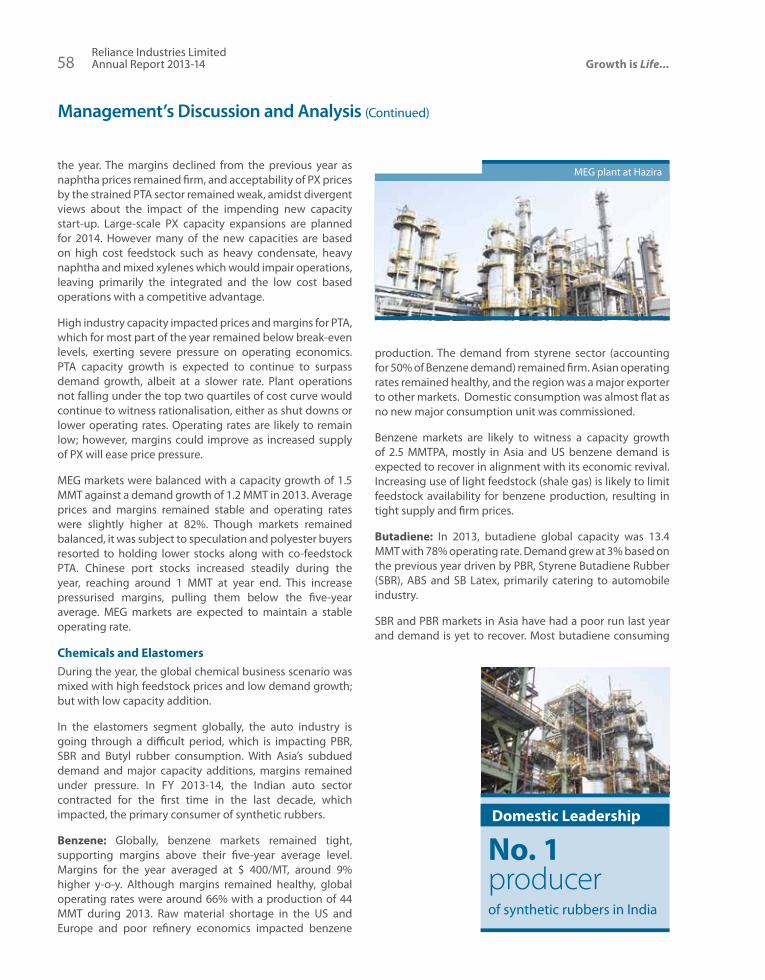
In the elastomers segment globally, the auto industry is going through a difficult period, which is impacting PBR, SBR and Butyl rubber consumption. With Asia’s subdued demand and major capacity additions, margins remained under pressure. In FY 2013-14, the Indian auto sector contracted for the first time in the last decade, which impacted, the primary consumer of synthetic rubbers.
Benzene: Globally, benzene markets remained tight, supporting margins above their five-year average level. Margins for the year averaged at $ 400/MT, around 9% higher y-o-y. Although margins remained healthy, global operating rates were around 66% with a production of 44 MMT during 2013. Raw material shortage in the US and Europe and poor refinery economics impacted benzene
production. The demand from styrene sector (accounting for 50% of Benzene demand) remained firm. Asian operating rates remained healthy, and the region was a major exporter to other markets. Domestic consumption was almost flat as no new major consumption unit was commissioned.
Benzene markets are likely to witness a capacity growth of 2.5 MMTPA, mostly in Asia and US benzene demand is expected to recover in alignment with its economic revival. Increasing use of light feedstock (shale gas) is likely to limit feedstock availability for benzene production, resulting in tight supply and firm prices.
Butadiene: In 2013, butadiene global capacity was 13.4 MMT with 78% operating rate. Demand grew at 3% based on the previous year driven by PBR, Styrene Butadiene Rubber (SBR), ABS and SB Latex, primarily catering to automobile industry.
SBR and PBR markets in Asia have had a poor run last year and demand is yet to recover. Most butadiene consuming
MEG plant at Hazira
Domestic Leadership
No. 1 producer of synthetic rubbers in India

5902-33 Company Overview
165-270 Financial Statements
271-284 Shareholders’ Referencer
34-164 Statutory Reports58
Reliance Industries LimitedAnnual Report 2013-14 Growth is Life...
plants in Asia especially China have been operating at reduced rates leading to oversupply of butadiene in the region. This has put pressure on butadiene prices; on a Y-o-Y basis butadiene price have fallen by around 30% in the region. There has been no corresponding fall in butadiene feedstock prices; which has led to erosion in margin for butadiene manufacturers.
Indian butadiene demand grew by 3% to 116 KTA as against capacity of 300 KTA, making it a net exporter in the global markets. Domestic demand growth is expected to increase due to the start-up of new synthetic rubber plants planned for in the near future.
Linear Alkyl Benzene (LAB): LAB is mostly consumed as surfactant intermediate for detergents. Global LAB capacity is around 3.8 MMTPA with 85% capacity utilisation. While the global demand growth is at 2%, for Asia it is 5%, indicating emergence of Asia as a key LAB consumption region. Middle Eastern countries have a very limited domestic LAB market whilst India being at close proximity becomes their natural export market. This allows for low priced imports to be available in the country.
The current Indian LAB capacity is 520 KTA while the overall demand is of around 500 KT. LAB demand in India grew by 2.5% during the year. Additional capacity expansions in Saudi Arabia and China as well as renewed availability of Iranian material are expected to put pressure on domestic LAB manufacturers.
Polybutadiene Rubber (PBR): PBR is used mainly in the automobile sector. Global PBR consumption for FY 2013-14 remained weak due to lower off-take from the automobile sector. There was significant capacity addition in China during 2013, which, coupled with the slowdown in global economy kept the operating rates of PBR plants at lower levels (approximately 72%). Major manufacturers in China and Korea operated at even lower rates of 50-60% due to weak regional demand.
During FY 2013-14, automobile sales in India excluding 2-wheelers witnessed de-growth. Despite this slowdown, PBR consumption in India increased by 8% due to strong demand from the replacement market.
Indian Petrochemical marketPolymers: The Indian polymer market growth is closely linked to GDP growth. The Indian per capita plastic consumption is advancing at 1.5 times its GDP growth making India among the world’s fastest growing polymer markets with a five-year CAGR of 10.7% (2008-2013). Despite strong growth over last few decades, the Indian market remains under-penetrated. Increasing industrialisation
and stable economy is likely to propel India’s per capita consumption of polymers.
During FY 2013-14, polymer demand in India grew by 3%. This was driven by 5% growth in PP, 2% growth in PVC and 1% growth in PE demand. Petrochemical demand growth in India during FY 2013-14 was low compared to last 5 and 10 year average growth rates. The lower demand growth can be attributed to economic slowdown, deferment of capital expenditure by the government on infrastructure, currency volatility and liquidity crunch caused by higher interest rates.
Overall, PP demand was moderately higher as there was growth in some of the end-use packaging applications. However, PP demand was negatively affected by poor demand from cement packaging and automobile sector. In PVC market, pipe demand was flat due to extended monsoon and high inventory of finished goods. During the year, India imported around 1 MMT of PVC in line with previous year’s imports. Overall, PE demand was soft as end-use sector consumption was affected by slower growth in infrastructure, fertilizer sectors and roto-moulded products. PVC domestic demand growth during 2013-18 is expected to be at 6.7% CAGR. However, long-term growth prospects are positive on account of the government’s focus on infrastructure development and low per capita consumption.
During the year, 0.7 MMTPA of polymer capacity was added in India (mainly in PP and PVC). Total market demand for PE, PP and PVC was 9.3 MMT in 2013, and it is estimated to
India Demand Growth
1.5x GDP Growthexpected in per capita plastic consumption

Management’s Discussion and Analysis (Continued)
6102-33 Company Overview
165-270 Financial Statements
271-284 Shareholders’ Referencer
34-164 Statutory Reports60
Reliance Industries LimitedAnnual Report 2013-14 Growth is Life...
reach 13.7 MMT by 2018, a CAGR of 8%. During the same period, around 3.5 MMTPA of total polymer capacity is likely to be added, including RIL’s on-going capacity expansions.
Polyester: Indian all fibre textile mill consumption in 2013 was estimated at 9 MMT, 7% up over previous year. Of this, cotton and polyester are major textile fibres consumed, and account for almost 90% of all fibre consumed. In India, the current share of cotton and man-made fibre demand is around 55:45 compared to around 35:65 globally. Indian all fibre demand is expected to reach a market size of around 13 MMT by 2020 and 17.5 MMT by 2030. India is ideally positioned to see an impressive stage of growth with favourable demographics and dependent population rate growing slower than the workforce. In line with global trends this would pave the way for larger man-made fabric base, benefiting the polyester industry at large.
The domestic polyester industry witnessed mixed market sentiments during FY 2013-14, reflecting an overall moderate and cautious growth pattern. During the year, domestic polyester demand grew by 6% on y-o-y basis, led by 7% growth in PFY, 6% growth in PET and 2% growth in PSF. The first quarter of the year witnessed healthy demand growth for all polyester variants due to seasonal upturn and active restocking activities. However, in the second quarter of the fiscal, the polyester demand turned cautious amidst volatility in the feedstock prices and the Indian Rupee.
Fully Drawn Yarn (FDY) markets, however, witnessed good growth due to import substitution and growing applications in warp knits and embroidery segments. PET market growth was stunted owing to the longer monsoons and prolonged winter, while PSF growth was affected due to the replacement by recycled fibres and filament yarns in certain market segments.
During FY 2013-14, Indian textile and clothing exports increased by 14% y-o-y. Textile industry-friendly policies and schemes were announced by the GoI and several states to encourage the sector’s value-addition and growth.
Operations and Financial Performance
Financial Performance
` in crore FY 2013-14 FY 2012-13 % changeRevenues 96,465 88,108 9.5%EBIT 8,612 7,328 17.5%EBIT (%) 8.9% 8.3%
FY 2013-14 revenue from the Petrochemicals segment increased by 9.5% y-o-y to ` 96,465 crore ($ 16.1 billion).
Growth in revenue was led by 8.6% increase in prices and 0.9% growth in volumes. EBIT improved sharply by 17.5% in FY 2013-14 to ` 8,612 crore.
Petrochemicals business earnings were positively impacted by higher polymer, PET margins and rupee depreciation; partially offset by the decline in regional deltas for PVC and fibre intermediates.
Polymer Production
(Production in KT) FY 2013-14 FY 2012-13
PP 2,805 2,810
PE 1,018 992
PVC 671 620
RIL maintained its leadership in the polymer industry with a domestic market share of 40%. RIL’s cracker operating rate was at 96%.
PP plant at Jamnagar
Global Leadership
No. 1 globalproducer of polyester fibre and yarn
6102-33 Company Overview
165-270 Financial Statements
271-284 Shareholders’ Referencer
34-164 Statutory Reports60
Reliance Industries LimitedAnnual Report 2013-14 Growth is Life...
RIL is the world’s fifth largest producer of PP. During FY 2013-14, the Company produced 2.8 MMT of PP, a capacity utilization of 100%. RIL has a pre-eminent position in the domestic PP market with 60% share. The major new grade development activities undertaken in PP business include:
zz Commercial trial lot production started for bi-axially oriented film grade for capacitor applications
zz Commercial trial run for advance catalyst-donor system taken for PP-ICP grades at Hazira for better properties
zz Alternate additives and dosage optimisation established for Hazira ICP grades for improved properties and cost-saving
RIL produced total PE of over 1.0 MMT during the year and has market shares of 18% in HDPE, 39% in LLDPE and 43% in LDPE. With 29% market share in the overall PE market, RIL leads the domestic PE producers market. The Company increased market share in high-value sectors in HDPE (pipe, roto-moulding and high flow) during the year. The Company also maintained its share in LDPE’s high-value sectors (milk packaging, extrusion coating and injection moulding). The major new grade development activities undertaken in PE business include:
zz Successfully developed HDPE base resin for PEX pipe compound for hot water application
zz Introduced lower MI for master batch in the injection moulding sector
zz Successfully developed grade with higher stiffness and lower cycle time for LL roto-moulding sector
RIL’s total PVC production was at 0.67 MMT and it has a market share of 29% in the domestic market. The major new grade development activities undertaken in PVC business include:
zz Successfully commercialised a new PVC grade with a medium porosity resin to capture customers focused on aesthetics. This grade is now well-positioned in PVC flexi banner market
zz Exploring on value-added products development, such as C-PVC pipes and fittings compounds
zz Focusing on high K-Value resins for critical insulation and high-strength applications
Polyester Production
(Production in KT) FY 2013-14 FY 2012-13
PFY 671 665
PSF 630 612
PET 347 351
Fibre Intermediates Production
(Production in KT) FY 2013-14 FY 2012-13
PX 1,989 1,995
PTA 2,045 2,087
MEG 675 682
Polyester production was marginally higher at 1.65 MMT for the year.
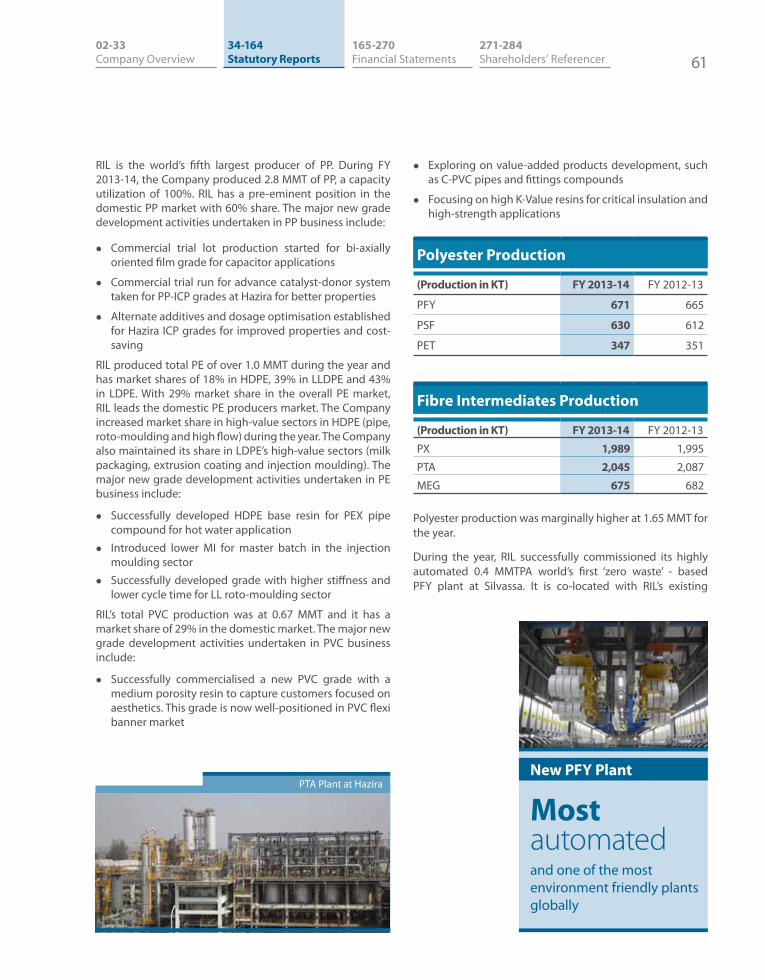
During the year, RIL successfully commissioned its highly automated 0.4 MMTPA world’s first ‘zero waste’ - based PFY plant at Silvassa. It is co-located with RIL’s existing
PTA Plant at HaziraNew PFY Plant
Most automatedand one of the most environment friendly plants globally

Management’s Discussion and Analysis (Continued)
6302-33 Company Overview
165-270 Financial Statements
271-284 Shareholders’ Referencer
34-164 Statutory Reports62
Reliance Industries LimitedAnnual Report 2013-14 Growth is Life...
texturizing facility at Silvassa eliminating packaging and logistics costs. This coupled with integration with PTA will make the Silvassa facility amongst the lowest cost PFY producing sites globally.
This expansion further strengthens RIL’s position as the world’s largest producer of Polyester Fibre and Yarn with total polyester capacity of 2.8 MMTPA. RIL maintained its domestic market leadership position with 20% share in PFY, 67% share in PSF and 41% share in PET.
RIL is the world’s 5th largest producer of PX, 9th largest producer of PTA and 8th largest producer of MEG. RIL retained its pre-eminent position in the domestic fibre intermediate market with 59% share in PX, 47% share in PTA and 37% share in MEG.
RIL’s Malaysian operations enhanced polyester market share in Asia primarily in Korea, Indonesia and Vietnam. The drivers were value-added products and superior customer service, prompt deliveries and consistent quality. The operations enhanced textiles market share in Turkey by fully leveraging improved demand and developed new markets in Mexico.
RIL optimised logistics cost by procuring from closer facilities, and sold MEG from its own plants to other nearby external polyester facilities. As in-house demand increases during the next fiscal, RIL will divert more in-house volumes while simultaneously optimising external sources to increase profitability.
Chemicals / Elastomers Production
(Production in KT) FY 2013-14 FY 2012-13Benzene 714 743Butadiene 174 169LAB 164 162PBR 81 77
RIL has built capacities in chemicals, which are primarily fed by cracker by-products. RIL is the leading producer of benzene, butadiene, LAB, caustic, butene1, MTBE and is the only producer of PBR and acrylonitrile in India. These chemicals are supplied to various downstream industries, such as pharmaceuticals, packaging, agriculture, automobile, electronics and construction sector.
New applications and market initiatives Polymers: The PP business has developed and pioneered Flexible Intermediate Bulk Container (FIBC) for silage storage. This new product application is expected to deliver a step improvement in preparation and storage of fodder as compared to traditional silo digging. The PP
Silage Bag, available in capacity of 100 to 9,000 kg, is an ideal replacement of concrete and mud silos. It has unique advantages like being lightweight, foldable, portable and reusable.
PP nonwoven crop cover is now a proven application to protect vegetables from frost and insects. Development work with farmers of Rajasthan and National Horticulture Mission (NHM) has led to growing crop cover use for many vegetables and fruits. Apart from high yield, this crop cover also reduces pesticides usage to a great extent, making the product environment friendly.
RIL developed flexible pouch for milk packaging to improve shelf life at ambient temperature up to 30 days. The Extended Shelf Life (ESL) milk packaging will enable packaging and storing of milk without refrigeration. RIL developed in-house multilayer polyfilm structures with better barrier to oxygen and 100% opacity.
RIL successfully developed ’Ultra-clear Repol SRX 100’ PP grade for refrigerator parts, clear containers, among others. New products are economical due to low density (lesser weight), and provide excellent contact clarity, freedom from breakages and good aesthetics.
Polyesters: During the year, RIL introduced many premium apparel and non-apparel products, which were widely accepted by customers. Some of the products are slub yarn, which gives a linen-like look and feel, and sparkle and shimmer yarn which adds a shining effect in evening wear.
Recron pre-coloured fibres are making ways for new application in denim fabrics. On the industrial usage front, Recron UVS yarn imparts an enhanced protection against sunlight exposure and is ideal for technical uses as geotextiles, awnings, etc.
In packaging segment, RIL has developed PET with barrier properties for use in flavoured milk, syrups and pharmaceutical sector and cobalt free PET as a green packaging initiative.
Capex and growth plansIndia’s PE demand in 2013 was 3.5 MMT and is projected to grow at 6-8% annually. The market remains supply-constrained whilst higher domestic availability and new applications are expected to augment demand. Last year, India imported 1.3 MMT of PE to meet rising demand. Reliance is expanding PE capacity by 1 MMTPA at Jamnagar. In addition, to help meet the growing needs of polyester business, Reliance is setting up a world scale MEG plant at Jamnagar. These state-of-the-art technology plants will be supplied ethylene from a new cracker being built at the
6302-33 Company Overview
165-270 Financial Statements
271-284 Shareholders’ Referencer
34-164 Statutory Reports62
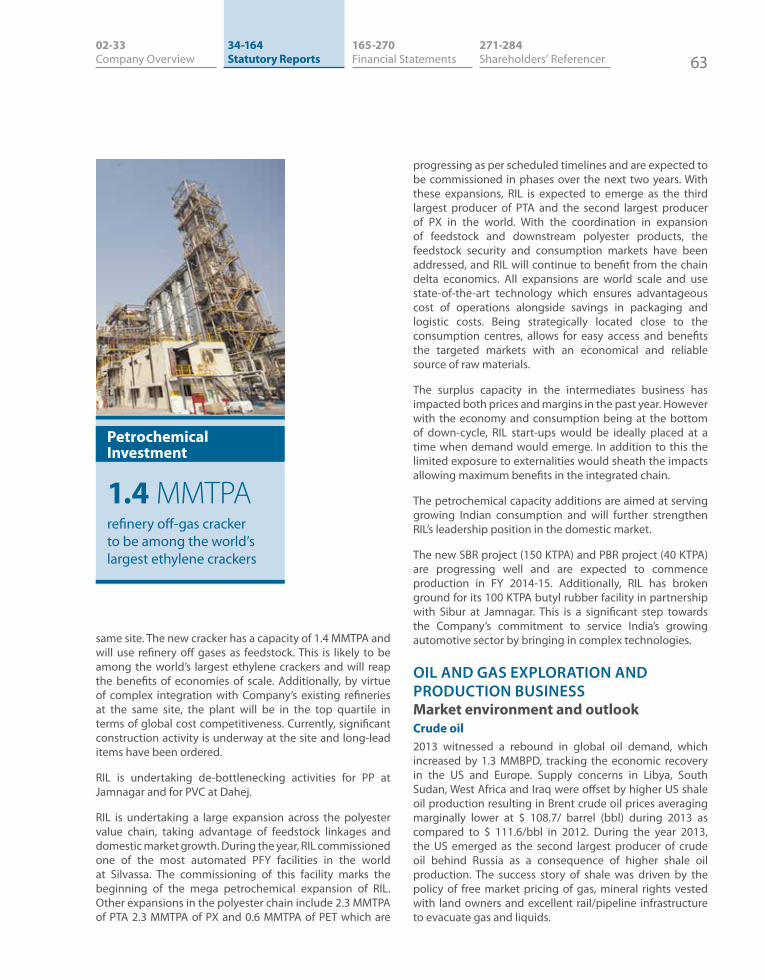
Reliance Industries LimitedAnnual Report 2013-14 Growth is Life...
same site. The new cracker has a capacity of 1.4 MMTPA and will use refinery off gases as feedstock. This is likely to be among the world’s largest ethylene crackers and will reap the benefits of economies of scale. Additionally, by virtue of complex integration with Company’s existing refineries at the same site, the plant will be in the top quartile in terms of global cost competitiveness. Currently, significant construction activity is underway at the site and long-lead items have been ordered.
RIL is undertaking de-bottlenecking activities for PP at Jamnagar and for PVC at Dahej.
RIL is undertaking a large expansion across the polyester value chain, taking advantage of feedstock linkages and domestic market growth. During the year, RIL commissioned one of the most automated PFY facilities in the world at Silvassa. The commissioning of this facility marks the beginning of the mega petrochemical expansion of RIL. Other expansions in the polyester chain include 2.3 MMTPA of PTA 2.3 MMTPA of PX and 0.6 MMTPA of PET which are
progressing as per scheduled timelines and are expected to be commissioned in phases over the next two years. With these expansions, RIL is expected to emerge as the third largest producer of PTA and the second largest producer of PX in the world. With the coordination in expansion of feedstock and downstream polyester products, the feedstock security and consumption markets have been addressed, and RIL will continue to benefit from the chain delta economics. All expansions are world scale and use state-of-the-art technology which ensures advantageous cost of operations alongside savings in packaging and logistic costs. Being strategically located close to the consumption centres, allows for easy access and benefits the targeted markets with an economical and reliable source of raw materials.
The surplus capacity in the intermediates business has impacted both prices and margins in the past year. However with the economy and consumption being at the bottom of down-cycle, RIL start-ups would be ideally placed at a time when demand would emerge. In addition to this the limited exposure to externalities would sheath the impacts allowing maximum benefits in the integrated chain.
The petrochemical capacity additions are aimed at serving growing Indian consumption and will further strengthen RIL’s leadership position in the domestic market.
The new SBR project (150 KTPA) and PBR project (40 KTPA) are progressing well and are expected to commence production in FY 2014-15. Additionally, RIL has broken ground for its 100 KTPA butyl rubber facility in partnership with Sibur at Jamnagar. This is a significant step towards the Company’s commitment to service India’s growing automotive sector by bringing in complex technologies.
OIL AND GAS EXPLORATION AND PRODUCTION BUSINESSMarket environment and outlook Crude oil2013 witnessed a rebound in global oil demand, which increased by 1.3 MMBPD, tracking the economic recovery in the US and Europe. Supply concerns in Libya, South Sudan, West Africa and Iraq were offset by higher US shale oil production resulting in Brent crude oil prices averaging marginally lower at $ 108.7/ barrel (bbl) during 2013 as compared to $ 111.6/bbl in 2012. During the year 2013, the US emerged as the second largest producer of crude oil behind Russia as a consequence of higher shale oil production. The success story of shale was driven by the policy of free market pricing of gas, mineral rights vested with land owners and excellent rail/pipeline infrastructure to evacuate gas and liquids.
Petrochemical Investment
1.4 MMTPArefinery off-gas cracker to be among the world’s largest ethylene crackers
Management’s Discussion and Analysis (Continued)
6502-33 Company Overview
165-270 Financial Statements
271-284 Shareholders’ Referencer
34-164 Statutory Reports64
Reliance Industries LimitedAnnual Report 2013-14 Growth is Life...
As the underlying economic fundamentals for the global economy maintain their momentum, oil demand in 2014 is expected to increase by 1.3 MMBPD (Source: IEA), keeping prices range bound. Oil markets entered 2014 with the lowest commercial oil inventories in over twenty years, for the three major OECD markets — US, Europe and Japan. Spare capacity is also low and largely concentrated in the Middle East whilst incremental supply is likely to be driven by US crude production. Oversupply of light sweet crude in the US Gulf Coast market has pushed out US imports of Oil, effectively disconnecting Brent prices from WTI/LLS prices.
In the US market, crude oil production growth is expected to remain strong, primarily concentrated in the Bakken, Eagle Ford and Permian regions. EIA forecasts the US production to increase from 7.4 MMBPD in 2013 to 9.1 MMBPD by 2015. WTI crude prices remain strong in view of geo-political tensions and continuous reduction in Cushing inventories.
US natural gasThe importance of natural gas is expected to grow considerably owing to abundant supply, competitive supply costs vis-à-vis liquid fuels and environmental advantages over other fossil fuels. Since the turn of the century, global gas use has expanded on average by 2.7% annually – faster than oil or nuclear energy.
In the US markets also, the growth in natural gas production is likely to continue in the near term, driven by sustained growth in rich gas or associated gas of liquid area. US natural gas production grew by 1.2% y-o-y in 2013 reaching a level of 66.53 BCF/D. Growing domestic production over the past several years has displaced some pipeline imports from Canada, while exports to Mexico have increased. EIA projects United States to be net exporter of gas beginning in 2018. The market has responded to this growth by adding processing capacities and other necessary infrastructure for gas.
Gas prices in the US market, which are quite sensitive to weather have seen strengthening over last three years. A warmer than normal 2011/12 winter resulted in gas prices
to average $ 2.83/MMBTU in 2012, but the severe 2013/14 winter (the 3rd coldest winter on record) resulted in a sharp increase in gas prices. Supported by low gas storage levels, prices are sustaining levels of $ 4.50 to $ 5.00/MMBTU and this is reflected in analysts’ price estimate outlook for 2014.
Supply chainAs per research estimates, global E&P capital expenditure will grow from around $ 451 billion in 2013 to reach $ 656 billion by 2020. Out of the current capex figure, nearly $ 127 billion is earmarked for offshore development and this is expected to touch $ 224 billion by 2020. Demand is picking up in regions including North America (unconventional), East Africa, Latin America, Asia and the Middle East. Of these, Asia and the Middle East are amongst the fastest growing regions in the world for upstream capital expenditure and account for nearly 27% of all the upstream expenditure in the world. Availability of rigs, particularly deepwater rigs remained constrained, and day rates stayed firm.
The industry also suffers from manpower shortages and currently has a high level of vacancies in key disciplines and is confronted with an expertise gap.
Market environment - IndiaIndia’s gas demand is expected to treble over the next decade, rising from 150 million metric standard cubic metre per day (MMSCMD) to exceed 517 MMSCMD by 2022 (Source: PNGRB). This demand escalation would be driven by multiple factors: environmental concerns, convenience of use and cost advantage over other fossil fuels.
Indian LNG imports are also expected to increase three-fold by around 2020. Currently, India imports 34% of its gas needs at prices indexed to oil. Indian LNG prices are likely to be indexed to oil for the foreseeable future, driven by global benchmarks and higher costs of new projects in Australia and East Africa.
According to the IEA, to meet energy security needs, India needs upstream investment of nearly $ 176 billion from 2013 to 2035. This implies an annual investment of about $ 8 billion.
The IHS CERA estimates (issued in April 2013) show that nearly 91 trillion cubic feet (TCF) of gas in India’s basins can be unlocked at $ 12+ per MMBTU. An enabling regulatory environment and a regime for free market pricing may facilitate enhanced investments and a robust energy security landscape.
As part of the transition towards free market pricing, during the year, Cabinet Committee on Economic Affairs (CCEA) approved a new gas pricing formula for a period of five
FPSO, KG-D6 Block
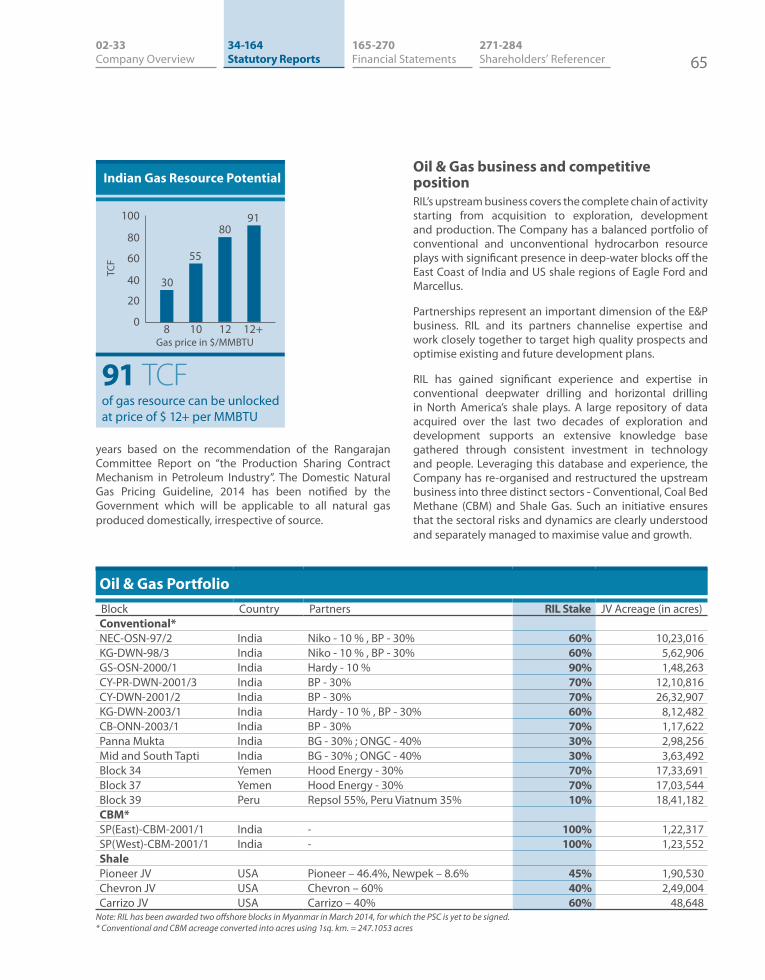
6502-33 Company Overview
165-270 Financial Statements
271-284 Shareholders’ Referencer
34-164 Statutory Reports64
Reliance Industries LimitedAnnual Report 2013-14 Growth is Life...
100
80
60
40
20
0
Indian Gas Resource Potential
91 TCFof gas resource can be unlocked at price of $ 12+ per MMBTU
8 10 12 12+Gas price in $/MMBTU
TCF
30
55
8091
years based on the recommendation of the Rangarajan Committee Report on “the Production Sharing Contract Mechanism in Petroleum Industry”. The Domestic Natural Gas Pricing Guideline, 2014 has been notified by the Government which will be applicable to all natural gas produced domestically, irrespective of source.
Oil & Gas business and competitive positionRIL’s upstream business covers the complete chain of activity starting from acquisition to exploration, development and production. The Company has a balanced portfolio of conventional and unconventional hydrocarbon resource plays with significant presence in deep-water blocks off the East Coast of India and US shale regions of Eagle Ford and Marcellus.
Partnerships represent an important dimension of the E&P business. RIL and its partners channelise expertise and work closely together to target high quality prospects and optimise existing and future development plans.
RIL has gained significant experience and expertise in conventional deepwater drilling and horizontal drilling in North America’s shale plays. A large repository of data acquired over the last two decades of exploration and development supports an extensive knowledge base gathered through consistent investment in technology and people. Leveraging this database and experience, the Company has re-organised and restructured the upstream business into three distinct sectors - Conventional, Coal Bed Methane (CBM) and Shale Gas. Such an initiative ensures that the sectoral risks and dynamics are clearly understood and separately managed to maximise value and growth.
Oil & Gas PortfolioBlock Country Partners RIL Stake JV Acreage (in acres)Conventional*NEC-OSN-97/2 India Niko - 10 % , BP - 30% 60% 10,23,016KG-DWN-98/3 India Niko - 10 % , BP - 30% 60% 5,62,906 GS-OSN-2000/1 India Hardy - 10 % 90% 1,48,263 CY-PR-DWN-2001/3 India BP - 30% 70% 12,10,816 CY-DWN-2001/2 India BP - 30% 70% 26,32,907 KG-DWN-2003/1 India Hardy - 10 % , BP - 30% 60% 8,12,482 CB-ONN-2003/1 India BP - 30% 70% 1,17,622 Panna Mukta India BG - 30% ; ONGC - 40% 30% 2,98,256 Mid and South Tapti India BG - 30% ; ONGC - 40% 30% 3,63,492 Block 34 Yemen Hood Energy - 30% 70% 17,33,691 Block 37 Yemen Hood Energy - 30% 70% 17,03,544 Block 39 Peru Repsol 55%, Peru Viatnum 35% 10% 18,41,182 CBM*SP(East)-CBM-2001/1 India - 100% 1,22,317 SP(West)-CBM-2001/1 India - 100% 1,23,552 ShalePioneer JV USA Pioneer – 46.4%, Newpek – 8.6% 45% 1,90,530 Chevron JV USA Chevron – 60% 40% 2,49,004 Carrizo JV USA Carrizo – 40% 60% 48,648
Note: RIL has been awarded two offshore blocks in Myanmar in March 2014, for which the PSC is yet to be signed.* Conventional and CBM acreage converted into acres using 1sq. km. = 247.1053 acres
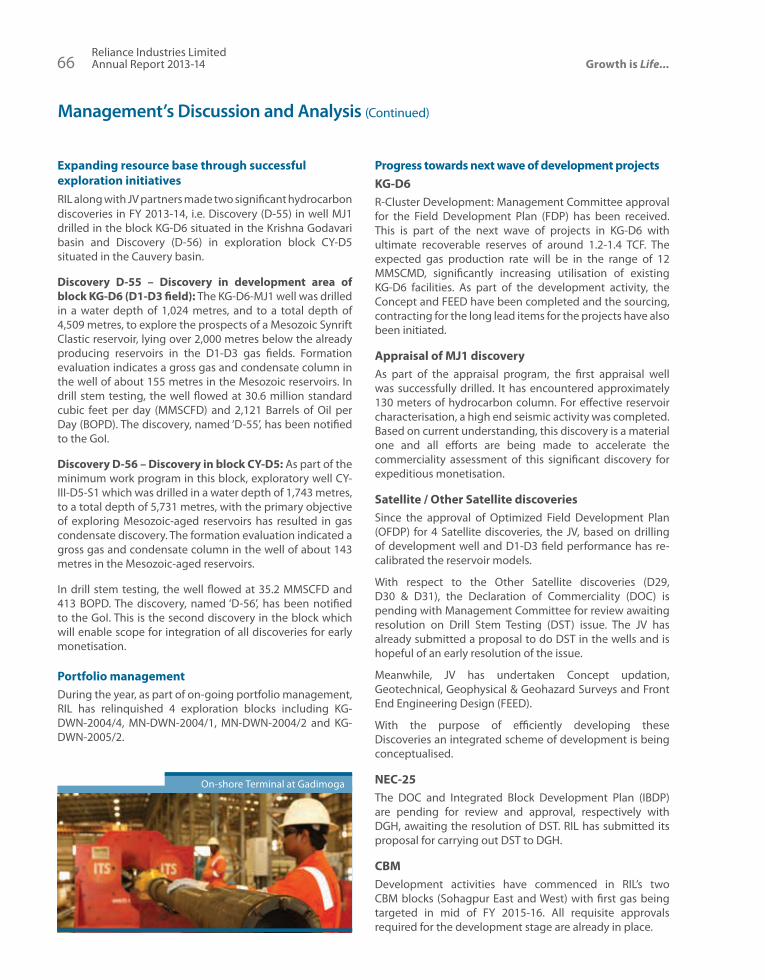
Management’s Discussion and Analysis (Continued)
6702-33 Company Overview
165-270 Financial Statements
271-284 Shareholders’ Referencer
34-164 Statutory Reports66
Reliance Industries LimitedAnnual Report 2013-14 Growth is Life...
Expanding resource base through successful exploration initiatives RIL along with JV partners made two significant hydrocarbon discoveries in FY 2013-14, i.e. Discovery (D-55) in well MJ1 drilled in the block KG-D6 situated in the Krishna Godavari basin and Discovery (D-56) in exploration block CY-D5 situated in the Cauvery basin.
Discovery D-55 – Discovery in development area of block KG-D6 (D1-D3 field): The KG-D6-MJ1 well was drilled in a water depth of 1,024 metres, and to a total depth of 4,509 metres, to explore the prospects of a Mesozoic Synrift Clastic reservoir, lying over 2,000 metres below the already producing reservoirs in the D1-D3 gas fields. Formation evaluation indicates a gross gas and condensate column in the well of about 155 metres in the Mesozoic reservoirs. In drill stem testing, the well flowed at 30.6 million standard cubic feet per day (MMSCFD) and 2,121 Barrels of Oil per Day (BOPD). The discovery, named ‘D-55’, has been notified to the GoI.
Discovery D-56 – Discovery in block CY-D5: As part of the minimum work program in this block, exploratory well CY-III-D5-S1 which was drilled in a water depth of 1,743 metres, to a total depth of 5,731 metres, with the primary objective of exploring Mesozoic-aged reservoirs has resulted in gas condensate discovery. The formation evaluation indicated a gross gas and condensate column in the well of about 143 metres in the Mesozoic-aged reservoirs.
In drill stem testing, the well flowed at 35.2 MMSCFD and 413 BOPD. The discovery, named ‘D-56’, has been notified to the GoI. This is the second discovery in the block which will enable scope for integration of all discoveries for early monetisation.
Portfolio managementDuring the year, as part of on-going portfolio management, RIL has relinquished 4 exploration blocks including KG-DWN-2004/4, MN-DWN-2004/1, MN-DWN-2004/2 and KG-DWN-2005/2.
Progress towards next wave of development projectsKG-D6R-Cluster Development: Management Committee approval for the Field Development Plan (FDP) has been received. This is part of the next wave of projects in KG-D6 with ultimate recoverable reserves of around 1.2-1.4 TCF. The expected gas production rate will be in the range of 12 MMSCMD, significantly increasing utilisation of existing KG-D6 facilities. As part of the development activity, the Concept and FEED have been completed and the sourcing, contracting for the long lead items for the projects have also been initiated.
Appraisal of MJ1 discoveryAs part of the appraisal program, the first appraisal well was successfully drilled. It has encountered approximately 130 meters of hydrocarbon column. For effective reservoir characterisation, a high end seismic activity was completed. Based on current understanding, this discovery is a material one and all efforts are being made to accelerate the commerciality assessment of this significant discovery for expeditious monetisation.
Satellite / Other Satellite discoveriesSince the approval of Optimized Field Development Plan (OFDP) for 4 Satellite discoveries, the JV, based on drilling of development well and D1-D3 field performance has re- calibrated the reservoir models.
With respect to the Other Satellite discoveries (D29, D30 & D31), the Declaration of Commerciality (DOC) is pending with Management Committee for review awaiting resolution on Drill Stem Testing (DST) issue. The JV has already submitted a proposal to do DST in the wells and is hopeful of an early resolution of the issue.
Meanwhile, JV has undertaken Concept updation, Geotechnical, Geophysical & Geohazard Surveys and Front End Engineering Design (FEED).
With the purpose of efficiently developing these Discoveries an integrated scheme of development is being conceptualised.
NEC-25The DOC and Integrated Block Development Plan (IBDP) are pending for review and approval, respectively with DGH, awaiting the resolution of DST. RIL has submitted its proposal for carrying out DST to DGH.
CBM Development activities have commenced in RIL’s two CBM blocks (Sohagpur East and West) with first gas being targeted in mid of FY 2015-16. All requisite approvals required for the development stage are already in place.
On-shore Terminal at Gadimoga

6702-33 Company Overview
165-270 Financial Statements
271-284 Shareholders’ Referencer
34-164 Statutory Reports66
Reliance Industries LimitedAnnual Report 2013-14 Growth is Life...
Financial and production performance
Financial Performance
` in crore FY 2013-14 FY 2012-13 % changeRevenues 6,068 8,280 (26.7%)EBIT 1,626 2,887 (43.7%)EBIT (%) 26.8% 34.9%
Overall, oil and gas revenues for the current year were lower by 26.7% at ` 6,068 crore, compared to the previous year. This was largely on account of lower production and lower liquid price realisation, partly offset by a higher exchange rate realisation.
Earnings before Interest and Tax (EBIT) declined by 43.7 % to ` 1,626 crore, compared to the previous year due to lower production, partly offset with correspondingly lower depletion charges.
The KG-D6 block
KG-D6: JV Production
FY 2013-14 FY 2012-13KG-D6Oil (MMBBL) 2.0 2.9Gas (BCF) 178.3 336.0Condensate (MMBBL) 0.3 0.4
The block produced 178.3 BCF of natural gas and 2.3 MMBBL of crude oil and condensate in FY 2013-14, a 47% and a 30% reduction for natural gas and crude oil/condensate, respectively. Production volumes for the year were lower on account of geological complexity, natural decline in the fields and higher than envisaged water ingress. This decline is partially offset by additional gas production from the new development well MA-08.
As a part of the CBM development programme, RIL is drilling more than 200 wells and setting up two Gas Gathering Stations and 8 Water Gathering Stations in Phase-I. The land acquisition is at an advanced stage – more than 50% of Phase-1 scope has been completed. Currently 3 rigs are in operation with drilling and completion activities having commenced from November 2013. RIL has drilled 90 surface and 72 production holes and 51 hydro fracturing jobs have been completed. Concept and FEED for Surface Facilities is completed and Detailed Engineering is underway.
Shahdol – Phulpur gas pipeline projectPetroleum And Natural Gas Regulatory Board (PNGRB) has issued the Grant of Authorisation in June 2013 to Reliance Gas Pipeline Limited, a subsidiary of RIL, for a natural gas pipeline from Shahdol in Madhya Pradesh to Phulpur in Uttar Pradesh (hook-up point with GAIL’s HVJ pipeline) to transport gas from RIL’s CBM blocks.
Land acquisition has been completed for all critical installations and obtaining of Right of Use (ROU) for laying the pipeline is under way. Basic engineering (FEED) is completed and detailed engineering is in progress. Ordering for long lead items has been completed and awarding of construction contract is in the final stages.
Measures taken for sustaining production from existing fieldsAs part of multiple initiatives to sustain production and enhance recovery from the D1-D3 and MA fields, RIL successfully drilled and completed a development well MA-08 in MA field and commenced production from January 2014. This has resulted in additional gas production of approximately 2.2 MMSCMD.
Other enhanced gas recovery projects underway include: i) water shut off jobs and side track activities in the existing shut in wells, and ii) Engineering and construction activities for booster compression – target completion in 2015.
Panna-Mukta JVThe Panna-Mukta JV carried out significant drilling activities during the current year, drilling six wells in the PL area and six infill wells in the PJ and PG areas. These activities yielded additional volume that helped in partially arresting production decline.
As part of the Mukta field development, the Joint venture submitted and received approval for Mukta “B” development from the Management Committee. The estimated recoverable reserves from Mukta “B” area is approximately 3.56 MMBBL of oil and 9.16 BCF of gas during the Production Sharing Contract (PSC) period. First oil from this development is expected in FY 2015-16.
Rig at KG-D6 Block

Management’s Discussion and Analysis (Continued)
6902-33 Company Overview
165-270 Financial Statements
271-284 Shareholders’ Referencer
34-164 Statutory Reports68
Reliance Industries LimitedAnnual Report 2013-14 Growth is Life...
PMT block
PMT: JV Production
FY 2013-14 FY 2012-13
Panna- MuktaOil (MMBBL) 7.4 8.2Gas (BCF) 65.4 71.2TaptiGas (BCF) 27.3 43.9Condensate (MMBBL) 0.3 0.5
The Panna Mukta field delivered 7.4 MMBBL of crude oil and 65.4 BCF of natural gas in FY 2013-14; 9% and 8% reductions in crude oil and natural gas respectively. The decrease in the production volumes for the year was due to a 17-day shutdown for field maintenance activities including commissioning of new SPM system coupled with natural decline. The Tapti field delivered 0.3 MMBBL of condensate and 27.3 BCF of natural gas in FY 2013-14; 48% and 38% declines in condensate and natural gas respectively. The decrease was due to the under-performance of new wells, as well as the natural decline in reserves.
During the year, the Tapti field witnessed lower production from the existing wells due to natural decline. Also, the results of the new infill wells drilled were not encouraging. Consequent to this, JV re-assessed the reserve estimates through an independent consultant and revised the ultimate recoverable reserves. The JV is preparing for abandonment of this field in consultation with GoI.
International businessIn line with its strategy of portfolio balancing by expanding its international asset base and investing in regimes having attractive internationally competitive terms, RIL participated in the Myanmar bid round.
RIL was selected for two offshore blocks (M17 and M18) located in offshore Myanmar in water depths up to 3,000 ft and together encompassing an area of 27,600 sq. km.
During the year RIL and PDVSA, Venezuela signed a joint study agreement for Ayacucho Block 8 in the Orinoco Oil Belt to jointly evaluate the development plan for Ayacucho block. RIL is also actively considering other opportunities in East and West Africa, Iraq and other locations. RIL has concluded an assignment of its working interest (30%) in Block 108 in Peru to Pluspetrol and Woodside.
North American Shale Gas – OperationsBackgroundThe successful shale gas revolution in North America has changed the global energy landscape. Industry continues to
discover new plays and operators continue to find economic ways of exploiting this resource. The US market is business friendly and actionable with an abundance of financing options that make it possible for leaner and smaller players to gain a position of importance in the market.
RIL has leveraged its cost leadership experience in its shale joint ventures and with its truly global outlook has quickly become a sustainable and a major shale gas player. Reliance has, till date, invested $ 7.0 billion in its joint ventures with Pioneer Natural Resources, Carrizo and Chevron.
Operations and financial performance
Financial Performance
$ in million CY 2013 CY 2012 % changeRevenues 819 545 50.3%EBIT 295 180 63.9%EBIT (%) 36.0% 33.0%
Reliance continued to register growth in its shale gas business with revenues and EBIT increasing 50.3% and 63.9% respectively. Reliance share of net sales averaged at 359 MMCFeD, from 622 producing wells. Aggregate sales volume at 131 BCFe, compared to 85 BCFe in 2012. EBITDA of $ 616 million in 2013, up 46% y-o-y, provides a solid base to the business, which is now reaching material levels of production, revenue and EBITDA.
Reliance was successful in its portfolio high-grading efforts and the strategy of liquid focused development was successfully implemented by reducing activity in dry gas area and focusing development in liquid rich area of Pioneer
US Shale Investment
$ 7 billioninvested in its joint ventures with Pioneer Natural Resources, Carrizo and Chevron

6902-33 Company Overview
165-270 Financial Statements
271-284 Shareholders’ Referencer
34-164 Statutory Reports68
Reliance Industries LimitedAnnual Report 2013-14 Growth is Life...
JV. The overall capex during the year was $ 1.4 billion, lower by 35% over the previous year on account of reduced carry obligations and moderated development pace at Marcellus.
Several initiatives were taken up to ensure sustainable growth of the business by increasing resource recovery, reducing costs and higher productivity. New development concepts such as down spaced wells, drilling in upper Eagle Ford and upper Marcellus were pursued. These will positively impact reserve accretion as well. Cost and recovery optimisation initiatives like multi well-pad drilling and longer laterals were successfully pursued.
In CY 2013, the RIL-Shale Gas Operations (RIL-SGO) posted a 43% reserve accretion with year-end proved reserves at 2.66 TCFe. These Proved reserves are about 30% of total resource base underscoring significant development upside. Reserves were positively impacted by benefits of additional well locations in Pioneer and Carrizo joint ventures marking development upside.
During 2013, the joint ventures drilled 252 wells and put 237 wells on production taking the cumulative number of producing wells to 622 at the end of the year as compared to 385 producing wells at the end of 2012. Reliance witnessed an improvement in efficiencies and cost reductions in development activities for 2013 over the previous year. The focus was on leveraging knowledge on acreage sweet spots and preserving optionality on dry gas acreage.
Shale Gas Production
52 % Growthin production from the previous year
2011
2012
2013
38
101
154
0 40 80 120 160 200Billion Cubic Feet (BCFe)
Year
The RIL-SGO share of gross JV production was 154 BCFe in 2013 reflecting a growth of about 52% over 2012 production.
Pioneer Upstream JVJV has been notably successful in pursuing high value growth. Producing well count increased from 246 at year-end 2012 to 371 at year-end 2013, which was a major
factor in the growth in production volumes. The JV produced 207 BCFe of products through the year (gross) and achieved an exit rate of 662 MMCFeD. The share of liquids increased to 64% in 2013 reflecting growth in activity in oil-rich acreage. On-going development thrust on infill drilling, down spaced and upper Eagle Ford development provided for additional potential locations leading to growth in proved reserves by 34% at year-end 2013.
Chevron Upstream JVThe JV saw production growing over 100% from previous year at 91 BCFe and achieved an exit rate of 328 MMCFeD. The JV witnessed impressive growth in proved reserves going up 79% from year-end 2012 to year-end 2013. JV is pursuing paced development in view of the challenging pricing environment while retaining optionality on acreages through low cost lease renewals.
Carrizo Upstream JVIn view of a challenging price differential environment, Carrizo JV deferred bringing some wells online as per original schedule which led to curtailment in production. In spite of this, the JV production of 40 BCFe reflected a 78% increase over the previous year and the JV achieved an exit rate of 138 MMCFeD at the end of 2013. Carrizo JV focused on portfolio optimisation through the sale of suboptimal acreage in Sullivan County in the fourth quarter of CY 2013. While year-end 2013 reserves were largely unchanged, Carrizo added potential well locations due to Upper Marcellus development plan down spacing.
Update on domestic gas pricing, arbitration and other legal issuesDomestic Gas PricingThe Contractor was entitled to a revised gas price from 1st April 2014. The government notified “The Domestic Gas Pricing Guidelines, 2014” on 10th January 2014. The notification required the Government to intimate quarterly prices on the basis of the approved formula. In view of the Model Code of Conduct which is in place for the Parliamentary Elections, the Government approached the Election Commission for permission prior to notifying the applicable process for quarter 1st April to 30th June 2014. The Election Commission has advised after taking into account all relevant facts that the intimation of the price of gas sales for the quarter be deferred. In view of the Election Commission recommendation, the MoPNG has directed the Contractor to continue to charge the earlier prices even after 1st April 2014. Accordingly, the Contractor is selling gas to its customers at the price of $ 4.2/ MMBTU, on a provisional basis. The Contractor is entitled under the

Management’s Discussion and Analysis (Continued)
7102-33 Company Overview
165-270 Financial Statements
271-284 Shareholders’ Referencer
34-164 Statutory Reports70
Reliance Industries LimitedAnnual Report 2013-14 Growth is Life...
PSC to receive market prices for all gas produced and sold from the block. The restriction on charging the revised gas price is not in line with the PSC and the Contractor reserves its rights and remedies to claim the revised gas price from 1st April 2014.
KG-D6 Arbitration and other legal issuesRIL has commenced an arbitration against the Government’s decision to disallow recovery of costs incurred by the Contractor in the development of facilities constructed for production of gas from the D1 and D3 fields in the block KG-D6. RIL approached the Supreme Court for appointment of a third arbitrator following the failure on the part of the arbitrators appointed by the Contractor and the Government to appoint a third arbitrator. Consequently, the third arbitrator has been appointed by the Supreme Court.
Public Interest Litigations (PIL) were filed by Gurudas Dasgupta and an NGO called Common Cause before the Supreme Court. The PILs primarily seek quashing of the decisions of the Government to revise the gas price and action against the Contractor for failure to relinquish area and for hoarding gas. As both the PILs raised substantially the same claims, the Supreme Court tagged both the petitions to be heard together. These PIL are currently being heard by the Supreme Court.
PMT ArbitrationArbitration Hearing took place in London from 19th November to 27th November 2013 and a number of issues (including Interpretation of Cost recovery provisions, interpretation of provision related to calculation of Investment Multiple and profit sharing, Powers and functions of Management Committee and method of determining the amount of royalty) were heard and award has been reserved. A final hearing has been fixed for 15th June to 3rd July 2015. Further RIL/BG’s SLP before the Supreme Court (challenging Delhi High Court’s order admitting GoI’s petition for setting aside a partial final award handed down by PMT arbitration tribunal) has been heard by the Supreme Court and the judgment has been reserved.
Major SubsidiariesRETAIL BUSINESSMarket environmentIndia’s economy has been plagued by persistent slowdown since 2012. Combination of domestic and global factors are responsible for the downturn. Spiralling inflation and rising interest rates over the past few years have subdued both investment and consumption in the economy. Global
downturn also cast its shadow, making consumers cautious in their spending behaviour.
Discretionary spending among urban consumers was also impacted by escalating food prices. Growth in private final consumption expenditure (PFCE) of 2.5% in 3Q of FY 2013-14 (2Q FY 2013-14: 3%) was the second lowest growth observed in the last 37 quarters. (Source: Central Statistics Office – 3rd Quarter GDP Estimates, February 28, 2014). The result is a bleak domestic scenario in which consumer confidence and business optimism have remained below expectations.
India’s Retail industry, estimated at over $ 500 billion in 2012 (Source: Deloitte – Indian Retail Market Opening More Doors, January 2013), has evolved considerably in the last few years. However, organised retail is still in its infancy stage with 12 million kirana shops strengthening the sector’s backbone.
While modern retail is resilient to economic cycles owing to its fundamental growth drivers, improvements in the overall consumer sentiment will drive industry growth in the foreseeable future. Organised retail will help accelerate India’s economic growth and job creation.
During the year, developments on the policy front provided an opportunity for global retailers to make investments and participate in the sector’s growth story.
OutlookA two trillion dollar economy catering to a billion-plus population, more than half of which is below the age of 30. Such a scenario, a rarity in the world’s demographic profile, represents the foundation for India’s retail sector growth.
India’s organised retail is witnessing a new surge of optimism and is projected to touch a 20% share of the total retail market by 2020 vis-à-vis 8% now. (Source: Deloitte – Indian Retail Market Opening More Doors, January 2013).
Retail business and competitive position Operating strategyReliance Retail is India’s largest retailer by revenues. Reliance Retail has been instrumental in serving the country’s growing consumption base by operating multiple retail formats that offer best choices in products and services, superior value proposition and world class shopping environment.
Deep insight into India’s economic, cultural and consumption diversity drives Reliance Retail’s vision in the retail universe. The operating model is based on customer

7102-33 Company Overview
165-270 Financial Statements
271-284 Shareholders’ Referencer
34-164 Statutory Reports70
Reliance Industries LimitedAnnual Report 2013-14 Growth is Life...
Reliance Mart, Jamnagarcentricity, while leveraging common centres of excellence in technology, business processes and supply chain.
Leadership: Reliance Retail has consistently taken a long-term view on India’s enormous consumption requirements and potential. Reliance Retail’s vision is about inclusive growth for both organised and unorganised retail. It continues to reinforce leadership in focus sectors and its efforts enable economies of scale and best practices. Reliance Retail is at the forefront of evolving new consumption opportunities.
Speed: A core element of Reliance Retail’s strategy is to be able to anticipate and respond quickly to evolving customer/market trends and requirements. Speed in decision-making, effective resource development, format and product development are essential for sustained profitable retail growth. The speed-to-market approach is driven by leveraging state-of-the-art retail technology and operating functional expertise, which provides rapid deployment and replication.
Consumer Focus: At Reliance Retail, customer-centricity forms the basis of its operating model. Reliance Retail’s Academy provides comprehensive training and development to its associates. Reliance Retail’s Customer Loyalty programme is a critical tool to ensure constant understanding and serving the needs of its existing and new customers. In addition, it has many important consumer touch-points, such as customer service call centres, mystery shoppers, decentralised buying and merchandising, along with extensive data analytics to understand purchasing patterns. Consumer focus is also at the centre of its format innovations, product development and technology enhancements.
Productivity and Efficiency: Reliance Retail has built world-class infrastructure supporting business systems and supply chains. Its highly trained people and robust processes ensure consistent execution. These developments enable to leverage resources to a great extent and drive productivity. Managing a diverse portfolio of formats, geographies and products is greatly simplified with an evolved infrastructure of processes and systems.
Reliance Retail has continuously invested in strengthening its technology platforms that enables it in making better decision, achieve operational efficiency and offer superior customer service.
Operations and financial performance Retail business grew by 34% to reach revenue of ` 14,496 crore as against ` 10,800 crore registered in the previous financial year.
It continued to grow profitably, achieving profits before depreciation, finance cost and tax expense (PBDIT) of ` 363 crore. The format sectors collectively witnessed a three-year CAGR of 34% in revenues.
Efficiency improvement initiatives taken under the leadership of best retail management talent, with an unwavering focus on providing superior customer shopping experience has helped attain robust growth across almost all format sectors during the year. The retail business witnessed strong same store sales growth up to 23% across format sectors over last year.
Reliance Retail has established market leadership in all of the focus sectors of Digital, Lifestyle and Value sectors. During the year, a total of 225 stores were added, covering an area of 2.7 million square feet.
As on 31st March 2014, Reliance Retail operated 1,691 stores, covering an area of 11.7 million square feet across 146 cities. There was continued focus on best-in-class systems, processes and infrastructure to enable growth. The scale and speed of profitable expansion is a result of the back-end infrastructure and continuous improvement.
The performance of various format sectors during the year is detailed below:
Store Count and Additions
Format Sector Store Count As on 31st March,
2014
Store Additions
FY 2013-14Value and Others 718 (42)#Fashion & Lifestyle 533 85Digital 284 145Brands 102 34Jewellery 54 3TOTAL STORE 1,691 225
# includes impact due to closure of Delight (Non-vegetarian food format)
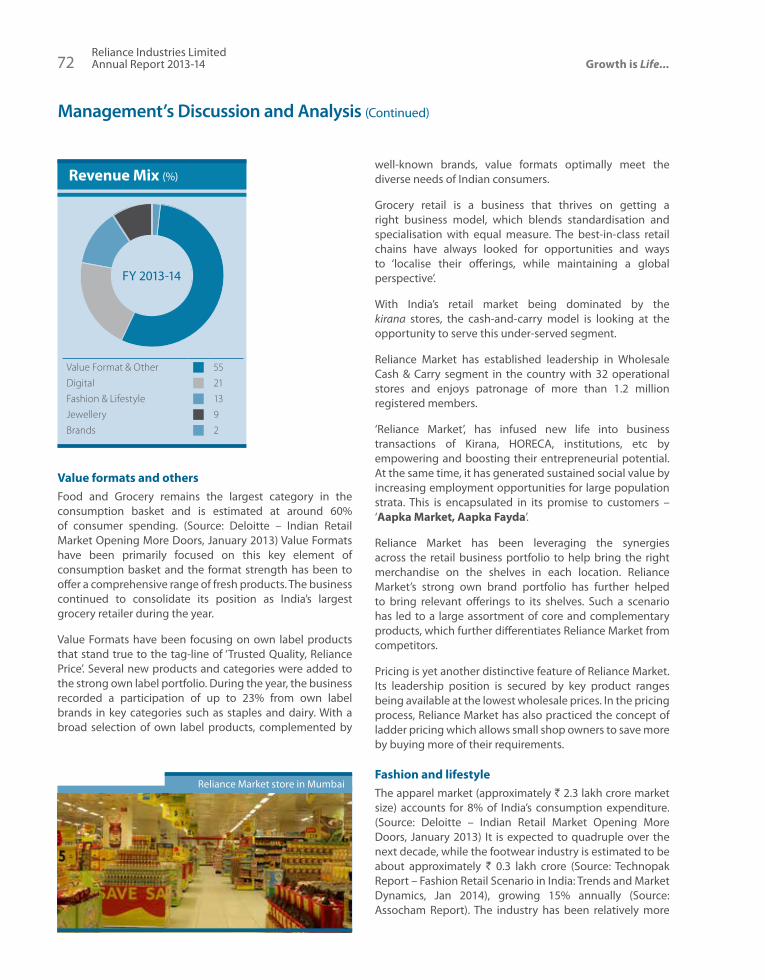
Management’s Discussion and Analysis (Continued)
7302-33 Company Overview
165-270 Financial Statements
271-284 Shareholders’ Referencer
34-164 Statutory Reports72
Reliance Industries LimitedAnnual Report 2013-14 Growth is Life...
Revenue Mix (%)
Value Format & Other 55Digital 21Fashion & Lifestyle 13Jewellery 9Brands 2
FY 2013-14
Value formats and othersFood and Grocery remains the largest category in the consumption basket and is estimated at around 60% of consumer spending. (Source: Deloitte – Indian Retail Market Opening More Doors, January 2013) Value Formats have been primarily focused on this key element of consumption basket and the format strength has been to offer a comprehensive range of fresh products. The business continued to consolidate its position as India’s largest grocery retailer during the year.
Value Formats have been focusing on own label products that stand true to the tag-line of ‘Trusted Quality, Reliance Price’. Several new products and categories were added to the strong own label portfolio. During the year, the business recorded a participation of up to 23% from own label brands in key categories such as staples and dairy. With a broad selection of own label products, complemented by
well-known brands, value formats optimally meet the diverse needs of Indian consumers.
Grocery retail is a business that thrives on getting a right business model, which blends standardisation and specialisation with equal measure. The best-in-class retail chains have always looked for opportunities and ways to ‘localise their offerings, while maintaining a global perspective’.
With India’s retail market being dominated by the kirana stores, the cash-and-carry model is looking at the opportunity to serve this under-served segment.
Reliance Market has established leadership in Wholesale Cash & Carry segment in the country with 32 operational stores and enjoys patronage of more than 1.2 million registered members.
‘Reliance Market’, has infused new life into business transactions of Kirana, HORECA, institutions, etc by empowering and boosting their entrepreneurial potential. At the same time, it has generated sustained social value by increasing employment opportunities for large population strata. This is encapsulated in its promise to customers – ‘Aapka Market, Aapka Fayda’.
Reliance Market has been leveraging the synergies across the retail business portfolio to help bring the right merchandise on the shelves in each location. Reliance Market’s strong own brand portfolio has further helped to bring relevant offerings to its shelves. Such a scenario has led to a large assortment of core and complementary products, which further differentiates Reliance Market from competitors.
Pricing is yet another distinctive feature of Reliance Market. Its leadership position is secured by key product ranges being available at the lowest wholesale prices. In the pricing process, Reliance Market has also practiced the concept of ladder pricing which allows small shop owners to save more by buying more of their requirements.
Fashion and lifestyleThe apparel market (approximately ` 2.3 lakh crore market size) accounts for 8% of India’s consumption expenditure. (Source: Deloitte – Indian Retail Market Opening More Doors, January 2013) It is expected to quadruple over the next decade, while the footwear industry is estimated to be about approximately ` 0.3 lakh crore (Source: Technopak Report – Fashion Retail Scenario in India: Trends and Market Dynamics, Jan 2014), growing 15% annually (Source: Assocham Report). The industry has been relatively more
Reliance Market store in Mumbai

7302-33 Company Overview
165-270 Financial Statements
271-284 Shareholders’ Referencer
34-164 Statutory Reports72
Reliance Industries LimitedAnnual Report 2013-14 Growth is Life...
organised, with modern trade accounting for 30% market share (Source: Assocham Report).
Reliance Trends, the apparel and accessories specialty format, established a strong fashion identity for itself during the year, while continuing to be true to its brand communication ‘Sirf Dikhne Mein Mehenga’.
With the constant endeavour to improve the fashion quotient of the format for its consumers, Reliance Trends continues to work with empanelled international designers. Such an approach ensures that trend-forward designs are available to its customers through the extensive range of own labels, apart from other national and international brands.
Reliance Trends now has a deep and wide assortment of own brand labels in the women’s western wear and kids wear segments with these launches:
zz Intribe – This fast fashion own label offers men’s wear and women’s wear and will have a new range every 30 days, representing in-trend styles from ramps in India and around the world
zz Rio – Western wear for women including Casual, Evening and Party wear for teens and young women
zz Fusion – Contemporary ethno-western wear for stylish young women
zz Fig – Complete wardrobe solution for the modern Indian woman
zz Avaasa – Versatile ethnic wear for Indian women
Own label brands contributed to about 61% of the Trends business.
To support its range of labels, Reliance Trends has, over the years, made significant and meaningful interventions in the apparel value chain at every stage of the manufacturing process - from fibre selection and sourcing through to
apparel design, sampling, sales and marketing. These interventions have enabled Reliance Trends to drive product innovations, reinforce quality control and significantly reduce lead times in unveiling latest designs from around the world.
Reliance Trends launched the BisouBisou collection, which includes fashionable casual and party wear for the contemporary Indian woman, in its stores during the year. BisouBisou, an international brand by an award-winning designer, will be retailed exclusively by Reliance Trends stores.
The business launched high-impact, marketing innovations in print and outdoor media and was associated as the ‘Preferred Partner’ at the Lakmé Fashion Week 2013.
Reliance Footprint, the specialty footwear format of the retail business, firmly established itself as the largest multi-brand format in its segment with continued store additions.
During the year, Footprint signed an exclusive franchise agreement with Payless ShoeSource to build and operate Payless ShoeSource stores in the country. Payless is the largest specialty family footwear retailer in the Western hemisphere. The Payless stores in India will offer a wide variety of fashionable, comfortable, high-quality and affordable footwear and accessories to Indian consumers across segments.
Footprint expanded the distribution of Asics into specialty footwear stores, key department stores and on-line stores during the year to make the brand more accessible to consumers. The business also continued to partner with other leading brands bringing more choices for consumers.
The successful partnership with Marks & Spencer (M&S) continued to grow from strength to strength through the launch of new stores during the year.
Reliance Trends store in Mumbai
Reliance Footprint store

Management’s Discussion and Analysis (Continued)
7502-33 Company Overview
165-270 Financial Statements
271-284 Shareholders’ Referencer
34-164 Statutory Reports74
Reliance Industries LimitedAnnual Report 2013-14 Growth is Life...
During the year the business opened 10 stores, including the largest flagship store in Bandra, Mumbai, and an expanded flagship store at South Extension, Delhi. These stores provide customers with a truly international shopping experience - showcasing M&S’s most extensive range of exceptional quality, confident styles across clothing and beauty to date.
With aggressive expansion plans in place targeting 80 operational stores by 2016 including expanding in tier 2 cities, the business is on track to become largest international market outside the UK for M&S.
In line with its strategy to capitalise on growth of the lingerie and beauty market in India, the business opened the world’s first Marks & Spencer Lingerie & Beauty department apart from other ranges of exceptional quality, stylish products.
Vision Express, the optical retail chain under partnership with Grand Vision, Europe’s largest optical retail chain with over 4600 stores in over 40 countries completed 5 years of successful partnership with the Company. Vision Express serves eye care needs of the customers by offering
an extensive range of spectacles, progressive lenses and trendiest range of sunglasses. Vision Express is India’s largest chain of Company operated stores and continues to grow.
DigitalReliance Digital, the consumer durables and information technology (CDIT) products retailing format, has established itself as a complete destination store that offers comprehensive assortment of top brands, a large selection of innovative products, attractive pricing and best-in-class service.
To help consumers better understand and experience the comprehensive technological solutions that the format offers, Reliance Digital launched several experience zones in its stores. These zones give consumers a first-hand experience of the digital ecosystem on display, helping them make better informed purchase decisions and ensure optimum utilisation of the solution post sales.
Built around the central theme of providing cutting-edge technology solutions, the Digital Express format offers a wide range of products and helps customers connect with their world from anywhere at any time.
The business also launched a new format Digital Express Mini, which represents an exciting opportunity to extend the success of Digital Express. The format focuses on mobility and communication products. The format operates in a much smaller space, which creates tremendous flexibility and scale opportunities.
The business continues to strengthen ResQ, the service arm of Digital. It is a full-fledged service organisation and is India’s first multi-product, multi-brand and multi-location service network that provides solutions encompassing end-to-end product life cycle requirements for the entire range of CDIT products and other value-added services. The
Reliance Digital
Largest digitalretail chain in India
Reliance Brands store
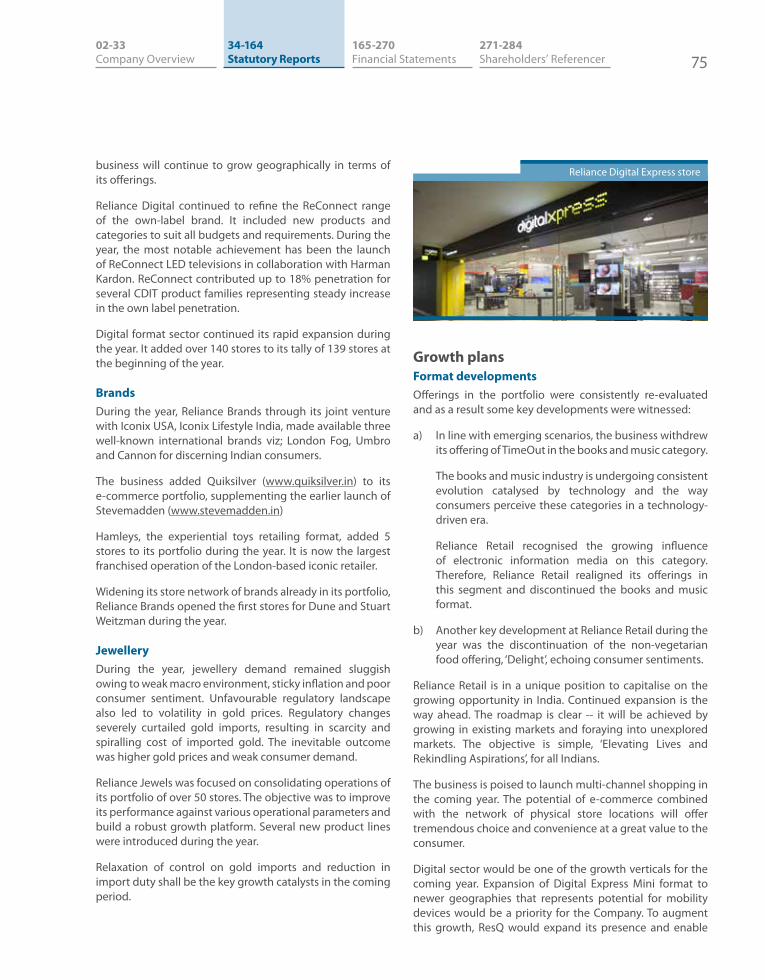
7502-33 Company Overview
165-270 Financial Statements
271-284 Shareholders’ Referencer
34-164 Statutory Reports74
Reliance Industries LimitedAnnual Report 2013-14 Growth is Life...
business will continue to grow geographically in terms of its offerings.
Reliance Digital continued to refine the ReConnect range of the own-label brand. It included new products and categories to suit all budgets and requirements. During the year, the most notable achievement has been the launch of ReConnect LED televisions in collaboration with Harman Kardon. ReConnect contributed up to 18% penetration for several CDIT product families representing steady increase in the own label penetration.
Digital format sector continued its rapid expansion during the year. It added over 140 stores to its tally of 139 stores at the beginning of the year.
BrandsDuring the year, Reliance Brands through its joint venture with Iconix USA, Iconix Lifestyle India, made available three well-known international brands viz; London Fog, Umbro and Cannon for discerning Indian consumers.
The business added Quiksilver (www.quiksilver.in) to its e-commerce portfolio, supplementing the earlier launch of Stevemadden (www.stevemadden.in)
Hamleys, the experiential toys retailing format, added 5 stores to its portfolio during the year. It is now the largest franchised operation of the London-based iconic retailer.
Widening its store network of brands already in its portfolio, Reliance Brands opened the first stores for Dune and Stuart Weitzman during the year.
JewelleryDuring the year, jewellery demand remained sluggish owing to weak macro environment, sticky inflation and poor consumer sentiment. Unfavourable regulatory landscape also led to volatility in gold prices. Regulatory changes severely curtailed gold imports, resulting in scarcity and spiralling cost of imported gold. The inevitable outcome was higher gold prices and weak consumer demand.
Reliance Jewels was focused on consolidating operations of its portfolio of over 50 stores. The objective was to improve its performance against various operational parameters and build a robust growth platform. Several new product lines were introduced during the year.
Relaxation of control on gold imports and reduction in import duty shall be the key growth catalysts in the coming period.
Growth plansFormat developmentsOfferings in the portfolio were consistently re-evaluated and as a result some key developments were witnessed:
a) In line with emerging scenarios, the business withdrew its offering of TimeOut in the books and music category.
The books and music industry is undergoing consistent evolution catalysed by technology and the way consumers perceive these categories in a technology-driven era.
Reliance Retail recognised the growing influence of electronic information media on this category. Therefore, Reliance Retail realigned its offerings in this segment and discontinued the books and music format.
b) Another key development at Reliance Retail during the year was the discontinuation of the non-vegetarian food offering, ‘Delight’, echoing consumer sentiments.
Reliance Retail is in a unique position to capitalise on the growing opportunity in India. Continued expansion is the way ahead. The roadmap is clear -- it will be achieved by growing in existing markets and foraying into unexplored markets. The objective is simple, ‘Elevating Lives and Rekindling Aspirations’, for all Indians.
The business is poised to launch multi-channel shopping in the coming year. The potential of e-commerce combined with the network of physical store locations will offer tremendous choice and convenience at a great value to the consumer.
Digital sector would be one of the growth verticals for the coming year. Expansion of Digital Express Mini format to newer geographies that represents potential for mobility devices would be a priority for the Company. To augment this growth, ResQ would expand its presence and enable
Reliance Digital Express store

Management’s Discussion and Analysis (Continued)
7702-33 Company Overview
165-270 Financial Statements
271-284 Shareholders’ Referencer
34-164 Statutory Reports76
Reliance Industries LimitedAnnual Report 2013-14 Growth is Life...
more and more consumers to experience and benefit from the interplay of communication and technology.
Reliance Market would remain a priority for network expansion as it continues to empower the kiranas and helps the farmers and small manufacturers to benefit from the modern distribution system.
RELIANCE JIO INFOCOMMOperating environmentFrom less than 5 million mobile users in 2001, India has grown to more than 893 million mobile users as of January 2014 (Source: TRAI) achieving more than 72% teledensity. However, the growth in broadband connections has not been commensurate with the enormous growth of India’s telecommunication industry. India has only around 14.5 million broadband (Source: TRAI) connections, excluding internet access by wireless phone subscribers, which is very low compared to other European and Asian countries.
Spectrum acquisition and infrastructure tie upsRIL’s subsidiary, Reliance Jio Infocomm Limited(RJIL) is the only private player with Broadband Wireless Access (BWA) spectrum in all the 22 telecom circles of India, plans to provide reliable fast internet connectivity through the 20 MHz, contiguous, pan-India BWA spectrum. In addition, in the recently concluded spectrum auctions, RJIL successfully acquired 1800 MHz spectrum across 14 key circles to strengthen in-building coverage in LTE. In addition to connectivity, RJIL also plans to enable end-to-end solutions that address the entire value chain across various digital services in key domains of national interest such as, education, healthcare, security, financial services, government-citizen interfaces and entertainment. In October 2013, RJIL received Unified License for all 22 service areas across India and became the first telecom operator in the country to get pan India Unified License. The license allows RJIL to offer all telecom services including voice telephony under a single license. RJIL has migrated its existing ISP license along with BWA spectrum to the Unified License to provide all services allowedunder the license.
RJIL was allotted Mobile Switching Centre Code (MSC), Mobile Country Code (MCC) and Mobile Network Code (MNC) for mobile access services across all 22 circles by the Department of Telecommunications (DoT) providing it with about 22 million mobile phone numbers across India.
In line with the Government’s policy decision of delinking spectrum allocation from the licenses and offering access spectrum based on auction process, the GoI has been
conducting spectrum auctions for the access spectrum from time to time. In the recently concluded spectrum auction, RJIL successfully acquired the right to use spectrum in the 1800 MHz band in 14 key circles across India at a total cost of ` 11,054 crore. This spectrum has been acquired in all metro and Category A circles and all key Category B and C circles over a contiguous block of 5 MHz. With this acquisition, RJIL will be the holder of the largest quantum of liberalised spectrum (spectrum in any band can be used for delivering any services deploying any technology). With the longest residual spectrum life, RJIL plans to use this 1800 MHz spectrum, in conjunction with its pan India 2,300 MHz spectrum to address the expected surge in demand for digital services as well as to enhance in-building coverage. RJIL plans to provide seamless 4G services using FDD-LTE on 1800 MHz and TDD-LTE on 2300 MHz through an integrated ecosystem.
Reliance Jio Infocomm Pte. Limited, Singapore, a subsidiary of RJIL, was granted a Facility Based Operator (FBO) license in Singapore which will allow it to buy, operate and sell undersea and/or terrestrial fibre connectivity, set up its internet point of presence, offer internet transit and peering services as well as data and voice roaming services in Singapore.
RJIL has adopted a partnership based model for telecom infrastructure for 4G wireless and fibre based high speed broadband services.
In line with this strategic intent, RJIL and its wholly owned subsidiaries have finalised the following partnerships for infrastructure sharing:
zz Agreement with Bharti to utilise a dedicated fibre pair on Bharti’s i2i submarine cable between India and Singapore.
zz A construction, maintenance and supply contract for “Bay of Bengal Gateway” cable system to provide connectivity between South East Asia, South Asia and the Middle East among RJIL, Telekom Malaysia Berhad (TM) (Malaysia), Vodafone Group (UK), Omantel (Oman), Etisalaat (UAE) and Dialog Axiata (Sri Lanka)
zz Agreements with Reliance Communications and its affiliates for sharing of their inter-city fibre network, intra-city fibre network, and tower infrastructure
zz Agreement with Bharti Infratel to share their tower infrastructure
zz Agreement with Viom Networks to share their tower infrastructure
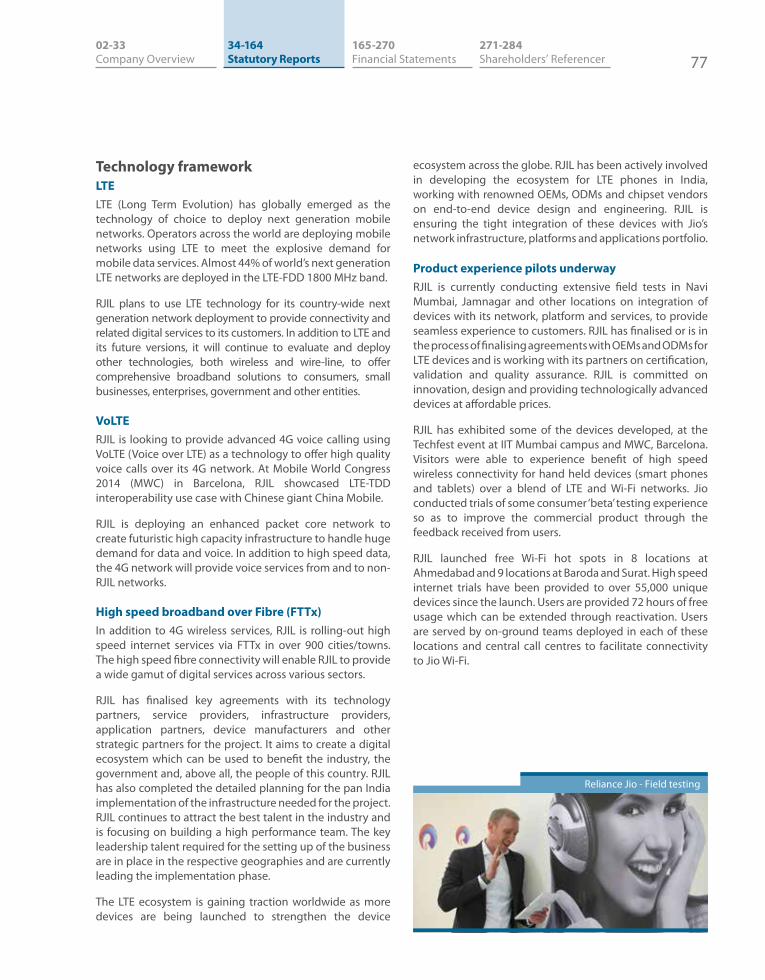
7702-33 Company Overview
165-270 Financial Statements
271-284 Shareholders’ Referencer
34-164 Statutory Reports76
Reliance Industries LimitedAnnual Report 2013-14 Growth is Life...
Technology framework LTELTE (Long Term Evolution) has globally emerged as the technology of choice to deploy next generation mobile networks. Operators across the world are deploying mobile networks using LTE to meet the explosive demand for mobile data services. Almost 44% of world’s next generation LTE networks are deployed in the LTE-FDD 1800 MHz band.
RJIL plans to use LTE technology for its country-wide next generation network deployment to provide connectivity and related digital services to its customers. In addition to LTE and its future versions, it will continue to evaluate and deploy other technologies, both wireless and wire-line, to offer comprehensive broadband solutions to consumers, small businesses, enterprises, government and other entities.
VoLTERJIL is looking to provide advanced 4G voice calling using VoLTE (Voice over LTE) as a technology to offer high quality voice calls over its 4G network. At Mobile World Congress 2014 (MWC) in Barcelona, RJIL showcased LTE-TDD interoperability use case with Chinese giant China Mobile.
RJIL is deploying an enhanced packet core network to create futuristic high capacity infrastructure to handle huge demand for data and voice. In addition to high speed data, the 4G network will provide voice services from and to non-RJIL networks.
High speed broadband over Fibre (FTTx)In addition to 4G wireless services, RJIL is rolling-out high speed internet services via FTTx in over 900 cities/towns. The high speed fibre connectivity will enable RJIL to provide a wide gamut of digital services across various sectors.
RJIL has finalised key agreements with its technology partners, service providers, infrastructure providers, application partners, device manufacturers and other strategic partners for the project. It aims to create a digital ecosystem which can be used to benefit the industry, the government and, above all, the people of this country. RJIL has also completed the detailed planning for the pan India implementation of the infrastructure needed for the project. RJIL continues to attract the best talent in the industry and is focusing on building a high performance team. The key leadership talent required for the setting up of the business are in place in the respective geographies and are currently leading the implementation phase.
The LTE ecosystem is gaining traction worldwide as more devices are being launched to strengthen the device
ecosystem across the globe. RJIL has been actively involved in developing the ecosystem for LTE phones in India, working with renowned OEMs, ODMs and chipset vendors on end-to-end device design and engineering. RJIL is ensuring the tight integration of these devices with Jio’s network infrastructure, platforms and applications portfolio.
Product experience pilots underwayRJIL is currently conducting extensive field tests in Navi Mumbai, Jamnagar and other locations on integration of devices with its network, platform and services, to provide seamless experience to customers. RJIL has finalised or is in the process of finalising agreements with OEMs and ODMs for LTE devices and is working with its partners on certification, validation and quality assurance. RJIL is committed on innovation, design and providing technologically advanced devices at affordable prices.
RJIL has exhibited some of the devices developed, at the Techfest event at IIT Mumbai campus and MWC, Barcelona. Visitors were able to experience benefit of high speed wireless connectivity for hand held devices (smart phones and tablets) over a blend of LTE and Wi-Fi networks. Jio conducted trials of some consumer ‘beta’ testing experience so as to improve the commercial product through the feedback received from users.
RJIL launched free Wi-Fi hot spots in 8 locations at Ahmedabad and 9 locations at Baroda and Surat. High speed internet trials have been provided to over 55,000 unique devices since the launch. Users are provided 72 hours of free usage which can be extended through reactivation. Users are served by on-ground teams deployed in each of these locations and central call centres to facilitate connectivity to Jio Wi-Fi.
Reliance Jio - Field testing
Management’s Discussion and Analysis (Continued)
7902-33 Company Overview
165-270 Financial Statements
271-284 Shareholders’ Referencer
34-164 Statutory Reports78
Reliance Industries LimitedAnnual Report 2013-14 Growth is Life...
RELIANCE HARYANA SEZ LTDReliance Haryana SEZ Ltd (RHSL), is a JV between RIL’s wholly owned subsidiary, Reliance Ventures Limited (RVL), and Government of Haryana through Haryana State Industrial & Investment corporation Ltd (HSIIDC) for developing SEZs /Model Economic Township project and other infrastructure facilities in Haryana. Infrastructure Leasing and Financial Services Limited (IL&FS) became a strategic partner in the MET project in January 2011.
In view of the economic scenario the development of SEZs became unviable and in January 2012, RHSL offered to return 1383.68 acres of land acquired from HSIIDC for setting up SEZs. HSIIDC is in the process of taking back said land from RHSL and exit the JV.
RHSL has commenced development of the phase I of the Model Economic Township and units of Panasonic and Denso are already operational. Land consolidation is in the process and it is expected that over the next one year the Company will be applying for the development of approximately 1000 acres of land.
RHSL has engaged itself in various CSR activities in the field of health care by providing mobile health services to 18 villages, free eye and dental camps, women empowerment and training, technical education and skills development and creation of village infrastructure in the project area.
ENTERPRISE RISK MANAGEMENTRIL actively stimulates entrepreneurship throughout the organisation and encourage its people to identify and seize opportunities. The current economic environment in combination with significant growth ambitions of the Reliance Group carries with it an evolving set of risks. RIL recognises that these risks need to be managed to protect its customers, employees, shareholders and other stakeholders to achieve its business objectives and enable sustainable growth. Risk and opportunity management is therefore a key element of the overall RIL strategy. This section provides an overview of the key strategic risks, the RIL risk & control framework, and its approach to risk management.
Creating Value through Risk ManagementRIL operates in diverse industries and global markets and therefore requires a balanced approach to risk management. An integrated system of risk management and internal controls framework which is tailored to the specific RIL segments and businesses is deployed taking into account various factors such as the size and nature of the inherent risks and the regulatory environment of the individual business segment or operating company. This framework
undergoes continuous improvements to allow RIL management to optimise its management of risk exposures while taking advantage of business opportunities.
RIL’s View on RiskRisk AppetiteRIL’s risk appetite is linked to its strategic approach and is based on the stance it has taken across five areas:
zz Strategic: RIL manages strategic risk in the pursuit of profitable growth in both mature and emerging markets. Given the volatile markets and economic climate in which it operates, the adaptability of its people, its service offering and its infrastructure are key
zz Operations: To strive to minimize all people and safety risks and take a balanced approach to other operations risks, taking into account the risk and reward profile of key business decisions
zz Financial: To maintain a prudent financing strategy, even when undertaking major investment and therefore taking controlled risks in this area
zz Reporting: RIL believes that accurate and reliable information provides a competitive advantage and is key to effective management of its business. It therefore accepts minimal risk in relation to reporting risks
zz Compliance: To comply with laws and regulation is fundamental to maintaining its license to operate in the various industries that it operates in
Risk FactorsRIL’s focus is on those risks that threaten the achievement of business objectives of the Group over the short to medium term. An overview of these risks is provided hereafter, including the actions taken to mitigate these risks and any related opportunities:
Strategic RisksPrices and MarketsRIL’s financial performance is subject to the fluctuating prices of crude oil & gas and downstream petroleum products. Prices of oil & gas products are affected by supply and demand, both globally and regionally. Factors that influence the supply and demand include operational issues, natural disasters, political instability, economic conditions etc. For example lower prices will mean lower revenues for RIL’s upstream production and as a result the long term projects may become less profitable. Additionally, this may also have the impact on reserves booking. Prolonged unfavourable conditions could also result in, cancellation of projects

7902-33 Company Overview
165-270 Financial Statements
271-284 Shareholders’ Referencer
34-164 Statutory Reports78
Reliance Industries LimitedAnnual Report 2013-14 Growth is Life...
or impairment of assets. Since RIL operates an integrated hydrocarbon business some of these risks can be offset by gains in other parts of the Group. In addition, RIL proactively hedges these exposures.
Competitive ForcesWhile RIL seeks to compete on the basis of product differentiation, it operates in commodity-type markets. It is therefore important to manage its costs to ensure it has an edge in pricing over its competitors.
Surplus refining capacity in India, augmentation of refining capacities by PSUs and the additions of new refining capacity in Asia, notably in China and the Middle East will increase competition in the region potentially impacting GRM in its Refining and Marketing business. As a risk mitigating strategy, RIL continues to diversify its product portfolio and also develop new export markets. It is also investing in projects to strengthen cost competitiveness.
Brand and Reputational risksRIL is one of the leading brands in the country, hence its brand and reputation is an important asset. The Group has defined the Code of Conduct and Operating Model that govern how all employees in RIL and its Group companies operate. Compliance with these codes of conduct, organisational policies and other regulatory compliance and governance requirements are key to protect Reliance’s reputation.
Political instability, acts of terrorism, government policiesSocial or civil unrest, within India or internationally can have an impact on the Group’s operations. Potential developments that may impact its business operations include government pricing policy of petroleum products, piracy on high seas, any changes to Indo-US economic policy, acts of terrorism or civil unrest that may have an impact on safe operation of its facilities and transportation of its products.
Political unrest and tensions in the Middle East, North Africa can cause short term fluctuations in crude oil prices and crude availability. To mitigate the risks resulting from non-availability of crude and feedstocks, the Company has a diversified crude sourcing strategy from multiple geographies (Asia, Middle East, West Africa, Latin / South America and North Africa) under both short term and long term arrangements.
Operations RisksChanging Technology and Obsolescence RiskThe changing technologies and the natural ageing of existing facilities pose the risk of production plants becoming obsolete and uneconomic. Aged plants are prone to unplanned shutdowns and increased maintenance and operating costs. Deployment of new technologies and on-going maintenance processes are key to enhancing the reliability of operations and reduction in operating costs while improving the safety of operating conditions while extending the useful life of assets.
Evolving HSSE risksThe RIL Group is exposed to a wide spectrum of health, safety, security and environmental risks (HSSE), given the diversity and complexity of the industries RIL operates in. The exploration and production of oil & gas, transport of the hydrocarbons and their further refining and processing is regulated by various HSSE related regulations across the geographies where RIL operates. A major HSSE incident, such as fire, oil spill, security breach can result in loss of life, environmental degradation and overall disruption in business activities. RIL follows an HSE Policy that “Safety of persons overrides all production targets”, which incentivises all employees to strive for excellence in safety management for the benefit of its employees, customers and the communities in which they live. RIL has set itself the goal of ‘zero injuries and accidents‘. The Group conducts HSSE audits to get assurance on HSSE managements frameworks protocols and regulatory compliances.
Financial RisksTreasury RisksTreasury risks include, amongst others, exposure to movements in interest rates and foreign exchange rates. The Group is exposed to fluctuating dollar and euro prices. While a majority of the Company’s purchases and sales are denominated in US dollars, the Company is exposed to currency risk where the realisation of sales proceeds is in local currencies.
The Group seeks to maintain a financial framework to ensure that it is able to maintain an appropriate level of liquidity and financial capacity. This framework constrains the level of capital at risk for the purposes of position taken in financial instruments. RIL uses debt instruments like commercial paper and bonds to raise capital. The main Treasury risks include interest rate risks and foreign exchange risk.
Interest Rate RisksRIL borrows funds in the domestic and international markets to meet long-term and short-term funding requirements. It
Management’s Discussion and Analysis (Continued)
8102-33 Company Overview
165-270 Financial Statements
271-284 Shareholders’ Referencer
34-164 Statutory Reports80
Reliance Industries LimitedAnnual Report 2013-14 Growth is Life...
is subject to risks arising from interest rate fluctuations both LIBOR and Rupee based interest rates since majority of RIL’s borrowing are floating rate debt.
Foreign Exchange RisksRIL has majority of operations in the markets which are priced in directly or indirectly in US dollars. As a result the functional currency for most of the RIL Businesses is dollar with a reporting currency in INR. The major currency to which RIL is exposed is US Dollar. Consequently RIL is exposed to varying levels of foreign exchange risk when it enters into transactions which are not denominated in INR, when foreign currency monetary assets and liabilities are translated at the reporting date and as a result of holding net investment in operations which are non-INR.
Commodity Related RisksCommodity risk management is an important component of RIL’s supply and distribution function. The Company is exposed to risks arising from:
zz Timing risk resulting from mismatch between pricing in of crude and feedstocks and pricing out of petroleum products
zz Absence of liquidity in the market and ability to hedge known exposures
zz Basis risk resulting from differences between the pricing basis for the physical purchases / sales and the pricing basis of the underlying hedging instruments used to hedge the financial exposures created from the physical trades
The Company has put in place Treasury and Commodity risk management policies which provide the framework for decision making with respect to currency exposures and commodity trading positions.
Reporting RisksEstimation of provisions and reservesThe estimation of proved oil & gas reserves involves subjective judgements and determinations based on available geological, technical, contractual and economic information. These estimates may change depending on availability of new information from production and drilling activities, or changes in economic factors like change in pricing of crude oil, projection of foreign exchange rates, natural decline in the field and unexpected geological complexity etc. The published provisions and reserves may also be subject to correction due to errors in application of published rules and change in guidance. Any downward adjustment would indicate lower production volumes in the upstream business.
Compliance RisksThe evolution of the regulatory environment across the globe has resulted into increased regulatory scrutiny that raises minimum standards required at Reliance. This signifies the alignment of corporate performance objectives, whilst ensuring compliance with regulatory requirements. RIL recognises that regulatory requirements can be both a threat and a source of competitive advantage and therefore it will:
zz Strive to understand the changing regulatory standards so as to strengthen its decision making processes and integrate these in its business strategy of each of the industries in which it operates
zz Drive business performance through the convergence of risk, compliance processes and control mechanisms to ensure continued operational efficiency and effectiveness
zz Exploit significant opportunities arising out of changing regulatory landscape to realign business processes and strategies
How RIL Manages RiskReliance’s Board of Directors is responsible for the direction and oversight of the Group, its governance principles as well as the establishment of a system of internal control to mitigate material business risks. The Reliance Executive Committee is responsible for the design and operation of the Reliance System of Internal Control which includes Risk Management and Internal Control frameworks and for reviewing its effectiveness.
The System of Internal Control is designed to manage the risks that may prevent RIL from achieving its business objectives and to provide reasonable assurance that all material misstatements, frauds or violations of laws and regulations will be prevented. The RIL system of internal control which includes:
a) Governance Structures and Policies
zz Establishing and communicating a common vision, mission, values and strategies by top management (strategy setting)
zz Establishing appropriate performance management systems and processes to drive the achievement of Group objectives (performance management)
zz Establishing expected and acceptable behaviours while pursuing the achievement of business objectives through a code of conduct (tone from the top)

8102-33 Company Overview
165-270 Financial Statements
271-284 Shareholders’ Referencer
34-164 Statutory Reports80
Reliance Industries LimitedAnnual Report 2013-14 Growth is Life...
zz Delegation of authorities which establishes levels of autonomy at the various levels in the organisation
b) Risk Management and Internal Control
zz Policies and procedures which codify requirements with respect to the management of risks and opportunities
zz Risk management processes which manage the key business risks of the Group and each Business segment
zz Operational controls embedded within the business processes to enable the achievement of business objectives
zz Information systems which support the decision making processes at all levels of the organisation
c) Independent Internal and External Assurance
d) Board and Business Oversight mechanisms
Governance Structures and PoliciesThe setting of clear and effective business objectives for the Group is a key aspect of the system of internal control. RIL’s Group strategic framework sets out its Group strategy, financial framework and how it manages risk. RIL has clearly defined its vision, mission and core values. Its Group strategy focuses on safety and centres on playing to its competitive strengths. Senior leadership plays a critical role in ensuring conformance with RIL’s stated business principles and core values.
Risk Management and Internal ControlRIL has introduced several improvements to Integrated Enterprise Risk Management, Internal Controls Management and Assurance Frameworks and processes to drive a common integrated view of risks, optimal risk mitigation responses and efficient management of internal control and internal audit activities. This integration is enabled by all three being fully aligned across Group wide Risk Management, Internal Control and Internal Audit methodologies and processes supported by a common SAP GRC platform. The RIL Group has adopted the following key risk mitigation and internal control design principles and strategies:
zz Risk management and Internal Control frameworks are designed and implemented to manage rather than completely eliminate the risk of failure to achieve business objectives
zz Maximising the Embedding of Controls in systems and business process designs (configured automated checks and balances, configured delegations, as well as
automated monitoring with alerts and shut outs where necessary) to reduce the resource burden of controls.
zz Dual Ownership for Risk Management – Business segments have primary accountability for business risks but Corporate Functions (Finance, HR, IT) operate and support Business segments in ensuring an effective control framework. The Business and Functional CEOs are the key owners of the control framework for their respective Business or Function.
zz A “Three-Not-Out” risk mitigation model is applied in each high exposure area with multiple checks (initiate, validate, approve) and hardware redundancy for enhanced process safety.
zz In-line and off-line audits of significant risk areas and controls deployed through systems, processes and other operational activities. These assurance activities are designed to provide reasonable but not absolute assurance against material misstatement or loss.
zz Where a significant risk materialises into a significant business incident, these are to be managed through the Groups Business Continuity, Emergency Response and Crisis Management Processes.
These elements increasingly provide the “foundations” of the Reliance Risk Management and Internal Control Frameworks.
RIL’s Risk Management Approach
Risk Areas
1) System & Process embedded
3) “Three-not-out” protection applied
2) Dual ownership
4) In-line and off-line audits
Independent Internal and External AssuranceEffective Risk Management and Internal Audit functions are key elements of the RIL governance framework. Risk management ownership is fully embedded in the Business whilst the Risk Management function aligns, supports and facilitates the risk management processes of the Group. The Internal Audit Function provides assurance to the Board

Management’s Discussion and Analysis (Continued)
8302-33 Company Overview
165-270 Financial Statements
271-284 Shareholders’ Referencer
34-164 Statutory Reports82
Reliance Industries LimitedAnnual Report 2013-14 Growth is Life...
and Senior Management in the various Businesses and Functions that the system of internal control deployed is appropriately designed to manage the key business risks and is operating effectively.
Governance, Risk Management, Internal Controls and Internal Audit are aligned at Group level to enable full alignment and integration of integrated methodologies, processes and systems. The Internal Audit and Risk Management functions report directly to the Chairman and Managing Director with direct access to the Chairman of the Audit Committee. The role of Internal Audit, its mission and goals, are set out in the Company’s Internal Audit Charter, which has been approved by the Audit Committee and Executive Committee.
Board and Business Oversight Mechanisms (Business Risk and Assurance Committees)During 2013, Business Risk and Assurance Committees (BRACs) were established to provide the necessary formal structures to implement the Group’s Risk Management policies and to facilitate the risk management process for the respective Businesses and Functions. The BRACs provide a platform to:
zz Integrate multidisciplinary views on the key organisational risks
zz Prioritise the most relevant risks to the Business or Function
zz Align risk management, internal control and assurance activities across the Three Lines of Defence: Business and Functions, Controlling and Compliance Functions and Internal Audit
The BRAC for each Business or Function integrates the senior leadership representation of the business, Risk management and Internal Audit Functions around a common agenda covering governance, risk management and internal audit matters. The Committee meet on quarterly basis to review and assess the effectiveness of the respective risk management and internal control frameworks. BRACs provide an integrated view of risk to the Audit Committee and Executive Committee on a quarterly basis.
INNOVATION, RESEARCH & DEVELOPMENTInnovation is not only important for organisational sustainability, but also vital for long-term value creation. Innovation can happen as one all-encompassing stroke or in small incremental steps, both of which can take the business to the next level.
RIL believes in pushing boundaries to achieve business innovation. Innovation can mean elevation in the level of technology being used, greater diversity or resilience in the business model being pursued or application of higher intelligence and deeper insight in the processes being followed in resource utilisation. RIL has shaped an organisational culture that fosters innovation at every single step.
The drive for innovation is led by the Reliance Innovation Council comprising Nobel laureates, global strategists and iconic thought leaders. The Council meets annually to give direction to RIL’s innovation agenda. The Reliance Innovation Leadership Centre (RIL-C) manages the innovation ecosystem with the aim of making innovation, a way of life at RIL. The ecosystem approach defines innovation in the realm of people, processes, systems, technology, new businesses and structures. RIL-C identifies innovation opportunities across the organisation and designs, develops and deploys innovation programmes. For example, the ‘Beyonders’ programme aims at grooming innovation leaders by giving potential leaders an opportunity to innovate, as well as training on systematic methods of innovation.
The Leading Expert Access Programme (LEAP) ‘democratises inspiration’ by providing a platform for interaction with luminaries and accomplished leaders from diverse areas. Powered by creative energies of thousands of its people, RIL will surely succeed in creating new exponential value, with the ultimate aim of reinventing the way people live their lives.
Research & Technology and Innovation are two key focus areas to enhance RIL’s value creation, identifying new platforms for its sustainable growth. ’Reliance Technology Group’ (RTG), RIL’s centre for research and technology activities, focuses on (i) new products, processes and catalyst development to support existing business, and create breakthrough technologies for new businesses, and (ii) advanced troubleshooting, support to capital projects, and profit and reliability improvements in manufacturing plants.
To accelerate research efforts at RIL, a new Research Centre has been recently commissioned at the Reliance Corporate Park (RCP) in Navi Mumbai. The facility will be the central hub of research and new technologies. It is a world-class facility providing state-of-the-art equipment for hundreds of RIL’s scientists and engineers. In R&D, RIL has broken new ground to develop game-changing products and technologies to add value to existing businesses, and create new business opportunities.
In Refining, RTG continues to pursue research in coking, hydro processing, fluidised catalytic cracking (FCC), crude

8302-33 Company Overview
165-270 Financial Statements
271-284 Shareholders’ Referencer
34-164 Statutory Reports82
Reliance Industries LimitedAnnual Report 2013-14 Growth is Life...
processing, molecule-based process optimisation and value addition from low-value refinery streams.
In Petrochemicals, RTG is providing technology support to olefin crackers, polymers, fibre intermediates, linear alkyl benzene (LAB) and polyester. The focus areas include:
a) Efficient asset utilisation
b) Development of specialty product grades/materials/catalysts
c) Value addition to by-product streams and
d) Leveraging opportunities at the chemicals/oil interface
Several projects in the following areas have been completed or are on-going across the refining and petrochemicals businesses:
zz Product development and improvements
zz Process development and improvements
zz Energy efficiency
zz Enhancing product value to customer
zz Application development
zz Catalyst development
zz Additive development
zz Automation technology
For more detail refer the Technology Absorption section in the Directors Report.
RTG also provides advanced technical support through computational fluid dynamics and multiple advanced simulation tools. The modelling and simulation group is engaged in resolving several important refinery and petrochemicals reliability issues, leveraging computational fluid dynamics and other simulation tools.
India’s agro residue potential is being recognised only recently. RIL’s bio-based chemicals/fuels strategy aims to leverage India’s large quantum of agro-residue availability as a feedstock, and help improve the country’s energy security.
Several technologies have been developed including the following:
1. Technologies to convert the agri-residue into fuel and chemicals
2. Developing Jatropha-based biodiesel
3. Project with CSIR on indigenous ’polymer electrolyte membrane’ (PEM) fuel cell technology development
Collaborative research projects with IIP Dehradun, IIT Mumbai, PDPU Ahmedabad, Delhi University, Himachal Pradesh Horticultural University, IICT-Hyderabad, Shah-
Schulman Centre for Surface Science and Nano Technology, DDU-Nadiad and IIT Kharagpur are being undertaken. An industry programme with Tulsa University is also underway.
Clean Development Mechanism (CDM)RIL has built in-house capacity to develop Clean Development Mechanism (CDM) projects and obtain CDMs registration and issuance in the form of Certified Emission Reductions (CERs) from the United Nations Framework Convention on Climate Change (UNFCCC).
RIL is continuously working towards the development and implementation of climate change mitigation projects, primarily through energy efficiency and use of cleaner fuels. This year, RIL has taken up various initiatives to deploy renewable energy like rooftop solar photovoltaic projects, biogas generation project and wind resource assessment to explore possibility of wind turbines installation.
SMART TRANSFORMATION AT RELIANCEReliance is working to deliver a large scale, multi-year business transformation program called STAR (Smart Transformation At Reliance). The rationale behind STAR is to enable the institutionalisation of RIL’s DNA. Powerful project management skills have been one of RIL’s biggest strengths. Supplementing these through robust business process framework and best-in class IT solutions will allow the Company to retain its competitive advantage. It would also help the Company bring end-to-end digital chain to free up resources. This will help enhance organisational entrepreneurship and create a world-class human resource framework to retain talent and fulfill mission of being an “Employer of Choice”.
Coverage of STARSTAR covers three businesses, Exploration & Production, Refining & Marketing and Petrochemicals and support functions such as Manufacturing, Projects, Procurement & Contracting, Logistics, Human Resources, Finance, Shared Services, IT, Research and Development and Security.
Development during the yearProgress has been made to integrate process models with the system solution landscape to ensure integrated process change management. The key state-of-the-art solutions benefitting RIL in the areas of advanced planning, plant data reconciliation and validation, operational performance management and analysis and quality management have also been implemented. A team of around 950, inclusive of RIL employees and external consultants have been working
Management’s Discussion and Analysis (Continued)
8502-33 Company Overview
165-270 Financial Statements
271-284 Shareholders’ Referencer
34-164 Statutory Reports84
Reliance Industries LimitedAnnual Report 2013-14 Growth is Life...
on this initiative during FY 2013-14 to make it successful. Thus far, significant progress has been made in the following areas:
Process1. Completed basic and detailed design, including
business blueprinting for 265 end-to-end business processes.
2. Detailed designing and integration of all key end-to-end improved business processes.
3. The first SAP systems implementation, which fully integrates processes, has been successfully delivered for the Exploration & Production business.
Data4. The design and implementation of a robust data
architecture and data to support integrated business processes.
People5. RIL has taken strong steps forward in its HR
transformation, a key part of its STAR Business Transformation programme. Under the banner of R-HR Transformation, the programme is steeped in a desire to drive both a culture change in Reliance, as well to embrace new business processes used and advocated by the world’s top multi-national companies. The objective of this transformation is to achieve Reliance’s vision of being:
“A modern, progressive people environment, where purpose-driven talent are attracted and motivated by a consistent meritocratic HR framework and where high quality leaders capable of realising RIL business goals, are identified, encouraged, and rewarded.”
Focus for next yearThe focus for FY 2014-15 will be to continue with the delivery momentum and begin full deployment of transformed business processes for the Refining and Marketing and Petrochemical businesses, including all support functions, and Wave 2 scope of the HR Transformation scope which will focus on talent management processes. When fully deployed, all of these transformation projects will create a foundation to support and enable us to propel and be ready for the next phase of growth.
HUMAN RESOURCE DEVELOPMENTHuman resource accountingRIL firmly believes that growth of core and fringe stakeholders’ will foster its growth opportunities. RIL aims
to develop the potential of every individual associated with the Company as a part of its business goal.
As on 31st March, 2014, 23,853 employees are on RIL’s payroll. The current workforce breakdown structure has a good mix of employees at all levels.
Respecting the experienced and mentoring the young talent has been the bedrock for RIL’s successful growth. RIL’s employees’ age bracket represents a healthy mix of experienced and willing-to-experience employees.
Human resource transformationHuman resources are the principal drivers of change. They push the levers that take futuristic businesses to the next level of excellence and achievement. RIL focuses on providing individual development and growth in a work culture that enables cross-pollination of ideas, ensures high performance and remains empowering. At RIL lot of focus has been given to HR Transformation activities to revamp the HR organisation structure and processes. The new human resource management systems and processes are designed to enhance organisational effectiveness and employee alignment. The result is that the Company is able to work towards market leadership in all the businesses that it operates.
During 2013-14, focus has been on transforming five areas of Organisational Hierarchy, Performance Management, Differentiated Rewards, Delegation of Authority, and HR Model.
Any transformation journey needs a significant change management effort. RIL’s focus has been to ensure the absorption of change through proper modes of communication, such as town-hall discussions, emails, webinars, and webcasts, among others. Focused efforts are being taken to promote ‘Acceptance’ and ‘Adoption’ as a part of facilitating change management. The consistent measurement of change management has enhanced effectiveness of change management efforts. As a part of change management, a Human Resources portal has been launched for all employees to provide them information regarding all HR transformation initiatives.
Significant efforts have gone into developing a strong leadership potential across RIL locations by imparting leadership qualities in employees through highly focussed training programmes. A lot of impetus has been given to e-learning which also simplifies the learning process and puts employees on an accelerated learning path.

8502-33 Company Overview
165-270 Financial Statements
271-284 Shareholders’ Referencer
34-164 Statutory Reports84
Reliance Industries LimitedAnnual Report 2013-14 Growth is Life...
Talent pipeline RIL hires best-fit talents to meet the present and future talent requirements. Over the last year, the Company has hired 2,914 employees in different roles.
The Reliance Accelerated Leadership Programme (RALP), institutionalised three years ago, continues to be a centrepiece of RIL’s future leadership pipeline. Two batches of RALPs have been already hired, and this year, the focus was on ensuring their assimilation into the organisation.
During the current fiscal, RIL hired 57 management graduates and 751 graduate engineers from India’s leading institutes as a part of RIL’s campus recruitment initiative. The numbers are likely to increase in the future with RIL’s foray into new-age businesses.
Learning and developmentRIL strives to keep its employees updated with the latest cutting edge developments in their fields of work and promote them to take up new challenges outside their familiar domains. Cross-functional learning and developing managerial capabilities is the crux of RIL’s learning agenda. The 70:20:10 principle has been adopted across all training initiatives. RIL has focussed on giving leaders three broad categories of experiences, 70% through the challenging work on hand, 20% through interaction with people and 10% from training activities. This combination has helped RIL’s employees in getting to learn things as they grow in their career through their day-to-day activities.
RIL’s imparted a total of thirteen lakhs sixty thousand man-hours of trainings to its employees from both internal as well as external subject matter experts till 31st March, 2014. RIL also ensures that all its contract workforce is well trained on Health, Safety and Environment before commencing any work.
The Learning and development team focused on developing and imparting training to implement elements of Employee Value proposition that was created last year.
The academies of Information Technology, FC&A (Finance, Compliance and Accounts), GMS (Group Manufacturing Services), P&C (Procurement and Contract), Institute of Leadership and HR were strengthened by inducing new talent. Their effectiveness was measured to ensure improvement. New academies for E&P, Petrochemicals, Refining and Security are focus areas for launch.
The broad categories of training include:
zz Behaviouralzz Functional / Domainzz Business related
RIL partnered leading institutions and professional bodies worldwide, including Harvard Business School, Bersin, Corporate Executive Board, among others in pursuit of knowledge building and develop world-class experience and expertise.
DiversityRIL ensures diversity in workforce by promoting employees to maintain their identity, while adhering to the Company’s values and behaviour. Concentrated effort on gender and age diversity has been initiated through workshops and training programs.
RIL’s total workforce strength as on 31st March, 2014 is 23,853 including 1149 female employees. RIL employs people from 23 nationalities.
A concentrated effort on gender and age diversity has been initiated through workshops and training programmes.
A concerted effort to empower women was made through the following initiatives:
zz Policy for prevention of sexual harassment was rolled out
zz Internal complaints committees, as per legal guidelines, were set up at major locations
zz Diversity and inclusion council was set up
Human rightsIt is RIL’s firm belief that respect for human rights represents the foundation for good corporate governance. RIL’s units maintain 100% compliance with local and national laws regarding ethics and human rights. RIL also strives to comply with all global standards and norms. RIL adheres to the principles of United Nation’s Universal Declaration of Human Rights. Every employee is exposed to these topics through organised training programmes.
QualityRIL continued its journey towards achieving excellence by instilling employees with a high regard for quality. More employees are being trained on Six-Sigma as a part of this overarching initiative.
This year has seen 19,428 man hours of training being provided to employees on Six-Sigma. During the year, 78 six-sigma projects have been executed, leading to annualised savings of ` 83.1 crore.
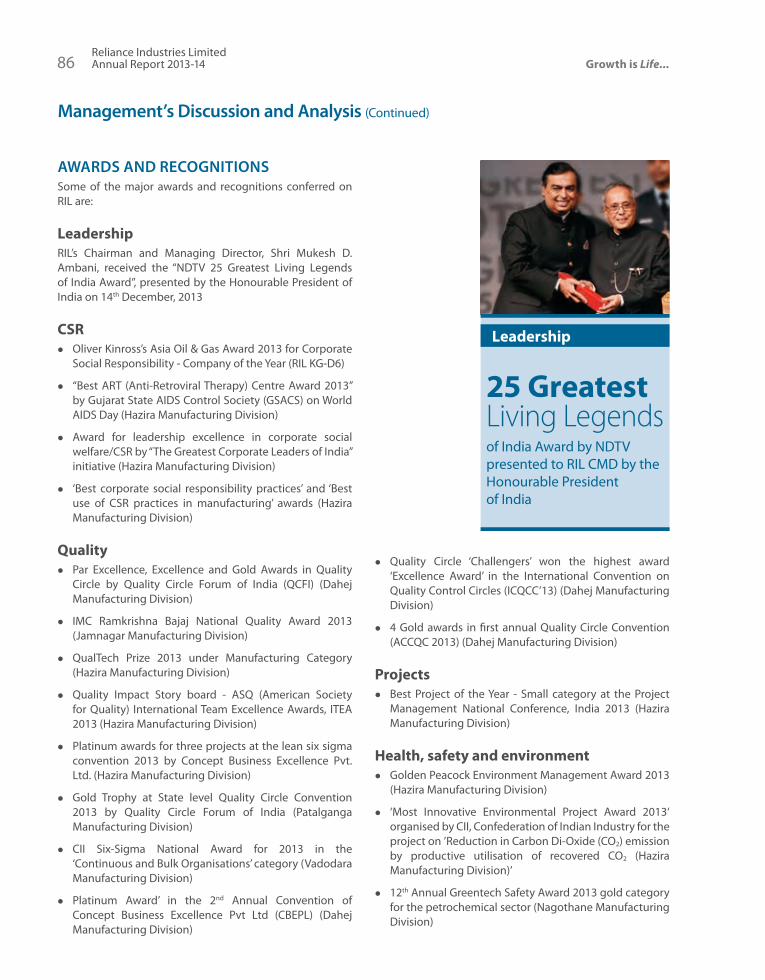
Management’s Discussion and Analysis (Continued)
8702-33 Company Overview
165-270 Financial Statements
271-284 Shareholders’ Referencer
34-164 Statutory Reports86
Reliance Industries LimitedAnnual Report 2013-14 Growth is Life...
AWARDS AND RECOGNITIONSSome of the major awards and recognitions conferred on RIL are:
LeadershipRIL’s Chairman and Managing Director, Shri Mukesh D. Ambani, received the “NDTV 25 Greatest Living Legends of India Award”, presented by the Honourable President of India on 14th December, 2013
CSRzz Oliver Kinross’s Asia Oil & Gas Award 2013 for Corporate
Social Responsibility - Company of the Year (RIL KG-D6)
zz “Best ART (Anti-Retroviral Therapy) Centre Award 2013” by Gujarat State AIDS Control Society (GSACS) on World AIDS Day (Hazira Manufacturing Division)
zz Award for leadership excellence in corporate social welfare/CSR by “The Greatest Corporate Leaders of India” initiative (Hazira Manufacturing Division)
zz ‘Best corporate social responsibility practices’ and ‘Best use of CSR practices in manufacturing’ awards (Hazira Manufacturing Division)
Qualityzz Par Excellence, Excellence and Gold Awards in Quality
Circle by Quality Circle Forum of India (QCFI) (Dahej Manufacturing Division)
zz IMC Ramkrishna Bajaj National Quality Award 2013 (Jamnagar Manufacturing Division)
zz QualTech Prize 2013 under Manufacturing Category (Hazira Manufacturing Division)
zz Quality Impact Story board - ASQ (American Society for Quality) International Team Excellence Awards, ITEA 2013 (Hazira Manufacturing Division)
zz Platinum awards for three projects at the lean six sigma convention 2013 by Concept Business Excellence Pvt. Ltd. (Hazira Manufacturing Division)
zz Gold Trophy at State level Quality Circle Convention 2013 by Quality Circle Forum of India (Patalganga Manufacturing Division)
zz CII Six-Sigma National Award for 2013 in the ‘Continuous and Bulk Organisations’ category (Vadodara Manufacturing Division)
zz Platinum Award’ in the 2nd Annual Convention of Concept Business Excellence Pvt Ltd (CBEPL) (Dahej Manufacturing Division)
zz Quality Circle ‘Challengers’ won the highest award ‘Excellence Award’ in the International Convention on Quality Control Circles (ICQCC’13) (Dahej Manufacturing Division)
zz 4 Gold awards in first annual Quality Circle Convention (ACCQC 2013) (Dahej Manufacturing Division)
Projectszz Best Project of the Year - Small category at the Project
Management National Conference, India 2013 (Hazira Manufacturing Division)
Health, safety and environmentzz Golden Peacock Environment Management Award 2013
(Hazira Manufacturing Division)
zz ‘Most Innovative Environmental Project Award 2013‘ organised by CII, Confederation of Indian Industry for the project on ’Reduction in Carbon Di-Oxide (CO2) emission by productive utilisation of recovered CO2 (Hazira Manufacturing Division)’
zz 12th Annual Greentech Safety Award 2013 gold category for the petrochemical sector (Nagothane Manufacturing Division)
25 Greatest Living Legendsof India Award by NDTV presented to RIL CMD by the Honourable President of India
Leadership

8702-33 Company Overview
165-270 Financial Statements
271-284 Shareholders’ Referencer
34-164 Statutory Reports86
Reliance Industries LimitedAnnual Report 2013-14 Growth is Life...
zz Greentech Safety Gold Award 2013 for safety performance (Silvassa Manufacturing Division)
zz Golden Peacock National Award for Occupational Health & Safety 2012-13 in the petrochemical sector (Nagothane Manufacturing Division)
zz Gold Award in the petrochemical sector in ‘14th Annual Greentech Environment Award 2013’ (Nagothane Manufacturing Division)
zz “International Safety Award 2014” with distinction for Health and Safety Management System performance for the year 2013 (Jamnagar SEZ refinery)
zz SHRM HR AWARDS 2013 in the ‘Organisational Awards’ category for ‘Employer with Best Employee Health and Wellness Initiatives’
zz Greentech Environment Award 2014 – Gold Award for highest level of commitment to environment management (Dahej Manufacturing Division)
Energy and water conservation / efficiencyzz Excellent Energy Efficient Unit Award at the CII National
Energy Summit (Hazira Manufacturing Division)
zz Excellent Energy Efficiency Unit Award 2013 at CII Energy Summit (Nagothane Manufacturing Division)
zz Excellence in Energy Conservation and Management under category Petrochemical sector by Maharashtra Energy Development Agency (MEDA) (Patalganga Manufacturing Division)
zz International Green Apple Award 2013 by The Green Organisation, UK for optimisation of Gas turbines (Jamnagar Manufacturing Division – SEZ refinery)
zz “Best energy efficient unit 2013” by CII (Jamnagar DTA refinery)
zz Outstanding performance in energy conservation award by Southern Gujarat Chamber of Commerce and Industries (SGCCI) (Hazira Manufacturing Division)
Technology, patents, R&D and innovationzz Best Practices - Improvements in Manufacturing in the
25th Qimpro Convention 2013 (Runners up) (Patalganga Manufacturing Division)
zz Petrofed Innovator Award of the year 2012 (Reliance Technology Group)
zz I.C.C. Award for Excellence in Chemical Plant Design and Engineering for the year 2012 (Reliance Technology Group)
zz 3rd National award, 2013 for Technology Innovation in Petrochemical & Downstream Plastic Processing Innovation award from Ministry of Chemicals & Fertilizers, Government of India (Reliance Technology Group)
Retailzz Asian Human Capital Award 2013 - Special
Commendation Prize for Work Smart - A Business Excellence and Workforce Enablement Programme (Reliance Retail Academy)
zz Star Retailer Award - Consumer Durables Retailer of the year 2013 (Reliance Digital)
zz India Fashion Forum 2014 - Images Most Admired Fashion Retail Destination Of The Year (Reliance Trends)
zz Images Retail Awards 2013 - Images Most Admired Retailer of the year (Reliance Trends)
zz Reliance Trends ranked amongst top 10 “Brands to look out for in 2014”. (Reliance Trends)
zz Great Place To Work in Retail Industry 2013 (Marks and Spencer Reliance India)
Sustainabilityzz CII-ITC Sustainability Awards 2013 - India’s Most
Sustainable Companies (Hazira Manufacturing Division)
zz Golden Peacock Award for Sustainability 2013. (Nagothane Manufacturing Division)