MANAGEMENT’S DISCUSSION AND ANALYSIS AND CONSOLIDATED ... · management’s discussion and...
80
MANAGEMENT’S DISCUSSION AND ANALYSIS AND CONSOLIDATED FINANCIAL STATEMENTS For the Years Ended December 31, 2016 and 2015 WORLDWIDE KNOWLEDGE - LOCAL SOLUTIONS ™
Transcript of MANAGEMENT’S DISCUSSION AND ANALYSIS AND CONSOLIDATED ... · management’s discussion and...
MANAGEMENT’S DISCUSSION AND ANALYSIS AND CONSOLIDATED FINANCIAL STATEMENTS
For the Years Ended December 31, 2016 and 2015
WORLDWIDE KNOWLEDGE - LOCAL SOLUTIONS™

Page left intentionally blank

Trican Well Service Ltd.
MD&A Years Ended December 31, 2015 & 2016 | 03
CONTINUING OPERATIONS - FINANCIAL REVIEW
Three months ended Twelve months ended
($ millions, except per share amounts, unaudited)
Dec. 31, 2016
Dec. 31, 2015
Sept. 30, 2016
Dec. 31, 2016
Dec. 31, 2015
Revenue 114.8 157.8 78.0 325.2 649.7
Operating income / (loss) (1) (7.4) 14.7 (6.8) (69.8) 16.0
Adjusted operating income / (loss) (1) 1.1 19.4 (3.2) (37.4) 34.9
Gross profit / (loss) (10.1) (7.2) (13.7) (83.5) (26.7)
Net income / (loss) 56.9 (16.5) (14.7) (40.7) (62.8)
Per share - basic and diluted 0.29 (0.11) (0.08) (0.24) (0.42)
Notes:
(1) Trican makes reference to operating income / (loss), adjusted operating income / (loss), adjusted general and administrative expenses. These measures are not recognized under International
Financial Reporting Standards (IFRS) and are considered non-GAAP measures. Management believes that, in addition to gross profit / (loss) and profit / (loss), operating income / (loss), adjusted
operating income / (loss); and adjusted general and administrative expenses, adjusted corporate expenses are useful supplemental measures.
� Operating income / (loss) provides investors with an indication of profit / (loss) before depreciation and amortization, foreign exchange gains and losses, asset impairment, other
(income) / loss, finance costs and income tax expense / (recovery).
� Adjusted operating income / (loss) provides investors with an indication of operating income before equity-settled share-based compensation, amortization of debt costs, severance
costs and excludes items that are significant but not recurring in the normal course of operations. It provides investors with an indication of comparable operating income / (loss)
between periods and provides an indication of measures used for debt covenant calculations.
� Adjusted general and administrative expenses combined with adjusted corporate expenses provides investors with an indication of total overhead costs before equity-settled share-
based compensation, amortization of debt costs and severance costs.
Investors should be cautioned that operating income / (loss) and adjusted operating income / (loss) should not be construed as an alternative to gross profit / (loss) or profit / (loss) determined in
accordance with IFRS as an indicator of Trican’s performance. Trican’s method of calculating operating income / (loss), adjusted operating income / (loss), adjusted general and administrative ex-
penses and adjusted corporate expenses may differ from that of other companies and accordingly may not be comparable to measures used by other companies. See also “Non-GAAP Disclosure”
section of this report.
MANAGEMENT’S DISCUSSION AND ANALYSISAND CONSOLIDATED FINANCIAL STATEMENTSFor the Years Ended December 31, 2016 and 2015
The following Management’s Discussion and Analysis (“MD&A”) of the financial condition and results of operations of Trican Well Service Ltd. (“Trican” or “the Company”) has been prepared as at and for the year ended December 31, 2016, taking into consideration information available to February 22, 2017, and should be read in conjunction with the audited annual consolidated financial statements and accompanying notes.
OVERVIEWHeadquartered in Calgary, Alberta, Trican has continuing operations in Canada, which provide a comprehensive array of specialized products, equipment and services that are used during the exploration and development of oil and gas reserves provided by a highly-trained workforce
dedicated to safety and operational excellence. The Company also has minority ownership interests in Keane Group Holdings, LLC in the United States. The following MD&A focuses on the financial and operating results for Trican’s continuing operations.
For further details related to Trican’s discontinued operations in Canada (related to the completions tools services), Russia (related to pressure pumping operations and completions tools services), United States (related to pressure pumping operations and completions tools services), Australia, Algeria, Colombia, Kazakhstan, Norway and Saudi Arabia, please refer to the discontinued operations section of the MD&A and the consolidated financial statements and accompanying notes, as at and for the year ended December 31, 2016.

Trican Well Service Ltd.
4 | MD&A Years Ended December 31, 2015 & 2016
FOURTH QUARTER HIGHLIGHTSConsolidated revenue from continuing operations for the fourth quarter of 2016 was $114.8 million, an increase of 47% compared to the 2016 third quarter. Adjusted operating income for the quarter was $1.1 million which is $4.3 million higher than adjusted operating income for Q3 2016. The revenue increase was primarily due to an increase in activity combined with larger job sizes. An increase in the number of frac stages and proppant pumped per job was experienced during the quarter and were the primary drivers of the larger job sizes.
Utilization of our active equipment was below expectations at the start of the quarter due to wet weather and a delayed freeze up, however, it increased rapidly in mid November when freeze up occurred and remained high throughout the second half of the quarter. December activity remained high as more work was performed during the Christmas break and the break was shorter than anticipated. The Company continued to operate approximately 50% of its equipment during the quarter. Our headcount increased as we converted two fracturing crews from twelve hour crews to twenty-four hour crews which expanded our fracturing capacity coming into the 2017 first quarter. Three cementing crews were also added by reactivating parked equipment during the quarter. Hiring qualified personnel to activate parked equipment has become the most significant challenge to meeting current industry demand.
Average pricing for our customers marginally increased between Q3 2016 and Q4 2016. Pricing for most of our anchor customers slightly increased; however, pricing for spot work is estimated to have increased by approximately 10%. 2017 first quarter average pricing is expected to increase approximately 10% relative to Q3 2016 exit levels.
The Company has been focused on adjusting its cost structure to the level of activity and pricing environment experienced during the cyclical lows experienced during
the past two years. There was some additional consolidation of facilities in the quarter which resulted in meaningful severance costs being incurred. Management believes that we have exited the 2016 fourth quarter with an efficient cost structure from a cost perspective and we believe this cost structure can handle the level of work being performed during the 2017 first quarter. Management’s current expectations are that activity will continue to increase after spring break-up and our cost structure will likely increase at that time to handle the demands of increased activity; however, management believes maintaining a disciplined and efficient cost structure as activity increases will be critical to improving profitability during 2017.
The operating loss from continuing operations was $7.4 million and adjusted operating income was $1.1 million for the quarter. A $5.5 million write-down of obsolete spare parts inventory combined with severance costs of $1.6 million, amortization of debt issuance costs of $0.7 million and an additional $0.7 million in equity-settled share-based compensation expense accounts for the difference between the operating loss from continuing operations and adjusted operating income.
In January 2017, Trican sold its shares in National Oilwell Varco (“NOV”) and monetized a portion of its Investments in Keane(1) for net proceeds of approximately USD $20.7 million and USD $28.4 million, respectively. The proceeds were used to further pay down Trican’s outstanding long-term debt. The partial monetization of the Investments in Keane was a result of Keane’s initial public offering on January 20, 2017. Keane’s IPO valuation was significantly higher than its valuation as a private company and, as a result, Trican has increased the value of its Investments in Keane to $231.0 million.
(1) “Investments in Keane” is a defined term that collectively refers to Trican’s direct investments in Keane Group Holdings, LLC which was converted into Trican’s direct investments in Keane Investor Holdings, LLC just prior to the initial public offering (“IPO”) of Keane Group, Inc. Please refer to the “Investments in Keane” section of this MD&A for a detailed description of Trican’s Investments in Keane.

Trican Well Service Ltd.
MD&A Years Ended December 31, 2015 & 2016 | 5
CONTINUING OPERATIONS - COMPARATIVE QUARTERLY INCOME STATEMENTS ($thousands, unaudited) Three months ended
Dec. 31, 2016
% of Revenue
Dec. 31, 2015
% of Revenue
Sept. 30, 2016
% of Revenue
Revenue 114,769 100% 157,752 100% 78,045 100%Expenses Materials and operating 109,546 95% 145,519 92% 76,552 98% General and administrative 4,404 4% 2,411 2% 3,837 5%Operating income / (loss) - Canadian Operations (1) 819 1% 9,822 6% (2,344) (3%)Corporate expenses 8,208 7% (4,840) (3%) 4,425 6%Operating income / (loss) - Continuing Operations (1) (7,389) (6%) 14,662 9% (6,769) (9%) Finance costs 4,655 4% 15,725 10% 4,334 6% Depreciation and amortization 16,281 14% 19,215 12% 16,423 21% Foreign exchange (gain) / loss (331) 0% 7,221 5% 394 1% Asset impairment 3,136 3% 4,996 3% 1,999 3% Finance and other (income) / expense (66,524) (58%) 1,621 1% (2,905) (4%)Income / (loss) before income taxes 35,394 31% (34,116) (22%) (27,014) (35%)Income tax expense / (recovery) (21,539) (19%) (17,613) (11%) (12,268) (16%)Net income / (loss) - Continuing Operations 56,933 (50%) (16,503) (10%) (14,746) (19%)
Adjusted operating income / (loss) - Canadian Operations (1) 7,829 7% 12,312 8% (369) (0%)Adjusted operating income / (loss) - Continuing Operations (1) 1,111 1% 19,418 12% (3,212) (4%)Gross profit / (loss) (1) (10,064) (9%) (7,201) (5%) (13,650) (17%)Job count 2,780 2,887 2,515Revenue per job 40,745 54,390 30,634
(1) See the first page of this report for a description of operating income / (loss) and adjusted operating income / (loss). Gross profit / (loss) has been presented in this table as it is the most directly comparable measure calculated in accordance with IFRS to operating income / (loss).
Sales Mix
(unaudited)Three months ended, Dec. 31, 2016 Dec. 31, 2015 Sept. 30, 2016% of Total RevenueFracturing 57% 64% 56%
Cementing 26% 18% 28%
Industrial Services 5% 3% 5%
Coiled Tubing 3% 2% 3%
Acidizing 4% 2% 4%
Nitrogen 3% 9% 2%
Other 2% 2% 2%
Total 100% 100% 100%

Trican Well Service Ltd.
6 | MD&A Years Ended December 31, 2015 & 2016
Q4 2016 versus Q4 2015
Revenue for the fourth quarter of 2016 decreased by 27% compared to the fourth quarter of 2015. Demand for most of our services was comparable to 2015 fourth quarter demand. However, pricing for all of our services and demand for nitrogen services was substantially lower relative to the 2015 fourth quarter. The job count and revenue per job decreased 4% and 25%, respectively, as compared to last year. The decrease in revenue per job was largely a result of lower pricing for our services combined with a shift in sales mix
towards the cementing service line which typically generates a lower revenue per job relative to the fracturing service line.
Materials and operating expenses increased to 95% of revenue compared to 92% for the same period in 2015 and includes the impact of a $5.5 million write-down of obsolete spare parts inventory recorded in 2016. Materials and operating expenses as a percentage of revenue is consistent with Q4 2015 levels after excluding the write-down. The reductions realized to our fixed and variable cost structure during 2016 have largely offset the significant pricing declines experienced since the 2015 fourth quarter.
General & Admin. Corporate Expense
($ thousands; unaudited)Three months ended,
Dec. 31, 2016
Dec. 31, 2015
Dec. 31, 2016
Dec. 31, 2015
Total Expenses 4,404 2,411 8,208 (4,840)
Adjusted for:
2015 Amended Credit Agreement transaction costs (2) - - - (7,995)
Transaction costs re-classed to Discounted Operations (5,396)
Equity-settled shared-based compensation 293 231 383 434
Amortization of debt issuance costs - - 653 990
Severance 25 182 454 843
Adjusted Expenses (1) 4,086 1,998 6,718 6,284
Cash-settled share-based compensation 1,084 (192) 3,562 156
(1) See first page of this report.
(2) debt issuance costs incurred during 2015 relating to the 2015 Amended Credit Agreements were accounted for as a deduction of long-term debt on the balance sheet at December 31, 2015.
However, these costs were expensed throughout the year but reclassified entirely during the 2015 fourth quarter when the agreements were finalized.
(3) transaction costs incurred during 2015 relating to the sale of Trican’s Russian Operations were accounted for as part of the calculation of the gain on disposal of the Russian Operations as at
December 31, 2015. As a result, costs that had been expensed in prior quarters were reclassified as the sale occurred during the 2015 fourth quarter.
Overhead Expenses
Adjusted general and administrative costs for the 2016 fourth quarter increased $2.1 million compared to the same period last year. This increase is mainly a result of a $1.3 million increase in cash-settled share-based compensation as a result of the share price increase and a $0.4 million bad debt recovery recorded during the 2015 fourth quarter. Cash-settled share-based compensation includes restricted share units expenses, deferred share units expenses and performance share unit expenses which are correlated to the number of vested units and the change in Trican’s share price during the quarter.
During the 2016 fourth quarter, adjusted corporate expenses totaled $6.7 million which compares to the adjusted corporate expenses of $6.3 million for the same period last year. This increase is a result of a $3.7 million increase in cash-settled share-based compensation offset by significant reductions in salaries and professional fees. Adjusted operating income in Q4 2016 was 1% of revenue compared to adjusted operating income of 12% in Q4 2015.

Trican Well Service Ltd.
MD&A Years Ended December 31, 2015 & 2016 | 7
Q4 2016 versus Q3 2016
Fourth quarter revenue increased by 47% compared to the third quarter of 2016 and is consistent with the 47% increase in rig count experienced during the quarter. Activity levels and utilization of active equipment were below expectations at the start of the quarter due to wet weather and a delayed freeze up, however, it increased rapidly in mid November when freeze up occurred and remained highly utilized in the second half of the quarter as customers worked to catch up on their programs. December activity remained high as more work was performed during the Christmas break and the break was shorter than anticipated. Total job count increased 11% sequentially.
Revenue per job has increased 33% largely as a result of larger fracturing and cement jobs. Pricing during the quarter marginally increased with pricing increases for most large customers taking effect at the start of January.
Fracturing and cementing average job sizes have increased relative to the 2016 third quarter. Increases in number of stages and proppant volume per frac job are indicative of the industry trend toward more stages per well and larger sand volumes pumped per stage. These factors largely account for the increase in fracturing job size. An increase in cement tonnage pumped per cement job during the quarter accounts for the increase in the cementing job size.
As a percentage of revenue, fourth quarter materials and operating expenses were 95% compared to 98% during the third quarter of 2016 and includes the impact of a $5.5 million write-down of obsolete spare parts inventory. Materials and operating expenses as a percentage of revenue reduced to 91% from 95% excluding the write-down. This improvement was primarily due to increased equipment utilization combined with some marginal improvements to pricing. Variable and fixed costs generally remained consistent with Q3 2016 levels.
General & Admin. Corporate Expense
($ thousands; unaudited)Three months ended,
Dec. 31, 2016
Sept. 30, 2015
Dec. 31, 2016
Sept. 30, 2015
Total Expenses 4,404 3,837 8,208 4,425
Adjusted for:
Equity-settled shared-based compensation 293 285 383 385
Amortization of debt issuance costs - - 653 656
Severance 25 60 454 542
Adjusted Expenses (1) 4,086 3,492 6,718 2,842
Cash-settled share-based compensation 1,084 324 3,562 295
(1) See first page of this report.
Overhead Expenses
Adjusted general and administrative expenses increased $0.6 million sequentially from the 2016 third quarter primarily as a result of the increase in cash-settled share-based compensation expense which is highly correlated to the movement in Trican’s share price.
Adjusted corporate expenses incurred during the fourth quarter increased sequentially by $3.9 million largely due to the increase in cash-settled share-based compensation combined with insignificant increases in a handful of other corporate expenses. Removing cash-settled share-based compensation, adjusted operating income for the quarter would have been $5.8 million or 5.0% of revenue.
Operating loss as a percentage of revenue was 6% during the fourth quarter compared to an operating loss as a percentage of revenue of 9% in the third quarter of 2016. Adjusted operating income in Q4 2016 was 1% of revenue compared to an adjusted operating loss of 4% in Q3 2016. The $8.5 million difference between the Q4 2016 adjusted operating income and the Q4 2016 operating loss is largely a result of a $5.5 million write down of obsolete spare parts inventory combined with $1.6 million of severance costs, $0.7 million of amortized debt issuance costs and $0.7 million of equity-settled share-based compensation expense.

Trican Well Service Ltd.
8 | MD&A Years Ended December 31, 2015 & 2016
Discontinued Operations
Discontinued operations include the results of pressure pumping operations in the United States, Russia, Algeria, Australia, Colombia, Kazakhstan, and Saudi Arabia, which were suspended or sold throughout 2015 and 2016. Additionally, discontinued operations include the completions tools business which was sold in July 2016. The completions tools business had operations in Canada, the United States, Norway and Russia. The decisions to discontinue pressure pumping operations in the United States, Russia and other international regions, along with the completions tools business are not anticipated to have a significant effect on the continuing operations of the Company.
Discontinued operations for the fourth quarter of 2016 include revenues of nil compared to $3.9 million for the third quarter of 2016. The net loss from discontinued operations was $4.2 million in the fourth quarter of 2016, compared to net loss of $23.2 million for the three months ended September 30, 2016.
For the year ended December 31, 2016, management continued its efforts to wind up foreign operations resulting in assets being classified as held for sale. At December 31, 2016, the net carrying value of the assets and liabilities located in these regions was $5.5 million and $0.3 million respectively. The Company also had asset held for sale with a net carrying value of $3.2 million in continuing operations.
Results from discontinued operations have not been included in the tables above. For information related to Trican’s discontinued operations, please see the annual consolidated financial statements as at and for the year ended December 31, 2016.
OTHER EXPENSES AND INCOMEFinance costs for the fourth quarter of 2016 increased by 7% compared to the third quarter of 2016. This increase is mainly due to higher interest expense as a result of a higher average debt balance. This higher debt balance is due to increased working capital that results from higher level of activities.
Depreciation and amortization expense for continuing operations decreased during the fourth quarter of 2016 by 1% due to a lower average gross book value of property and equipment being depreciated.
A foreign exchange gain of $0.3 million has been recorded in the fourth quarter of 2016, compared to a loss of $0.4 million for the prior quarter. This gain is due to an unrealized gain on USD denominated marketable securities and Trican’s Profit Interest in Keane as the U.S. dollar strengthened relative to the Canadian dollar. This gain was partially offset by an unrealized loss on the unhedged portion of the USD denominated debt. The translation of the assets and liabilities of international entities that are dependent on the Canadian Operations are reported in discontinued operations.
An impairment loss of $3.1 million on the carrying amount of property and equipment was recorded in the fourth quarter as a result of classifying and measuring certain Canadian properties as assets held for sale at the lower of cost and fair value less cost of disposal.
Finance and other income of $66.5 million for the fourth quarter of 2016 includes an unrealized gain of $65.2 million on Trican’s Profit Interest in Keane and includes approximately $2.3 million relating to interest income and gains on disposal of assets.
INCOME TAXESThe Company recorded an income tax recovery, related predominantly to Canadian operations, of $21.5 million during the fourth quarter of 2016 compared to $12.3 million for third quarter of 2016. The difference in the income tax recoveries is largely due to the difference between the taxable losses incurred in the two periods by our Canadian operations. $4.3 million of the Q4 2016 expense related to losses from Canadian operations and the remaining $25.8 million of the recovery related to recognition of previously unrecognized operating losses of the U.S. entities that offset the taxable gain on the appreciation of the value of the Equity Interest in Keane.

Trican Well Service Ltd.
MD&A Years Ended December 31, 2015 & 2016 | 9
OTHER COMPREHENSIVE INCOME Other comprehensive income includes the effects of foreign currency translation (“FCTA”), the reclassification of FCTA to the income statement for entities that have been sold or substantially disposed of and the unrealized gains and losses on Trican’s Equity Interest in Keane.
The Company had total other comprehensive gain of $84.5 million during the fourth quarter of 2016, compared to a loss of $294.6 million in the fourth quarter of 2015. FCTA differences resulted in $1.1 million net movement during
the fourth quarter of 2016, compared to a gain of $16.4 million during the same period in 2015. The unrealized gain on Trican’s Equity Interest in Keane was $31.6 million in the fourth quarter of 2016 which is calculated net of a tax expense of $40.5 million. The Company obtained 10% of the Class A shares (“Equity Interest in Keane”) in Keane Group Holdings, LLC (“Keane”) on the close of the sale of its U.S. pressure pumping business. These securities were initially recognized at fair value. Subsequent changes in the fair value are recognized through other comprehensive income (OCI).
COMPARATIVE YEAR-TO-DATE INCOME STATEMENTS ($thousands, unaudited) Twelve months ended
Dec. 31, 2016
% of Revenue
Dec. 31, 2015
% of Revenue
Year- Over-
Year Change
% Change
Revenue 325,179 100% 649,735 100% (324,556) (50%)
Expenses Materials and operating 341,275 105% 592,276 91% (251,001) (42%)
General and administrative 14,909 5% 12,168 2% 2,741 23%
Operating income / (loss) - Canadian Operations (1) (31,005) (10%) 45,291 7% (76,296) (168%)
Corporate expenses 38,755 12% 29,270 5% 9,485 32%
Operating income / (loss) - Continuing Operations (1) (69,760) (21%) 16,021 2% (85,781) (535%)
Finance costs 26,016 8% 43,000 7% (16,984) (39%)
Depreciation and amortization 70,440 22% 74,725 12% (4,285) (6%)
Foreign exchange (gain) / loss 3,058 1% (20,652) (3%) 23,710 (115%)
Asset impairment 5,135 2% 4,996 1% 139 3%
Finance and other income (70,455) (22%) (2,127) (0%) (68,328) 3,212%
Loss before income taxes (103,954) (32%) (83,921) (13%) (20,033) 24%
Income tax expense / (recovery) (63,225) (19%) (21,140) 3% (42,085) 199%
Net loss - Continuing Operations (40,729) (13%) (62,781) (10%) 22,052 (35%)
Adjusted operating income / (loss) - Canadian Operations (1) (10,858) (3%) 56,085 9% (66,943) (119%)
Adjusted operating income / (loss) - Continuing Operations (1) (37,369) (11%) 34,893 5% (72,265) (207%)
Gross loss (1) (83,533) (26%) (26,744) (4%) (56,789) 212%
Job count 9,071 11,977 (2,906) (24%)
Revenue per job 35,448 54,090 (18,642) (34%)
(1) See first page of this report.
Trican Well Service Ltd.
10 | MD&A Years Ended December 31, 2015 & 2016
Canadian revenue for year ended December 31, 2016, was 50% lower than the year ended December 31, 2015. Low commodity prices over the first half of 2016 led to substantial declines in activity for the majority of our Canadian service lines throughout the year with the largest impact on our fracturing business. The average rig count in Canada has decreased approximately 50% over 2016 compared to 2015. The job count decreased 24% on a year-over-year basis and reflects weak activity during the first half of the year and increasing activity during the second half of the year. Revenue per job decreased 34% on a year-over-year basis and has largely decreased due to a significant reduction in pricing combined with a shift in sales mix towards the cementing service line partially offset by larger
fracturing jobs which is consistent with industry trends experienced during the year.
As a percentage of revenue, materials and operating expenses increased to 105% from 91% for the year ended December 31, 2016 compared to the year ended December 31, 2015. In addition, the gross loss as a percentage of revenue was 26% compared to gross loss as a percentage of revenue of 4% in 2015. The majority of these weak financial results occurred during the first half of the year as low commodity prices resulted in anemic activity levels and significantly reduced pricing for our services. Meaningful reductions in our fixed and variable cost structure partially offset the decline in revenue due to lower activity levels and weak pricing.
General & Admin. Corporate Expense
($ thousands; unaudited)Twelve months ended,
Dec. 31, 2016
Dec. 31, 2015
Dec. 31, 2016
Dec. 31, 2015
Total Expenses 14,909 12,168 38,755 29,270
Adjusted for:
Equity-settled shared-based compensation 1,110 1,475 1,699 2,761
Amortization of debt issuance costs - - 3,776 1,644
Severance 642 349 6,647 2,972
Professional fees - - 122 700
Adjusted Expenses (1) 13,157 10,344 26,511 21,193
Cash-settled share-based compensation 2,368 (1,725) 8,018 (3,381)
(1) See first page of this report.
Overhead Expenses
Adjusted general and administrative expenses increased $2.8 million year over year primarily as a result of the increase in cash-settled share-based compensation expense based on improved share performance. This increase was partially offset by a $0.5 million and $0.6 million decrease in personnel and office costs, respectively.
Adjusted corporate expenses for the twelve months ended December 31, 2016, increased by $5.3 million when compared to the same period last year mainly resulting from an $11.4 million increase in cash-settled share-based compensation partially offset by significant reductions in personnel costs, IT expenses and office costs.
OTHER EXPENSES AND INCOMEFor the twelve months ended December 31, 2016, finance costs decreased by 39% compared to the same period in 2015 due to decreased average debt balances partially offset by an increase in interest rates on the revolving facility and the outstanding notes payable.
Depreciation expense decreased by 6% due to a net decrease in average gross book value of assets by 3% for continuing operations due to disposals of equipment in Canada and due to a lower number of major component disposals recorded in accelerated depreciation.

Trican Well Service Ltd.
MD&A Years Ended December 31, 2015 & 2016 | 11
Foreign exchange losses of $3.1 million have been recorded for the twelve months ended December 31, 2016, compared to gains of $20.7 million for the same period in 2015. Foreign exchange gains recorded during 2015 related to unrealized gains on USD denominated net current asset balances due to a stronger USD relative to the Canadian dollar. The foreign exchange losses recorded in 2016 are due to a stronger Canadian dollar relative to the U.S. dollar on net USD denominated financial assets, when compared to exchange rates in 2015.
An impairment loss of $5.1 million on the carrying amount of property and equipment was recorded in 2016 as a result of measuring the Canadian division’s microseismic assets and other properties as held for sale at the lower of cost and fair value less cost of disposal.
Finance and other income in 2016 was a gain of $70.5 million compared to a gain of $2.1 million for the same period of 2015. The gain recorded in 2016 comprises of an unrealized gain of $65.2 million on Trican’s Profit Interest in Keane. Finance and other income is largely comprised of gains or losses recorded on the Profit Interest in Keane, gains or losses on asset sales and interest income on cash balances.
INCOME TAXESTrican recorded an income tax recovery of $63.2 million for the twelve months ended December 31, 2016, versus a recovery of $21.1 million for the same period in 2015. The difference in the income tax recoveries is largely due to the difference between the taxable losses incurred in the two periods by our Canadian operations. $31.8 million dollars of the recovery related to losses from Canadian operations and the remaining $31.4 million of the recovery related to recognition of previously unrecognized operating losses of the US entities that offset the taxable gain on the appreciation of the value of the Equity Interest in Keane.
OTHER COMPREHENSIVE INCOME Other comprehensive income includes the effects of FCTA, the reclassification of FCTA to the income statement for entities that have been sold or substantially disposed of and the unrealized gains and losses on Trican’s Equity Interest in Keane.
FCTA differences resulted in a gain of $1.0 million during 2016, compared to a gain of $43.1 million during the same period in 2015. In 2016, reclassification of FCTA to the income statement was $67.5 million due to the sale of the U.S. operations, the Completions operations, the Kazakh operations and the disposal of remaining operational assets in Colombia. The unrealized gain on Trican’s Equity Interest in Keane was $41.2 million for the year ended December 31 2016, which is calculated net of the tax expense of $46.1 million. The Company obtained an Equity Interest in Keane on the close of the sale of its U.S. pressure pumping business. These securities were initially recognized at fair value. Subsequent changes in the fair value are recognized through other comprehensive income.
LIQUIDITY, CAPITAL RESOURCES AND FUTURE OPERATIONSOperating Activities
Cash flow used in operating activities for continuing operations was $15.1 million during Q4 2016, compared to cash flow used by continuing operations of $8.6 million during Q4 2015. The net decrease in cash flow provided by continuing operations was largely due to the higher operating income from continuing operations during Q4 2015 as activity and operating conditions were better during the last quarter of 2015 than the comparable period in 2016.
For the twelve months ended December 31, 2016, cash flow used in total operations was $93.9 million versus cash flow used in total operations of $119.8 million for the year ended December 31, 2015. The year-over-year decrease in cash flow from continuing operations between 2015 and 2016 is the result of activity levels and operating conditions that worsened year-over-year leading to larger losses in 2016.
At December 31, 2016, Trican had working capital of $114.1 million compared to $203.1 million at the end of 2015. The decrease is largely due to the sale of the U.S. pressure pumping and the Completions operations in combination with lower levels of activity in Canada, which has led to a significant decrease in trade accounts receivable and inventory, offset partially by a decrease in trade payables. The change in working capital between the current quarter and the prior quarter was small as continuing operations have been more consistent on a quarter over quarter basis.
Trican Well Service Ltd.
12 | MD&A Years Ended December 31, 2015 & 2016
Trican anticipates that cash flow from operating activities and available credit facilities will provide the required resources to fund ongoing operating, investing and financing activities for the foreseeable future including the discharge of its existing liabilities and commitments and compliance with future financial covenants as specified in the amended terms of the applicable credit agreements (“Second 2016 Amended Credit Agreements”) with its bank lenders under its revolving credit facility (“RCF”) and the holders of its senior notes (“Senior Notes”).
For the fiscal years ended December 31, 2016 and December 31, 2015, the Company incurred net losses of $29.3 million and $829.9 million, respectively. Although current economic climate has improved in the last six months, a negative change in the economy could lead to adverse changes in cash flow, working capital levels or long-term debt balances, which may also have a direct impact on our results and financial position.
Based on currently available information, we expect to comply with all covenants during 2017, however our estimated leverage and interest coverage ratios in the Second 2016 Amended Credit Agreements during the first half of 2017 are expected to be near the minimum amounts necessary to comply with the financial covenants. If the Company does not comply with the financial covenants, the RCF and Senior Notes may become due on demand. If future profitability or available liquidity is not sufficient to meet Trican’s operating and debt servicing obligations as they come due, management’s plans include reducing expenditures and pursuing additional asset dispositions or alternative financing arrangements.
Subsequent to year end, Trican sold its NOV shares and monetized a portion of its Investments in Keane for net proceeds of approximately USD $20.7 million and USD $28.4 million, respectively, and used the proceeds to pay down debt.
Investing ActivitiesOn March 16, 2016, Trican closed the sale of its United States pressure pumping business to Keane Group Holdings, LLC, a privately-held U.S.-based well completion services company. The transaction involved the sale of all pressure
pumping and select related assets, and the assumption of certain liabilities, of Trican Well Service, L.P., Trican's wholly-owned subsidiary, for cash proceeds of USD$200 million, or approximately $265 million, with working capital adjustments providing Trican with an additional $4.9 million in proceeds. Trican applied the net cash proceeds from this transaction to reduce its outstanding debt. As part of this transaction, Trican has also received 10% of the Class A shares of Keane (the Equity Interest in Keane) as well as certain economic interests in Keane that represent up to an additional 20% economic participation above certain thresholds upon a Keane liquidity event (the Profits Interest in Keane).
In January 2017, Trican monetized a portion of its Investments in Keane for net proceeds of approximately USD $28.4 million and used the proceeds to further pay down debt.
On July 13, 2016, Trican closed its agreement with certain subsidiaries of NOV for the sale of its completion tools business with operations in Russia, Norway, the United States and Canada for aggregate gross proceeds of $53.5 million. The cash consideration received on closing by Trican consisted of $30 million adjusted for working capital estimates of $1.3 million with the final working capital adjustment of $7.2 million finalized during the first quarter of 2017. The share consideration received on closing consisted of 558,221 NOV shares. As at December 31, 2016, the fair value of the shares was $28.1 million. In January 2017, Trican sold its NOV shares for net proceeds of approximately USD $20.7 million and has used the proceeds to further pay down debt.
Capital expenditures related to continuing operations for the year ended December 31, 2016 totaled $1.4 million, compared with $17.1 million for the year ended December 31, 2015. Proceeds from the sale of Property and Equipment totalled $8.4 million during the year ended December 31, 2016, compared with proceeds of $8.9 million for the year ended December 31, 2015. With the decline in commodity prices and North American demand for pressure pumping services, capital expenditures will be kept to a minimum until operating conditions improve. A substantial amount of equipment has been parked in Canada, which will reduce the amount of maintenance capital needed throughout

Trican Well Service Ltd.
MD&A Years Ended December 31, 2015 & 2016 | 13
the current downturn. We expect to continue to minimize capital spending during 2017 with this spending expected to be funded primarily through cash flow from operations and our Revolving Credit Facility. Trican regularly reviews its capital equipment requirements and will continue to follow its policy of adjusting the capital budget on a quarterly basis to reflect changing operating conditions and capital equipment needs.
Financing Activities
2016 Amended Credit Agreements
On March 16, 2016 Trican closed the sale of the U.S. pressure pumping business to Keane. Concurrently the amended terms of the 2016 credit agreements (the “2016 Amended Credit Agreements”) between Trican, its lenders and Senior Noteholders came into effect including:
� an elimination of the minimum EBITDA and liquidity covenants;
� a Cure Amount provision for which 50% of the equity proceeds may be applied in the calculation of adjusted EBITDA for the Leverage and Interest coverage covenant calculations, provided a Cure Amount is not used more than twice in any four quarter period and the aggregate amount of any Cure Amount applied to the quarterly covenant calculations does not exceed $20 million; and;
� Adjusted EBITDA was defined as income before interest, taxes, depreciation and other permitted or non-cash items under the 2016 Amended Credit Agreements.
Second 2016 Amended Credit Agreements
On June 21, 2016, Trican closed a public offering of an aggregate of 43,125,000 common shares at a price of $1.60 per common share for aggregate gross proceeds of $69 million including overallotments (the “Equity Offering”). Concurrently, “Second 2016 Amended Credit Agreements” with its bank lenders under its revolving credit facility (“RCF”) and the holders of its senior notes came into effect which did not change key terms of the 2016 Amended Credit Agreements other than as described below.
Key terms include:
� a reduction in the availability of the RCF from $303 million to $250 million;
� a temporary cap of $175 million on the RCF until Trican has achieved EBITDA (excluding the application of any Cure Amount as defined in the RCF agreement) of at least $25 million in any quarter ended on or after September 30, 2016. The temporary cap remains in place at December 31, 2016;
� a removal of all prior financial covenants until the first quarter of 2017; and,
� new leverage and interest covenant calculations as described below – the covenant thresholds remain unchanged.

Trican Well Service Ltd.
14 | MD&A Years Ended December 31, 2015 & 2016
Senior Notes
Trican had the following notes outstanding:
During 2016, Trican used a portion of the proceeds from the sale of the U.S pressure pumping business, the sale of the completion tools business, and the equity offering to retire in advance Senior Note amounts of USD $130.6 million and $34.3 million. During the second quarter of 2016, Trican fully retired its Senior Notes Series C ($17.3 million) and Series E (USD $25.1 million) on maturity.
Revolving Credit Facility
As at December 31, 2016, Trican has a $250 million (2015 - $410 million) extendible revolving credit facility (“RCF”) with a syndicate of banks that is committed until October 31, 2018. Availability under the RCF is currently capped at $175 million as mentioned above. The RCF is secured and
Canadian $ Amount U.S. $ Denominated Amount(stated in thousands) Maturity Dec. 31, 2016 Dec. 31, 2015 Dec. 31, 2016 Dec. 31, 2015Senior Notes
7.05% (1) Series A November 19, 2017 $8,859 $23,067 $6,598 $16,667
7.05% (1) Series A November 19, 2019 - 5,297 - 3,828
8.22% (1) Series C April 28, 2016 - 33,445 - -
9.11% (1) Series D April 28, 2021 3,368 11,148 - -
7.61% (1)Series E April 28, 2016 - 66,860 - 48,309
8.29% (1)Series F April 28, 2018 25,713 82,289 19,150 59,457
8.90% (1) Series G April 28, 2021 33,448 108,005 24,911 78,038
8.75% (1) Series H September 03, 2024 4,456 14,864 - -
Subordinated Make-Whole Senior Notes
5.96% Series A November 19, 2017 686 703 511 508
5.54% Series D April 28, 2021 458 457 - -
5.55% Series F April 28, 2018 1,224 1,268 912 916
6.28% Series G April 28, 2021 3,317 3,395 2,470 2,453
6.05% Series H September 03, 2024 760 755 - -
PIK Principal 2,075 - - -
Debt issue costs (2) (3,110) (4,977) - -
Senior Notes, net of debt issue costs $81,254 $346,576 $54,552 $210,176
(1) (The interest rate on Senior Notes includes an additional 125 basis point increase payable in cash and a 175 basis point increase of interest payable in kind pursuant to the 2016 and 2015 Amended Credit Agreements.
(2) Includes transaction costs on the 2016 and 2015 Amended Credit Agreements and Original Credit Agreements.
bears interest at the applicable Canadian prime rate, U.S. prime rate, Banker’s Acceptance rate, or at LIBOR, plus 350 to 625 basis points (2015 – Canadian prime rate, U.S. prime rate, Banker’s Acceptance rate, or at LIBOR, plus 350 to 625 basis points), dependent on certain financial ratios of the Company. The undrawn amount of the RCF is $110.0 million of which only $35 million is accessible as at December 31, 2016 (2015 - $214.8 million).
As at December 31, 2016, Trican has a $10 million (2015 - $10 million) Letter of Credit facility with its syndicate of banks. As at December 31, 2016, Trican had $5.1 million in letters of credit outstanding (2015 - $5.2 million).

Trican Well Service Ltd.
MD&A Years Ended December 31, 2015 & 2016 | 15
Covenants
The Company is required to comply with certain covenants under the terms of the Second 2016 Amended Credit Agreements. These covenants are applicable to the RCF and to the Senior Notes:
� no financial covenants are applicable until the first quarter of 2017;
� Trican is required to comply with the following leverage and interest coverage ratio covenants:
For the Quarter Ended Leverage Ratio Interest Coverage Ratio Calculation Basis
December 31, 2016 Not applicable Not applicable Not applicable
March 31, 2017 <5.0x >2.0x Q1 annualized
June 30, 2017 <5.0x >2.0x (Q1 X 3 + Q2)
September 30, 2017 <5.0x >2.0x ((Q1 + Q3) x 3/2) + Q2
December 31, 2017 <4.0x >2.5x Last twelve months
Thereafter <3.0x >3.0x Last twelve months
The leverage ratio is defined as long-term debt excluding Subordinated Make Whole Notes (net of the mark to market value of the cross-currency swaps) minus cash divided by adjusted EBITDA. The interest coverage ratio is defined as adjusted EBITDA divided by interest expense minus payable in-kind interest. Certain expenses such as severance and equity-settled share-based compensation expenses are permitted to be added back to EBITDA to arrive at adjusted EBITDA for covenant calculation purposes. As noted above, no financial covenants are applicable to the Company for the fourth quarter of 2016. However, for illustrative purposes, adjusted EBITDA for covenant calculation purposes for the fourth quarter of 2016 would have been a gain of $2.8 million. This amount is calculated by taking adjusted consolidated operating income of $1.1 million and adding finance and other income of $1.7 million. These amounts do
not include the $20 million equity cure that may be applied to this calculation.
Share Capital
As at February 21, 2017, Trican had 193,617,699 common shares and 8,674,996 employee stock options outstanding.
Other Commitments and Contingencies
Management is satisfied that the Company has sufficient liquidity and capital resources to meet the Company’s future obligations and commitments. The Company has commitments for operating lease agreements, primarily for office space, with minimum payments due as of December 31, 2016, and capital commitments, primarily related to major equipment as follows.

Trican Well Service Ltd.
16 | MD&A Years Ended December 31, 2015 & 2016
Sand Purchase Agreement with Huron Mineral LLC
On November 2, 2016, Trican Well Service L.P. reached an agreement with Huron Minerals LLC to settle its dispute related to a sand purchase agreement. The Company recorded a provision of $8.3 million during 2016 as the parties agreed to settle this claim for USD $6.35 million. The Company will pay USD $4.0 million on January 5, 2017 and USD $2.35 million on April 3, 2017.
Indemnity Claim in connection with the sale of Trican’s US operations to Keane Group (“Keane”) on March 16, 2016
During Q2 2016, Keane delivered an Indemnity Claim stating that Trican owes Keane $3.9 million (USD $3.0 million) due to losses incurred by Keane for assets purchased that were not in good operating condition. Management has not recorded any accrual for this contingent liability associated with this claim based on our belief that a liability is not more likely than not and any range of potential future charge cannot be reasonably estimated at this time.
Other Litigation
On August 25, 2015, a class action lawsuit was filed on behalf of 31 plaintiffs against Trican Well Service, L.P. The claim alleges that Trican misclassified the plaintiffs’ position as “exempt” from overtime wages from February 2011 to August 2015, resulting in a loss of overtime wages during this period. Given the information available at these early stages of litigation, management has not recorded any accrual for this contingent liability associated with this claim based on our belief that a liability is not probable and any range of potential future charge cannot be reasonably estimated at this time.
The tax regulations and legislation in the various jurisdictions that the Company operates in are continually changing. As a result, there are usually some tax matters under review. Management believes that it has adequately met and provided for taxes based on the Company’s interpretation of the relevant tax legislation and regulations.
Payments Due by Period
December 31, 2016 1 year or less 1 to 5 years 5 years & thereafter Total
Trade and other payables $87,239 $- $- $87,239Senior Notes (including interest) 14,697 80,493 5,961 101,151RCF (including interest) 10,348 154,020 - 164,368Finance leases 717 264 - 981Operating leases 4,641 9,838 8,324 22,803Total commitments $107,294 $244,615 $14,285 $376,542
December 31, 2015
Trade and other payables $141,212 $- $- $141,212
Senior Notes (including interest) 106,202 269,382 20,103 395,687
RCF (including interest) 29,798 215,873 - 245,671
Finance leases 7,296 13,759 - 21,055
Operating leases 14,159 19,639 5,783 39,581
Inventory purchases 3,019 36,998 - 40,018
Capital commitments 5,559 - - 5,559
Total commitments $307,245 $555,651 $25,886 $888,782
Management is satisfied that the Company has sufficient liquidity and capital resources to meet the Company’s obligations and commitments.
Contractual Obligations

Trican Well Service Ltd.
MD&A Years Ended December 31, 2015 & 2016 | 17
Immaterial Corrections
Subsequent to the issuance of the consolidated financial statements for the year ended December 31, 2015, the Company determined that two immaterial errors occurred in those previously issued financial statements:
� In the fourth quarter of 2015, hedged transactions in a cash flow hedging relationship (being foreign exchange gains and losses on the Company’s Series E and Series F Senior Notes) were no longer probable of occurring based on expectations of disposals being pursued by the Company. As a result, the hedging relationship no longer qualified for hedge accounting and, accordingly, in the fourth quarter of 2015, the cumulative loss of $3.9 million previously recognized in other comprehensive income should have been reclassified to reduce foreign exchange gain and increase loss from continuing operations by the same amount; and
� In the third quarter of 2015, the Company determined that cumulative foreign exchange loss of $1.4 million previously recognized in other comprehensive income should have been reclassified to loss from discontinued operations as a result of the sale of its Russian operation.
The Company concluded that these adjustments are not material to the Company’s consolidated financial statements for the year ended December 31, 2015 and has reflected them as immaterial corrections of the comparative financial information in these annual consolidated financial statements.
Deficit at December 31, 2015 has been increased by $5.3 million.
In addition, the Company has presented the carrying amount of the cross currency swaps of $37.2 million at December 31,
2015 as currency derivatives rather than as an adjustment to the related Senior Notes. Changes in fair value of the cross currency swaps commencing the fourth quarter of 2015 have been recognized in profit and loss.
INVESTMENTS IN KEANEOn March 16, 2016, Trican sold its U.S. pressure pumping operations to Keane Group Holdings, LLC (“Keane Private Company”) for USD $200 million in cash, 10% and 100% of class A and C shares, respectively, in the Keane Private Company. At the time of the sale, Keane Private Company and its subsidiaries performed pressure pumping services for oil and gas companies in the onshore U.S. market.
On January 20, 2017, Keane Group, Inc. (“FRAC”) completed its initial public offering (“IPO”) and its shares became publicly traded on the New York Stock Exchange under the ticker symbol “FRAC”. As a result of the IPO, Trican’s ownership interests in the Keane Private Company have been transferred to Keane Investor Holdings, LLC (“Keane Holding Company”). Effectively, our Class A common shares and Class C profits interest in Keane Private Company are now Class A common shares and Class C profits interests in the Keane Holding Company. At the time of IPO, the Keane Holding Company’s only asset was 87.4 million shares of FRAC and it had no liabilities. Trican’s Investments in Keane have been reorganized as a result of the IPO, but the waterfall calculation used to calculate the cash received by Trican on future liquidity events has not changed.
Future liquidity events will effectively be the future sale of the remaining shares of FRAC currently held by the Keane Holding Company. The proceeds from the future sales will be distributed to the owners of Keane Holding Company. Trican’s portion of the future liquidity events will be calculated based on the following waterfall table:
Liquidity Event Cumulative Proceeds Thresholds (USD $MM)For the Year Ending March 15
Tranche Trican Ownership Interest 2017 2018 2019 2020 2021
First 10% up to $468 $468 $468 $468 $468
Second 9.2% between $468 - 608 $468 - 791 $468 - 1,028 $468 - 1,336 $468 - 1,737
Third 18.3% between $608 - 632 $791 - 853 $1,028 - 1,151 $1,336 - 1,554 $1,737 - 2,098
Fourth 27.4% greater than $632 $853 $1,151 $1,554 $2,098
Trican Well Service Ltd.
18 | MD&A Years Ended December 31, 2015 & 2016
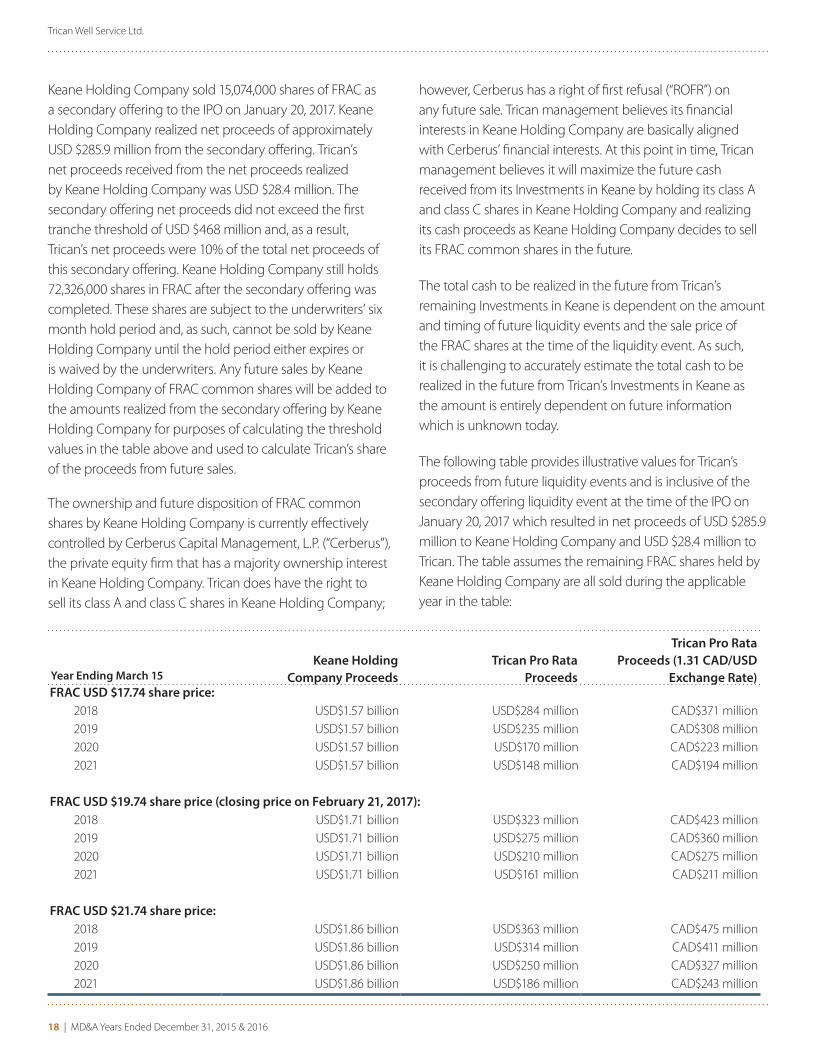
Keane Holding Company sold 15,074,000 shares of FRAC as a secondary offering to the IPO on January 20, 2017. Keane Holding Company realized net proceeds of approximately USD $285.9 million from the secondary offering. Trican’s net proceeds received from the net proceeds realized by Keane Holding Company was USD $28.4 million. The secondary offering net proceeds did not exceed the first tranche threshold of USD $468 million and, as a result, Trican’s net proceeds were 10% of the total net proceeds of this secondary offering. Keane Holding Company still holds 72,326,000 shares in FRAC after the secondary offering was completed. These shares are subject to the underwriters’ six month hold period and, as such, cannot be sold by Keane Holding Company until the hold period either expires or is waived by the underwriters. Any future sales by Keane Holding Company of FRAC common shares will be added to the amounts realized from the secondary offering by Keane Holding Company for purposes of calculating the threshold values in the table above and used to calculate Trican’s share of the proceeds from future sales.
The ownership and future disposition of FRAC common shares by Keane Holding Company is currently effectively controlled by Cerberus Capital Management, L.P. (“Cerberus”), the private equity firm that has a majority ownership interest in Keane Holding Company. Trican does have the right to sell its class A and class C shares in Keane Holding Company;
however, Cerberus has a right of first refusal (“ROFR”) on any future sale. Trican management believes its financial interests in Keane Holding Company are basically aligned with Cerberus’ financial interests. At this point in time, Trican management believes it will maximize the future cash received from its Investments in Keane by holding its class A and class C shares in Keane Holding Company and realizing its cash proceeds as Keane Holding Company decides to sell its FRAC common shares in the future.
The total cash to be realized in the future from Trican’s remaining Investments in Keane is dependent on the amount and timing of future liquidity events and the sale price of the FRAC shares at the time of the liquidity event. As such, it is challenging to accurately estimate the total cash to be realized in the future from Trican’s Investments in Keane as the amount is entirely dependent on future information which is unknown today.
The following table provides illustrative values for Trican’s proceeds from future liquidity events and is inclusive of the secondary offering liquidity event at the time of the IPO on January 20, 2017 which resulted in net proceeds of USD $285.9 million to Keane Holding Company and USD $28.4 million to Trican. The table assumes the remaining FRAC shares held by Keane Holding Company are all sold during the applicable year in the table:
Year Ending March 15Keane Holding
Company ProceedsTrican Pro Rata
Proceeds
Trican Pro Rata Proceeds (1.31 CAD/USD
Exchange Rate)FRAC USD $17.74 share price:
2018 USD$1.57 billion USD$284 million CAD$371 million2019 USD$1.57 billion USD$235 million CAD$308 million2020 USD$1.57 billion USD$170 million CAD$223 million2021 USD$1.57 billion USD$148 million CAD$194 million
FRAC USD $19.74 share price (closing price on February 21, 2017):2018 USD$1.71 billion USD$323 million CAD$423 million2019 USD$1.71 billion USD$275 million CAD$360 million2020 USD$1.71 billion USD$210 million CAD$275 million2021 USD$1.71 billion USD$161 million CAD$211 million
FRAC USD $21.74 share price:2018 USD$1.86 billion USD$363 million CAD$475 million2019 USD$1.86 billion USD$314 million CAD$411 million2020 USD$1.86 billion USD$250 million CAD$327 million2021 USD$1.86 billion USD$186 million CAD$243 million

Trican Well Service Ltd.
MD&A Years Ended December 31, 2015 & 2016 | 19
OUTLOOKDemand for our services steadily increased from the 2016 third quarter into the 2016 fourth quarter. This trend has intensified at the start of the 2017 first quarter with activity significantly picking up during the first week of January and continuing to the date of this report. All our active pressure pumping equipment is expected to be at or near full utilization until spring break-up in March. We activated one 12-hour 30,000 HP fracturing crew midway through the first quarter and will work to convert this to a twenty-four hour crew as we hire additional people. We also activated six cementing crews in the latter part of Q4 and early in Q1. Cementing demand remains very high at the start of 2017 and we anticipate it will remain high throughout the year based on current commodity prices. First quarter financial results are expected to reflect a meaningful increase in activity. The timing of break-up in March remains the only question regarding total activity levels expected during the quarter.
The high level of demand being experienced during the 2017 first quarter has resulted in some customers increasing their work programs during the second quarter. As a result, we expect second quarter activity levels to be considerably higher on a year-over-year basis. The second quarter work was priced at a discount relative to first quarter pricing; however, the incremental revenue from the increased workload is expected to cover a meaningful portion of our fixed cost structure which should allow us to improve our second quarter financial results and maintain our headcount in anticipation of activity picking up coming out of Spring break-up.
The increased activity levels and equipment utilization during the 2016 fourth quarter resulted in a pressure pumping market that became meaningfully undersupplied with manned equipment. These conditions allowed management to increase pricing by approximately 10% by the beginning of the 2017 first quarter. While the activity and pricing increases obtained to date have improved Trican’s EBITDA from negative to positive territory, management believes additional pricing increases are necessary to allow the company to continue to increase its margins to acceptable levels that allow us to run a sustainable business.
The increased activity currently being experienced is a positive indicator that additional pricing increases may be obtained as we emerge from the second quarter activity slowdown due to spring break-up conditions. However, the increased activity levels are resulting in inflationary pressures relating to personnel, proppant, chemicals and third-party hauling costs. If demand continues to increase, we expect the undersupply conditions currently being experienced to persist into the second half of 2017. Difficulties activating parked equipment are expected due to challenges in hiring qualified personnel. We will continue to push for increased pricing from our customers assuming the undersupply conditions persist.
Trican has retired 18,000 HP of fracturing capacity. This HP was older pre-2003 light duty equipment and was sold into the US market. This leaves the Company with approximately 250,000 HP active today and 172,000 HP parked. Parked HP remains in good shape and can be reactivated as activity increases. We continue to run approximately 50% of our cement, coil and other pressure pumping equipment.
Estimates regarding re-activating parked equipment are not possible at this time. Meaningful discussions with our customers regarding expected work programs during the 2017 second half have yet to occur. Management anticipates demand for our services to continue to increase during 2017 assuming oil and gas prices remain constructive. We anticipate making decisions during April regarding equipment re-activation for the second half of the year based on committed customer work programs and our ability to attract and hire qualified personnel to man the equipment.
Keane IPO
On January 20, 2017, FRAC completed its initial public offering (“IPO”) and its shares became publicly traded on the New York Stock Exchange. Trican received net proceeds of approximately USD $28.4 million from the secondary offering of the IPO. At a USD $19.00 IPO share price, Keane received a strong valuation for its business and its shares have traded positively increasing approximately 4% since the IPO. As a result, the value of Trican’s Investments in Keane has significantly increased. Trican’s ownership interest is subject to a six month hold period after the IPO and the timing of further liquidity events are impossible to predict at this time.
Trican Well Service Ltd.
20 | MD&A Years Ended December 31, 2015 & 2016
NEW ACCOUNTING STANDARDS AND INTERPRETATIONS NOT YET ADOPTED
A number of new standards and amendments to standards and interpretations are not yet effective for the year ended December 31, 2016, and have not been applied in preparing these consolidated financial statements.
In July, 2014 the IASB issued the complete IFRS 9, Financial Instruments, (IFRS 9 (2014)). Under the new standard financial assets are classified and measured based on the business model in which they are held and the characteristics of their contractual cash flows. It also amends the impairment model by introducing a new ‘expected credit loss’ model for calculating impairment. Further, IFRS 9 (2014) includes a new general hedge standard that is better aligned with companies’ risk management, expands the scope of the hedging strategies, and introduces more judgement to assess the effectiveness of the hedge relationship. The amendments to IFRS 9 (2014) are effective for annual periods beginning or after January 1, 2018, and are available for early adoption. The Company expects IFRS 9 will impact the Company’s current policies and procedures regarding provisions on trade receivables. Trade receivables are recorded at its original invoice less any amounts estimated to be uncollectable. Under IFRS 9, the expected loss impairment model replaces the current incurred loss model and is based on forward looking approach which includes earlier recognition of losses. Given the short-term nature of these receivables, the Company does not anticipate these changes to have a material financial impact. IFRS 9 also contains a new model to be used for hedge accounting. The Company does not currently apply hedge accounting.
IFRS 15, Revenue from Contracts with Customers, was issued on May 28, 2014. The Standard contains a single model that applies to contracts with customers and two approaches to recognising revenue: at a point in time or over time. The model features a contract-based five-step analysis of transactions to determine whether, how much and when revenue is recognized. New estimates and judgmental thresholds have been introduced, which may affect the amount and/or timing of revenue recognized. The Standard replaces IAS 11, Construction Contracts, IAS 18, Revenue, IFRIC 13, Customer Loyalty Programmes, IFRIC
15, Agreements for the Construction of Real Estate, IFRIC 18, Transfer of Assets from Customers, and SIC 31, Revenue – Barter Transactions Involving Advertising Services. The new standard is effective for annual periods beginning on or after January 1, 2018. Early adoption is also permitted. The Company is currently in the process of reviewing its revenue streams to determine the impact, if any, that the adoption of IFRS 15 will have on its financial statements, as well as the impact that adoption of the standard will have on disclosure.
IASB issued IFRS 16, Leases, in January 2016. The new standard replaces IAS 17, Leases. It is in effect for accounting periods beginning on or after January 1, 2019. Early adoption is permitted only if the Company has adopted IFRS 15, Revenue from Contracts with Customers. Under the new standard, more leases will come on-balance sheet for lessees, with the exception of leases with a term not greater than 12 months and “small value” leases. Lease accounting for lessors remains substantially the same as existing guidance. In 2017, the Company will complete an assessment documenting the potential impacts of IFRS 16 on its consolidated financial statements.
The Company’s initial assessments on the IFRS 9, IFRS 15, and IFRS 16 are based on work completed to date and may be subject to change as the assessments continue.
CRITICAL ACCOUNTING ESTIMATES AND JUDGEMENTSThe preparation of these consolidated financial statements in accordance with IFRS requires management to make judgments and estimates that could materially affect the amounts recognized in the financial statements. By their nature, judgments and estimates may change in light of new facts and circumstances in the internal and external environment. The following judgments and estimates are those deemed by management to be material to the Company’s consolidated financial statements.
Judgments
Depreciation and AmortizationDepreciation and amortization methods are based on management’s judgment of the most appropriate method to reflect the pattern of an asset’s future economic benefit

Trican Well Service Ltd.
MD&A Years Ended December 31, 2015 & 2016 | 21
expected to be consumed by the Company. Among other factors, these judgments are based on industry standards and company-specific history and experience.
Impairment
Assessment of impairment indicators is based on management’s judgment of whether there are internal and external factors that would indicate that a non-financial asset is impaired. The determination of a cash generating unit is also based on management’s judgment and is an assessment of the smallest group of assets that generate cash inflows independently of other assets.
Estimates
Investments in Keane The Company uses a discounted cash flow model to determine the fair value of the Investments in Keane. Inputs to the model are subject to various estimates relating to the timing and size of liquidity events, the price at which shares are sold, the discount rate and volatility of the share price. Fair value inputs are subject to market factors as well as internal estimates. The Company uses a waterfall table to calculate estimated proceeds in accordance with the operating agreement between Trican Well Service Ltd. and Keane Holding Company.
Assets Held for Sale Assets held for sale contains estimates that the property and equipment classified in this category meet the criteria as “assets held for sale”. As at the end of the reporting period these assets are recorded at the lower of cost or fair value less cost to sell.
Allowance for Doubtful Accounts An allowance for doubtful accounts is recorded when there is objective evidence that the collection of the full amount is no longer probable under the terms of the original invoice. Impaired receivables are derecognized when they are assessed as uncollectible. Amounts estimated represent management’s best estimate of probability of collection of amounts from customers.
Impairment of Inventories The Company regularly reviews the nature and quantities of inventory on hand and evaluates the net realizable value of items based on historical usage patterns, known changes to
equipment or processes and customer demand for specific products. Significant or unanticipated changes in business conditions could impact the magnitude and timing of impairment recognized.
Depreciation and Amortization
Depreciation and amortization are calculated to write off the cost, less estimated residual value, of assets on a systematic and rational basis over their expected useful lives. Estimates of residual value and useful lives are based on data and information from various sources including industry practice and historic experience. Expected useful lives and residual values are reviewed annually for any change to estimates and assumptions. Although management believes the estimated useful lives of the Company’s property and equipment are reasonable, it is possible that changes in estimates could occur, which may affect the expected useful lives and salvage values of the property and equipment.
Income taxes
Deferred tax assets and liabilities contain estimates about the nature and timing of future permanent and temporary differences as well as the future tax rates that will apply to those differences. Changes in Canadian and foreign tax laws and rates as well as changes to the expected timing of reversals may have a significant impact on the amounts recorded for deferred tax assets and liabilities. Management closely monitors current and potential changes to Canadian and foreign tax law and bases its estimates on the best available information at each reporting date.
Fair Value of Equity-Settled Share-Based Payments
The Company uses an option pricing model to determine the fair value of equity-settled share-based payments. Inputs to the model are subject to various estimates relating to volatility, interest rates, dividend yields and expected life of the units issued. Fair value inputs are subject to market factors as well as internal estimates. The Company considers historic trends together with any new information to determine the best estimate of fair value at the date of grant.
Impairment of Non-Financial Assets
In determining the recoverable amount of assets subject to impairment testing, the Company measures the recoverable amount of non-financial assets as the higher of a fair value less costs of disposal and its value in use. Recoverable

Trican Well Service Ltd.
22 | MD&A Years Ended December 31, 2015 & 2016
amounts of the non-financial assets are evaluated and calculated using various factors and assumptions. The factors and assumptions used in the estimates are assessed for reasonableness based on the information available at the time the estimates are prepared. As circumstances change and new information becomes available, the estimates could change.
BUSINESS RISKS
Our business is subject to a number of risks and uncertainties, some of which are summarized below. We encourage you to review and carefully consider the risks described below, as well as those described elsewhere in this report and in our other publicly disclosed reports and materials. If any such risks were to materialize, our business, financial condition, results of operations, cash flows or prospects could be materially adversely affected. In turn, this could have a material adverse effect on the trading price of our securities. Additional risks and uncertainties not currently known to us or that we currently deem immaterial may also adversely affect our business and operations.
Demand for Trican’s Services is Dependent Upon the Price of Oil and Natural Gas and Oilfield Services Industry Conditions, which can be Volatile
The demand, pricing and terms for Trican's services depend significantly upon the level of expenditures made by oil and gas companies on exploration, development and production activities. Expenditures by oil and gas companies are typically directly related to the demand for, and price of, oil and gas. Generally, when commodity prices and demand are predicted to be, or are relatively high, demand for Trican's services is high. The converse is also true.
The prices for crude oil and gas have fluctuated widely during recent years and may continue to be volatile in the future. Crude oil prices have decreased significantly since mid-2014 and have fluctuated in response to a variety of factors beyond Trican's control, including: global energy supply, production and policies, including the ability of the Organization of Petroleum Exporting Countries ("OPEC") to set and maintain production levels in order to influence prices for oil; oil and gas production
by non-OPEC countries; the level of consumer demand; political conditions, including the risk of hostilities in the Middle East and global terrorism; global and domestic economic conditions, including currency fluctuations; cost of exporting, producing and delivering oil and gas; technological advances affecting energy consumption; weather conditions; the effect of world-wide energy conservation and greenhouse gas reduction measures and the price and availability of alternative energy sources; and government regulations.
In addition to current and future oil and gas prices, the level of expenditures made by oil and gas companies are influenced by numerous factors over which the Company has no control, including but not limited to: general economic conditions; the cost of exploring for, producing and delivering oil and gas; the discovery rates of new oil and gas reserves; cost and availability of drilling equipment; availability of pipeline and other oil and gas transportation capacity; North American natural gas storage levels; taxation and royalty changes; government regulation; environmental regulation; ability of oil and gas companies to obtain credit, equity capital or debt financing; and currency fluctuations in the jurisdiction where we operate. A decline in expenditures by oil and gas companies caused by a decrease in crude oil prices and/or natural gas prices or otherwise, could have a material adverse effect on Trican's business, financial condition, results of operations and cash flows.
Trican’s May Exceed its Debt Covenants Under the Credit Agreements and May Not be Successful in Negotiating Covenant Relief with its Lenders
Trican is required to comply with certain covenants under the Credit Agreements, which were amended as of November 12, 2015, and January 26, 2016, with the most recent amendments having become effective June 21, 2016 upon closing of an equity offering.
Trican is required to comply with the covenants under the Credit Agreements, which, among others, include leverage ratios and interest coverage covenants, which from time to time either affect the availability or price of additional funding and, in the event that the Company does not comply with these covenants, restrict the Company's access to capital or require a repayment. In addition, if the Company's financial performance results in a breach of

Trican Well Service Ltd.
MD&A Years Ended December 31, 2015 & 2016 | 23
any future financial covenants, access to financing could be restricted and/or all or a portion of the Company's debt could become due on demand. Events beyond the Company's control may contribute to the failure of the Company to comply with such covenants. Even if the Company is able to obtain new financing, it may not be on commercially reasonable terms or terms that are acceptable to the Company. If the Company is unable to negotiate further covenant relief and is required to repay amounts owing under the Bank Facility or the Senior Notes, the lenders thereunder could proceed to foreclose or otherwise realize upon our assets. The acceleration of the Company's indebtedness under one agreement permits acceleration of indebtedness under other agreements that contain cross default or cross-acceleration provisions.
In addition, the Credit Agreements impose operating and financial restrictions on the Company, including restrictions on payment of dividends, repurchase or making of other distributions with respect to the Company's securities, incurring of additional indebtedness, the provision of guarantees, the assumption of loans, making of capital expenditures, entering into of amalgamations, mergers, take-over bids or disposition of assets, among others.
Trican Would be Adversely Affected Should Access to a Credit Facility or Additional Financing be Unavailable to Trican or its Customers
Trican's ability to maintain and potentially expand its current operations is subject to the availability of additional financing that may not be available, or may not be available on terms acceptable to Trican. Trican's current and future activities may also be financed partially or wholly with debt, which may increase its debt levels above industry standards. The level of Trican's indebtedness from time to time could impair its ability to obtain additional financing on a timely basis to take advantage of business opportunities that may arise. If the Company's cash flow from operations is not sufficient to fund its capital expenditure requirements, there can be no assurance that additional debt or equity financing will be available to meet these requirements or, if available, on acceptable terms.
In addition, many of our customers access the credit and financial markets to finance their oil and natural gas drilling activity. If the availability of credit to our customers is
reduced, they may reduce their drilling and production expenditures, thereby decreasing demand for our products and services. Any such reduction in spending by our customers could adversely impact our operating results and financial condition.
The Oilfield Services Industry is Highly Competitive
We compete with multinational, national and regional competitors in each of our current service lines. Certain of our competitors may have financial, technical, manufacturing and marketing advantages and may be in a stronger competitive position than Trican as a result.
Competitive actions taken by our competitors such as price changes, new product and technology introductions and improvements in availability and delivery could affect our market share or competitive position. To be competitive, we must deliver value to our customers by developing new technologies and providing reliable products and services. The intense competition within our industry could lead to a reduction in revenue or prevent us from successfully pursuing additional business opportunities, which could have an adverse effect on Trican's operating results and cash flows.
An Oversupply of Oilfield Service Equipment Could Lead to a Decline in the Demand for Trican's Services
Currently, most competitors, including Trican, operating in the Canadian pressure pumping market have substantial quantities of equipment that is not manned or operating (“Parked Equipment”). In addition, periods of high demand often result in increased capital expenditures on equipment and those capital expenditures may add capacity (“New Build Capacity”) to the Canadian pressure pumping market. The ability to hire qualified personnel to reactivate Parked Equipment and/or the lag between a decision to build additional equipment and when the New Build Capacity is placed into service may result in the supply of oilfield service equipment in the industry not always correlating with the level of demand. The re-activation of Parked Equipment in the near term and the addition of New Build Capacity in the longer term may immediately or eventually result in pressure pumping equipment supply that exceeds

Trican Well Service Ltd.
24 | MD&A Years Ended December 31, 2015 & 2016
actual demand. This excess capacity could cause Trican's competitors to lower their prices and could lead to a decrease in prices in the oilfield services industry generally. Consequentially, Trican could fail to secure enough work in which to employ its active equipment now or in the future. A reduction in pricing for our services or the inability to secure enough work in which to employ our active equipment could have a material adverse effect on Trican's operating results and cash flows.
The Loss of Key Customers Could Cause Trican’s Revenue to Decline Substantially
Trican has a number of key customers that, in aggregate, generate a significant portion of Trican's revenue. There can be no assurance that Trican's relationship with these customers will continue, and a significant reduction or total loss of the business from these customers, if not offset by sales to new or existing customers, would have a material adverse effect on the Company's business, financial condition, results of operations and cash flows.
Trican May be Adversely Impacted by a Shortage of Qualified Personnel
Trican requires highly skilled personnel to operate and provide technical services and support for its business. Competition for the personnel required for its businesses intensifies as activity increases. Trican's ability to manage the costs associated with recruiting, training and retention of a highly skilled workforce could impact its business. During the first half of 2016, Trican continued to reduce its workforce to adjust to adverse market conditions. Market conditions have improved during the second half of 2016 and into the first quarter of 2017 resulting in workforce additions during this period of time. Trican has encountered some challenges in recruiting and retaining qualified individuals. Trican expects these challenges to persist and we may have increased difficulties finding and retaining qualified individuals in the foreseeable future. These recruitment challenges could increase Trican's costs, delay our ability to reactivate parked equipment or have other adverse effects on its operations.
The Cash Value of Trican's Investments in Keane is Based on Future Events and May be Volatile
The total amount of cash Trican will receive from its Investments in Keane is highly dependent on the timing of future disposition(s) of FRAC common shares by Keane Holding Company as well as the realized price for the FRAC common shares. Keane Holding Company’s decision to dispose of FRAC common shares is controlled by Cerberus and, therefore, Trican is unable to estimate the timing of future disposition(s). The timing of future disposition(s) and the realized share price are the key determinants to the cash received by Trican as they significantly impact the waterfall calculation used by Keane Holding Company to distribute the cash proceeds from future sales of FRAC common shares.
A significant delay in the timing, measured in years, of the disposition of FRAC shares could have a material adverse effect on the total amount of cash received by Trican from its Investments in Keane. In addition, FRAC’s share price could materially increase or decrease relative to today’s share price and the realized price may be materially different relative to today’s market price. As a result, the realized sale price for FRAC common shares held by Keane Holding Company may have a material beneficial or adverse effect on the total amount of cash received by Trican from its Investments in Keane.
Trican's Canadian Operations are Susceptible to Weather Volatility
The well service industry is characterized by considerable seasonality in Canada. During the second quarter when the frost leaves the ground, many secondary roads are temporarily rendered incapable of supporting the weight of heavy equipment resulting in severe restrictions in the level of well servicing activity. The duration of this period, commonly referred to as the "spring break-up", has a direct impact on the level of our activities, particularly in Canada. During other periods of the year, rainfall can also render some of the secondary and oilfield service roads impassable for the Company's equipment. Additionally, if an unseasonably warm winter prevents sufficient freezing, Trican may not be able to access well sites. These factors can all reduce activity levels below normal or anticipated levels, which could have an adverse effect on Trican's operations and financial condition.

Trican Well Service Ltd.
MD&A Years Ended December 31, 2015 & 2016 | 25
Fluctuations in Foreign Currency Exchange Rates Could Adversely Affect the Company
Trican's consolidated financial statements are presented in Canadian dollars. The value of the Canadian dollar has decreased significantly compared to the U.S. dollar since mid-2014, and may decrease further in the future. Trican's Canadian operations include exchange rate exposure as purchases of some equipment and materials are from U.S. suppliers. In addition, Trican’s Investments in Keane and a portion of the outstanding Senior Notes are denominated in U.S. dollars. Trican is exposed to increased foreign currency risk should the Canadian dollar weaken further against the U.S. dollar.
Trican entered into cross-currency swap agreements to hedge a portion of our U.S. dollar denominated outstanding Senior Notes. Other than the swap agreements, the Company does not maintain an active hedge program for foreign exchange exposure.
Failure to Achieve the Anticipated Benefits of Acquisitions and Dispositions May Disrupt Trican's Business or Distract Management Attention
Trican continually assesses the value and mix of our assets in light of our business plans and strategic objectives. In this regard, non-core assets are periodically disposed of so that we can focus our efforts and resources more efficiently. Depending on the state of the market, certain of such assets, if disposed of, could be expected to realize less than their carrying value in our financial statements.
As the commodity prices and industry conditions change in the future, and as part of Trican's long-term business strategy, it will continue to consider and evaluate acquisitions of, or significant investments in, complementary businesses and assets. Any acquisition that Trican completes could have unforeseen and potentially material adverse effects on the Company's financial position and operating results including unanticipated costs and liabilities, difficulty of integrating the operations and assets of the acquired business, the ability to properly access and maintain an effective internal control environment over an acquired company, potential loss of key employees and customers of the acquired company and an increase in expenses and working capital requirements.
Trican may incur substantial indebtedness to finance acquisitions and also may issue equity securities in connection with any such acquisitions. Trican will be required to meet certain financial covenants in order to borrow money under its credit agreements to fund acquisitions. Debt service requirements could represent a significant burden on the Company's results of operations and financial condition and the issuance of additional equity could be dilutive to shareholders. Acquisitions could also divert the attention of management and other employees from Trican's day-to-day operations and the development of new business opportunities. In addition, Trican may not be able to continue to identify attractive acquisition opportunities or successfully acquire identified targets.
Trican May Not be Able to Resume Payment of Dividends in the Future
The payment of dividends is at the discretion of the Board. Our ability to pay dividends and the actual amount of such dividends is dependent upon, among other things, our financial performance, our debt covenants and obligations under our credit agreements in effect at the time, our ability to refinance our debt obligations on similar terms and at similar interest rates, our working capital requirements, our future tax obligations, our future capital requirements, and the satisfaction of applicable solvency tests in the Alberta Business Corporation Act (ABCA).
During 2015, Trican suspended its dividend and has not yet resumed payment of any dividends. It is not certain that we will be able to resume payment of any dividends in the future or, if we do, the amount of such dividends. In addition, pursuant to the amendments to the Credit Agreements that are currently in effect, the Company is restricted from paying dividends unless certain conditions, including compliance with financial covenants, are satisfied.
Trican’s Business is Affected by Governmental Regulations and Policies
Trican's operations, and those of its customers, are subject to a variety of federal, provincial, state and local laws, regulations and guidelines, including laws and regulations related to health and safety, the conduct of operations, the manufacture, management, transportation, disposal of certain materials used in its operations, carbon taxes and
Trican Well Service Ltd.
26 | MD&A Years Ended December 31, 2015 & 2016
other new taxation laws. Trican believes it is in compliance with such laws and regulations and has invested financial and managerial resources to ensure such compliance. Such expenditures historically have not been material to Trican. However, because such laws and regulations are subject to change it is impossible for Trican to predict the cost or impact of such laws and regulations on its future operations, nor their impact on its customers' activities and thereby on the demand for its services.
Failure to Maintain Trican’s Safety Standards and Record Could Lead to a Decline in the Demand for Services
Standards for the prevention of incidents in the oil and gas industry are governed by service company safety policies and procedures, accepted industry safety practices, customer specific safety requirements and health and safety legislation. In order to ensure compliance, Trican has developed and implemented safety and training programs, which it believes meet or exceed the applicable standards. A key factor considered by customers in retaining oilfield service providers is safety. Deterioration of Trican's safety performance could result in a decline in the demand for Trican's services and could have a material adverse effect on its revenues, cash flows and profitability.
Trican’s Operations are Subject to Inherent Hazards Which May Not be Covered by Insurance
Trican's operations are subject to hazards inherent in the oil and gas service industry, such as equipment defects, damage, loss, malfunctions and failures, and natural disasters, including induced seismicity related disasters, which may result in fires, vehicle accidents, explosions and uncontrollable flows of natural gas or well fluids that can cause personal injury, loss of life, suspension of operations, damage to formations, damage to facilities, business interruptions, and damage to or destruction of property and equipment. These hazards could expose Trican to liability for personal injury, wrongful death, product liability, property damage and other environmental damages. Trican continuously monitors its activities for quality control and safety and maintains insurance coverage it believes to be adequate and customary in the industry. Additionally, Trican seeks to obtain indemnification from its customers by contract for certain of the above risks. However, such
insurance and indemnities may not be adequate to cover Trican's liabilities and may not be available in the future at rates Trican considers reasonable and commercially justifiable. If the Company were to incur substantial liability and such damages were not covered by insurance or were in excess of policy limits, or if the Company were to incur such liability at a time when it is not able to obtain liability insurance, its business, financial condition, results of operations and cash flow could be materially adversely affected.
Compliance with Various Environmental Laws, Rules, Legislation and Guidelines Could Impose Greater Costs on Trican’s Business or Lead to a Decline in the Demand for Services
Participants in the well services industry are subject to various environmental laws and regulations. These laws and regulations primarily govern the manufacture, processing, importation, transportation, handling and disposal of certain materials used in Trican's operations and may require extensive remediation or impose civil or criminal liability for violations. Trican's customers are subject to similar laws and regulations. Industry participants are also subject to limits on emissions into the air and discharges into surface and sub-surface waters.
Recent regulatory initiatives have been undertaken in various jurisdictions to address assertions that hydraulic fracturing processes use chemicals that could affect drinking water supplies. Legislation has been enacted in some jurisdictions and is being proposed in others that require the energy industry to publicly disclose the chemicals it mixes with water and sand it pumps underground in the fracturing process. These actual and proposed legislative changes could lead to delays and increased operating costs. The adoption of any future federal, provincial or state laws or the implementation of regulations in which the Company currently carries on business or may carry on business in the future, which impose reporting obligations on, or otherwise limit the hydraulic fracturing process could reduce demand for pressure pumping services or make it more difficult for the Company to provide fracturing services for natural gas and oil wells and could affect the Company's ability to utilize proprietary technological developments to compete effectively in the pressure pumping industry. This could

Trican Well Service Ltd.
MD&A Years Ended December 31, 2015 & 2016 | 27
have a material adverse impact on the Company's financial position and operating results.
Stringent Regulation of Fracturing Services Could Have a Material Adverse Impact on the Company’s Financial Position and Operating Results
Trican is subject to increasingly stringent environmental laws and regulations, some of which may provide for strict liability for damages to natural resources or threats to public health or safety. While Trican maintains liability insurance, the insurance is subject to coverage limits and may exclude coverage for damage resulting from environmental contamination. There can be no assurance that insurance will continue to be available to Trican on commercially reasonable terms, that the possible types of environmental liability will be covered by insurance or that the dollar amount of such liabilities will not exceed Trican's policy limits. Even a partially insured claim, if successful and of sufficient magnitude, could have a material adverse effect on Trican's business, results of operations and prospects.
Future regulatory developments could have the effect of reducing industry activity. Trican cannot predict the nature of the restrictions that may be imposed. Increased production in the oil and gas industry from unconventional sources has raised concerns over hydraulic fracturing and seismic-related services, which may result in increased regulation. Regulatory approval processes for oil and gas exploration and development activities, including the scope of regulatory oversight and permitting and approval requirements, and the time it takes to receive necessary permits and applicable regulatory approvals could be slowed or unfavorable due to the influence from the evolving role of activists and their impact on public opinion and government policy related to energy development projects and the utilization of hydraulic fracturing technology and processes in particular. The adoption of future federal, state, local or foreign laws or implementing regulations imposing reporting obligations on, or limiting or banning, the hydraulic fracturing process could make it more difficult to complete natural gas or oil wells and could have a material adverse effect on Trican's liquidity, consolidated results of operations, and consolidated financial condition. Trican may be required to increase operating expenses or capital expenditures in order to
comply with any new restrictions or regulations. Such expenditures could be material.
We are also aware that some countries, provinces, states, counties and municipalities have enacted or are considering moratoria on hydraulic fracturing. Additionally, Trican's business could be affected by a moratorium on related operations, such as sand mining, which provides proppant, a key input for our hydraulic fracturing operations. It is not possible to estimate how these various restrictions could affect Trican's operations.
Trican may be Subject to Litigation, Contingent Liabilities and Potential Unknown Liabilities
From time to time, Trican is subject to costs and other effects of legal and administrative proceedings, settlements, reviews, claims and actions. Trican may in the future be involved in disputes with other parties which could result in litigation or other actions, proceedings or related matters. Furthermore, there may be unknown liabilities assumed by Trican in relation to prior acquisitions or dispositions as well as environmental or tax issues. The discovery of any material liabilities could have an adverse effect on Trican's financial condition and results.
The results of litigation or any other proceedings or related matters cannot be precisely predicted due to uncertainty as to the final outcome. Trican's assessment of the likely outcome of these matters is based on its judgment of a number of factors including past history, precedents, relevant financial and other evidence and facts specific to the matter as known at the time of the assessment.
There are Certain Risks Associated with Trican's Dependence on Third-Party Suppliers
Trican sources raw materials, such as oilfield cement, proppant, guar, nitrogen, carbon dioxide and coiled tubing as well as spare parts, from a variety of suppliers, most of whom are located in Canada and the United States. Alternate suppliers exist for all raw materials and spare parts. The source and supply of materials has been reliable in the past; however, in periods of high industry activity, Trican has occasionally experienced periodic shortages of certain materials. In addition, in periods of low activity, there is an increased risk that Trican's key suppliers are in financial
Trican Well Service Ltd.
28 | MD&A Years Ended December 31, 2015 & 2016
distress and may not be able to provide the products required. Management maintains relationships with a number of suppliers in an attempt to mitigate this risk. However, if the current suppliers are unable to provide the necessary materials, or otherwise fail to deliver products in the quantities required, any resulting delays in the provision of services to Trican's clients could have a material adverse effect on its results of operations and financial condition.
Trican carries raw material and spare parts inventories to minimize delays in the provision of our pressure pumping services because of potential supply chain disruptions. Management periodically reviews and assesses the raw material and spare parts inventories for obsolescence. An assessment may result in an inventory value write-down, most notably during times of slow activity. The total dollar value of our inventories is material to Trican’s financial results and a significant future inventory value write-down may be material to these results.
Trican may also have prepaid deposits with suppliers relating to inventory or property and equipment. The recoverability of these prepayments is subject to the financial health of the relevant suppliers.
New Technology Could Place Trican at a Disadvantage versus Competitors
The ability of the Company to meet customer demands in respect of performance and cost will depend upon continuous improvements in the provision of its services and operating equipment. There can be no assurance that the Company will be successful in its efforts in this regard or that it will have the resources available to meet this continuing demand. Failure by Trican to do so could have a material adverse effect on the Company's business, financial condition, results of operation and cash flows. No assurances can be given that competitors will not achieve technological advantages over the Company.
Failure to Receive Timely Delivery of New Equipment and Parts from Suppliers Could Adversely Affect Trican's Growth Plans
The Company's ability to provide reliable service in the future may be dependent upon timely delivery of new equipment and replacement parts from fabricators and
suppliers. During past periods of high industry activity, a shortage of skilled labour to build equipment coupled with high demand has placed a strain on some fabricators. Currently there is an oversupply of this equipment and Trican has no plans to acquire any such capital equipment other than for maintenance purposes. However, if a similar strain occurs in the future, it could potentially increase the order time on new equipment and increase uncertainty surrounding final delivery dates. Significant delays in the arrival of new equipment from expected dates may constrain future growth and may have a material adverse effect on the financial performance of the Company.
INTERNAL CONTROL OVER FINANCIAL REPORTINGDisclosure Controls & Procedures
Disclosure controls and procedures (DC&P), as defined in National Instrument 52-109 Certification of Disclosure in Issuers’ Annual and Interim Filings (NI 52-109), are designed to provide reasonable assurance that information required to be disclosed in reports filed with, or submitted to, securities regulatory authorities is recorded, processed, summarized and reported within the time periods specified under Canadian securities law. DC&P include controls and procedures designed to ensure that information required to be disclosed is accumulated and communicated to management, including the Chief Executive Officer and the Chief Financial Officer, as appropriate, to allow timely decisions regarding required disclosure.
The Chief Executive Officer and the Chief Financial Officer of Trican evaluated the effectiveness of the design and operation of the Company’s DC&P. Based on that evaluation, the Chief Executive Officer and Chief Financial Officer concluded that Trican’s DC&P were effective as at December 31, 2016.
Internal Control Over Financial Reporting
Trican’s Chief Executive Officer and the Chief Financial Officer are responsible for establishing and maintaining internal control over financial reporting (ICFR), as such term is defined in NI 52-109. They have, as at the financial year ended December 31, 2016, designed ICFR, or caused it to be designed under their supervision, to provide reasonable assurance regarding the reliability of financial reporting

Trican Well Service Ltd.
MD&A Years Ended December 31, 2015 & 2016 | 29
and the preparation of financial statements for external purposes in accordance with IFRS. The control framework the officers used to design Trican’s ICFR is the Internal Control - Integrated Framework (2013) published by The Committee of Sponsoring Organizations of the Treadway Commission (COSO).
Trican’s ICFR includes policies and procedures that:
� Pertain to the maintenance of records that, in reasonable detail, accurately and fairly reflect transactions, acquisitions and dispositions of assets of the Company;
� Provide reasonable assurance that transactions are recorded as necessary to permit preparation of financial statements in accordance with generally accepted accounting principles; and
� Provide reasonable assurance regarding prevention, or timely detection, of unauthorized acquisition, use, or disposition of the Company’s assets that could have a material effect on the financial statements.
Trican conducted an evaluation of the effectiveness of its ICFR as at December 31, 2016, based on the COSO Framework, under the supervision of the Chief Executive Officer and the Chief Financial Officer. Based on this evaluation, the Officers concluded that as of December 31, 2016, Trican’s ICFR is effective.
While the Officers believe that Trican’s controls are effective, they do not expect that the disclosure controls and procedures or internal control over financial reporting will prevent all errors and fraud. A control system, no matter how well conceived or operated, provides reasonable, but not absolute, assurance that the objectives of the control system are met.
There were no changes in the Company’s ICFR during the year ended December 31, 2016 that materially affected the Company’s ICFR.
SELECTED ANNUAL INFORMATION
($ 000’s, except per share amounts and operational information) 2016 2015 2014Total Revenue - Continuing Operations 325,179 649,735 1,210,666 Profit / (loss) - Continuing Operations (40,729) (62,781) 67,089 Per Share - Basic and Diluted (0.24) (0.42) 0.45 Proft / (loss) (29,534) (827,774) (5,046)Per Share - Basic and Diluted (0.18) (5.56) (0.03)Total assets 915,437 1,349,070 2,536,864 Total long-term financial liabilities 249,693 548,888 758,545 Shareholders' equity 569,009 553,695 1,285,280 Weighted average shares outstanding - Basic and Diluted 172,387 148,927 149,286 Shares outstanding at year-end 193,568 148,918 149,106 Dividend per share - 0.15 0.30
2015 versus 2014 – Selected Annual Information
Total continuing operations revenue for 2015 decreased by 46% to $650 million compared to 2014, and the loss from continuing operations was $62.8 million versus a profit of $67 million in 2014. Diluted earnings per share decreased to a loss of $0.42 compared to a profit of $0.45 in 2014. Consolidated loss was $829.9 million in 2015, versus a loss of $5.0 million in 2014. Diluted earnings per share increased to a loss of $5.56 compared to a loss of $0.03 in 2014.
Canadian operations are classified as continuing operations. Canadian revenue in 2015 was down 46% compared to 2014. The depressed commodity price environment led to a reduction in Canadian oilfield activity in 2015. The rig count decreased 62% compared to prior year, driving a 45% reduction in the Canadian job count. Revenue per job declined by 4% as the number of fracturing stages completed per well and sand volumes grew and led to larger fracturing job sizes which largely offset an average year-over-year pricing decline of 19%.
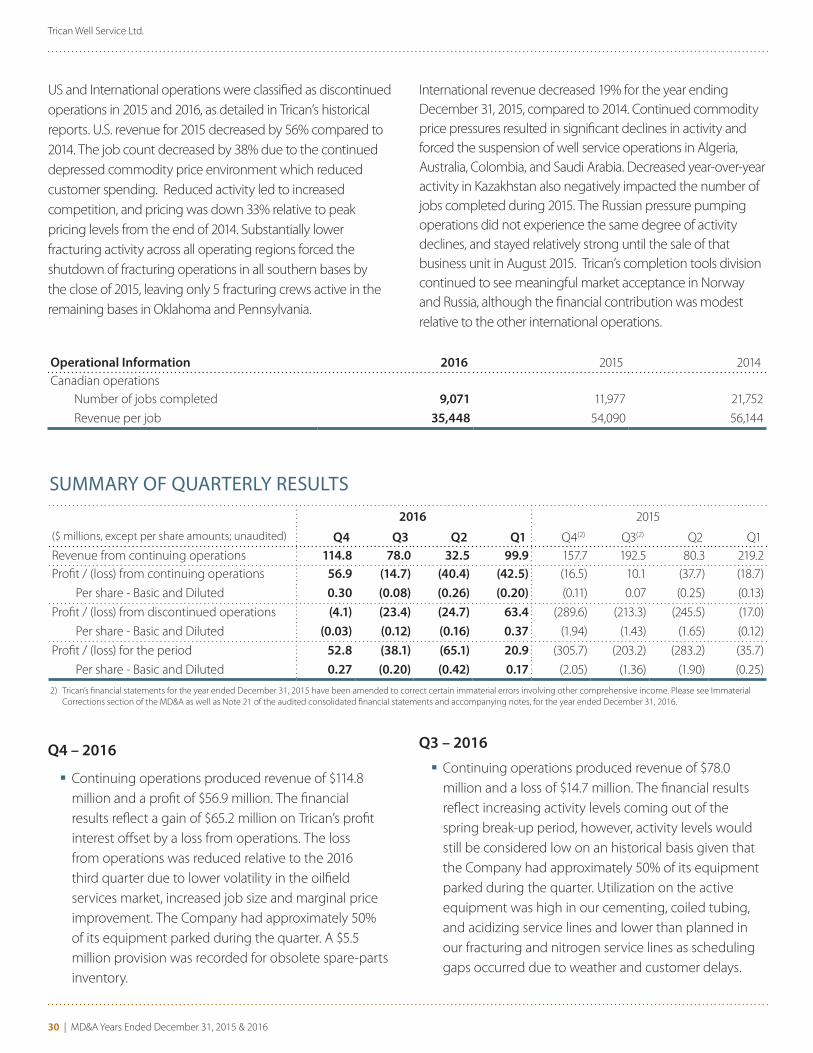
Trican Well Service Ltd.
30 | MD&A Years Ended December 31, 2015 & 2016
US and International operations were classified as discontinued operations in 2015 and 2016, as detailed in Trican’s historical reports. U.S. revenue for 2015 decreased by 56% compared to 2014. The job count decreased by 38% due to the continued depressed commodity price environment which reduced customer spending. Reduced activity led to increased competition, and pricing was down 33% relative to peak pricing levels from the end of 2014. Substantially lower fracturing activity across all operating regions forced the shutdown of fracturing operations in all southern bases by the close of 2015, leaving only 5 fracturing crews active in the remaining bases in Oklahoma and Pennsylvania.
International revenue decreased 19% for the year ending December 31, 2015, compared to 2014. Continued commodity price pressures resulted in significant declines in activity and forced the suspension of well service operations in Algeria, Australia, Colombia, and Saudi Arabia. Decreased year-over-year activity in Kazakhstan also negatively impacted the number of jobs completed during 2015. The Russian pressure pumping operations did not experience the same degree of activity declines, and stayed relatively strong until the sale of that business unit in August 2015. Trican’s completion tools division continued to see meaningful market acceptance in Norway and Russia, although the financial contribution was modest relative to the other international operations.
Q4 – 2016
� Continuing operations produced revenue of $114.8 million and a profit of $56.9 million. The financial results reflect a gain of $65.2 million on Trican’s profit interest offset by a loss from operations. The loss from operations was reduced relative to the 2016 third quarter due to lower volatility in the oilfield services market, increased job size and marginal price improvement. The Company had approximately 50% of its equipment parked during the quarter. A $5.5 million provision was recorded for obsolete spare-parts inventory.
Operational Information 2016 2015 2014Canadian operations Number of jobs completed 9,071 11,977 21,752
Revenue per job 35,448 54,090 56,144
SUMMARY OF QUARTERLY RESULTS
($ millions, except per share amounts; unaudited)
2016 2015
Q4 Q3 Q2 Q1 Q4(2) Q3(2) Q2 Q1Revenue from continuing operations 114.8 78.0 32.5 99.9 157.7 192.5 80.3 219.2Profit / (loss) from continuing operations 56.9 (14.7) (40.4) (42.5) (16.5) 10.1 (37.7) (18.7)
Per share - Basic and Diluted 0.30 (0.08) (0.26) (0.20) (0.11) 0.07 (0.25) (0.13)
Profit / (loss) from discontinued operations (4.1) (23.4) (24.7) 63.4 (289.6) (213.3) (245.5) (17.0)
Per share - Basic and Diluted (0.03) (0.12) (0.16) 0.37 (1.94) (1.43) (1.65) (0.12)
Profit / (loss) for the period 52.8 (38.1) (65.1) 20.9 (305.7) (203.2) (283.2) (35.7)
Per share - Basic and Diluted 0.27 (0.20) (0.42) 0.17 (2.05) (1.36) (1.90) (0.25)
Q3 – 2016
� Continuing operations produced revenue of $78.0 million and a loss of $14.7 million. The financial results reflect increasing activity levels coming out of the spring break-up period, however, activity levels would still be considered low on an historical basis given that the Company had approximately 50% of its equipment parked during the quarter. Utilization on the active equipment was high in our cementing, coiled tubing, and acidizing service lines and lower than planned in our fracturing and nitrogen service lines as scheduling gaps occurred due to weather and customer delays.
2) Trican’s financial statements for the year ended December 31, 2015 have been amended to correct certain immaterial errors involving other comprehensive income. Please see Immaterial Corrections section of the MD&A as well as Note 21 of the audited consolidated financial statements and accompanying notes, for the year ended December 31, 2016.

Trican Well Service Ltd.
MD&A Years Ended December 31, 2015 & 2016 | 31
Our fracturing equipment was fully booked through the quarter and most work that was delayed was pushed into the fourth quarter.
� Discontinued operations produced revenue of $3.9 million and a loss of $23.4 million. Financial results included a loss of $8.3 million for a legal settlement and a loss of $4.9 million due to working capital adjustments related to the sale of Trican’s U.S. operations. In addition, losses from operations and losses from the disposition of the Kazakhstan pressure pumping business and the completion tools business added to the loss for the quarter.
Q2 – 2016
� Continuing operations produced revenue of $32.5 million and a loss of $40.4 million. Low commodity prices and spring break-up significantly reduced activity and pricing for our services as well as the financial results. An additional 15% of our equipment was parked at the start of the quarter bringing the quantity parked to 50% of our total fleet. The financial impact of the low activity levels and pricing reductions was largely mitigated by further headcount reductions and temporary salary rollbacks. The Company incurred $8.4 million in severance payments associated with workforce reductions in an effort to reduce our fixed cost structure.
� Discontinued operations produced revenue of $13.0 million and a loss of $24.7 million. Financial results were driven by the completion tools and Kazakhstan businesses. An impairment provision relating to the completions tools business of $26.3 million was recorded during the quarter.
Q1 – 2016
� Continuing operations produced revenue of $99.9 million and a loss of $42.5 million. Results continue to be negatively impacted by reduced drilling and completion activity caused by low commodity prices and early spring break-up conditions. Pricing was down approximately 6% sequentially. Trican’s fixed cost structure in Q1 2016 has been reduced by 36% when compared to Q1 2015 as a result of workforce reductions, discretionary spending reductions and
lower compensation programs. Approximately 35% of the Canadian operations’ equipment remained parked. The Company also incurred significant costs for severance associated with workforce reductions as a measure to reduce our fixed cost structure.
� Discontinued operations produced revenue of $72.2 million and a profit of $63.4 million. An operating loss was recorded during the quarter and was largely driven by the U.S. operations and completions tools business. A gain on the sale of the U.S. Operations of $64.6 million, inclusive of a foreign translation gain of $75.0 million, was recorded during the quarter.
Q4 – 2015
� Revenue from continuing operations was $157.7 million and the loss from continuing operations was $16.5 million. Canadian results were negatively impacted by reduced drilling and completions activity caused by low commodity prices. Activity levels were low compared to the fourth quarter of 2014 and the pressure of low commodity prices shortened the December activity levels more than normal. Negatively impacting the loss from continuing operations were significant one-time costs such as severance associated with workforce reductions as well as legal and professional costs.
� US and International operations were classified as discontinued operations in 2015 and 2016, as detailed in Trican’s historical reports.
� U.S. operations generated $94.6 million of revenue and an adjusted operating loss of $6.1 million. We operated five of our sixteen crews in the U.S. market. Notwithstanding low demand combined with excess pressure pumping supply, our U.S. operations meaningfully improved its financial results by aggressively reducing its costs.
� International operations generated $7.4 million in revenue and an adjusted operating loss of $1.2 million. As the first full quarter of operations since the sale of Trican’s Russian assets, the majority of the remaining activity came from Kazakhstan operations combined with steady business in our Norwegian and Russian completions tools businesses. Trican completely

Trican Well Service Ltd.
32 | MD&A Years Ended December 31, 2015 & 2016
exited or discontinued operations in the Australian and Algerian markets, and reduced its business activity in the Colombian and Saudi Arabian markets to the point where the Company only had limited operations in these markets.
� As a result of low commodity prices combined with excess pressure pumping supply in the market, the Company performed impairment tests to assess the carrying values of its property and equipment, intangible assets and goodwill. The Company recorded an asset impairment of $385.3 million for the year ended December 31, 2015.
Q3 – 2015
� Revenue from continuing operations was $192.5 million and the profit from continuing operations was $10.1 million. Canadian results were negatively impacted by reduced drilling and completions activity caused by low commodity prices. Activity levels were very low when compared to third quarter of 2014, but increased meaningfully when compared to Q2 2015, due to seasonal increases in activity and market share gains. The increased level of activity was partially offset by a slight sequential decline in pricing. Trican significantly lowered its costs during the quarter, which had a large impact on our ability to achieve peer leading margins in the Canadian region. Approximately 35% of the Canadian operations’ equipment was parked.
� U.S. and International operations were classified as discontinued operations in 2015 and 2016, as detailed in Trican’s historical reports.
� U.S. operations generated $120.6 million of revenue and an adjusted operating loss of $13.7 million. Despite continued low demand combined with excess pressure pumping supply, our U.S. operations increased revenue 52% sequentially from Q2 2015 to Q3 2015. We operated eight of our sixteen crews during the third quarter. Pricing decreased slightly since the last quarter and was down 30% relative to peak pricing levels at the end of 2014. Activity increased substantially over the second quarter as we repositioned much of our equipment with new clients, which substantially improved
sequential utilization. We shut down two fracturing crews in the Eagle Ford and Permian basins as a result of continued pricing pressure and a lack of sustained work programs in these regions.
� International operations generated $42 million in revenue and adjusted operating income of $1.6 million. Weak market conditions in Kazakhstan and the suspension of operations in Colombia and Saudi Arabia negatively impacted our revenue. However, these factors were offset by increased level of activity in our Norwegian and Russian completions tools business. Trican sold its Russian pressure pumping operations and committed to a plan to sell the operating assets in Algeria and Australia.
Q2 – 2015
� Revenue from continuing operations was $80.3 million and the loss from continuing operations was $37.7 million. Canadian results were negatively impacted by reduced drilling and completions activity caused by low commodity prices and the impact of spring break-up. Reduced customer demand resulted in a sequential decline in pricing of approximately 10%. Management focused on adjusting the Canadian operations’ fixed and variable cost structure and realized meaningful cost savings during the quarter. Approximately 35% of the Canadian operations’ equipment was parked during the quarter.
� U.S. and International operations were classified as discontinued operations in 2015 and 2016, as detailed in Trican’s historical reports.
� U.S. operations generated $79.4 million of revenue and an operating loss of $24.6 million. Reduced drilling and completions activity caused by low oil and gas prices resulted in a significant sequential decline in utilization and pricing in our U.S. operations. We parked 8 of our 16 crews and utilization on the remaining 8 crews was at historically low levels. Pricing declined an additional 15% and job count declined 32% on a sequential basis. Management meaningfully reduced the U.S. operations’ cost structure and realized meaningful cost savings.

Trican Well Service Ltd.
MD&A Years Ended December 31, 2015 & 2016 | 33
� International operations generated $69.4 million in revenue and operating income of $10.0 million. The devaluation of the Russian ruble had a significant impact on financial results as the ruble/Canadian dollar exchange rate declined 34% compared to the previous year. Russian activity was relatively strong; however, this strength was partially offset by weak activity in Kazakhstan and Australia.
Q1 – 2015
� Revenue from continuing operations was $219.2 million and the loss from continuing operations was $18.7 million. Canadian results were negatively impacted by reduced customer activity caused by low commodity prices. Although demand was stable in January and early February, activity levels declined sharply in late February and remained low for the remainder of the quarter. Reduced customer demand led to a sequential decline in Canadian pricing of approximately 10%. In response to low demand, we decreased the amount of active equipment in Canada by approximately 35% in March.
� U.S. and International operations were classified as discontinued operations in 2015 and 2016, as detailed in Trican’s historical reports.
� Our U.S. operations generated revenue of $201.4 million and an operating loss of $13.7 million. A weak U.S. operating environment caused by low commodity prices led to substantial sequential declines in both utilization and pricing. Average first quarter pricing declined by 15% and the job count decreased by 35% compared to the fourth quarter of 2014. In response to reduced demand, we downsized our U.S. pressure pumping operations with eight fracturing fleets active compared to sixteen at the end of 2014.
� International operations generated revenue of $52.0 million and operating income of $1.4 million. Our Russian operations comprised the majority of our international results and activity levels in Russia were strong during the quarter. Despite a 60% year-over-year decline in the Russian ruble relative to the Canadian dollar, Russian revenue decreased by only 30% as higher activity levels helped to offset the impact of the weaker ruble.
NON-GAAP DISCLOSUREOperating income / (loss), adjusted operating income do not have any standardized meaning as prescribed by IFRS and, therefore, are considered non-GAAP measures.
Adjusted general and administrative expenses and adjusted corporate expenses have been reconciled to Administrative expenses. Adjusted general and administrative expenses combined with adjusted corporate expenses provides investors with an indication of total overhead costs before equity-settled share-based compensation, amortization of debt costs and severance costs.
Operating income / (loss) and adjusted operating income / (loss) have been reconciled to gross profit / (loss), being the most directly comparable measures calculated in accordance with IFRS. Adjusted operating income provides investors with an indication of operating income before equity-settled share-based compensation, amortization of debt costs, severance costs and excludes items that are significant but not reflective of our ongoing operations for the period. It provides investors with an indication of comparable operating income / (loss) between periods and provides an indication of measures used for debt covenant calculations.
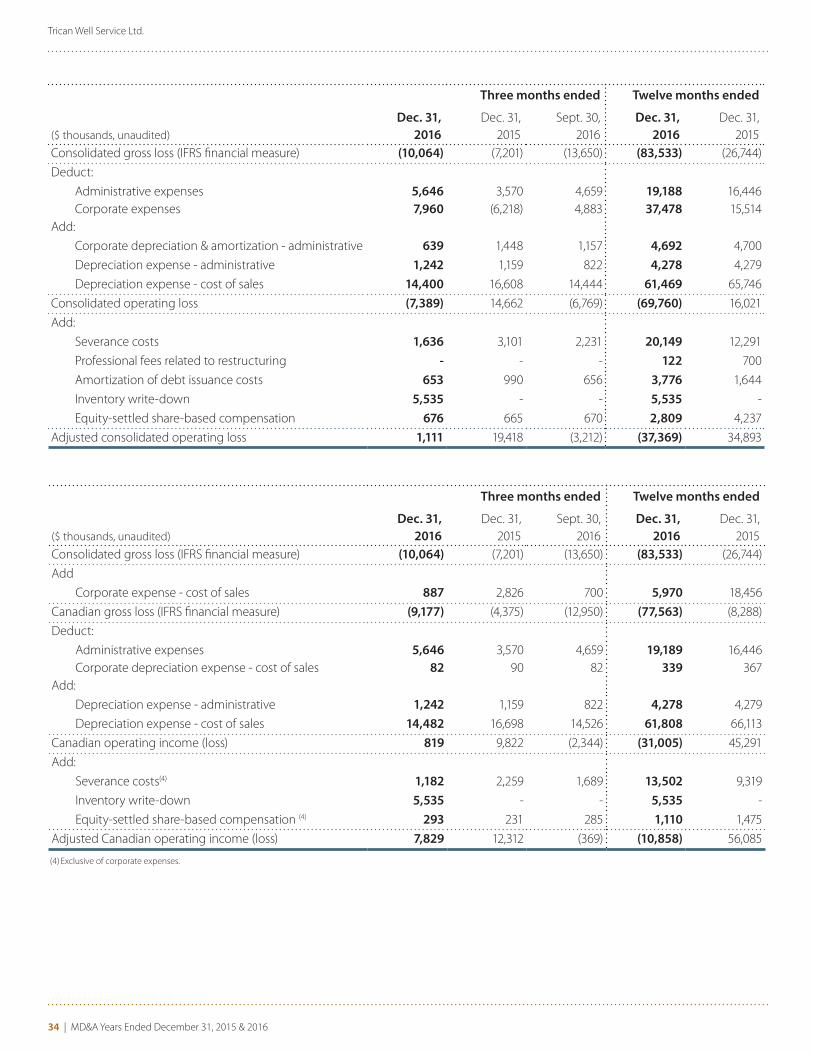
Trican Well Service Ltd.
34 | MD&A Years Ended December 31, 2015 & 2016
Three months ended Twelve months ended
($ thousands, unaudited)
Dec. 31, 2016
Dec. 31, 2015
Sept. 30, 2016
Dec. 31, 2016
Dec. 31, 2015
Consolidated gross loss (IFRS financial measure) (10,064) (7,201) (13,650) (83,533) (26,744)
Deduct:
Administrative expenses 5,646 3,570 4,659 19,188 16,446 Corporate expenses 7,960 (6,218) 4,883 37,478 15,514Add:
Corporate depreciation & amortization - administrative 639 1,448 1,157 4,692 4,700
Depreciation expense - administrative 1,242 1,159 822 4,278 4,279
Depreciation expense - cost of sales 14,400 16,608 14,444 61,469 65,746
Consolidated operating loss (7,389) 14,662 (6,769) (69,760) 16,021
Add:
Severance costs 1,636 3,101 2,231 20,149 12,291
Professional fees related to restructuring - - - 122 700
Amortization of debt issuance costs 653 990 656 3,776 1,644
Inventory write-down 5,535 - - 5,535 -
Equity-settled share-based compensation 676 665 670 2,809 4,237
Adjusted consolidated operating loss 1,111 19,418 (3,212) (37,369) 34,893
Three months ended Twelve months ended
($ thousands, unaudited)
Dec. 31, 2016
Dec. 31, 2015
Sept. 30, 2016
Dec. 31, 2016
Dec. 31, 2015
Consolidated gross loss (IFRS financial measure) (10,064) (7,201) (13,650) (83,533) (26,744)
Add
Corporate expense - cost of sales 887 2,826 700 5,970 18,456
Canadian gross loss (IFRS financial measure) (9,177) (4,375) (12,950) (77,563) (8,288)
Deduct:
Administrative expenses 5,646 3,570 4,659 19,189 16,446 Corporate depreciation expense - cost of sales 82 90 82 339 367Add:
Depreciation expense - administrative 1,242 1,159 822 4,278 4,279
Depreciation expense - cost of sales 14,482 16,698 14,526 61,808 66,113
Canadian operating income (loss) 819 9,822 (2,344) (31,005) 45,291
Add:
Severance costs(4) 1,182 2,259 1,689 13,502 9,319
Inventory write-down 5,535 - - 5,535 -
Equity-settled share-based compensation (4) 293 231 285 1,110 1,475
Adjusted Canadian operating income (loss) 7,829 12,312 (369) (10,858) 56,085
(4) Exclusive of corporate expenses.
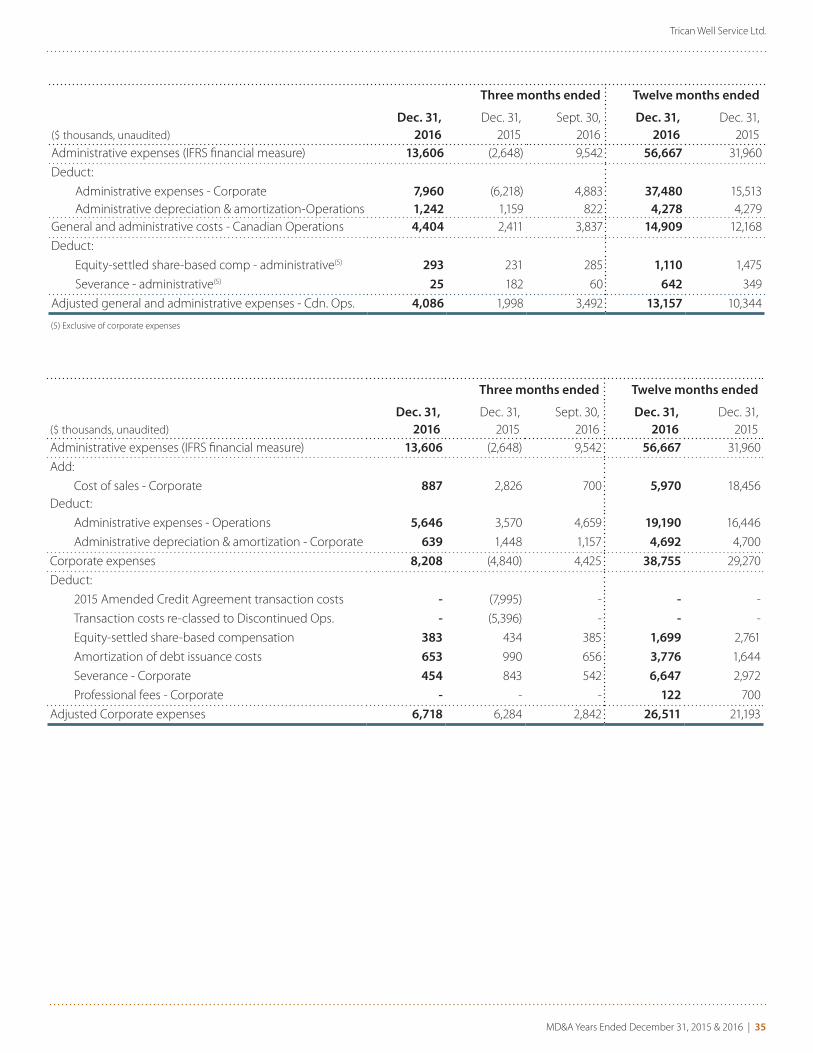
Trican Well Service Ltd.
MD&A Years Ended December 31, 2015 & 2016 | 35
Three months ended Twelve months ended
($ thousands, unaudited)
Dec. 31, 2016
Dec. 31, 2015
Sept. 30, 2016
Dec. 31, 2016
Dec. 31, 2015
Administrative expenses (IFRS financial measure) 13,606 (2,648) 9,542 56,667 31,960
Deduct:
Administrative expenses - Corporate 7,960 (6,218) 4,883 37,480 15,513 Administrative depreciation & amortization-Operations 1,242 1,159 822 4,278 4,279General and administrative costs - Canadian Operations 4,404 2,411 3,837 14,909 12,168
Deduct:
Equity-settled share-based comp - administrative(5) 293 231 285 1,110 1,475
Severance - administrative(5) 25 182 60 642 349
Adjusted general and administrative expenses - Cdn. Ops. 4,086 1,998 3,492 13,157 10,344
(5) Exclusive of corporate expenses
Three months ended Twelve months ended
($ thousands, unaudited)
Dec. 31, 2016
Dec. 31, 2015
Sept. 30, 2016
Dec. 31, 2016
Dec. 31, 2015
Administrative expenses (IFRS financial measure) 13,606 (2,648) 9,542 56,667 31,960
Add:
Cost of sales - Corporate 887 2,826 700 5,970 18,456Deduct:
Administrative expenses - Operations 5,646 3,570 4,659 19,190 16,446
Administrative depreciation & amortization - Corporate 639 1,448 1,157 4,692 4,700
Corporate expenses 8,208 (4,840) 4,425 38,755 29,270
Deduct:
2015 Amended Credit Agreement transaction costs - (7,995) - - -
Transaction costs re-classed to Discontinued Ops. - (5,396) - - -
Equity-settled share-based compensation 383 434 385 1,699 2,761
Amortization of debt issuance costs 653 990 656 3,776 1,644
Severance - Corporate 454 843 542 6,647 2,972
Professional fees - Corporate - - - 122 700
Adjusted Corporate expenses 6,718 6,284 2,842 26,511 21,193

Trican Well Service Ltd.
36 | MD&A Years Ended December 31, 2015 & 2016
FORWARD-LOOKING STATEMENTS
This document contains certain forward-looking information and financial outlook based on Trican's current expectations, estimates, projections and assumptions that were made by the Company in light of information available at the time the statement was made. Forward-looking information and financial outlook that address expectations or projections about the future, and other statements and information about the Company's strategy for growth, expected and future expenditures, costs, operating and financial results,
� Anticipated commodity price levels;
� Anticipated 2017 industry activity levels in jurisdictions of the Company’s operations, as well as customer work programs and equipment utilization levels;
� Anticipated adjustments to our active equipment fleet, and related adjustments to cost structure;
� Expectations regarding workforce recruitment and retention;
� Anticipated compliance with debt and other covenants under the Second 2016 Amended Credit Agreements;
� Expectations regarding the Company’s cost structure;
� Expectations regarding capital spending for 2017;
� Expectations regarding the Company’s financial results, working capital levels, liquidity and profits;
� Expectations regarding stages per well and quantity of proppant pumped per well;
� Expectations regarding pricing of the Company’s services;
� Expectations regarding the timing, value and realized cash flow from the Investments in Keane;
� Expectations regarding the impact of discontinued operations in various international regions on the Company going forward;
� Anticipated ability of the Company to meet foreseeable funding requirements;
� Expectations regarding the potential outcome of contingent liabilities;
� Expectations regarding the impact of new accounting standards and interpretations not yet adopted;
� Expectations surrounding weather and seasonal slowdowns.
future financing and capital activities are forward-looking statements. Some forward-looking information and financial outlook are identified by the use of terms and phrases such as "anticipate", "achieve", "estimate", "expect", "intend", "plan", "planned", and other similar terms and phrases. This forward-looking information and financial outlook speak only as of the date of this document and we do not undertake to publicly update this forward-looking information and financial outlook except in accordance with applicable securities laws. This forward-looking information and financial outlook include, among others:

Trican Well Service Ltd.
MD&A Years Ended December 31, 2015 & 2016 | 37
Forward-looking information and financial outlook is based on current expectations, estimates, projections and assumptions, which we believe are reasonable but which may prove to be incorrect. Trican's actual results may differ materially from those expressed or implied and therefore such forward-looking information and financial outlook should not be unduly relied upon. In addition to other factors and assumptions which may be identified in this document, assumptions have been made regarding, among other things; Trican's ability to continue its operations for the foreseeable future and to realize its assets and discharge its liabilities and commitments in the normal course of business; Trican being compliant with debt and other covenants; industry activity levels, including its effect of reducing the Company's capital and maintenance expenditures; the completion of currently planned work activities by our customers; the general stability of the economic and political environment; effect of market conditions on demand for the Company's products and services and prices that can be obtained for those products and services; the ability to achieve planned cost reductions; the ability to obtain qualified staff, equipment and services in a timely and cost efficient manner; the ability to operate its business in a safe, efficient and effective manner; the performance and characteristics of various business segments; the effect of current plans; future oil and natural gas prices; currency, exchange and interest rates; the regulatory framework regarding royalties, taxes and environmental matters; changes in competition and pricing in the oilfield service business; and unanticipated costs and liabilities.
Forward-looking information and financial outlook is subject to a number of risks and uncertainties, which could cause actual results to differ materially from those
anticipated. These risks and uncertainties include: failure to meet the agreed upon covenants with the Company's lenders; fluctuating prices for crude oil and natural gas; changes in drilling activity; general global economic, political and business conditions; changes in interest rates; competitive and business conditions in the markets where the Company operates; weather conditions; regulatory changes; the successful exploitation and integration of technology; customer acceptance of technology; success in obtaining and defending issued patents; the potential development of competing technologies by market competitors; and availability of products, qualified personnel, manufacturing capacity and raw materials. The foregoing important factors are not exhaustive. In addition, actual results could differ materially from those anticipated in forward-looking information provided herein as a result of the risk factors set forth under the section entitled "Risks Factors" in our Annual Information Form dated March 29, 2016, and under the section entitled “Business Risks” in our management’s discussion and analysis for the year ended December 31, 2015. Readers are also referred to the risk factors and assumptions described in other documents filed by the Company from time to time with securities regulatory authorities.
Trican undertakes no obligation to update forward-looking information if circumstances or management's estimates or opinions should change except as required by law. The reader is cautioned not to place undue reliance on forward looking information.
Additional information regarding Trican including Trican’s most recent annual information form is available under Trican’s profile on SEDAR (www.sedar.com).

Trican Well Service Ltd.
38 | MD&A Years Ended December 31, 2015 & 2016
MANAGEMENT’S RESPONSIBILITY FOR FINANCIAL STATEMENTS
The management of Trican Well Service Ltd. is responsible for the preparation and integrity of the accompanying consolidated financial statements and all other information contained in these financial statements. The consolidated financial statements have been prepared in conformity with accounting principles generally accepted in Canada and include amounts that are based on management’s informed judgments and estimates where necessary.
The Company maintains internal accounting control systems which are adequate to provide reasonable assurance that assets are safeguarded, transactions are executed in accordance with management’s authorization and accounting records are reliable as a basis for the preparation of the consolidated financial statements.
The Board of Directors, through its Audit Committee, monitors management’s financial and accounting policies and practices and the preparation of these financial statements. The Audit Committee meets periodically with external auditors and management to review the work of each and the propriety of the discharge of their responsibilities. Specifically, the Audit Committee reviews with management and the external auditors the financial statements and annual report of the Company prior to submission to the Board of Directors for final approval. The external auditors have full and free access to the Audit Committee to discuss auditing and financial reporting matters.
The shareholders have appointed KPMG LLP as the external auditors of the Company and, in that capacity, they have examined the financial statements for the year ended December 31, 2016. The Auditors’ Report to the shareholders is presented herein.
SIGNED “DALE M. DUSTERHOFT”DALE M. DUSTERHOFTPRESIDENT & CHIEF EXECUTIVE OFFICER
SIGNED “MICHAEL A. BALDWIN”MICHAEL A. BALDWINSENIOR VICE PRESIDENT, FINANCE AND CHIEF FINANCIAL OFFICER
February 22, 2017
Trican Well Service Ltd.
MD&A Years Ended December 31, 2015 & 2016 | 39
KPMG LLP Telephone (403) 691-8000205 - 5th Avenue SW Fax (403) 691-8008Suite 3100, Bow Valley Square 2 www.kpmg.caCalgary AB T2P 4B9
INDEPENDENT AUDITORS' REPORT
To the Shareholders of Trican Well Service Ltd.
We have audited the accompanying consolidated financial statements of Trican Well Service Ltd., which comprise the consolidated statements of financial position as at December 31, 2016 and December 31, 2015, the consolidated statements of comprehensive loss, changes in equity and cash flows for the years then ended, and notes, comprising a summary of significant accounting policies and other explanatory information.
Management’s Responsibility for the Consolidated Financial StatementsManagement is responsible for the preparation and fair presentation of these consolidated financial statements in accordance with International Financial Reporting Standards, and for such internal control as management determines is necessary to enable the preparation of consolidated financial statements that are free from material misstatement, whether due to fraud or error.
Auditors’ ResponsibilityOur responsibility is to express an opinion on these consolidated financial statements based on our audits. We conducted our audits in accordance with Canadian generally accepted auditing standards. Those standards require that we comply with ethical requirements and plan and perform the audit to obtain reasonable assurance about whether the consolidated financial statements are free from material misstatement.
An audit involves performing procedures to obtain audit evidence about the amounts and disclosures in the consolidated financial statements. The procedures selected depend on our judgment, including the assessment of the risks of material misstatement of the consolidated financial statements, whether due to fraud or error. In making those risk assessments, we consider internal control relevant to the entity’s preparation and fair presentation of the consolidated financial statements in order to design audit procedures that are appropriate in the circumstances, but not for the purpose of expressing an opinion on the effectiveness of the entity’s internal control. An audit also includes evaluating the appropriateness of accounting policies used and the reasonableness of accounting estimates made by management, as well as evaluating the overall presentation of the consolidated financial statements.
We believe that the audit evidence we have obtained in our audits is sufficient and appropriate to provide a basis for our audit opinion.
OpinionIn our opinion, the consolidated financial statements present fairly, in all material respects, the consolidated financial position of Trican Well Service Ltd. as at December 31, 2016 and December 31, 2015, and its consolidated financial performance and its consolidated cash flows for the years then ended in accordance with International Financial Reporting Standards.
Chartered Professional AccountantsFebruary 22, 2017Calgary, Canada
KPMG LLP is a Canadian limited liability partnership and a member fi rm of the KPMG network of independent member fi rms affi liated with KPMG International Cooperative (“KPMG International”), a Swiss entity. KPMG Canada provides services to KPMG LLP.

Trican Well Service Ltd.
40 | MD&A Years Ended December 31, 2015 & 2016
CONSOLIDATED STATEMENTS OF FINANCIAL POSITION
(stated in thousands)As at December 31, 2016 2015ASSETSCurrent assets
Cash and cash equivalents (note 4) $20,254 $49,117
Trade and other receivables (note 5) 108,266 203,214
Current tax assets 16,345 1,088
Inventory (note 6) 26,426 153,786
Prepaid expenses 4,056 19,072
Currency derivatives (notes 18 and 21) - 17,890
Marketable securities (notes 3 and 18) 28,062 -
Assets held for sale (note 3) 8,667 7,092
212,076 451,259
Property and equipment (note 7) 432,401 826,300
Intangible assets (note 8) 213 29,100
Investments in Keane (note 18) 230,976 -
Currency derivative (notes 18 and 21) 17,479 19,298
Deferred tax assets (note 17) - 289
Other assets (note 9) 3,041 3,573
Goodwill (note 8) 19,251 19,251
$915,437 $1,349,070
LIABILITIES AND SHAREHOLDERS’ EQUITYCurrent liabilities
Trade and other payables (note 10) $87,956 $147,851
Current tax liabilities - 24
Current portion of loans and borrowings (note 11) 9,790 100,306
Liabilities held for sale (note 3) 279 -
98,025 248,181
Loans and borrowings (notes 11 and 21) 211,776 469,295
Deferred tax liabilities (note 17) 37,917 79,593
Shareholders’ equity
Share capital (note 12) 638,377 570,337
Contributed surplus 74,223 72,082
Accumulated other comprehensive income / (loss) (note 12) 40,652 65,985
Deficit (184,243) (154,709)
Total equity attributable to equity holders of the Company 569,009 553,695
Non-controlling interest (1,290) (1,694)
$915,437 $1,349,070
See accompanying notes to the consolidated financial statements.
SIGNED “DALE M. DUSTERHOFT”DALE M. DUSTERHOFTPRESIDENT & CHIEF EXECUTIVE OFFICER
SIGNED “KEVIN L. NUGENT”KEVIN L. NUGENTDIRECTOR

Trican Well Service Ltd.
MD&A Years Ended December 31, 2015 & 2016 | 41
CONSOLIDATED STATEMENTS OF COMPREHENSIVE LOSS
(stated in thousands, except per share amounts)
For the year ended December 31, 2016 2015
Continuing operationsRevenue $325,179 $649,735
Cost of sales (notes 6 and 15) 408,712 676,479
Gross loss (83,533) (26,744)
Administrative expenses (note 15) 56,667 31,960
Other (income) / expenses (2,130) (756)
Loss from operating activities (138,070) (57,948)
Finance income (68,325) (1,371)
Finance costs 26,016 43,000
Foreign exchange loss / (gain) (note 21) 3,058 (20,652)
Asset impairments (note 16) 5,135 4,996
Loss before income tax (103,954) (83,921)Income tax expense / (recovery) (note 17) (63,225) (21,140)
Loss from continuing operations ($40,729) ($62,781)
Discontinued operationsNet income / (loss) from discontinued operations, net of taxes (note 3) 11,401 (767,111)
Loss for the year ($29,328) ($829,892)
Other comprehensive gain / (loss) Unrealized gain / (loss) on hedging instruments (note 21) - (1,561)
Unrealized gain on equity interest in Keane, net of income tax expense (2016: $46,116; 2015: nil)
41,174 -
Foreign currency translation gain / (loss) 1,026 43,075
Reclassification of foreign currency translation (loss) / gain on substantial disposition or sale of foreign operations
(67,540) 50,924
Total comprehensive loss ($54,668) ($737,454)
(Loss)/ gain attributable to: Owners of the Company (29,534) (827,774)
Non-controlling interest 206 (2,118)
Loss for the year ($29,328) ($829,892)
Total comprehensive (loss) / income attributable to: Owners of the Company (54,874) (735,333)
Non-controlling interest 206 (2,118)
Total comprehensive loss ($54,668) ($737,451)
(Loss) / earnings per share - basic and diluted (note 13)
Continuing operations ($0.24) ($0.42)
Discontinued operations $0.06 ($5.14)
Net loss ($0.18) ($5.56)
Weighted average shares outstanding - basic and diluted 172,387 148,927
See accompanying notes to the consolidated financial statements.

Trican Well Service Ltd.
42 | MD&A Years Ended December 31, 2015 & 2016
CONSOLIDATED STATEMENTS OF CHANGES IN EQUITY
(Stated in thousands)
Share capital
Contributed surplus
Accumulated other
comprehensive (loss) / income
Retained earnings /
(deficit) Total
Non- Controlling
interestTotal
Equity
Balance at January 1, 2015 $571,050 $67,846 ($26,462) $672,846 $1,285,280 $947 $1,286,227
Loss for the year - - - (827,774) (827,774) (2,118) (829,892)
Foreign currency translation gain - - 43,084 - 43,084 (9) 43,075
Share-based payments transactions - 4,236 - - 4,236 - 4,236
Unrealized loss on cash flow hedge - - (1,561) - (1,561) - (1,561)
Shares cancelled under NCIB (713) - - (295) (1,008) - (1,008)
Acquisition of NCI without a change in control - - - 514 514 (514) -
Reclassification of foreign currency translation loss on disposition of Russian pressure pumping business (note 3)
- - 50,924 - 50,924 - 50,924
Balance at December 31, 2015 $570,337 $72,082 $65,985 ($154,709) $553,695 ($1,694) $552,001
Balance at January 1, 2016 $570,337 $72,082 $65,985 ($154,709) $553,695 ($1,694) $552,001(Loss) / income for the year - - - (29,534) (29,534) 206 (29,328)Foreign currency translation (loss) - - 1,033 - 1,033 (7) 1,026Share-based compensation expense - 2,809 - - 2,809 - 2,809Share options exercised 2,114 (668) - - 1,446 - 1,446Issuance of shares (net of issuance costs) 65,926 - - - 65,926 - 65,926Reduction of non-controlling interest in Colombia - - - - - 205 205Unrealized gain on equity interest in Keane 41,174 41,174 - 41,174Reclassification of foreign currency translation losses on substantial disposal of foreign operations (note 3)
- - (67,540) - (67,540) - (67,540)
Balance at December 31, 2016 $638,377 $74,223 $40,652 ($184,243) $569,009 ($1,290) $567,719
See accompanying notes to the consolidated financial statements.

Trican Well Service Ltd.
MD&A Years Ended December 31, 2015 & 2016 | 43
CONSOLIDATED STATEMENTS OF CASH FLOWS(Stated in thousands) 2016 2015Cash Provided By / (Used In):Operations Loss from continuing operations ($40,729) ($62,781) Charges to income not involving cash: Depreciation and amortization 70,439 74,725 Amortization of debt issuance costs 3,776 1,644 Stock-based compensation 2,809 4,237 Gain on disposal of property and equipment (1,767) 466 Net finance costs 24,989 41,629 Unrealized foreign exchange (gain) / loss (5,183) (20,652) Asset impairments 5,135 4,996 Unrealized (gain) / loss on marketable securities (3,069) - Unrealized gain on equity interest in Keane (65,206) - Income tax expense / (recovery) (63,225) (21,140) Change in inventories 10,099 17,615 Change in trade and other receivables 37,223 152,060 Change in prepaid expenses 1,782 (1,015) Change in trade and other payables 10,053 (74,761) Interest paid (22,444) (44,558) Income tax paid (1,856) (4,457) Continuing operations (37,174) 68,008 Discontinued operations (56,760) 51,824 Cash flow from operating activities (93,934) 119,832
Investing Proceeds from a loan to unrelated third party 1,246 4,730 Purchase of property and equipment (1,448) (17,137) Proceeds from the sale of property and equipment 8,356 8,884 Continuing operations 8,154 (3,523) Consideration on sale of discontinued operations 296,185 187,642 Discontinued operations 1,413 (4,680) Cash flow from investing activities 305,752 179,439
Financing Net proceeds from issuance of share capital 67,368 - Repurchase and cancellation of shares under NCIB - (1,008) (Repayment) / issuance of long-term debt, net of debt issuance costs (64,014) (169,071) Proceeds from currency derivatives 14,066 - Repayment of Senior Notes (257,251) (144,844) Dividend paid - (22,366) Cash flow from financing activities - continuing operations (239,831) (337,289)
Effect of exchange rate changes on cash (850) 4,712
(Decrease) / increase in cash and cash equivalents Continuing operations (268,851) (272,804) Discontinued operations 239,988 239,498Cash and cash equivalents, beginning of year 49,117 82,423Cash and cash equivalents, end of year $20,254 $49,117
See accompanying notes to the consolidated financial statements.

Trican Well Service Ltd.
44 | MD&A Years Ended December 31, 2015 & 2016
Page left intentionally blank

Trican Well Service Ltd.
MD&A Years Ended December 31, 2015 & 2016 | 45
NOTE 1 – NATURE OF BUSINESS, FUTURE OPERATIONS & BASIS OF PRESENTATION
Nature of BusinessTrican Well Service Ltd. (the “Company” or “Trican”) is an oilfield services company incorporated under the laws of the province of Alberta. These consolidated financial statements include the accounts of the Company and its subsidiaries, all of which are wholly owned, with the exception of Saudi Arabia, in which Trican has a 70% ownership, and Colombia, in which Trican has an 78% ownership (together referred to as the “Company”). The Company provides a comprehensive array of specialized products, equipment, services and technology for use in the drilling, completion, stimulation and reworking of oil and gas wells primarily through its continuing pressure pumping operations in Canada. At December 31, 2016, the Company also has a minority ownership interest of Keane Group Holdings, LLC (“Keane Holdings”) in the United States. Trican acquired its interest in Keane Holdings in conjunction with the sale of its US operation (see note 3).
The Company has presented the results of its pressure pumping operations in the United States (“U.S.”), Australia, Kazakhstan, Colombia, Algeria and Saudi Arabia, as discontinued operations. In addition, Trican presented the results of its completion tools businesses in Canada, the U.S., Russia, and Norway as discontinued operations (see note 3).
Future OperationsTrican anticipates that cash flow from operating activities and available credit facilities will provide the required resources to fund ongoing operating, investing and financing activities for the foreseeable future including the discharge of its existing liabilities and commitments and compliance with future financial covenants as specified in the amended terms of the applicable credit agreements (“Second 2016 Amended Credit Agreements”) with its bank lenders under its revolving credit facility (“RCF”) and the holders of its senior notes (“Senior Notes”).
For the fiscal years ended December 31, 2016 and December 31, 2015, the Company incurred net losses of $29.3 million and $829.9 million, respectively. Although the current economic climate has improved in the last six months, a negative change in the economy could lead to adverse changes in cash flow, working capital levels or long-term debt balances, which may also have a direct impact on our results and financial position.
Based on currently available information, we expect to comply with all covenants during 2017, however our estimated leverage and interest coverage ratios in the Second 2016 Amended Credit Agreements during the first half of 2017 are expected to be near the minimum amounts necessary to comply with the financial covenants. If the Company does not comply with the financial covenants, the RCF and Senior Notes may become due on demand. If future profitability or available liquidity is not sufficient to meet Trican’s operating and debt servicing obligations as they come due, management’s plans include reducing expenditures and pursuing additional asset dispositions or alternative financing arrangements.
Basis of PresentationThe consolidated financial statements have been prepared in accordance with International Financial Reporting Standards (IFRS), as issued by the International Accounting Standards Board (IASB).
The consolidated financial statements have been prepared on an historical costs basis except for financial instruments at fair value through profit or loss and liabilities for cash-settled share-based payment arrangements which are measured at fair value in the consolidated statement of financial position.
The consolidated financial statements are presented in Canadian dollars and have been rounded to the nearest thousands, except where indicated.
These consolidated financial statements were approved by the Board of Directors on February 22, 2017.
NOTES TO CONSOLIDATED FINANCIAL STATEMENTS for the years ended December 31, 2016 and 2015

Trican Well Service Ltd.
46 | MD&A Years Ended December 31, 2015 & 2016
Critical Accounting Estimates and JudgmentsThe preparation of these consolidated financial statements in accordance with IFRS requires management to make judgments and estimates that could materially affect the amounts recognized in the financial statements. By their nature, judgments and estimates may change in light of new facts and circumstances in the internal and external environment. The following judgments and estimates are those deemed by management to be material to the Company’s consolidated financial statements.
Judgments
Depreciation and AmortizationDepreciation and amortization methods are based on management’s judgment of the most appropriate method to reflect the pattern of an asset’s future economic benefit expected to be consumed by the Company. Among other factors, these judgments are based on industry standards and company-specific history and experience.
ImpairmentAssessment of impairment indicators is based on management’s judgment of whether there are internal and external factors that would indicate that a non-financial asset is impaired. The determination of a cash generating unit is also based on management’s judgment and is an assessment of the smallest group of assets that generate cash inflows independently of other assets.
Estimates
Investments in KeaneThe Company uses a discounted cash flow model to determine the fair value of the Investments in Keane. Inputs to the model are subject to various estimates relating to the timing and size of liquidity events, the price at which shares are sold, the discount rate and and volatility of the share price. Fair value inputs are subject to market factors as well as internal estimates. The Company uses a waterfall table to calculate estimated proceeds in accordance with the operating agreement between Trican Well Service Ltd. and Keane Group.
Assets Held for SaleAssets held for sale contains estimates that the property and equipment classified in this category meet the criteria as “assets held for sale”. As at the end of the reporting period
these assets are recorded at the lower of cost or fair value less cost to sell.
Allowance for Doubtful Accounts An allowance for doubtful accounts is recorded when there is objective evidence that the collection of the full amount is no longer probable under the terms of the original invoice. Impaired receivables are derecognized when they are assessed as uncollectible. Amounts estimated represent management’s best estimate of probability of collection of amounts from customers.
Impairment of Inventories The Company regularly reviews the nature and quantities of inventory on hand and evaluates the net realizable value of items based on historical usage patterns, known changes to equipment or processes and customer demand for specific products. Significant or unanticipated changes in business conditions could impact the magnitude and timing of impairment recognized.
Depreciation and AmortizationDepreciation and amortization are calculated to write off the cost, less estimated residual value, of assets on a systematic and rational basis over their expected useful lives. Estimates of residual value and useful lives are based on data and information from various sources including industry practice and historic experience. Expected useful lives and residual values are reviewed annually for any change to estimates and assumptions. Although management believes the estimated useful lives of the Company’s property and equipment are reasonable, it is possible that changes in estimates could occur, which may affect the expected useful lives and salvage values of the property and equipment.
Income Taxes
Deferred tax assets and liabilities contain estimates about the nature and timing of future permanent and temporary differences as well as the future tax rates that will apply to those differences. Changes in Canadian and foreign tax laws and rates as well as changes to the expected timing of reversals may have a significant impact on the amounts recorded for deferred tax assets and liabilities. Management closely monitors current and potential changes to Canadian and foreign tax law and bases its estimates on the best available information at each reporting date.

Trican Well Service Ltd.
MD&A Years Ended December 31, 2015 & 2016 | 47
Fair Value of Equity-Settled Share-Based Payments
The Company uses an option pricing model to determine the fair value of equity-settled share-based payments. Inputs to the model are subject to various estimates relating to volatility, interest rates, dividend yields and expected life of the units issued. Fair value inputs are subject to market factors as well as internal estimates. The Company considers historic trends together with any new information to determine the best estimate of fair value at the date of grant.
Impairment of Non-Financial AssetsIn determining the recoverable amount of assets subject to impairment testing, the Company measures the recoverable amount of non-financial assets as the higher of a fair value less costs of disposal and its value in use. Recoverable amounts of the non-financial assets are evaluated and calculated using various factors and assumptions. The factors and assumptions used in the estimates are assessed for reasonableness based on the information available at the time the estimates are prepared. As circumstances change and new information becomes available, the estimates could change.
NOTE 2 - SIGNIFICANT ACCOUNTING POLICIES
The following is a summary of significant accounting policies used in the preparation of these consolidated financial statements.
Consolidation
Subsidiaries are entities controlled by the Company. The financial results of subsidiaries are included in the consolidated financial statements from the date that control commences until the date that control ceases. All inter-company balances and transactions have been eliminated on consolidation.
Transaction costs, other than those associated with the issuance of debt or equity securities, that the Company incurs in connection with a business combination are expensed as incurred.
Non-controlling interests in subsidiaries are identified separately from the Company’s equity therein. The interests of non-controlling shareholders may be initially measured either at fair value or at the non-controlling interests’ proportionate share of the fair value of the acquiree’s identifiable net assets.
The choice of measurement basis is made on an acquisition-by-acquisition basis. Subsequent to acquisition, the carrying amount of non-controlling interests is the amount of those interests at initial recognition plus the non-controlling interests’ share of subsequent changes in equity. Total comprehensive income is attributed to non-controlling interests even if this results in the non-controlling interests having a deficit balance. Acquisitions of non-controlling interests are accounted for as transactions with equity holders in their capacity as equity holders and therefore no goodwill is recognized as a result of such transactions.
Cash and Cash Equivalents The Company’s short-term deposits with original maturities of three months or less are considered to be cash equivalents and are recorded at cost, which approximates fair value. Bank overdrafts that are repayable on demand and form an integral part of the Company’s cash management are included as a component of cash and cash equivalents for the purpose of the statement of cash flows.
InventoryInventory is measured at the lower of cost and net realizable value. The cost of inventory is determined using the standard cost method which are valued using the weighted average cost. Spare parts are valued at weighted average cost. Inventory balances include all costs of purchase, costs of conversion and other costs incurred in bringing the inventory to its existing location and condition.
Net realizable value is the estimated selling prices in the ordinary course of business, less estimated costs of completion and selling expenses.
Inventories are written down to net realizable when the cost of inventories is estimated to be unrecoverable due to obsolescence, damage, slow moving or declining selling prices. When circumstances that previously caused inventories to be written down below cost no longer exist or when there is clear evidence of an increase in selling prices, the amount of the write down previously recorded is reversed.
Property and EquipmentProperty and equipment are stated at cost less accumulated depreciation and accumulated impairment losses. Cost includes expenditures that are directly attributable to the

Trican Well Service Ltd.
48 | MD&A Years Ended December 31, 2015 & 2016
Buildings and improvements 20 years
Equipment 2 to 10 years
Furniture and fixtures 2 to 10 years
acquisition of the asset, and subsequent expenditures to the extent that they can be measured and future economic benefit is probable. The carrying values of replaced parts are derecognized when they are replaced. The cost of replacing a part of an item of property and equipment is recognized in the carrying amount of the item if it is probable that the future economic benefits embodied within the part will flow to the Company, and its cost can be measured reliably. Repairs and maintenance expenditures, which do not extend the useful life of the property and equipment, are expensed in the period in which they are incurred.
Management bases the estimate of the useful life and salvage value of property and equipment, with the exception of land which is not depreciated, on expected utilization, technological change and effectiveness of maintenance programs. When parts of an item of property or equipment have different useful lives, they are accounted for as separate items (major components) of property and equipment.
Depreciation is recognized in profit or loss on a straight-line basis over the estimated useful lives of each part of an item of property and equipment, since this most closely reflects the expected pattern of consumption of the future economic benefits embodied in the asset.
Gains and losses on disposal of an item of property and equipment are determined by comparing the proceeds from disposal with the carrying amount of property and equipment, and are recognized net within other income in profit or loss.
Capitalized leased assets are depreciated over the shorter of the lease term and their useful lives unless it is expected that the Company will obtain ownership by the end of the lease term.
Depreciation is calculated using the straight-line method over the estimated useful life less residual value of the asset as follows:
Costs related to assets under construction are capitalized when incurred. These assets are not depreciated until they are complete and available for use in the manner intended by management. When this occurs, the asset is transferred to property, plant and equipment and classified by the nature of the asset.
Impairment of Non-Financial Assets
The carrying amounts of the Company’s non-financial assets except inventory, prepaid expenses and deferred tax assets are reviewed at each reporting date to determine whether there is an indicator of impairment. If any such indication exists, then the asset’s recoverable amount is estimated. The recoverable amount of goodwill is estimated yearly in the fourth quarter, or more frequently, if triggers are identified.
The recoverable amount of an asset or cash generating unit (CGU) is the greater of its value in use and its fair value less costs of disposal. In assessing value in use, the estimated future cash flows are discounted to their present value using a weighted average cost of capital that reflects current market assessments of the time value of money and the risks specific to the asset. In assessing fair value less costs to sell, recent market transactions are taken into account, if available. If no such transactions can be identified, an appropriate valuation model is used.
An impairment loss is recognized if the carrying amount of an asset or CGU exceeds its estimated recoverable amount. Impairment losses are recognized in profit or loss. Impairment losses recognized in respect of CGUs are allocated first to reduce the carrying amount of goodwill allocated to the CGUs, and then to reduce the carrying amounts of the other assets in the CGU on a pro rata basis.
Impairment losses recognized in prior periods are assessed at each reporting date for any indication of reversal. An impairment loss is reversed only to the extent that the asset’s carrying amount does not exceed the carrying amount that would have been determined, net of depreciation or amortization, if no impairment loss had been recognized.
GoodwillThe Company measures goodwill as the fair value of the consideration transferred upon an acquisition, including
Depreciation methods, useful lives and residual values are reviewed each financial year end and adjusted if appropriate.

Trican Well Service Ltd.
MD&A Years Ended December 31, 2015 & 2016 | 49
the recognized amount of any non-controlling interest in the acquiree, less the net recognized amount (generally fair value) of the identifiable assets acquired and liabilities assumed, all measured as of the acquisition date.
Goodwill is allocated to the Company’s cash generating units that are expected to benefit from the synergies of the business combination. Goodwill is not amortized, but is tested for impairment annually or more frequently in the event that a trigger is identified. An impairment loss in respect of goodwill is not reversed.
Intangible AssetsNon-compete agreements relate to the Company’s acquisitions and are recorded at their estimated fair value on the acquisition date and amortized on a straight line basis over 8 years.
Patents and know-how relate to the Company’s acquisitions and are recorded at their estimated fair value on the acquisition date and amortized on a straight line basis over 10 years.
The coal bed methane process (“CBM Process”) relates to an acquisition by the Company and was recorded at the estimated fair value on the acquisition date and amortized on a straight line basis over 10 years.
All amortization of intangible assets is charged to cost of sales in the consolidated statement of comprehensive income.
Financial Instruments
Non-Derivative Financial Assets
The Company initially recognizes loans and receivables on the date that they are originated. All other financial assets are recognized initially on the trade date at which the Company becomes a party to the contractual provisions of the instrument.
The Company derecognizes a financial asset when the contractual rights to the cash flows from the asset expire, or it transfers the rights to receive the contractual cash flows on the financial asset in a transaction in which substantially all the risks and rewards of ownership of the financial asset are transferred. Any interest in transferred financial assets that is created or retained by the Company is recognized as a separate asset or liability.
Loans and Receivables
Loans and receivables are financial assets with fixed or determinable payments that are not quoted in an active market. Such assets are recognized initially at fair value plus any directly attributable transaction costs. Subsequent to initial recognition, loans and receivables are measured at amortized cost using the effective interest rate method less any impairment losses.
Loans and receivables comprise trade and other receivables and the loan to an unrelated third party.
Cash and Cash Equivalents
Cash and cash equivalents comprise cash balances and short-term deposits with original maturities of three months or less.
Impairment of Financial Assets
The carrying amount of the Company’s financial assets includes cash and cash equivalents, trade and other receivables, and a loan to an unrelated third party reported within other assets on the consolidated statement of financial position. A financial asset is impaired if there is objective evidence of impairment as a result of one or more events that occurred after the initial recognition of the asset, and that loss event had an impact on the estimated future cash flow resulting from that asset.
Evidence of impairment would include default or delinquency by a debtor, restructuring of an amount due to the Company on terms that the Company would not consider otherwise, indications that a debtor will enter bankruptcy, adverse changes in the payment status of borrowers or economic conditions that correlate with defaults.
The Company evaluates impairment for financial assets measured at amortized cost at both a specific asset and collective level. All individually significant assets are assessed for specific impairment annually. Assets that are not individually significant are collectively assessed for impairment by grouping together assets with similar risk profiles.
Impairment is assessed using historical trends of default, timing of recoveries and the amount of loss incurred, adjusted for management’s judgment in relation to how the current economic and credit environment will impact losses being greater or less than historical trends.

Trican Well Service Ltd.
50 | MD&A Years Ended December 31, 2015 & 2016
An impairment loss is determined as the difference between an assets’ carrying amount and the present value of future cash flows. Losses are recognized in profit or loss and reflected in a provision account against loans and receivables. When an event occurring after the impairment was recognized causes the amount of impairment to decrease, the recovery is reversed through profit and loss.
Non-Derivative Financial Liabilities
Financial liabilities are recognized initially on the trade date at which the Company becomes a party to the contractual provisions of the instrument. Such financial liabilities are recognized initially at fair value plus any directly attributable transaction costs. Subsequent to initial recognition these financial liabilities are measured at amortized cost using the effective interest rate method. Transaction costs related to the issuance of any long term debt are netted against the carrying value of the associated long term debt and amortized as part of financing costs over the life of the debt using the effective interest rate method.
The Company derecognizes a financial liability when its contractual obligations are discharged, cancelled or expire.
The Company has the following non-derivative financial liabilities: loans and borrowings, and trade and other payables.
Financial assets and liabilities are offset and the net amount presented in the statement of financial position when, and only when, the Company has a legal right to offset the amounts and intends either to settle on a net basis or to realize the asset and settle the liability simultaneously.
Derivative Financial Instruments, Including Hedge Accounting
The Company holds derivative financial instruments to manage its exposure to the risk associated with fluctuations in foreign exchange and interest rates.
Prior to October 1, 2015, the Company had designated all cross currency swap agreements as cash flow hedges. The Company formally documents all relationships between hedging instruments and hedged items, as well as the risk management objective and strategy for undertaking the hedge transaction. This process includes linking all derivatives that are designated in a cash flow hedging relationship to a specific firm commitment or forecasted transaction. The Company also
formally assesses both, at inception and at each reporting date, whether derivatives used in hedging transactions have been highly effective in offsetting changes in cash flows of hedged items and whether those derivatives may be expected to remain highly effective in future periods.
The Company calculates the fair value of the derivative financial instruments using market forward rates reflecting the remaining term of the hedges at each reporting period. Under cash flow hedge accounting, the effective portion of the change in the fair value of the hedging instrument is recognized in other comprehensive income (OCI) and presented within shareholders’ equity in accumulated other comprehensive income. The ineffective portion of the change in fair value is recognized in profit and loss. Upon maturity of the derivative financial instrument, the effective gains and losses previously accumulated in OCI within shareholders’ equity are recorded in profit and loss.
Prior to October 1, 2015, the Company utilized foreign denominated long-term debt to hedge its exposure to changes in the carrying values of the Company’s net investment in certain foreign operations as a result of changes in foreign exchange rates.
Under the accounting for cash flow hedges of a net investment in foreign operations, the foreign denominated long-term debt must be designated and documented as a hedge, and must be effective at inception and on an ongoing basis. The documentation defines the relationship between the foreign denominated long-term debt and the net investment in the foreign operations. The Company formally assesses, both at inception and on an ongoing basis, whether the changes in fair value of the foreign denominated long-term debt is highly effective in offsetting changes in fair value of the net investment in the foreign operations. The portion of gains or losses on the hedging item that is determined to be an effective hedge is recognized in OCI, net of tax and is limited to the translation gain or loss on the net investment, while the ineffective portion is recorded in earnings.
If the hedging instrument no longer meets the criteria for hedge accounting, expires or is sold, terminated or exercised, or the designation is revoked, then hedge accounting is discontinued prospectively. If the forecast transaction is no longer expected to occur, then the balance in shareholders’ equity is reclassified in profit or loss.

Trican Well Service Ltd.
MD&A Years Ended December 31, 2015 & 2016 | 51
Financial Instruments - Available for Sale
The Company obtained 10% of the Class A shares in Keane (“Equity Interest in Keane”) in Keane Group Holdings, LLC (“Keane”) on the close of the sale of its U.S. pressure pumping business (note 3). These securities were initially recognized at fair value. Subsequent changes in the fair value are recognized through Other Comprehensive Income (OCI).
Financial Instruments - Fair Value Through Profit and Loss
The Company obtained 100% of the Class C shares (“Profits Interest in Keane”) which has been categorized as a derivative asset (note 3). All financial derivative instruments are initially recognized at fair value. Subsequent changes in the fair value are recognized through profit or loss.
The Company also obtained 558,221 National Oilwell Varco, Inc. (“NOV”) shares on the close of the sale of its completion business. These marketable securities were initially recognized at fair value. Subsequent changes in the fair value are recognized through profit or loss.
Share Capital
Common shares are classified as equity. Incremental costs directly attributable to the issue of common shares are recognized as a deduction from equity, net of any tax effects.
Provisions
A provision is recognized if, as a result of a past event, the Company has a present legal or constructive obligation that can be reliably measured, and it is probable that an outflow of economic benefits will be required to settle the obligation.
Revenue Recognition
The Company’s revenue comprises services and other revenue and is sold based on fixed or agreed upon priced purchase orders or contracts with the customer. Service and other revenue is recognized when the services are provided and collectability is reasonably assured. Customer contract terms do not include provisions for significant post-service delivery obligations.
Finance Income and Finance Costs
Finance income is made up of interest income on funds invested along with any fair value gains on financial assets at fair value through profit or loss. Interest income is recognized as it is earned in profit or loss.
Finance costs are made up of amortization of debt issue costs, interest expense on borrowings, fair value losses on financial liabilities through profit or loss, and impairment losses recognized on financial assets (other than trade receivables).
Borrowing costs that are not directly attributable to the acquisition, construction or production of a qualifying asset are recognized in profit or loss using the effective interest method.
Income Taxes
The Company uses the liability method of accounting for income taxes. Under the liability method, deferred income tax assets and liabilities are recognized as the difference between the carrying amounts of assets and liabilities and their respective income tax basis (temporary differences). A deferred tax asset may also be recognized for the benefit expected from unused tax losses available for carry forward, to the extent that it is probable that future taxable earnings will be available against which the tax losses can be applied.
Deferred income tax assets and liabilities are measured based on income tax rates and tax laws that are enacted or substantively enacted by the end of the reporting period and that are expected to apply in the years in which temporary differences are expected to be realized or settled. Deferred income tax assets are reviewed at each reporting period and are reduced to the extent that it is no longer probable that the related tax benefit will be realized.
Tax interpretations, regulations and legislation in the various jurisdictions in which the Company and its subsidiaries operate are subject to change. As such, income taxes are subject to measurement uncertainty and the interpretations can impact net earnings through the income tax expense arising from changes in deferred income tax assets or liabilities.
Foreign Currency Translation and Transactions
For entities whose functional currency is the Canadian dollar, the Company translates monetary assets and liabilities at period-end exchange rates, and non-monetary items are
Trican Well Service Ltd.
52 | MD&A Years Ended December 31, 2015 & 2016
translated at historical rates. Income and expense accounts are translated at the average rates in effect during the period. Gains or losses from changes in exchange rates are recognized in the profit or loss in the period of occurrence. Foreign exchange gains or losses arising from a monetary item receivable from or payable to a foreign operation, the settlement of which is neither planned nor likely to occur in the foreseeable future and which in substance is considered to form part of the net investment in the foreign operation, are recognized in other comprehensive income in the cumulative amount of foreign currency translation differences.
For foreign entities whose functional currency is not the Canadian dollar, the Company translates assets, including goodwill, and liabilities at period-end rates and income and expense accounts at average exchange rates. Adjustments resulting from these translations are reflected in the Consolidated Statements of Other Comprehensive Income as unrealized gains or losses as foreign currency translation differences.
When a foreign operation is substantially disposed of, the cumulative amount of foreign currency gains or losses are reclassified to profit or loss. On the partial disposal of a subsidiary that includes a foreign operation, the relevant proportion of such cumulative amount is re-attributed to non-controlling interest.
Employee Benefits
Short- Term Employee BenefitsShort-term employee benefit obligations are measured on an undiscounted basis and are expensed as the related service is provided. A liability is recognized for the amount expected to be paid under short-term cash bonuses or profit sharing plans if the Company has a present legal or constructive obligation to pay this amount as a result of past service provided by the employee, and the obligation can be reliably estimated.
Share-Based Payment TransactionsThe Company has an equity-settled share option plan and accounts for share options by expensing the fair value of share options measured using a Black Scholes option pricing model. The fair value of the share options is determined on their grant date and is recognized in administrative expense and in shareholders’ equity over the vesting period.
The Company has a cash-settled deferred share unit (DSU) plan for its Directors. The DSUs vest immediately and the fair value of the liability and the corresponding expense is charged to profit or loss at the grant date. Subsequently, at each reporting date between grant date and settlement date, the fair value of the liability is re-measured with any changes in fair value recognized in profit or loss for the period.
The Company has a cash-settled restricted share unit (RSU) plan for its employees and the fair value of the RSUs is expensed into profit and loss evenly over the unit vesting period. At each reporting date between grant date and settlement, the fair value of the liability is re-measured with any changes in fair value recognized in profit or loss for the period.
The Company has a cash-settled performance share unit plan (PSU Plan) for Executive Officers of the Company. Under the terms of the PSU Plan, performance share units (PSUs) granted thereunder vest when certain performance conditions are met and expire on a date no later than December 31 of the third calendar year following the calendar year in which the grant occurs. Management makes an assessment for each grant of PSUs with respect to the timing and likelihood of vesting of such PSUs. Upon vesting, it is the intention of the Board of Directors to settle PSUs currently outstanding in cash. The fair value of the PSUs is expensed over the vesting period until it is estimated that the vesting conditions will be met, at which time the full value of the liability is recognized and then revalued each period to fair value until paid.
Earnings (Loss) per Share
Basic earnings (loss) per share are calculated using the weighted average number of common shares outstanding during the period. Diluted earnings per share is calculated based on the weighted average number of shares issued and outstanding during the year, adjusted by the total of the additional common shares that would have been issued assuming exercise of all dilutive share options.
Operating Segments
In the first quarter 2016, management reviewed the remaining continuing operations using the criteria stated in IFRS 8 Operating Segments due to various divestitures and closures of international operations. Management determined that the Company has one reportable segment based on the operating results of business activities with

Trican Well Service Ltd.
MD&A Years Ended December 31, 2015 & 2016 | 53
discrete financial information that is reviewed by the Company’s chief operating decision makers for the purpose of resource allocation and assessing performance. The results of discontinued operations are presented in Note 3.
Leased AssetsLeases for which the Company assumes substantially all the risks and rewards of ownership are classified as finance leases. Upon initial recognition the leased asset is measured at an amount equal to the lower of its fair value and the present value of the minimum lease payments. Subsequent to initial recognition, the asset is accounted for in accordance with the accounting policy applicable to that asset. Minimum lease payments made under finance leases are apportioned between the finance expense and the reduction of the outstanding liability. The finance expense is allocated to each period during the lease term so as to produce a constant periodic rate of interest on the remaining balance of the liability. Other leases are operating leases and are not recognized in the Company’s statement of financial position. Payments made under operating leases are recognized in profit or loss on a straight-line basis over the term of the lease.
New Standards and Interpretations Not Yet Adopted
A number of new standards and amendments to standards and interpretations are not yet effective for the year ended December 31, 2016, and have not been applied in preparing these consolidated financial statements.
In July, 2014 the IASB issued the complete IFRS 9, Financial Instruments, (IFRS 9 (2014)). Under the new standard financial assets are classified and measured based on the business model in which they are held and the characteristics of their contractual cash flows. It also amends the impairment model by introducing a new ‘expected credit loss’ model for calculating impairment. Further, IFRS 9 (2014) includes a new general hedge standard that is better aligned with companies’ risk management, expands the scope of the hedging strategies, and introduces more judgement to assess the effectiveness of the hedge relationship. The amendments to IFRS 9 (2014) are effective for annual periods beginning or after January 1, 2018, and are available for early adoption. The Company expects IFRS 9 will impact the Company’s current policies and
procedures regarding provisions on trade receivables. Trade receivables are recorded at its original invoice less any amounts estimated to be uncollectable. Under IFRS 9, the expected loss impairment model replaces the current incurred loss model and is based on forward looking approach which includes earlier recognition of losses. Given the short term nature of these receivables, the Company does not anticipate these changes to have a material financial impact. IFRS 9 also contains a new model to be used for hedge accounting. The Company does not currently apply hedge accounting.
IFRS 15, Revenue from Contracts with Customers, was issued on May 28, 2014. The Standard contains a single model that applies to contracts with customers and two approaches to recognising revenue: at a point in time or over time. The model features a contract-based five-step analysis of transactions to determine whether, how much and when revenue is recognized. New estimates and judgmental thresholds have been introduced, which may affect the amount and/or timing of revenue recognized. The Standard replaces IAS 11, Construction Contracts, IAS 18, Revenue, IFRIC 13, Customer Loyalty Programmes, IFRIC 15, Agreements for the Construction of Real Estate, IFRIC 18, Transfer of Assets from Customers, and SIC 31, Revenue – Barter Transactions Involving Advertising Services. The new standard is effective for annual periods beginning on or after January 1, 2018. Early adoption is also permitted. The Company is currently in the process of reviewing its revenue streams to determine the impact, if any, that the adoption of IFRS 15 will have on its financial statements, as well as the impact that adoption of the standard will have on disclosure.
IASB issued IFRS 16, Leases, in January 2016. The new standard replaces IAS 17, Leases. It is in effect for accounting periods beginning on or after January 1, 2019. Early adoption is permitted only if the Company has adopted IFRS 15, Revenue from Contracts with Customers. Under the new standard, more leases will come on-balance sheet for lessees, with the exception of leases with a term not greater than 12 months and “small value” leases. Lease accounting for lessors remains substantially the same as existing guidance. In 2017, the Company will complete an assessment documenting the potential impacts of IFRS 16 on its consolidated financial statements.

Trican Well Service Ltd.
54 | MD&A Years Ended December 31, 2015 & 2016
Cash consideration $264,520
Fair value of the equity interest in Keane 75,022
Fair value of profits interest in Keane 3,459
Total consideration received 343,001
Less net assets and liabilities sold:
Working capital 69,272
Property and equipment 275,740
Net assets sold 345,012
Transaction costs 8,439
Loss on disposition of U.S. business ($10,450)
The Company’s initial assessments on the IFRS 9, IFRS 15, and IFRS 16 are based on work completed to date and may be subject to change as the assessments continue.
NOTE 3 - DISPOSITIONS, ASSETS HELD FOR SALE AND DISCONTINUED OPERATIONS
Sale of U.S. Pressure Pumping Business
On March 16, 2016, the Company closed the sale of its U.S. pressure pumping business to Keane Group Holdings, LLC (“Keane Holdings”). The U.S. business was sold for $264.5 million (USD $200.0 million) in cash, 10% of Keane’s Class A shares (the Equity Interest in Keane), 100% of Keane’s Class C shares (the Profits Interest in Keane), and working capital adjustments of $4.9 million. As a result of this transaction, a foreign currency translation gain of $75.0 million was reclassified from accumulated other comprehensive income (“AOCI”) to profit and losses in the period.
Sale of Completion Tools Business
On July 13, 2016, Trican closed its agreement with certain subsidiaries of NOV for the sale of its completion tools business with operations in Russia, Norway, the United States and Canada for aggregate gross proceeds of $53.5 million. The cash consideration received on closing by Trican consisted of $30 million adjusted for working capital estimates of $1.3 million with the final working capital amounts to be determined in the first quarter of 2017. The fair value of the share consideration received on closing totaled $24.3 million, consisting of 558,221 NOV shares. Trican used the net cash proceeds from the transaction to reduce its debt. As a result of this transaction, a foreign
currency translation loss of $0.1 million was reclassified from AOCI to profit and losses in the period.
Cash consideration $28,666
Fair value of the marketable securities 24,319
Total consideration received 52,985
Less assets and liabilities sold:
Inventory 41,005
Other working capital 5,026
Property and equipment 6,005
Intangible assets 1,539
Net assets sold 53,575
Transaction costs 811
Loss on disposition of Completion Tools Business ($1,401)
An impairment loss of $26.4 million on the carrying amount of intangible assets was recorded in the second quarter of 2016 as a result of measuring the assets held for sale at the lower of cost and fair value less cost of disposal. The fair value less cost of disposal was determined using the estimated consideration for the sale at June 30, 2016. This charge was recorded in the Company’s completion tools business in discontinued operations.
Sale of the Kazakhstan Business
On September 1, 2016, the Company closed the sale of its Kazakhstan pressure pumping business to Petro Welt Technologies. The Kazakhstan business was sold for $3.0 million in cash. The gain on disposition of the net assets was $0.3 million. As a result of this transaction, a foreign currency translation loss of $4.6 million was reclassified from AOCI to profit and losses in the period.
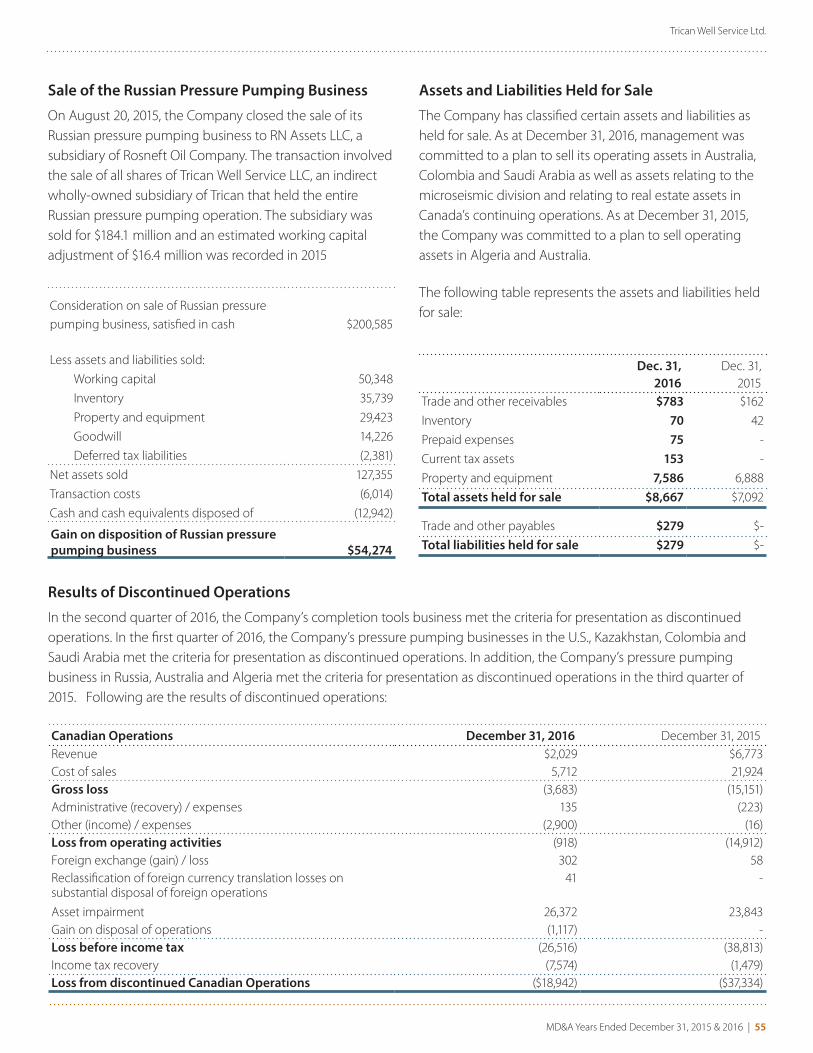
Trican Well Service Ltd.
MD&A Years Ended December 31, 2015 & 2016 | 55
Sale of the Russian Pressure Pumping Business
On August 20, 2015, the Company closed the sale of its Russian pressure pumping business to RN Assets LLC, a subsidiary of Rosneft Oil Company. The transaction involved the sale of all shares of Trican Well Service LLC, an indirect wholly-owned subsidiary of Trican that held the entire Russian pressure pumping operation. The subsidiary was sold for $184.1 million and an estimated working capital adjustment of $16.4 million was recorded in 2015
Consideration on sale of Russian pressure pumping business, satisfied in cash $200,585
Less assets and liabilities sold:
Working capital 50,348
Inventory 35,739
Property and equipment 29,423
Goodwill 14,226
Deferred tax liabilities (2,381)
Net assets sold 127,355
Transaction costs (6,014)
Cash and cash equivalents disposed of (12,942)
Gain on disposition of Russian pressure pumping business $54,274
Dec. 31, 2016
Dec. 31, 2015
Trade and other receivables $783 $162
Inventory 70 42
Prepaid expenses 75 -
Current tax assets 153 -
Property and equipment 7,586 6,888
Total assets held for sale $8,667 $7,092
Trade and other payables $279 $-
Total liabilities held for sale $279 $-
Assets and Liabilities Held for Sale
The Company has classified certain assets and liabilities as held for sale. As at December 31, 2016, management was committed to a plan to sell its operating assets in Australia, Colombia and Saudi Arabia as well as assets relating to the microseismic division and relating to real estate assets in Canada’s continuing operations. As at December 31, 2015, the Company was committed to a plan to sell operating assets in Algeria and Australia.
The following table represents the assets and liabilities held for sale:
Canadian Operations December 31, 2016 December 31, 2015Revenue $2,029 $6,773Cost of sales 5,712 21,924Gross loss (3,683) (15,151)Administrative (recovery) / expenses 135 (223)Other (income) / expenses (2,900) (16)Loss from operating activities (918) (14,912)Foreign exchange (gain) / loss 302 58Reclassification of foreign currency translation losses on substantial disposal of foreign operations
41 -
Asset impairment 26,372 23,843Gain on disposal of operations (1,117) -Loss before income tax (26,516) (38,813)Income tax recovery (7,574) (1,479)Loss from discontinued Canadian Operations ($18,942) ($37,334)
Results of Discontinued Operations
In the second quarter of 2016, the Company’s completion tools business met the criteria for presentation as discontinued operations. In the first quarter of 2016, the Company’s pressure pumping businesses in the U.S., Kazakhstan, Colombia and Saudi Arabia met the criteria for presentation as discontinued operations. In addition, the Company’s pressure pumping business in Russia, Australia and Algeria met the criteria for presentation as discontinued operations in the third quarter of 2015. Following are the results of discontinued operations:
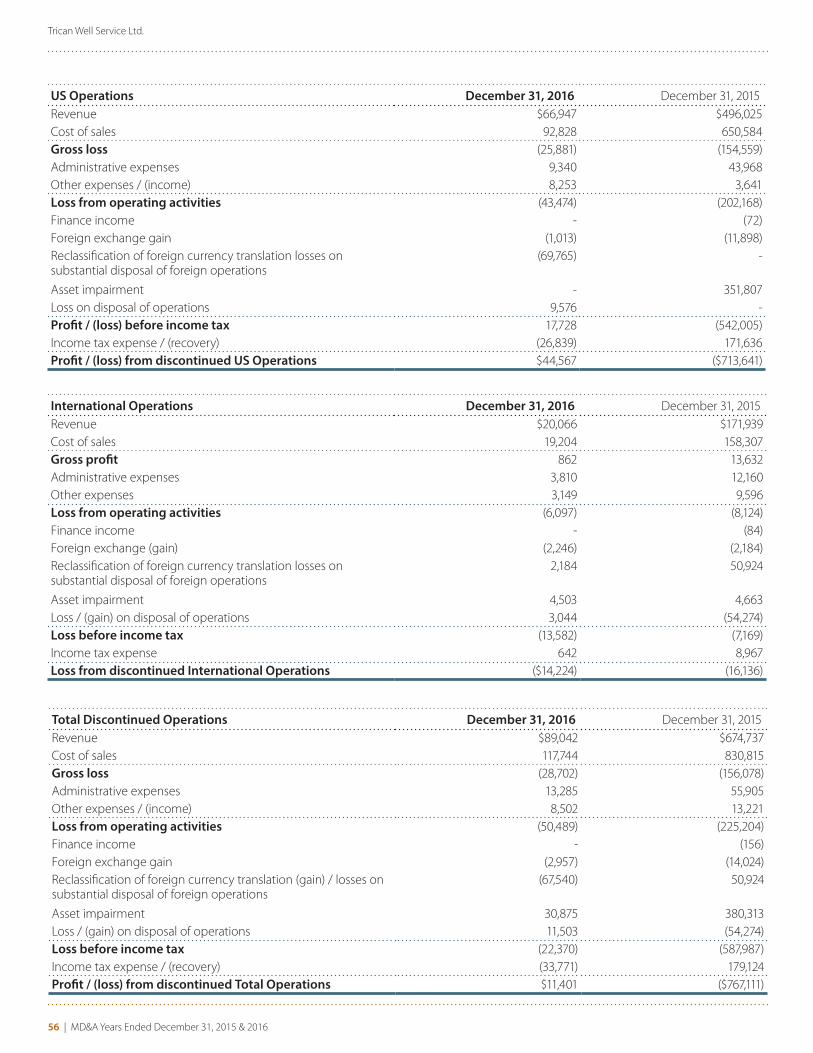
Trican Well Service Ltd.
56 | MD&A Years Ended December 31, 2015 & 2016
US Operations December 31, 2016 December 31, 2015Revenue $66,947 $496,025Cost of sales 92,828 650,584Gross loss (25,881) (154,559)Administrative expenses 9,340 43,968Other expenses / (income) 8,253 3,641Loss from operating activities (43,474) (202,168)Finance income - (72)Foreign exchange gain (1,013) (11,898)Reclassification of foreign currency translation losses on substantial disposal of foreign operations
(69,765) -
Asset impairment - 351,807Loss on disposal of operations 9,576 -Profit / (loss) before income tax 17,728 (542,005)Income tax expense / (recovery) (26,839) 171,636Profit / (loss) from discontinued US Operations $44,567 ($713,641)
International Operations December 31, 2016 December 31, 2015Revenue $20,066 $171,939Cost of sales 19,204 158,307Gross profit 862 13,632Administrative expenses 3,810 12,160Other expenses 3,149 9,596Loss from operating activities (6,097) (8,124)Finance income - (84)Foreign exchange (gain) (2,246) (2,184)Reclassification of foreign currency translation losses on substantial disposal of foreign operations
2,184 50,924
Asset impairment 4,503 4,663Loss / (gain) on disposal of operations 3,044 (54,274)Loss before income tax (13,582) (7,169)Income tax expense 642 8,967Loss from discontinued International Operations ($14,224) (16,136)
Total Discontinued Operations December 31, 2016 December 31, 2015Revenue $89,042 $674,737Cost of sales 117,744 830,815Gross loss (28,702) (156,078)Administrative expenses 13,285 55,905Other expenses / (income) 8,502 13,221Loss from operating activities (50,489) (225,204)Finance income - (156)Foreign exchange gain (2,957) (14,024)Reclassification of foreign currency translation (gain) / losses on substantial disposal of foreign operations
(67,540) 50,924
Asset impairment 30,875 380,313Loss / (gain) on disposal of operations 11,503 (54,274)Loss before income tax (22,370) (587,987)Income tax expense / (recovery) (33,771) 179,124Profit / (loss) from discontinued Total Operations $11,401 ($767,111)
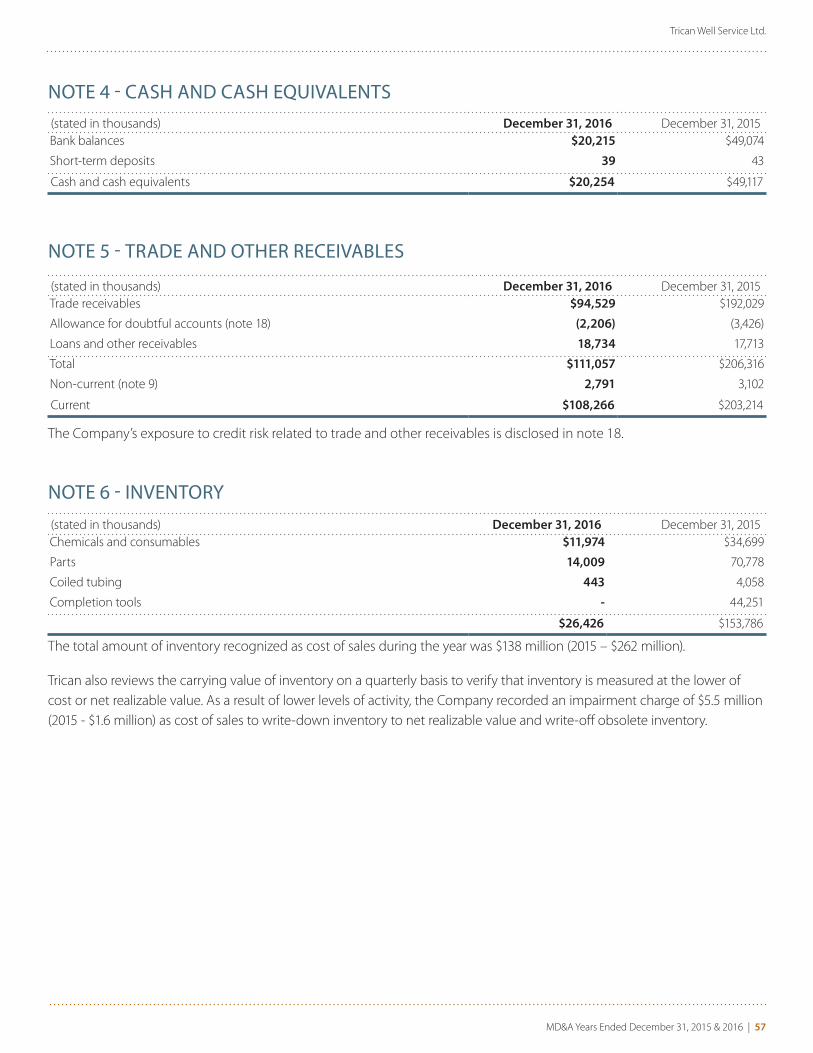
Trican Well Service Ltd.
MD&A Years Ended December 31, 2015 & 2016 | 57
NOTE 4 - CASH AND CASH EQUIVALENTS(stated in thousands) December 31, 2016 December 31, 2015Bank balances $20,215 $49,074
Short-term deposits 39 43
Cash and cash equivalents $20,254 $49,117
NOTE 6 - INVENTORY
(stated in thousands) December 31, 2016 December 31, 2015Chemicals and consumables $11,974 $34,699
Parts 14,009 70,778
Coiled tubing 443 4,058
Completion tools - 44,251
$26,426 $153,786
The total amount of inventory recognized as cost of sales during the year was $138 million (2015 – $262 million).
Trican also reviews the carrying value of inventory on a quarterly basis to verify that inventory is measured at the lower of cost or net realizable value. As a result of lower levels of activity, the Company recorded an impairment charge of $5.5 million (2015 - $1.6 million) as cost of sales to write-down inventory to net realizable value and write-off obsolete inventory.
NOTE 5 - TRADE AND OTHER RECEIVABLES
(stated in thousands) December 31, 2016 December 31, 2015Trade receivables $94,529 $192,029
Allowance for doubtful accounts (note 18) (2,206) (3,426)
Loans and other receivables 18,734 17,713
Total $111,057 $206,316
Non-current (note 9) 2,791 3,102
Current $108,266 $203,214
The Company’s exposure to credit risk related to trade and other receivables is disclosed in note 18.

Trican Well Service Ltd.
58 | MD&A Years Ended December 31, 2015 & 2016
(stated in thousands)Land and buildings Equipment
Fixtures and fittings Total
Cost
Balance at January 1, 2015 $171,926 $1,990,085 $53,264 $2,215,275
Additions 370 20,407 2,381 23,158
Disposals (9,607) (192,952) (3,198) (205,757)
Reclassification to assets held for sale (3,438) (9,882) - (13,320)
Effect of movements in exchange rates 17,013 179,392 1,996 198,401
Balance at December 31, 2015 $176,264 $1,987,050 $54,443 $2,217,757
Additions - 1,657 1 1,658Disposals (44,403) (772,646) (6,635) (823,684)Reclassification to assets held for sale (3,309) (7,101) - (10,410)Effect of movements in exchange rates (31,910) (380,010) (3,026) (414,946)Balance at December 31, 2016 $96,642 $828,950 $44,783 $970,375
Accumulated Depreciation
Balance at January 1, 2015 $37,043 $852,236 $39,242 $928,521
Depreciation 8,444 168,771 5,512 182,727
Disposals (4,314) (151,176) (2,315) (157,805)
Reclassification to assets held for sale (205) (6,227) - (6,432)
Impairment (note 16) 28,261 332,013 1,192 361,466
Effect of movements in exchange rates 3,317 77,727 1,936 82,980
Balance at December 31, 2015 $72,546 $1,273,344 $45,567 $1,391,457
Depreciation 5,423 69,153 3,751 78,327Disposals (12,028) (533,218) (5,732) (550,978)Reclassification to assets held for sale (763) (2,061) - (2,824)Impairment (note 16) 3,136 6,501 - 9,637Effect of movements in exchange rates (31,687) (352,235) (3,723) (387,645)Balance at December 31, 2016 $36,627 $461,484 $39,863 $537,974
Carrying amounts
At December 31, 2015 $103,718 $713,706 $8,876 $826,300
At December 31, 2016 $60,015 $367,466 $4,920 $432,401
Included within equipment are assets held under finance leases with a gross value of $6.5 million (2015 - $33.4 million) and accumulated depreciation of $5.1 million (2015 - $18.0 million). The lease obligations are secured by the leased equipment. At December 31, 2016, Trican had $1.8 million in assets under construction (2015 – $7.8 million).
NOTE 7 - PROPERTY AND EQUIPMENT

Trican Well Service Ltd.
MD&A Years Ended December 31, 2015 & 2016 | 59
Intangible Assets(stated in thousands)
Patents and know-how
Non-compete agreements CBM Process
Total intangible assets
CostBalance at January 1, 2015 $41,894 $26,446 $8,500 $76,840
Effect of movements in exchange rates - 4,680 - 4,680
Balance at December 31, 2015 $41,894 $31,126 $8,500 $81,520
Balance at January 1, 2016 $41,894 $31,126 $8,500 $81,520Effect of movements in exchange rates - - - -Balance at December 31, 2016 $41,894 $31,126 $8,500 $81,520
Amortization and impairment lossesBalance at January 1, 2015 $8,380 $25,622 $6,587 $40,589
Amortization 4,192 1,102 850 6,144
Impairment (note 16) 1,285 - - 1,285
Effect of movements in exchange rates - 4,402 - 4,402
Balance at December 31, 2015 $13,857 $31,126 $7,437 $52,420
Balance at January 1, 2016 $13,857 $31,126 $7,437 $52,420Amortization 1,665 - 850 2,515Impairment (note 16) 26,372 - - 26,372Effect of movements in exchange rates - - - -Balance at December 31, 2016 $41,894 $31,126 $8,287 $81,307
Carrying amountsAt December 31, 2015 $28,037 - $1,063 $29,100
At December 31, 2016 - - $213 $213
NOTE 8 - INTANGIBLE ASSETS AND GOODWILL
Goodwill (stated in thousands) AmountCarrying value, January 1, 2015 $56,035
Disposition of Russian pressure pumping business (note 3) (14,226)
Impairment (note 16) (22,558)
Carrying value, December 31, 2015 $19,251
Carrying value, December 31, 2016 $19,251
(stated in thousands) December 31, 2016 December 31, 2015Canada fracturing and other CGU $18,216 $18,216
Canada cementing CGU 1,035 1,035
Total goodwill $19,251 $19,251
The aggregate carrying amount of goodwill allocated to each CGU is as follows:

Trican Well Service Ltd.
60 | MD&A Years Ended December 31, 2015 & 2016
NOTE 9 - OTHER ASSETS
At December 31, 2016, the Company had a $8.6 million, USD $6.4 million secured, interest bearing first mortgage real estate loan (the “loan”) to an unrelated third-party sand supplier located in the U.S. (2015 – $9.1 million, USD $6.5 million).
The non-current portion of the loan of $2.8 million, USD $2.1 million (2015 – $3.1 million, USD $2.2 million) has been included in other assets on the consolidated statement of financial position. The current portion of the loan of $5.8 million, USD $4.3 million (2015 – $6.0 million, USD $4.3 million) has been included in trade and other receivables on the consolidated statement of financial position.
NOTE 10 - TRADE AND OTHER PAYABLES
(stated in thousands) December 31, 2016 December 31, 2015Trade payables $42,365 $76,295
Accrued liabilities 23,095 42,826
Liabilities for cash-settled share-based payments (note 14) 10,574 1,736
Finance lease obligations (note 11) 717 6,639
Other payables 11,205 20,355
Total trade and other payables $87,956 $147,851
The Company’s exposure to currency and liquidity risk related to trade and other payables is disclosed in note 18.
NOTE 11 - LOANS AND BORROWINGS
(stated in thousands) December 31, 2016 December 31, 2015Senior Notes, net of transaction costs $81,254 $346,576
RCF, net of transaction costs 140,048 210,101
Finance lease obligations 981 19,563
Total $222,283 $576,240
Current portion of loans and borrowings 9,790 100,306
Current portion of finance lease obligations (note 10) 717 6,639
Non-current $211,776 $469,295
2015 Amended Credit Agreements
On November 13, 2015, Trican, its lenders and senior noteholders amended the terms of the current credit agreements (the “2015 Amended Credit Agreements”) including:
� a reduction in the availability of the RCF from $575 million to $410 million;
� a 125 basis point increase to the interest rates on the Senior Notes and RCF during the covenant relief period that extends until the end of the second quarter of 2017, payable in cash, plus 175 basis point increase to the
interest rates on the Senior Notes and RCF during the covenant relief period, payable in-kind interest;
� providing floating charge security over all of its North American assets to both lenders and noteholders;
� a requirement to repay an additional $75 million of it Senior Notes and an additional $75 million of its RCF by October 28, 2016, otherwise, the interest rate on its Senior Notes and RCF will increase by a further 200 basis points; a subordinated note based on make-whole amounts was delivered to the senior noteholders;

Trican Well Service Ltd.
MD&A Years Ended December 31, 2015 & 2016 | 61
� no distributions to be made until after the second quarter of 2017 assuming certain deferred obligations are paid at that time and the ratio of Senior Consolidated Debt to adjusted EBITDA is less than or equal to 3.0x; and
� the financial and non-financial covenants were amended.
2016 Amended Credit Agreements
On March 16, 2016, Trican closed the sale of the U.S. pressure pumping business to Keane. Concurrently, the amended terms of the 2016 credit agreements (the “2016 Amended Credit Agreements”) between Trican, its lenders and Senior Noteholders came into effect including;
� an elimination of the minimum EBITDA and liquidity covenants;
� a Cure Amount provision for which 50% of the equity proceeds may be applied in the calculation of adjusted EBITDA for the Leverage and Interest coverage covenant calculations, provided a Cure Amount is not used more than twice in any four quarter period and the aggregate amount of any Cure Amount applied to the quarterly covenant calculations does not exceed $20 million; and;
� Adjusted EBITDA was defined as income before interest, taxes, depreciation and other permitted or non-cash items under the 2016 Amended Credit Agreements.
Second 2016 Amended Credit Agreements
On June 21, 2016, Trican closed a public offering of an aggregate of 43,125,000 common shares at a price of $1.60 per common share for aggregate gross proceeds of $69 million including overallotments (the “Equity Offering”). Concurrently, “Second 2016 Amended Credit Agreements” with its bank lenders under its revolving credit facility (“RCF”) and the holders of its senior notes came into effect which did not change key terms of the 2016 Amended Credit Agreements other than as described below.
Key terms include:
� a reduction in the availability of the RCF from $303 million to $250 million;
� a temporary cap of $175 million on the RCF until Trican has achieved EBITDA (excluding the application of any Cure Amount as defined in the RCF agreement) of at least $25 million in any quarter ended on or after September 30, 2016. The temporary cap remains in place at December 31, 2016;
� a removal of all prior financial covenants until the first quarter of 2017; and
� new leverage and interest covenant calculations as described below – the covenant thresholds remain unchanged.

Trican Well Service Ltd.
62 | MD&A Years Ended December 31, 2015 & 2016
Senior Notes
Trican had the following notes outstanding:
Canadian $ Amount U.S. $ Denominated Amount(stated in thousands) Maturity Dec. 31, 2016 Dec. 31, 2015 Dec. 31, 2016 Dec. 31, 2015Senior Notes
7.05% (1) Series A November 19, 2017 $8,859 $23,067 $6,598 $16,667
7.05% (1) Series A November 19, 2019 - 5,297 - 3,828
8.22% (1) Series C April 28, 2016 - 33,445 - -
9.11% (1) Series D April 28, 2021 3,368 11,148 - -
7.61% (1)Series E April 28, 2016 - 66,860 - 48,309
8.29% (1)Series F April 28, 2018 25,713 82,289 19,150 59,457
8.90% (1) Series G April 28, 2021 33,448 108,005 24,911 78,038
8.75% (1) Series H September 03, 2024 4,456 14,864 - -
Subordinated Make-Whole Senior Notes
5.96% Series A November 19, 2017 686 703 511 508
5.54% Series D April 28, 2021 458 457 - -
5.55% Series F April 28, 2018 1,224 1,268 912 916
6.28% Series G April 28, 2021 3,317 3,395 2,470 2,453
6.05% Series H September 03, 2024 760 755 - -
PIK Principal 2,075 - - -
Debt issue costs (2) (3,110) (4,977) - -
Senior Notes, net of debt issue costs $81,254 $346,576 $54,552 $210,176
(1) The interest rate on Senior Notes includes an additional 125 basis point increase payable in cash and a 175 basis point increase of interest payable in kind pursuant to the 2016 and 2015 Amended Credit Agreements.
(2) Includes transaction costs on the 2016 and 2015 Amended Credit Agreements and Original Credit Agreements.
During 2016, Trican used a portion of the proceeds from the sale of the U.S pressure pumping business, the sale of the completion tools business, and the equity offering to retire in advance Senior Note amounts of USD $130.6 million and $34.3 million. During the second quarter of 2016, Trican fully retired its Senior Notes Series C ($17.3 million) and Series E (USD $25.1 million) on maturity.
RCF
As at December 31, 2016, Trican has a $250 million (2015 - $410 million) extendible revolving credit facility (“RCF”) with a syndicate of banks that is committed until October 31, 2018. Availability under the RCF is currently capped at $175 million
as mentioned above. The RCF is secured and bears interest at the applicable Canadian prime rate, U.S. prime rate, Banker’s Acceptance rate, or at LIBOR, plus 350 to 625 basis points (2015 – Canadian prime rate, U.S. prime rate, Banker’s Acceptance rate, or at LIBOR, plus 350 to 625 basis points), dependent on certain financial ratios of the Company. The undrawn amount of the RCF is $110.0 million (2015 - $214.8 million) of which only $35 million is accessible as at December 31, 2016 .
As at December 31, 2016, Trican has a $10 million (2015 - $10 million) Letter of Credit facility with its syndicate of banks. As at December 31, 2016, Trican had $5.1 million in letters of credit outstanding (2015 - $5.2 million).

Trican Well Service Ltd.
MD&A Years Ended December 31, 2015 & 2016 | 63
Covenants
The Company is required to comply with covenants under the terms of the Second 2016 Amended Credit Agreements. These covenants are applicable to the RCF and to the Senior Notes:
For the quarter ended Leverage Ratio Interest Coverage Ratio Calculation Basis
December 31, 2016 Not applicable Not applicable Not applicable
March 31, 2017 <5.0x >2.0x Q1 annualized
June 30, 2017 <5.0x >2.0x (Q1 X 3 + Q2)
September 30, 2017 <5.0x >2.0x ((Q1 + Q3) x 3/2) + Q2
December 31, 2017 <4.0x >2.5x Last twelve months
Thereafter <3.0x >3.0x Last twelve months
� no financial covenants are applicable until the first quarter of 2017; and,
� Trican is required to comply with the following leverage and interest coverage ratio covenants:
The Leverage Ratio is defined as long-term debt excluding Subordinated Make Whole Notes (net of the mark to market value of the cross currency swaps) minus cash divided by adjusted EBITDA.
The Interest Coverage Ratio is defined as adjusted EBITDA divided by interest expense minus payable in-kind interest.
Certain non-cash expenses and personnel based expenses such as severance are permitted to be added back to EBITDA to arrive at adjusted EBITDA for covenant calculation purposes.
As noted above, no financial covenants are applicable to the Company for the fourth quarter of 2016 (2015 - in compliance).
Finance Lease LiabilitiesAs at December 31, 2016 As at December 31, 2015
(stated in thousands)
Total future minimum
lease payments
Interest payments
Present value of minimum
lease payments
Total future minimum
lease payments
Interest payments
Present value of minimum
lease payments
Less than one year $717 $21 $696 $7,296 $658 $6,639
Between one and five years 264 4 260 13,759 836 12,924
More than five years - - - - - -
Total $981 $25 $956 $21,055 $1,494 $19,563

Trican Well Service Ltd.
64 | MD&A Years Ended December 31, 2015 & 2016
NOTE 12 - SHARE CAPITAL AND ACCUMULATED OTHER COMPREHENSIVE LOSS
Share Capital
Authorized:The Company is authorized to issue an unlimited number of common shares, issuable in series. The shares have no par value. All issued shares are fully paid:
Accumulated Other Comprehensive Loss
Foreign Currency Translation Differences
The foreign currency translation differences comprise all foreign currency differences arising from the translation of the financial statements of foreign operations. At December 31, 2016, the Company had an accumulated foreign currency translation loss of $0.5 million (2015 - $66.0 million income).
Issued and Outstanding - Common Shares:
(stated in thousands, except per share amounts) Number of Shares AmountBalance, January 1, 2015 149,105,720 $571,050
Shares repurchased and cancelled under NCIB (187,674) (713)
Balance, December 31, 2014 148,918,046 $570,337
Exercise of stock options 1,524,801 1,446
Reclassification from contributed surplus on exercise of options - 668
Issuance of shares (net of issuance cost and net of tax) 43,125,000 65,926Balance, December 31, 2016 193,567,847 $638,377
On June 21, 2016, the Company issued 43,125,000 common shares at a price of $1.60 per Common Share, for gross proceeds to Trican of approximately $69 million.
Equity Interest in Keane
The equity interest in Keane comprises the fair value movement in the Class A shares in Keane. At December 31, 2016, the Company had an accumulated unrealized gain on equity interest in Keane of $41.2 million (2015 – nil).
(stated in thousands, except share and per share amounts) December 31, 2016 December 31, 2015
Weighted average number of common shares - basic and diluted 172,386,739 148,926,730
Attributable to Owners of the Company
Net loss from continuing operations (40,729) ($62,781)
Per share - basic and dilutive (0.24) ($0.42)
Net income / (loss) from discontinued operations 11,195 (764,993)
Per share- basic and dilutive 0.06 ($5.14)
Net loss (29,534) (827,774)
Per share - basic and dilutive (0.18) ($5.56)
All of the outstanding options have been excluded from the diluted weighted-average number of common shares as the Company incurred net losses in 2016 and 2015.
NOTE 13 - LOSS PER SHARE

Trican Well Service Ltd.
MD&A Years Ended December 31, 2015 & 2016 | 65
NOTE 14 - SHARE BASED PAYMENTS
The Company has four stock-based compensation plans which are described below.
Incentive Stock Option Plan (Equity-Settled):
Options may be granted at the discretion of the Board of Directors and all officers and employees of the Company are eligible for participation in the Plan. The option price equals the volume-weighted-average closing price of the Company’s shares on the Toronto Stock Exchange, for the five trading days preceding the date of grant. Options granted in 2010 and thereafter vest on three equal tranches on each of the first,
second and third anniversary dates with an expiry date of five years from the date of the grant.
The compensation expense that has been recognized in profit for the year is $2.8 million (2015 - $4.2 million). The corresponding amount has been recognized in contributed surplus. The weighted average grant date fair value of options granted during 2016 has been estimated at $1.08 per option (2015 - $0.36) using the Black-Scholes option pricing model. Expected volatility is estimated by considering historic average share price volatility. The Company has applied the following assumptions in determining the fair value of options for grants during the years ended:
For the year ended December 31, 2016 2015
Share price $1.99 $0.82
Exercise price $1.99 $0.82
Expected life (years) 3.48 3.60
Expected volatility 79% 60%
Risk-free interest rate 0.6% 0.6%
Forfeitures 10.9% 8.4%
Dividend yield 0.0% 0.0%
The Company has reserved 18,388,945 common shares as at December 31, 2016, (December 31, 2015 – 14,891,805) for issuance under a stock option plan for officers and employees. The maximum number of options permitted to be outstanding at any point in time is limited to 9.5% of the Common Shares then outstanding. As of December 31, 2016,
2016 2015
OptionsWeighted Average
Exercise Price OptionsWeighted Average
Exercise PriceOutstanding at the beginning of year 10,805,206 $9.71 10,461,818 $15.19
Granted 3,601,120 1.99 4,364,182 0.82
Exercised (1,524,801) 0.95 - -
Forfeited (2,696,499) 10.50 (1,711,435) 13.36
Expired (1,391,825) 19.87 (2,309,359) 15.03
Outstanding at the end of the year 8,793,201 $6.22 10,805,206 $9.71
Exercisable at end of year 3,449,141 $11.84 4,639,775 $15.73
The weighted-average share price for the year ended December 31, 2016, was $2.32 (2015 - $2.94).
8,793,201 options (December 31, 2015 – 10,805,206) were outstanding at exercise prices ranging from $0.82 to $18.03 per share with expiry dates ranging from 2017 to 2023.
The following table provides a summary of the status of the Company’s stock option plan and changes during the years ending December 31:

Trican Well Service Ltd.
66 | MD&A Years Ended December 31, 2015 & 2016
Options Outstanding Options Exercisable
Range of Exercise PricesNumber
OutstandingWeighted Average
Remaining LifeWeighted Average
Exercise PriceNumber
ExercisableWeighted Average
Exercisable Price$0.00 to $1.00 2,154,284 3.76 0.82 491,953 0.82
$1.01 to $10.00 3,269,810 6.44 2.00 3,000 9.84
$10.01 to $20.00 3,369,107 1.59 13.77 2,954,188 13.67
$0.00 to $20.00 8,793,201 3.93 6.22 3,449,141 11.84
The following table summarizes information about stock options outstanding at December 31, 2016:
Deferred Share Unit Plan (Cash-Settled)
Under the terms of the deferred share unit plan, DSUs awarded will vest immediately and will be settled with cash in the amount equal to the closing price of the Company’s common shares on the date the director specifies upon tendering his resignation from the Board, which in any event must be after the date on which the notice of redemption is filed with the Company and within the period from the Director’s resignation date to December 15 of the first calendar year commencing after the Director’s termination date. There were 1,472,752 DSUs outstanding at December 31, 2016 (2015 – 1,373,063).
Restricted Share Unit Plan (Cash-Settled)
Under the terms of the restricted share unit plan, the RSUs awarded will vest in three equal portions on the first, second and third anniversary of the grant date and will be settled in cash in the amount equal to the volume-weighted-average trading price for the twenty trading days preceding the particular vesting date of the award. The fair value of the RSUs is expensed into income evenly over the same period that the units vest and at each reporting date between grant date and settlement, the fair value of the liability is re-measured with any changes in fair value
recognized in profit or loss for the period. All officers and employees of the Company are eligible for participation in the plan. There were 795,780 RSUs outstanding at December 31, 2016 (2015 – 2,039,786).
Performance Share Unit Plan (Cash-Settled)
Under the terms of the performance share unit plan, grants awarded will vest in three equal portions on the first, second and third anniversary of the grant date if the Company meets certain financial targets and expire otherwise. Grants prior to 2014 will be paid out upon vesting yearly and grants issued in 2014 and going forward will be paid out 3 years from the grant date. PSU grants will be settled in cash in the amount equal to the volume-weighted-average trading price for the five trading days preceding the particular vesting date of the Common Shares of the Company. The fair value of the PSUs is expensed into income evenly over the same period that the units vest and at each reporting date between grant date and settlement, the fair value of the liability is re-measured with any changes in fair value recognized in profit or loss for the period. There were 601,444 PSUs outstanding at December 31, 2016 (2015 – 920,251). As of the date of these financial statements the Company’s intention is to settle the PSUs in cash.

Trican Well Service Ltd.
MD&A Years Ended December 31, 2015 & 2016 | 67
(units) Deferred Share Unit Restricted Share Unit Performance Share Unit
Balance, January 1, 2015 403,279 2,417,536 456,042
Granted 969,784 1,201,527 670,622
Exercised - (704,627) (1,500)
Forfeited - (874,650) (204,913)
Balance, December 31, 2015 1,373,063 2,039,786 920,251
Granted 298,923 152,420 284,900
Exercised (199,234) (489,058) -
Forfeited - (907,368) (603,707)
Balance, December 31, 2016 1,472,752 795,780 601,444
Vested at December 31, 2016 1,472,752 134,524 -
(stated in thousands)
December 31, 2016 2015
Cash-settled share-based compensation expense
Expense / (Recovery) arising from DSUs $6,243 (1,566)
Expense / (Recovery) arising from RSUs 2,799 (2,433)
Expense / (Recovery) arising from PSUs 1,344 (1,108)
Total expense / (recovery) cash-settled share-based compensation expense $10,386 ($5,107)
Equity-settled share-based compensation expense
Stock Options 2,809 4,237
Total expense / (recovery) equity-settled share-based compensation expense $2,809 $4,237
Total expense / (recovery) related to share-based payments $13,195 ($870)
The outstanding liabilities for cash-settled compensation plans at December 31, 2016 of $10.6 million (December 31, 2015 - $1.7 million) are included in accounts payable and accrued liabilities. The expense related to all equity-settled and cash-settled share-based compensation plans is detailed under Administrative Expenses in Note 15 – Cost of Sales and Administrative Expenses.
The following table provides a summary of the status of the Company’s cash-settled compensation plans and changes during the years ending December 31:

Trican Well Service Ltd.
68 | MD&A Years Ended December 31, 2015 & 2016
NOTE 15 - COST OF SALES AND ADMINISTRATIVE EXPENSES
The Company classifies the consolidated statement of comprehensive income using the function of expense method, which presents expenses according to their function,
such as cost of sales and administrative expenses. This method is more closely aligned to the Company business structure and provides more relevant information to the public.
The following table provides additional information on the nature of the expenses:
Cost of sales 2016 2015
Operations
Personnel expenses $109,492 $172,786
Direct costs - cost of sales 151,266 294,679
Direct costs - other expenses 80,515 124,812
Depreciation and amortization 61,469 65,746
Sub-total cost of sales - Operations $402,742 $658,023
Corporate(1)
Personnel expenses $3,909 $15,078
Direct costs 1,722 3,011
Depreciation and amortization 339 367
Sub-total cost of sales - Corporate $5,970 $18,456
Total cost of sales $408,712 $676,479
Administrative expenses 2016 2015
Operations
Personnel expenses $8,964 $9,518
General organizational expenses 2,094 2,706
Bad debt expense 375 193
Depreciation and amortization 4,278 4,279
(Recovery) / expense related to share-based payments 3,478 (250)
Sub-total administrative expenses - Operations $19,189 $16,446
Corporate(1)
Personnel expenses $9,056 $9,226
General organizational expenses 14,352 2,575
Depreciation and amortization 4,353 4,333
Share-based compensation expenses 9,717 (620)
Sub-total administrative expenses - Corporate $37,478 $15,514
Total administrative expenses $56,667 $31,960
(1) Corporate expenses relate to technical, operational and administrative support provided by Trican Well Service headquarters in Calgary for Canadian and International operations.
December 31, 2016 December 31, 2015
Severance costs $20,149 $12,291
The following severance costs are included in personnel expenses above:

Trican Well Service Ltd.
MD&A Years Ended December 31, 2015 & 2016 | 69
NOTE 16 – IMPAIRMENT
For the purposes of impairment testing, goodwill and intangible assets are allocated to the Company’s cash generating units (“CGUs”). As required by IAS 36, the Company performed its annual impairment tests on goodwill for the Fracturing and Other CGU and Cement CGU at December 31, 2016. In addition, management performed an impairment test for the Coiled Tubing CGU as indicators of impairment were identified for this CGU at December 31, 2016.
The recoverable amount of each CGU was determined by the value-in-use method using a discounted cash flow model. The Company used a 5-year model, a discount rate of 12.7%, a pre-tax discount rate of 17% and a terminal growth rate of 2.5%. Revenue and cash flow assumptions were based on a combination of past results and expectations of future growth.
The recoverable amount of each CGU was in excess of the carrying amount for the year ended December 31, 2016. The estimated recoverable amounts for the Coiled Tubing CGU is sensitive to the following estimates:
� Increasing the discount rate by 1% would require an impairment charge of $1.1 million; and,
� Decreasing the terminal growth rate by 2% would lead to an impairment charge of $1.3 million.
Assets Held for Sale
During the 2016 year, the Company recorded impairments related to the evaluation of assets held for sale at the lower of carrying value or fair value less cost to sell. The Company recorded total goodwill impairment of nil (2015 - $22.6 million), property and plant of $5.1 million recognized in continuing operations and $4.5 million recognized in discontinued operations (2015 - $5.0 million and $356.5 million, respectively), and intangible impairment of $26.4 million recognized in discontinued operations (2015 - $1.3 million).
An impairment loss of $5.1 million on the carrying amount of property and equipment was recorded as a result of measuring the Canadian division’s microseismic assets and properties as held for sale at the lower of cost and fair value less cost of disposal.
NOTE 17 - INCOME TAXES
(stated in thousands)
For the year ended December 31, 2016 2015Current tax expense / (recovery) Current year $1,095 $3,047
Adjustment for prior years (102) -
$993 $3,047
Deferred income tax expense / (recovery) Current year ($64,806) ($24,187)
Adjustment for prior years 588 -
($64,218) ($24,187)
Total tax expense / (recovery) from continuing operations ($63,225) ($21,140)
(stated in thousands)
For the year ended December 31, 2016 2015Canada $103,842 $83,921
Foreign 112 -
Loss before income taxes from continuing operations $103,954 $83,921
Loss Before Income Taxes

Trican Well Service Ltd.
70 | MD&A Years Ended December 31, 2015 & 2016
(stated in thousands)
For the year ended December 31, 2016 2015Expected combined federal and provincial income tax ($27,964) ($32,356)
Unrecognized current year losses 636 1,851
Non-deductible expenses 569 896
Adjustments related to prior years 3,285 1,061
Recognition of previously unrecognized losses (49,002) -
Stock-based compensation 715 1,105
Changes to deferred income tax rates - 5,212
Unrealized gain in Keane investments 8,754 -
Other (218) 1,091
($63,225) ($21,140)
The income tax expense differs from that expected by applying the combined federal and provincial income tax rate of 26.9% (2015 – 26.09%) to loss from continuing operations before income taxes for the following reasons:
Unrecognized Deferred Tax Assets
Deferred tax assets are recognized only to the extent that it is probable that the assets can be recovered. At December 31, 2016, the Company had $937 million (2015 - $1,123.6 million) of deductible temporary differences where no deferred tax asset was recognized. These deductible temporary differences are predominantly losses incurred in the United States and expire between 2029 and
2035. During the second quarter of 2015, the Company derecognized its deferred tax assets in the United States due to a combination of factors which include losses in recent prior periods, current period losses and near term challenging market conditions.
Deferred Tax Balances
The components of the deferred tax asset and liability are as follows:
(stated in thousands)
For the year ended December 31, 2016 2015Deferred tax assets:
Non-capital loss carry forwards $86,232 $289
Other 4,822 -
$91,054 $289
Deferred tax liabilities:
Property, equipment and other assets ($49,033) ($46,009)
Partnership deferral - (26,019)
Unrealized gain in Keane investments (79,938) -
Other - (7,565)
($128,971) ($79,593)
($37,917) ($79,304)

Trican Well Service Ltd.
MD&A Years Ended December 31, 2015 & 2016 | 71
January 1, 2015
Recognized in Profit or
Loss OtherDecember
31, 2015
Recognized in Profit or
Loss OCI OtherDecember
31, 2016Goodwill $35,652 ($35,652) $- $- $- $- $- $-Intangible assets (9,548) 1,688 - (7,860) - - 7,803 (57)Non-capital loss carry forwards
219,378 (219,089) - 289 85,943 - - 86,232
Property & equipment (140,122) 94,113 - (46,009) (3,025) - - (49,034)Partnership deferral (56,036) 30,017 - (26,019) 26,019 - - -Unrealized gain in Keane investments
- - - - (34,180) (45,758) - (79,938)
Other 8,847 (19,456) 10,904 295 (10,539) - 15,124 4,880$58,171 ($148,379) $10,904 ($79,304) $64,218 ($45,758) $22,927 ($37,917)
Movement in Deferred Tax Balances During the Year
NOTE 18 - FINANCIAL INSTRUMENTSFair Values of Financial Assets and Liabilities The fair values of cash and cash equivalents, trade and other receivables, and trade and other payables included in the consolidated statement of financial position approximate their carrying amount due to the short-term maturity of these instruments.
On January 20, 2017, Keane Group, Inc. completed its initial public offering (“IPO”) and its shares became publicly traded on the New York Stock Exchange under the ticker symbol “FRAC”. As a result of the IPO, Trican’s ownership interests in Keane Holdings have been transferred to Keane Investor
Holdings, LLC (“Keane Holding Company”). Effectively, our Class A common shares and Class C profits interest in Keane Holdings are now Class A common shares and Class C profits interests in the Keane Holding Company. At the time of IPO, the Keane Holding Company’s only asset was 87.4 million shares of FRAC and it had no liabilities.
Future liquidity events will effectively be the future sale of the remaining shares of FRAC currently held by the Keane Holding Company. The proceeds from the future sales will be distributed to the owners of Keane Holding Company. Trican’s portion of the future liquidity events will be calculated based on the following waterfall table:
Liquidity Event Cumulative Proceeds Thresholds (USD $MM)For the Year Ending March 15
Tranche Trican Ownership Interest 2017 2018 2019 2020 2021
First 10% up to $468 $468 $468 $468 $468
Second 9.2% between $468 - 608 $468 - 791 $468 - 1,028 $468 - 1,336 $468 - 1,737
Third 18.3% between $608 - 632 $791 - 853 $1,028 - 1,151 $1,336 - 1,554 $1,737 - 2,098
Fourth 27.4% greater than $632 $853 $1,151 $1,554 $2,098

Trican Well Service Ltd.
72 | MD&A Years Ended December 31, 2015 & 2016
Beginning of year 1: Proceeds from the IPO of $28.4 million
End of year 1: 25% of outstanding shares after the IPO
End of year 2: 50% of outstanding shares after the IPO
End of year 3: 25% of outstanding shares after the IPO
The fair value of Class A and Class C shares was calculated based on an estimate of Trican’s portion of future liquidity events using an estimated share price of USD $19 per share, and a discounted cash flow model risk adjusted with rates of 14% for the Class A equity interest and 37% for the Class C profit interest.. These risk adjustments considered various factors including the time value of money and take into
consideration several estimates for uncertainties relating to Trican’s non-controlling interest in the Keane Holding Company and the timing and price of future liquidity events. The calculation of the fair value of the Class A and Class C shares also utilized the following distribution schedule:
Equity interest in Keane (Class A Shares)
Profits Interest in Keane (Class C Shares) Investments in Keane
Balance at January 1, 2016 - - -
Recognized on sale of U.S. operations 75,022 3,459 78,481
Unrealized gain on investments 87,289 65,206 152,495
Balance at December 31, 2016 162,311 68,665 230,976
The fair value of Trican’s marketable securities is $28.1 million, which is the fair value of 558,221 NOV shares measured at their trading price at the end of the period.
The fair values were determined by calculating future cash flows, including interest at current rates.. The fair value of finance lease obligations was determined by calculating the future cash flows, including interest, using market rates. Due to the lack of observable market data and reliable fair value measures, the fair value of the loan to an unrelated third party (described in note 9) is $8.6 million (2015 - $9.1 million). The fair value was calculated using a discounted cash flow approach with an effective interest rate of 12%. The fair value of the currency derivatives has been based on the forward swap rates at the end of the period.
The table below analyses financial instruments carried at fair value, by valuation method. The different levels have been defined as follows:
� Level 1: quoted prices (unadjusted) in active markets for identical assets or liabilities;
� Level 2: inputs other than quoted prices included within Level 1 that are observable for the asset or liability, either directly (i.e. as prices) or indirectly (i.e. derived from prices); or
� Level 3: inputs for the asset or liability that are not based on observable market data (unobservable inputs).
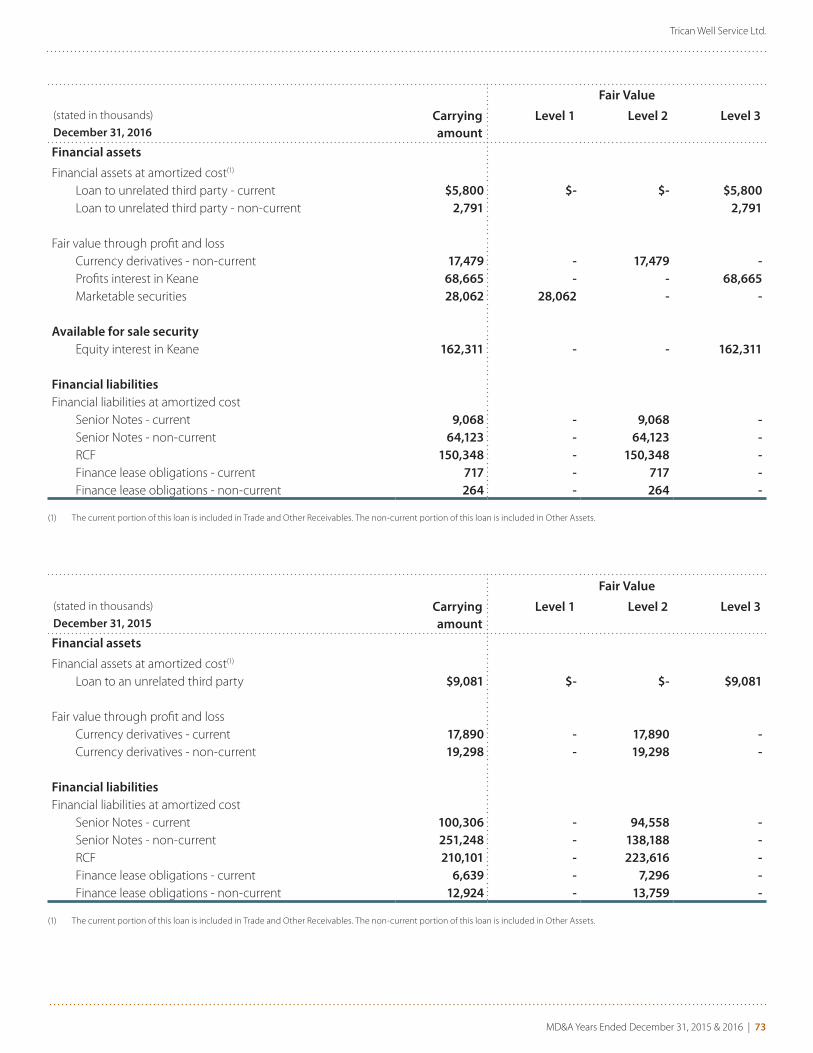
Trican Well Service Ltd.
MD&A Years Ended December 31, 2015 & 2016 | 73
Fair Value(stated in thousands)
December 31, 2016Carrying amount
Level 1 Level 2 Level 3
Financial assets
Financial assets at amortized cost(1)
Loan to unrelated third party - current $5,800 $- $- $5,800Loan to unrelated third party - non-current 2,791 2,791
Fair value through profit and lossCurrency derivatives - non-current 17,479 - 17,479 -Profits interest in Keane 68,665 - - 68,665Marketable securities 28,062 28,062 - -
Available for sale securityEquity interest in Keane 162,311 - - 162,311
Financial liabilitiesFinancial liabilities at amortized cost
Senior Notes - current 9,068 - 9,068 -Senior Notes - non-current 64,123 - 64,123 -RCF 150,348 - 150,348 -Finance lease obligations - current 717 - 717 -Finance lease obligations - non-current 264 - 264 -
(1) The current portion of this loan is included in Trade and Other Receivables. The non-current portion of this loan is included in Other Assets.
(1) The current portion of this loan is included in Trade and Other Receivables. The non-current portion of this loan is included in Other Assets.
Fair Value(stated in thousands)
December 31, 2015Carrying amount
Level 1 Level 2 Level 3
Financial assets
Financial assets at amortized cost(1)
Loan to an unrelated third party $9,081 $- $- $9,081
Fair value through profit and lossCurrency derivatives - current 17,890 - 17,890 -Currency derivatives - non-current 19,298 - 19,298 -
Financial liabilitiesFinancial liabilities at amortized cost
Senior Notes - current 100,306 - 94,558 -Senior Notes - non-current 251,248 - 138,188 -RCF 210,101 - 223,616 -Finance lease obligations - current 6,639 - 7,296 -Finance lease obligations - non-current 12,924 - 13,759 -
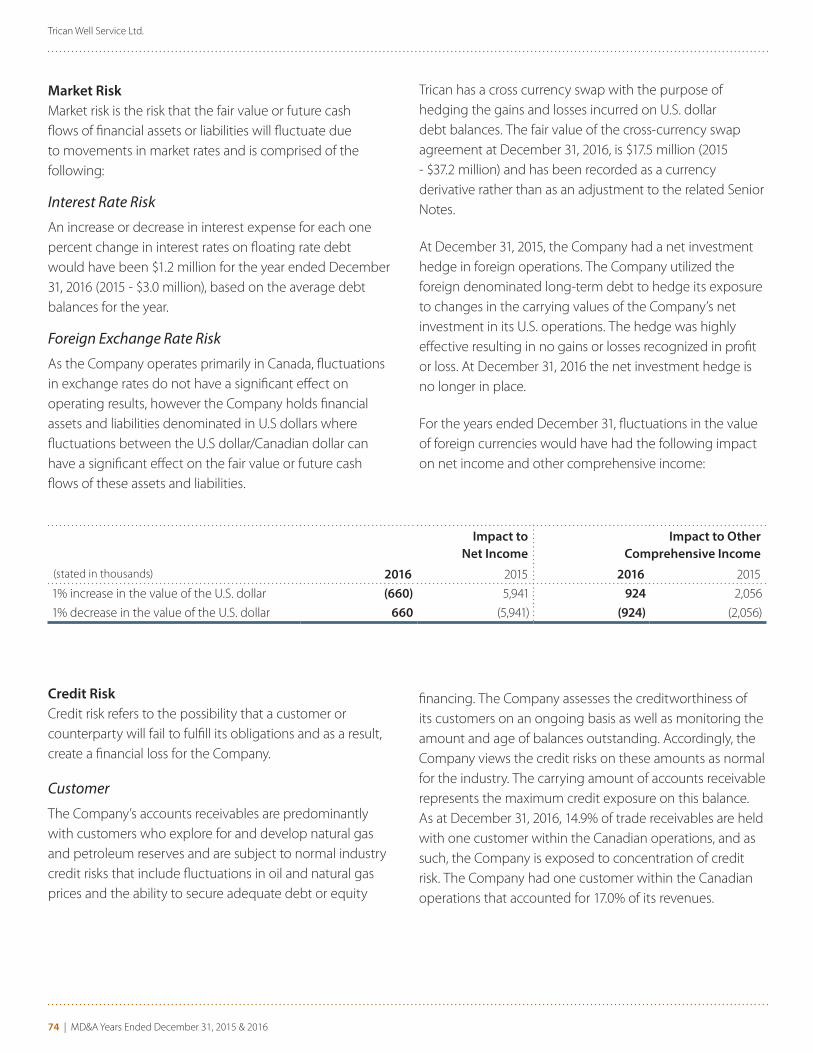
Trican Well Service Ltd.
74 | MD&A Years Ended December 31, 2015 & 2016
Market RiskMarket risk is the risk that the fair value or future cash flows of financial assets or liabilities will fluctuate due to movements in market rates and is comprised of the following:
Interest Rate Risk
An increase or decrease in interest expense for each one percent change in interest rates on floating rate debt would have been $1.2 million for the year ended December 31, 2016 (2015 - $3.0 million), based on the average debt balances for the year.
Foreign Exchange Rate Risk
As the Company operates primarily in Canada, fluctuations in exchange rates do not have a significant effect on operating results, however the Company holds financial assets and liabilities denominated in U.S dollars where fluctuations between the U.S dollar/Canadian dollar can have a significant effect on the fair value or future cash flows of these assets and liabilities.
Trican has a cross currency swap with the purpose of hedging the gains and losses incurred on U.S. dollar debt balances. The fair value of the cross-currency swap agreement at December 31, 2016, is $17.5 million (2015 - $37.2 million) and has been recorded as a currency derivative rather than as an adjustment to the related Senior Notes.
At December 31, 2015, the Company had a net investment hedge in foreign operations. The Company utilized the foreign denominated long-term debt to hedge its exposure to changes in the carrying values of the Company’s net investment in its U.S. operations. The hedge was highly effective resulting in no gains or losses recognized in profit or loss. At December 31, 2016 the net investment hedge is no longer in place.
For the years ended December 31, fluctuations in the value of foreign currencies would have had the following impact on net income and other comprehensive income:
Impact to Net Income
Impact to Other Comprehensive Income
(stated in thousands) 2016 2015 2016 2015
1% increase in the value of the U.S. dollar (660) 5,941 924 2,056
1% decrease in the value of the U.S. dollar 660 (5,941) (924) (2,056)
Credit Risk Credit risk refers to the possibility that a customer or counterparty will fail to fulfill its obligations and as a result, create a financial loss for the Company.
Customer
The Company’s accounts receivables are predominantly with customers who explore for and develop natural gas and petroleum reserves and are subject to normal industry credit risks that include fluctuations in oil and natural gas prices and the ability to secure adequate debt or equity
financing. The Company assesses the creditworthiness of its customers on an ongoing basis as well as monitoring the amount and age of balances outstanding. Accordingly, the Company views the credit risks on these amounts as normal for the industry. The carrying amount of accounts receivable represents the maximum credit exposure on this balance. As at December 31, 2016, 14.9% of trade receivables are held with one customer within the Canadian operations, and as such, the Company is exposed to concentration of credit risk. The Company had one customer within the Canadian operations that accounted for 17.0% of its revenues.

Trican Well Service Ltd.
MD&A Years Ended December 31, 2015 & 2016 | 75
(stated in thousands)
December 31, 2016 2015Current (0 - 30 days from invoice date) $51,742 $82,946
31 - 60 days past due 40,792 57,938
60 - 90 days past due 10,674 32,565
Greater than 90 days past due 7,263 33,191
Total $110,471 $206,640
Provision for doubtful accounts $2,206 $3,426
(stated in thousands)
Movement in Provision for the Years Ended December 31, 2016 2015Provision for doubtful accounts at January 1 $3,426 $7,563
(Decrease) / increase in provision (846) (4,075)
Write-off of provision (374) -
Effect of movement in exchange rates - (62)
Provision for doubtful accounts at December 31 $2,206 $3,426
Payment terms with customers vary by region and contract; however, standard payment terms are 30 days from invoice date. Historically, industry practice allows for payment up to 70 days from invoice date. The Company considers its accounts receivable excluding doubtful accounts to be aged as follows:
The Company’s objectives, processes and policies for managing credit risk have not changed from the prior year.
Counterparties
Counterparties to financial instruments expose the Company to credit losses in the event of non-performance. Counterparties to cash transactions are limited to high credit-quality financial institutions. The Company does not anticipate non-performance that would materially impact the Company’s financial statements.
Liquidity RiskLiquidity risk is the risk the Company will encounter difficulties in meeting its financial liability obligations. The Company manages its liquidity risk through cash and debt management, which includes monitoring forecasts of the Company’s cash and cash equivalents and borrowing facilities on the basis of projected cash flow. This is generally carried out at both the consolidated and geographic region levels in accordance with practices and policies established by the Company.
In managing liquidity risk, the Company has access to a wide range of funding at competitive rates through capital markets and banks. As at December 31, 2016, the Company
had available unused committed bank credit facilities in the amount of $110.0 million (2015 - $214.8 million) of which only $35 million is accessible during the temporary cap plus cash, trade and other receivables, marketable securities and investment in Keane of $20.3 million (2015 - $49.1 million), $108.3 million (2015 - $203.2 million), $28.1 million (2015 – nil) and $231.0 million (2015 – nil) respectively, for a total of $387.7 million (2015 - $467.1 million) available to fund the cash outflows relating to its financial liabilities. The Company believes it has sufficient funding through the use of these sources to meet foreseeable borrowing requirements.
The Company anticipates that its existing capital resources including availability under its RCF and cash flows from operations will be adequate to satisfy its liquidity requirements through fiscal 2017. If available liquidity is not sufficient to meet Trican’s operating and debt servicing obligations as they come due, management’s plans include reducing expenditures as necessary or pursuing alternative financing arrangements and additional asset sales. However, there is no assurance that, if required, the Company will be able to reduce expenditures or secure alternative financing arrangements to provide the required liquidity.

Trican Well Service Ltd.
76 | MD&A Years Ended December 31, 2015 & 2016
The timing of cash outflows relating to financial liabilities are outlined in the table below:
(stated in thousands)
December 31, 2016Carrying
ValueLess than 1
Year1 to 3 Years
4 to 5 Years
Greater than 5
years
Total
Trade and other payables $87,239 $87,239 $- $- $- $87,239Current portion of long-term debt 9,790 9,890 - - - 9,890RCF (including interest) 140,048 10,348 154,020 - - 164,368Senior Notes 71,464 - 30,325 40,591 5,216 76,132
Interest on Senior Notes - 4,807 5,882 3,695 745 15,129Finance lease obligations (including interest) 981 717 264 - - 981
$113,001 $190,491 $44,286 $5,961 $353,739
NOTE 19 - CAPITAL MANAGEMENTThe Company's strategy is to carry a capital base to maintain investor, creditor and market confidence and to sustain future development of the business. The Company seeks to maintain a balance between the level of long-term debt and shareholders' equity to ensure access to capital
(stated in thousands, except ratios)
December 31, 2016 2015Loans and borrowings $221,566 $569,601
Shareholders' equity 569,009 553,695
Total capitalization $790,575 $1,123,296
Long-term debt to total capitalization 0.28 0.51
markets to fund growth and working capital given the cyclical nature of the oilfield services sector. The Company may occasionally need to increase these levels to facilitate acquisition or expansionary activities.
As at December 31, these ratios were as follows:
The Company is subject to various financial and non-financial covenants associated with the Second 2016 Amended Credit Agreements (note 11). The covenants are monitored on a regular basis and controls are in place to maintain compliance with these covenants. No financial covenants are applicable to the Company for the fourth quarter of 2016.
NOTE 20 – COMMITMENTSThe Company has commitments for operating lease agreements, primarily for office space, with minimum payments due as of December 31, and capital commitments, primarily related to major equipment as follows:
Payments Due by Period
December 31, 2016 1 year or less 1 to 5 years 5 years & thereafter Total
Operating leases $4,641 $9,838 $8,324 $22,803Capital commitments - - - -Total commitments $4,641 $9,838 $8,324 $22,803
Lease payments recognized as an expense during the year ended December 31, 2016 amounted to $8.4 million (2015 – $21.0 million).

Trican Well Service Ltd.
MD&A Years Ended December 31, 2015 & 2016 | 77
NOTE 21 - IMMATERIAL CORRECTIONSSubsequent to the issuance of the consolidated financial statements for the year ended December 31, 2015, the Company determined that two immaterial errors occurred in those previously issued financial statements:
� In the fourth quarter of 2015, hedged transactions in a cash flow hedging relationship (being foreign exchange gains and losses on the Company’s Series E and Series F Senior Notes) were no longer probable of occurring based on expectations of disposals being pursued by the Company. As a result, the hedging relationship no longer qualified for hedge accounting and, accordingly, in the fourth quarter of 2015, the cumulative loss of $3.9 million previously recognized in other comprehensive income should have been reclassified to reduce foreign exchange gain and increase loss from continuing operations by the same amount; and
� In the third quarter of 2015, the Company determined that cumulative foreign exchange loss of $1.4 million previously recognized in other comprehensive income should have been reclassified to loss from discontinued operations as a result of the sale of its Russian operation.
The Company concluded that these adjustments are not material to the Company’s consolidated financial statements for the year ended December 31, 2015 and has reflected them as immaterial corrections of the comparative financial information in these annual consolidated financial statements.
Deficit at December 31, 2015 has been increased by $5.3 million.
In addition, the Company has presented the carrying amount of the cross currency swaps of $37.2 million at December 31, 2015 as currency derivatives rather than as an adjustment to the related Senior Notes. Changes in fair value of the cross currency swaps commencing the fourth quarter of 2015 have been recognized in profit and loss
NOTE 22- FINANCE INCOME AND COSTS
(stated in thousands) December 31, 2016 December 31, 2015Finance Income Interest income $50 $1,371
Gain on marketable securities 3,069 -
Gain on equity interest in Keane 65,206 -
Total finance income $68,325 $1,371
Finance cost Interest on loans and borrowings $25,790 $42,286
Interest on finance lease 226 714
Total finance cost $26,016 $43,000

Trican Well Service Ltd.
78 | MD&A Years Ended December 31, 2015 & 2016
NOTE 24 – CONTINGENCIESSand Purchase Agreement with Huron Mineral LLCOn November 2, 2016, Trican Well Service L.P. reached an agreement with Huron Minerals LLC to settle its dispute related to a sand purchase agreement. The Company recorded a provision of $8.3 million during the year as the parties agreed to settle this claim for USD $6.35 million. The Company will pay USD $4.0 million on January 5, 2017 and USD $2.35 million on April 3, 2017.
Indemnity Claim in Connection with the Sale of Trican’s US Operations to Keane Group (“Keane”) on March 16, 2016During Q2 2016 Keane delivered an Indemnity Claim stating that Trican owes Keane $3.9 million (USD $3.0 million) due to losses incurred by Keane for assets purchased that were not in good operating condition. Management has not recorded any accrual for this contingent liability associated with this claim based on our belief that a liability is not more likely than not and any range of potential future charge cannot be reasonably estimated at this time.
Other Litigation On August 25, 2015, a class action lawsuit was filed on behalf of 31 plaintiffs against Trican Well Service, L.P. The claim alleges that Trican misclassified the plaintiffs’ position as “exempt” from overtime wages from February 2011 to August 2015, resulting in a loss of overtime wages during this period. Given the information available at these early stages of litigation, management has not recorded any accrual for this contingent liability associated with this claim based on our belief that a liability is not probable and any range of potential future charge cannot be reasonably estimated at this time.
The tax regulations and legislation in the various jurisdictions that the Company operates in are continually changing. As a result, there are usually some tax matters under review. Management believes that it has adequately met and provided for taxes based on the Company’s interpretation of the relevant tax legislation and regulations.
NOTE 25 - EMPLOYEE BENEFIT EXPENSE
(stated in thousands) December 31, 2016 December 31, 2015Wages and salaries $117,209 $181,948
Employee benefits 12,101 22,729
Equity-settled share-based transactions and RSU expense (note 14) 5,608 1,804
Total $134,918 $206,481
NOTE 23 - RELATED PARTY TRANSACTIONSTransactions with Key Management PersonnelIn addition to their salaries, the Company also provides non-cash benefits to directors and executive officers. Executive officers also participate in the Company’s share option program and performance share unit program (see note 14).
Key management personnel compensation comprised
(stated in thousands) 2016 2015Salaries $1,683 $1,619
Share-based awards 1,129 227
Option-based awards 1,227 541
All other compensation 1,102 167
$5,141 $2,554

Trican Well Service Ltd.
MD&A Years Ended December 31, 2015 & 2016 | 79
NOTE 26 – RESEARCH AND DEVELOPMENT COSTS
During the year ended December 31, 2016, Trican incurred $15.2 million (2015 – $34.9 million) in research and development costs.
NOTE 27 – SUBSEQUENT EVENTSOn January 20, 2017, Keane Group, Inc. (NYSE: FRAC) (“Keane”) announced the pricing of its initial public offering of 26,760,000 shares of its common stock at a public offering price of USD $19.00 per share. Of this offering, 15,700,000 shares are being offered by Keane and 11,060,000 shares are being offered by the selling stockholder group, which includes Trican. The selling stockholder group also granted the underwriters a 30-day over-allotment option to purchase up to an additional 4,014,000 shares of Keane’s common stock, which was exercised in full on January 20, 2017. Based on the pricing of USD $19.00 per share of the Keane public offering, Trican’s net proceeds from the secondary offering and exercise of the over-allotment option is expected to be USD $28.4 million.
The selling stockholder group retains 72,354,019 shares of common stock of Keane, including Trican’s ownership interest therein. Trican, as well as all other officers, directors and holders of substantially all common stock of Keane on the date of the offering have entered into lock-up agreements with the underwriters providing that we and they will not, subject to certain exceptions, dispose of or hedge any shares of our common stock or securities convertible into or exchangeable for shares of common stock during the period from the date of this offering continuing through the date that is 180 days after the date of offering unless extended pursuant to the terms of the lock-up agreements.
Trican intends to utilize the net cash proceeds from these transactions to reduce its outstanding debt.
On January 23, 2017, Trican sold the share consideration received in connection with the previously completed transaction with National Oilwell Varco, Inc. (“NOV”) for the sale of Trican’s completion tools business. Trican will realize net proceeds of USD $20.7 million. In addition, Trican and NOV have finalized the adjustment to the purchase price, which resulted in a working capital adjustment of CAD $7.2 million payable to Trican.

BOARD OF DIRECTORSMurray L. Cobbe (4) Chairman
G. Allen Brooks (1) (3) (5) President G. Allen Brooks, LLC
Kenneth M. Bagan (2) (4)
Independent Businessman
Kevin L. Nugent (1) (3) Executive Chairman Hifi Engineering Inc.
Alexander J. Pourbaix (2) (3) Executive Vice President and President TransCanada Corporation
Deborah S. Stein (1) (2) Independent Businesswoman
Dale M. Dusterhoft (4)
President & Chief Executive Officer
OFFICERSDale M. Dusterhoft President & Chief Executive Officer
Michael A. Baldwin, C.A. Senior Vice President, Finance and Chief Financial Officer
Robert J. Cox Vice President, Canadian Geographic Region
(1) Member of the Audit Committee
(2) Member of the Human Resources and Compensation Committee
(3) Member of the Corporate Governance Committee
(4) Member of the Health, Safety and Environment Committee
(5) Lead Director
CORPORATE OFFICETrican Well Service Ltd. 2900, 645 – 7th Avenue S.W. Calgary, Alberta T2P 4G8 Telephone: (403) 266-0202 Facsimile: (403) 237-7716 Website: www.trican.ca
AUDITORSKPMG LLP, Chartered Accountants Calgary, Alberta
BANKERSHSBC Bank Canada Calgary, AB
REGISTRAR AND TRANSFER AGENTComputershare Trust Company of Canada Calgary, Alberta
STOCK EXCHANGE LISTINGThe Toronto Stock Exchange Trading Symbol: TCW
INVESTOR RELATIONS INFORMATIONRequests for information should be directed to:
Dale M. Dusterhoft President & Chief Executive Officer
Michael A. Baldwin, C.A. Senior Vice President, Finance and Chief Financial Officer
CORPORATE INFORMATION