
Management’s Discussion and Analysis - InPlay Oil · Management’s Discussion and Analysis...
22
Management’s Discussion and Analysis December 31, 2016 and 2015
Transcript of Management’s Discussion and Analysis - InPlay Oil · Management’s Discussion and Analysis...

Management’s Discussion and Analysis
December 31, 2016 and 2015
Management’s Discussion and Analysis
1 InPlay Oil Corp.
MANAGEMENT’S DISCUSSION AND ANALYSIS
FOR THE YEARS ENDED DECEMBER 31, 2016 AND 2015
The following management’s discussion and analysis (“MD&A”) is dated March 22, 2016 and should be read in conjunction with the audited financial statements of InPlay Oil Corp. (“InPlay” or the “Company”) for the years ended December 31, 2016 and 2015. The financial statements have been prepared in accordance with International Financial Reporting Standards (“IFRS”) and interpretations of the IFRS Interpretations Committee.
In addition to generally accepted accounting principles (“GAAP”) measures, this MD&A contains additional conversion measures, non-GAAP measures, and forward-looking statements. Readers are cautioned that the MD&A should be read in conjunction with InPlay’s disclosure under the headings “Conversion Measures and Short-Term Production Rates”, “Non-GAAP Measures”, and “Forward-Looking Statements” included at the end of this MD&A.
All references to dollar values are to Canadian dollars unless otherwise stated. Production volumes are measured upon sale unless otherwise noted. Definitions of the abbreviations used in this discussion and analysis are located on the last page of this document.
ABOUT INPLAY
InPlay is a crude oil and natural gas exploration, development and production company with operations in Alberta. InPlay’s strategic plan is to build a sustainable long-term oil and natural gas company. The plan is based on acquiring low decline, high operating netback producing properties with drilling development potential and enhanced oil recovery potential as well as undeveloped lands with exploration and development upside.
On November 7, 2016, a plan of arrangement (the “Arrangement”) involving the predecessor to InPlay (“Prior InPlay”) and Anderson Energy Inc. (“Anderson”), a publicly-traded company listed on the Toronto Stock Exchange (the “TSX”), was completed that constituted a reverse acquisition, including a change of control of Anderson and a business combination of Anderson and Prior InPlay to form a new corporation that now carries on Prior InPlay’s and Anderson’s business and operations under the name “InPlay Oil Corp.”. InPlay has the same directors and management as Prior InPlay. Effective November 10, 2016 the InPlay common shares commenced trading on the TSX under the symbol “IPO” in substitution of the Anderson common shares.
In connection with the Arrangement, Prior InPlay completed a subscription receipt financing for aggregate gross proceeds of approximately $70.3 million (the "InPlay Financing"). The outstanding common shares of Prior InPlay ("Prior InPlay Shares") and subscription receipts ("Prior InPlay Subscription Receipts") issued under the InPlay Financing were, through a series of steps under the Arrangement, exchanged for common shares of InPlay ("InPlay Shares") on the basis of 0.1303 of an InPlay Share for each one (1) Prior InPlay Share and each one (1) Prior InPlay Subscription Receipt previously held (the “InPlay Exchange Ratio”). Holders of Anderson common shares continued to hold one (1) InPlay Share for each one (1) Anderson common share previously held without any action on their part. The number of commons shares for all periods shown in this MD&A were adjusted retrospectively to reflect the InPlay Exchange Ratio.
Also part of the Arrangement noted above, InPlay acquired additional assets from a third party that included undeveloped lands, producing assets and interests in various facilities in the Pembina area of Alberta, Canada (the “Asset Acquisition”).
Since the Arrangement involved a reverse acquisition whereby Prior InPlay acquired control of the business

Management’s Discussion and Analysis
InPlay Oil Corp. 2
of Anderson (the “Corporate Acquisition”), management has prepared the financial statements and this MD&A for the business formerly owned by Prior InPlay under the name of InPlay Oil Corp. The results for periods of the Company prior to November 7, 2016 are those previously reported by Prior InPlay, and beginning November 7, 2016 the results include the contributions from the Corporate Acquisition and Asset Acquisition.
REVIEW OF FINANCIAL RESULTS
Production
Three months ended
December 31 Year ended
December 31
2016 2015 2016 2015
Crude oil (bpd) 1,522 1,593 1,318 1,598
NGL (bpd) 258 50 143 49
Natural gas (Mcfd) 5,592 1,701 2,871 1,305
Total (BOED)(1)
2,712 1,926 1,940 1,865 (1) Barrels of oil equivalent (“BOE”) may be misleading, particularly if used in isolation. Refer to the section entitled “Conversion
Measures” at the end of this MD&A.
Average production volumes in the fourth quarter of 2016 compared to the third quarter of 2016 were as follows:
Three months ended
December 31,
2016 September 30,
2016
Crude oil (bpd) 1,522 1,093
NGL (bpd) 258 92
Natural gas (Mcfd) 5,592 1,654
Total (BOED) 2,712 1,460
Production for the fourth quarter and year ended December 31, 2016 was considerably higher than the third quarter ended September 30, 2016 and the respective comparable periods for 2015 due to the Corporate Acquisition and the Asset Acquisition.
The following table illustrates the impact that both the Corporate Acquisition and the Asset Acquisition had on production for the three months and year ended December 31, 2016 and the comparative periods for 2015:
Crude oil, NGL and natural gas Three months ended
December 31 Year ended
December 31
2016 2015 2016 2015
Properties acquired(1)
(BOED) 1,341 - 337 -
Prior InPlay properties (BOED) 1,371 1,926 1,603 1,865
Total (BOED) 2,712 1,926 1,940 1,865 (1) Results contributed from properties acquired, since November 7, 2016, the date of acquisition.
The Company drilled and completed two gross (1.7 net) wells in the Belly River during the first quarter of 2016 as part of its 2015/2016 winter drilling program. The Company did not resume drilling until late in the fourth quarter of 2016; consequentially, the production for the Prior InPlay properties decreased in the three months and year ended December 31, 2016 over the respective comparative periods, reflecting the natural rates of decline in base production.

Management’s Discussion and Analysis
3 InPlay Oil Corp.
The Company’s 2016 drilling program included 6 gross wells (5.7 net). Two gross (1.7 net) Belly River horizontals were drilled in the first quarter of 2016 and 4 gross (3.9 net) Pembina Cardium horizontals were drilled in the fourth quarter. Two gross (1.9 net) of the Cardium horizontals came on production in late December 2016 while the others did not begin production until mid-February 2017. The drilling and completion program carried over year end with an additional 6 (4.1 net) wells being drilled. These wells are expected to be completed and brought on production through March and April of 2017.
Crude oil and natural gas sales
Three months ended
December 31 Year ended
December 31
(thousands of dollars) 2016 2015 2016 2015
Crude oil and NGL $ 8,863 $ 7,300 $ 25,191 $ 31,367
Natural gas 1,715 355 2,659 1,189
Total crude oil and natural gas sales $ 10,578 $ 7,655 $ 27,850 $ 32,556
Average realized prices
Three months ended
December 31 Year ended
December 31 2016 2015 2016 2015
Crude oil and NGL ($/bbl) $ 58.64 $ 48.31 $ 49.71 $ 52.18
Natural gas ($/Mcf) 3.33 2.27 2.53 2.50
Total ($/BOE) $ 42.40 $ 43.20 $ 39.22 $ 47.84
Prices
Although crude oil and natural gas prices continue to be low in 2016, crude oil prices improved modestly late in 2016. In the fourth quarter of 2016, WTI oil price per bbl averaged $49.33 US, compared to $44.94 US in the third quarter of 2016 and $46.43 US for the fourth quarter of 2015. WTI oil price per bbl averaged $43.40 US for the year ended December 31, 2016 (2015 – $48.80 US)
Differentials between WTI oil prices and prices received in Alberta are volatile due to factors including refining demand and pipeline capacity. InPlay sells its oil at monthly average Edmonton Par prices less quality differentials, transportation and marketing fees. Light, sweet oil differentials between Cushing, Oklahoma and Edmonton, Alberta are affected by transportation and market factors. These differentials averaged $3.12 US per barrel discount for the fourth quarter of 2016, and for the year ended December 31, 2016, $3.20 US discount per barrel (2015 – $3.86 US). Going into 2017, light, sweet oil differentials are expected to remain volatile depending on supply, transportation alternatives, and refining demand.
The Company’s average price for crude oil was $58.64 per bbl for the three months ended December 31, 2016, 14% higher than the third quarter of 2016 price of $51.35 per bbl.
Natural gas prices have continued to remain relatively low, primarily due to high US and Canadian natural gas production and storage levels.
The Company’s average natural gas sales price was $3.33 per Mcf for the three months ended December 31, 2016, 50% higher than the third quarter of 2016 price of $2.22 per Mcf and 47% higher than the fourth quarter of 2015 price of $2.27 per Mcf. For the year ended December 31, 2016, the Company’s average natural gas sales price was $2.53 per Mcf compared to $2.50 per Mcf for 2015.
The following table illustrates the impact that both the Corporate Acquisition and the Asset Acquisition had on crude oil and natural gas sales for the three months and year ended December 31, 2016 and the comparative periods for 2015.

Management’s Discussion and Analysis
InPlay Oil Corp. 4
Crude oil and natural gas sales Three months ended
December 31 Year ended
December 31
(thousands of dollars) 2016 2015 2016 2015
Properties acquired $ 4,455 $ - $ 4,455 $ -
Prior InPlay properties 6,123 7,655 23,395 32,556
Total oil and natural gas sales $ 10,578 $ 7,655 $ 27,850 $ 32,556 (1) Results contributed from properties acquired, since November 7, 2016, the date of acquisition.
Revenues from the acquired properties have a higher percentage of gas production resulting in a lower revenue stream per equivalent unit of production.
Royalties
During the fourth quarter of 2016, adjustments were made to prior years’ gas cost allowance, freehold mineral taxes and other royalties. Oil wells drilled by the Company on Crown lands qualify for royalty incentives that reduce average Crown royalties for periods of up to 36 months from initial production, after which Crown royalties are expected to increase from current levels.
Royalties as a percentage of total oil and natural gas sales are highly sensitive to prices and adjustments to gas cost allowance and so royalty rates can fluctuate from quarter-to-quarter and year-to-year. Royalties, as a percentage of crude oil and natural gas sales and royalties per BOE are as follows:
Three months ended
December 31 Year ended
December 31
2016 2015 2016 2015
Total royalties 8.8% 9.3% 8.9% 9.2%
Total royalties ($/BOE) $ 3.75 $ 4.03 $ 3.48 $ 4.39
The following table illustrates the impact that both the Corporate Acquisition and the Asset Acquisition had on royalties for the three months and year ended December 31, 2016 and the comparative periods for 2015:
Three months ended
December 31 Year ended
December 31
(thousands of dollars) 2016 2015 2016 2015
Properties acquired(1)
$ 411 $ - $ 411 $ -
Prior InPlay properties 525 713 2,057 2,984
Total royalties $ 936 $ 713 $ 2,468 $ 2,984 (1) Results contributed from properties acquired, since November 7, 2016, the date of acquisition.
Derivative contracts
The Company’s production is usually sold using “spot” or near-term contracts, with prices fixed at the time of transfer of custody or on the basis of a monthly average market price. The Company may selectively economically hedge some oil and natural gas sales through the use of various financial derivative forward sales contracts and physical sales contracts. The Company does not apply hedge accounting for these contracts.
At December 31, 2016 the following commodity-based derivative contracts were outstanding and recorded at estimated fair value:
Management’s Discussion and Analysis
5 InPlay Oil Corp.
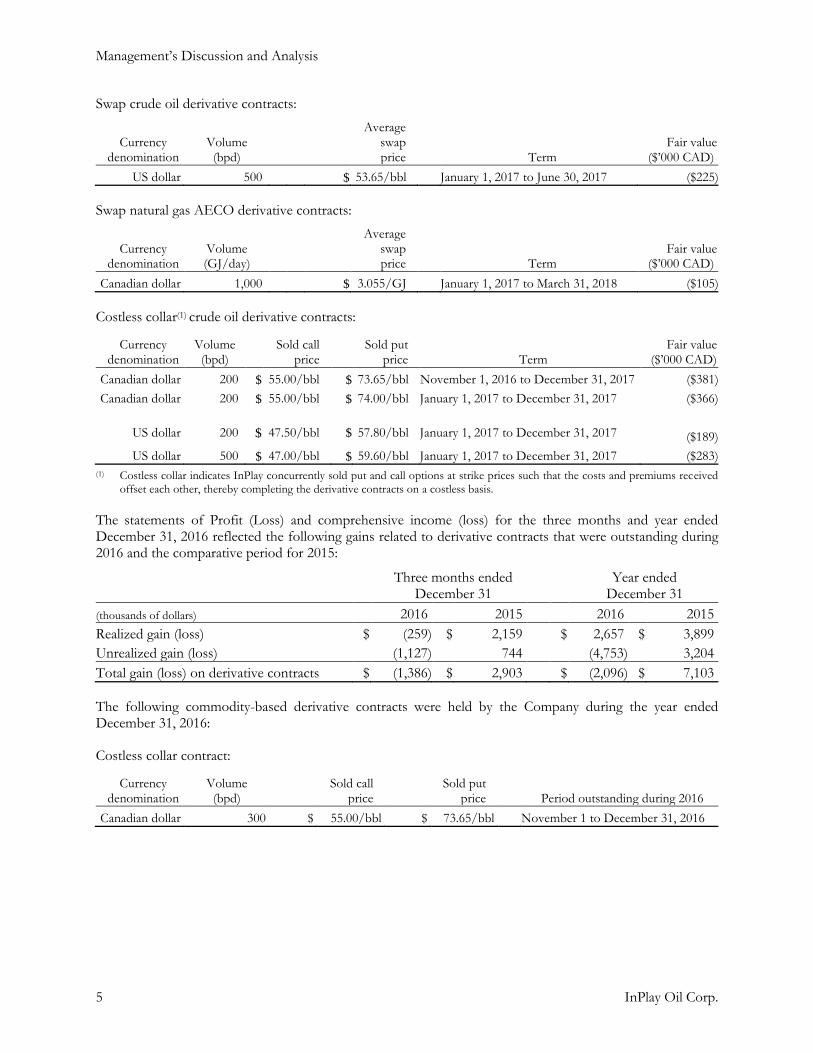
Swap crude oil derivative contracts:
Currency denomination
Volume (bpd)
Average swap price
Term
Fair value ($’000 CAD)
US dollar 500 $ 53.65/bbl January 1, 2017 to June 30, 2017 ($225)
Swap natural gas AECO derivative contracts:
Currency denomination
Volume (GJ/day)
Average swap price
Term
Fair value ($’000 CAD)
Canadian dollar 1,000 $ 3.055/GJ January 1, 2017 to March 31, 2018 ($105)
Costless collar(1) crude oil derivative contracts:
Currency denomination
Volume (bpd)
Sold call price
Sold put price
Term
Fair value ($’000 CAD)
Canadian dollar 200 $ 55.00/bbl $ 73.65/bbl November 1, 2016 to December 31, 2017 ($381)
Canadian dollar 200 $ 55.00/bbl $ 74.00/bbl January 1, 2017 to December 31, 2017 ($366)
US dollar 200 $ 47.50/bbl $ 57.80/bbl January 1, 2017 to December 31, 2017 ($189)
US dollar 500 $ 47.00/bbl $ 59.60/bbl January 1, 2017 to December 31, 2017 ($283)
(1) Costless collar indicates InPlay concurrently sold put and call options at strike prices such that the costs and premiums received offset each other, thereby completing the derivative contracts on a costless basis.
The statements of Profit (Loss) and comprehensive income (loss) for the three months and year ended December 31, 2016 reflected the following gains related to derivative contracts that were outstanding during 2016 and the comparative period for 2015:
Three months ended
December 31 Year ended
December 31
(thousands of dollars) 2016 2015 2016 2015
Realized gain (loss) $ (259) $ 2,159 $ 2,657 $ 3,899
Unrealized gain (loss) (1,127) 744 (4,753) 3,204
Total gain (loss) on derivative contracts $ (1,386) $ 2,903 $ (2,096) $ 7,103
The following commodity-based derivative contracts were held by the Company during the year ended December 31, 2016:
Costless collar contract:
Currency denomination
Volume (bpd)
Sold call price
Sold put price
Period outstanding during 2016
Canadian dollar 300 $ 55.00/bbl $ 73.65/bbl November 1 to December 31, 2016

Management’s Discussion and Analysis
InPlay Oil Corp. 6
Swap crude oil derivative contracts:
Currency denomination
Volume (bpd)
Average swap price
Period outstanding during 2016
Canadian dollar 300 $ 76.25/bbl January 1 to March 31, 2016
Canadian dollar 300 $ 77.30/bbl January 1 to June 30, 2016
US dollar 250 $ 52.10/bbl January 1 to December 31, 2016
US dollar 250 $ 42.00/bbl April 1 to December 31, 2016
US dollar 250 $ 45.35/bbl May 1 to December 31, 2016
Operating and transportation costs
Operating expenses
For the year ended December 31, 2016, operating expenses were $17.36 per BOE (2015 - $16.80 per BOE). For the fourth quarter of 2016, operating expenses were $17.61 per BOE compared to $18.43 per BOE in the third quarter of 2016 and $16.00 per BOE in the fourth quarter of 2015.
Operating expenses for the year ended December 31, 2016 were $12.3 million, approximately 8% higher than $11.4 million for the same period of 2015. Operating expenses for the three months ended December 31, 2016 were $4.4 million compared to $2.5 million for the three months ended September 30, 2016 and $2.8 million for the three months ended December 31, 2015.
The increase in operating expenses for the year ended December 31, 2016 compared to 2015 is mainly due to the Corporate Acquisition and the Asset Acquisition which closed in the fourth quarter of 2016. The table following the discussion of transportation expenses outlines the impact the Arrangement had on operating and transportation expenses reported by InPlay.
Transportation expenses
Transportation expenses include costs incurred to transport processed crude oil, liquids and natural gas products to the point of sale, as well as firm-service take or pay contracts that InPlay has secured directly to transport its natural gas. Expenses incurred to transport production that is not yet in a suitable condition to be shipped on a common-carrier pipeline from the well or battery to a cleaning facility or fractionation plant are included within operating expenses.
For the year ended December 31, 2016, transportation expenses were $0.83 per BOE (2015 – $0.24 per BOE). For the fourth quarter of 2016, transportation expenses were $0.79 per BOE compared to $0.64 per BOE in the third quarter of 2016 and $0.33 per BOE in the fourth quarter of 2015. The Company came into firm service contracts in the fourth quarter of 2016 which were assumed with the closing of the Arrangement and Asset Acquisition in the fourth quarter. These contributed to the increase in transportation expenses for the year ended 2016 relative to 2015. The following table illustrates the impact that both the Corporate Acquisition and the Asset Acquisition had on operating and transportation expenses combined for the three months and year ended December 31, 2016 and the comparative periods for 2015:
Three months ended
December 31 Year ended
December 31
(thousands of dollars) 2016 2015 2016 2015
Properties acquired(1)
$ 1,819 $ - $ 1,819 $ -
Prior InPlay properties 2,771 2,893 11,090 11,594
Total operating and transportation costs $ 4,590 $ 2,893 $ 12,909 $ 11,594 (1) Results contributed from properties acquired, since November 7, 2016, the date of acquisition.

Management’s Discussion and Analysis
7 InPlay Oil Corp.
Operating Netback
Three months ended
December 31 Year ended December 31
(thousands of dollars) 2016 2015 2016 2015
Revenue(1)
$ 10,579 $ 7,655 $ 27,850 $ 32,556
Royalties (936 ) (713 ) (2,468 ) (2,984 )
Operating expenses (4,392 ) (2,834 ) (12,322 ) (11,432 )
Transportation expenses (198 ) (59 ) (587 ) (162 )
Operating netback (2)
$ 5,053 $ 4,049 $ 12,473 $ 17,978
Sales volume (MBOE) 249.5 177.2 710.1 680.6
Per BOE
Revenue(1)
$ 42.40 $ 43.20 $ 39.22 $ 47.84
Royalties (3.75 ) (4.03 ) (3.48 ) (4.39 )
Operating expenses (17.61 ) (16.00 ) (17.36 ) (16.80 )
Transportation expenses (0.79 ) (0.33 ) (0.83 ) (0.24 )
Operating netback per BOE (2)
$ 20.25 $ 22.84 $ 17.55 $ 26.41 (1) Includes royalty and other income classified with oil and natural gas sales. (2) Operating netback and operating netback per BOE are considered non-GAAP measures. Refer to the section entitled “Non-
GAAP Measures” at the end of this MD&A.
Operating netbacks and operating netbacks per boe were lower for the year ended December 31, 2016 compared to the year ended December 31, 2015 largely due to lower revenue from lower commodity prices as well as lower production volumes. This reduction followed the downward trend in crude oil prices over the two periods as well as the reduced sales volumes through 2016 from natural declines and limited driling in the year.
General and administrative expenses
For the year ended December 31, 2016, general and administrative (“G&A”) expenses were $4.5 million ($6.30 per BOE) compared to $4.2 million ($6.15 per BOE) for 2015. G&A expenses were $1.8 million ($7.36 per BOE) for the fourth quarter of 2016 compared to $0.9 million ($6.80 per BOE) in the third quarter of 2016 and $1.1 million ($6.04 per BOE) for the fourth quarter of 2015.
The Company had previously estimated a 15% reduction in 2016 G&A compared to 2015. However, G&A expenses increased substantially in the fourth quarter of 2016 compared to the same period of 2015 due to the additional G&A expenses related to the Arrangement and Asset Acquisition that closed in the fourth quarter of 2016. The higher G&A expenses in the fourth quarter of 2016 were primarily due to the addition of office staff to support the expansion of InPlay’s business and additional compensation expense. The added costs during the fourth quarter of 2016 also led to higher than estimated G&A expenses for the year; as a result, G&A expenses for 2016 increased 7% compared to 2015.
The following table is a reconciliation of the Company’s gross G&A expenditures to general and administrative expenses:

Management’s Discussion and Analysis
InPlay Oil Corp. 8
Three months ended
December 31 Year ended
December 31
(thousands of dollars, except per BOE amounts) 2016 2015 2016 2015
Gross G&A expenditures $ 2,055 $ 1,271 $ 5,307 $ 5,105
Capitalized (218 ) (201 ) (832 ) (920 )
General and administrative expenses $ 1,837 $ 1,070 $ 4,475 $ 4,185
G&A expenses ($/BOE) $ 7.36 $ 6.04 $ 6.30 $ 6.15
% Capitalized 11% 16% 16% 18%
Share-based compensation expenses
The Company accounts for share-based compensation using the fair value method of accounting, and share-based compensation (net of amounts capitalized) is included in the determination loss and comprehensive loss. The Company’s share-based compensation relates to two incentive plans adopted by the Company: a stock option plan pursuant to which options to purchase common shares at specified exercise prices may be granted to directors, officers, employees and service providers of the Company, and a performance warrant incentive plan.
Three months ended
December 31 Year ended
December 31
(thousands of dollars) 2016 2015 2016 2015
Share-based compensation $ 475 $ 691 $ 2,398 $ 4,295
Capitalized portion (107 ) (127 ) (542 ) (970 )
Share-based compensation expense $ 368 $ 564 $ 1,856 $ 3,325
All outstanding stock options and performance warrants were surrendered for cancellation in conjunction with the completion of the Arrangement. As at December 31, 2016, the maximum number of stock options available for grant was 6,239,616. The performance warrant incentive plan has been terminated.
Subsequent to the end of the year, the company issued 4,889,400 stock options that were granted at an average exercise price of $1.98 per share.
Depletion and depreciation
The carrying costs for property, plant and equipment directly associated with crude oil and natural gas operations, including estimated future development costs, are recognized as depletion expense in the statements of loss and comprehensive loss on a unit of production basis over proved plus probable reserves. The carrying costs of office and computer equipment are recognized as depreciation expense in the statements of loss and comprehensive loss on a straight-line or declining-balance basis.
Depletion and depreciation was $13.7 million ($19.33 per BOE) for the year ended December 31, 2016 compared to $16.9 million ($24.86 per BOE) in 2015. Depletion and depreciation was $4.0 million ($15.94 per BOE) in the fourth quarter of 2016 compared to $2.7 million ($20.34 per BOE) in the third quarter of 2016 and $4.0 million ($22.78 per BOE) in the fourth quarter of 2015.
Depletion and depreciation was higher in the fourth quarter of 2016 due to higher volumes of production from the corporate and asset acquisitions associated with the Arrangement. Depletion and depreciation on a per BOE basis was lower, however, as the impairment charges recognized in the fourth quarter of 2015 and the second quarter of 2016 resulted in lower net book values in 2016 subject to depletion and depreciation without a corresponding reduction in proven plus probable reserves volumes.

Management’s Discussion and Analysis
9 InPlay Oil Corp.
Impairment loss
There were no indicators of impairment or reversals of impairment at December 31, 2016. However, InPlay recorded an impairment loss for the three and six month periods ended June 30, 2016.
The significant and sustained declines in forward commodity prices for oil and natural gas prices during 2016 and the market values of assets of potential and actual acquisition targets assessed by the Company were indicators of impairment for both the Company’s cash generating units (“CGUs”) at June 30, 2016. Accordingly, the Company performed impairment tests on all of its CGUs and recorded an impairment loss of $12.2 million (2015 - $38.9 million); the Pembina CGU recorded an $11.3 million impairment loss and the Minors CGU recorded an impairment loss of $0.8 million.
Gain on Acquisition
A gain on acquisition in the amount of $41.4 million was recorded with the Anderson Corporate Acquisition as a result of the deferred tax asset on acquisition being recorded at book value rather than fair value in addition to the fact that final consideration is based upon a lower share price at closing compared to the price contemplated at the time the deal was negotiated.
Finance expenses
Finance expenses were $0.9 million for the fourth quarter of 2016, compared to $0.4 million in the third quarter of 2016 and $0.5 million in the fourth quarter of 2015. Finance expenses were $2.3 million for the year ended December 31, 2016, compared to $2.2 million in the comparable period of 2015.
Three months ended
December 31 Year ended
December 31
(thousands of dollars) 2016 2015 2016 2015
Interest expense on credit facilities $ 357 $ 377 $ 1,517 $ 1,639
Commitment/renewal fee on credit facility 200 60 200 60
Accretion on decommissioning obligations 336 103 566 477
Finance expenses $ 893 $ 540 $ 2,283 $ 2,176
Income taxes
The Company has recognized a deferred tax asset in the amount of $56.1 million at December 31, 2016. The Company recognized a deferred tax recovery of $6.6 million during the year ended December 31, 2016.
The deferred tax asset is supported by the expected future utilization of tax attributes based upon future cashflows derived from the company’s independent year end reserve report using the total proven and probable cashflows and expenditures and factoring in expected corporate general and administrative and interest expenses.
InPlay is not currently cash taxable and had the following estimated Canadian federal income tax pool balances at December 31, 2016.
Non-capital loss carryforward balances $ 59,163 Share issue costs 3,601 Canadian Exploration Expenses (CEE) 64,522 Canadian Development Expenses (CDE) 45,079 Canadian Oil and Gas Property Expenses (COGPE) 153,461 Undepreciated Capital Cost (UCC) 46,361
Total $ 372,187
Management’s Discussion and Analysis
InPlay Oil Corp. 10
Based on current projections, the Company does not expect to be subject to cash income tax within the next five years.
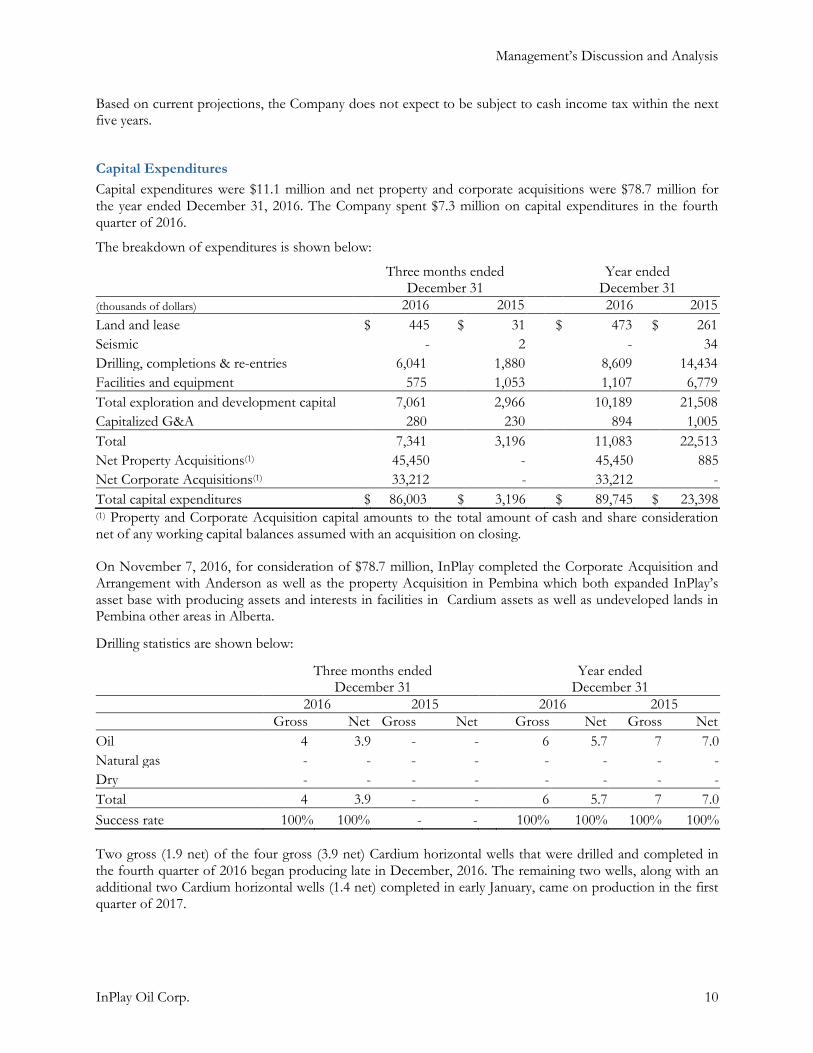
Capital Expenditures
Capital expenditures were $11.1 million and net property and corporate acquisitions were $78.7 million for the year ended December 31, 2016. The Company spent $7.3 million on capital expenditures in the fourth quarter of 2016.
The breakdown of expenditures is shown below:
Three months ended
December 31 Year ended
December 31
(thousands of dollars) 2016 2015 2016 2015
Land and lease $ 445 $ 31 $ 473 $ 261
Seismic - 2 - 34
Drilling, completions & re-entries 6,041 1,880 8,609 14,434
Facilities and equipment 575 1,053 1,107 6,779
Total exploration and development capital 7,061 2,966 10,189 21,508
Capitalized G&A 280 230 894 1,005
Total 7,341 3,196 11,083 22,513
Net Property Acquisitions(1) 45,450 - 45,450 885
Net Corporate Acquisitions(1) 33,212 - 33,212 -
Total capital expenditures $ 86,003 $ 3,196 $ 89,745 $ 23,398 (1) Property and Corporate Acquisition capital amounts to the total amount of cash and share consideration net of any working capital balances assumed with an acquisition on closing.
On November 7, 2016, for consideration of $78.7 million, InPlay completed the Corporate Acquisition and Arrangement with Anderson as well as the property Acquisition in Pembina which both expanded InPlay’s asset base with producing assets and interests in facilities in Cardium assets as well as undeveloped lands in Pembina other areas in Alberta.
Drilling statistics are shown below:
Three months ended
December 31 Year ended
December 31
2016 2015 2016 2015
Gross Net Gross Net Gross Net Gross Net
Oil 4 3.9 - - 6 5.7 7 7.0
Natural gas - - - - - - - -
Dry - - - - - - - -
Total 4 3.9 - - 6 5.7 7 7.0
Success rate 100% 100% - - 100% 100% 100% 100%
Two gross (1.9 net) of the four gross (3.9 net) Cardium horizontal wells that were drilled and completed in the fourth quarter of 2016 began producing late in December, 2016. The remaining two wells, along with an additional two Cardium horizontal wells (1.4 net) completed in early January, came on production in the first quarter of 2017.
Management’s Discussion and Analysis
11 InPlay Oil Corp.
The Company expects to drill, complete, and bring on production five gross (3.7 net) additional wells prior to the end of the first quarter or early into the second quarter.
SHARE INFORMATION
The Company’s shares are listed on the Toronto Stock Exchange under the symbol IPO.
As of March 22, 2017, there were 62,396,169 common shares outstanding and 4,889,400 stock options that were convertible into, or exercisable or exchangeable for, common shares or other equity of the Company. All previously held Prior InPlay outstanding stock options and performance warrants were cancelled in conjunction with the completion of the Arrangement on November 7, 2016.
RELATED PARTY TRANSACTIONS
InPlay had related party transactions that were entered into under the normal course of business for the year ended December 31, 2016.
A director of the Company is an executive officer of a corporation to which the Company made office lease payments in the amount of $0.4 million during the year ended December 31, 2016 (2015 - $0.4 million). The lease term ended in November, 2016 and no amounts remained outstanding as at December 31, 2016.
Several members of InPlay’s board of directors and executive management participated in the InPlay Financing described in note 13. 283,402 common shares were acquired and 30,000 flow-through common shares were acquired for proceeds of $652,500 and $35,000 respectively. These share offerings were done under the same terms and conditions as the other participants as described in note 13.
LIQUIDITY AND CAPITAL RESOURCES
The Company’s policy is to maintain a strong capital base for the objectives of maintaining financial flexibility which will allow it to fund its ongoing capital expenditure program, provide creditor and market confidence and to sustain the future development of the business. The Company is able to maintain high funds flow netbacks even while facing low commodity prices which in turn provides strong cash flows which assist in managing its working capital and capital requirements.
The Company concluded a financing in conjunction with the closing of the Arrangement that included common share issuances totaling $70.3 million of gross proceeds. The proceeds were used to fund the acquisitions that were part of the Arrangement, to incur qualifying exploration and development expenditures, to reduce indebtedness, and for general working capital purposes.
At December 31, 2016, the Company has a $60.0 million senior secured revolving credit facility (the “Credit Facility”) with a syndicate of Canadian financial institutions (the “Lenders”). The Credit Facility consists of a $50 million revolving line of credit and a $10 million operating line of credit. The Credit Facility has a term date of May 31, 2017, and if not extended, additional advances would not be permitted and any outstanding advances would become repayable one year later on May 31, 2018. The Credit Facility is secured by a floating charge debenture and a general security agreement on the assets of the Company. At December 31, 2016 the
Company had drawn $29.8 million on the credit facility.
In addition, the Company had a working capital (deficit) of ($4.8) million. The Company expects to have a higher level of current liabilities due to the increased amounts of accounts payable and accrued liabilities related to the active drilling program underway at year end. There are standard reporting covenants under the credit facility however there are no financial covenants.
Management’s Discussion and Analysis
InPlay Oil Corp. 12
OFF-BALANCE SHEET ARRANGEMENTS
The Company had no guarantees or off-balance sheet arrangements other than as described below under “Contractual Obligations.”
CONTRACTUAL OBLIGATIONS
The Company enters into various contractual obligations in the course of conducting its operations. At December 31, 2016, these obligations include:
Loan agreement – The reserves-based, extendable, committed-term credit facility has a term date of May 31, 2017. If not extended, any outstanding advances would become repayable on May 31, 2018.
Firm service transportation commitments – The Company has entered into firm service transportation agreements. Fees related to transportation periods subsequent to December 31, 2016 were not recognized as a liability at December 31, 2016.
Flow-through share capital commitments – As at December 31, 2016, the Company had $1.7 million remaining of its commitment to incur qualifying exploration and development expenditures related to the $3.8 million raised from the issuance of flow-through shares in conjunction with the closing of the Arrangement on November 7, 2016. These remaining commitments were not recognized as liabilities at December 31, 2016. The Company expects to incur this remaining expenditure in 2017.
Other capital commitments – As at December 31, 2016, the Company also had contractual and constructive commitments for future capital expenditures of $0.5 million related to the drilling program that were not recognized as a liability. The commitments were completed and the capital expenditures recognized upon performance of the contracted services during the first quarter of 2017.
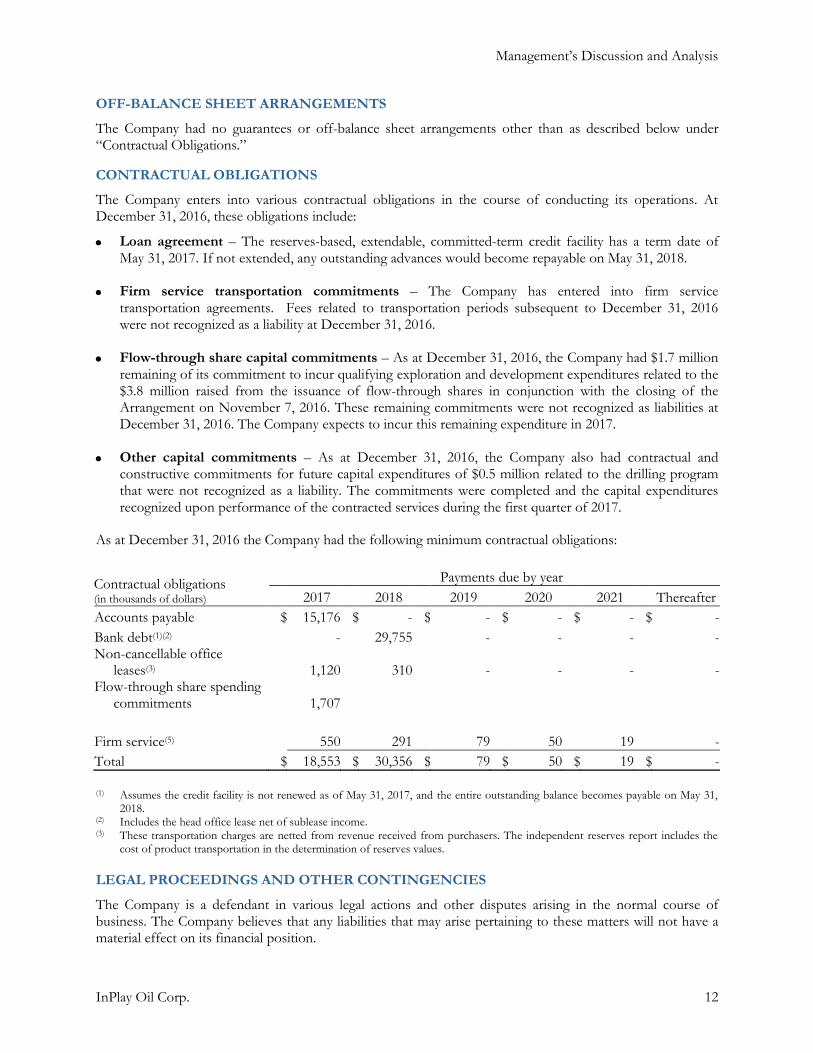
As at December 31, 2016 the Company had the following minimum contractual obligations:
(1) Assumes the credit facility is not renewed as of May 31, 2017, and the entire outstanding balance becomes payable on May 31,
2018. (2) Includes the head office lease net of sublease income. (3) These transportation charges are netted from revenue received from purchasers. The independent reserves report includes the
cost of product transportation in the determination of reserves values.
LEGAL PROCEEDINGS AND OTHER CONTINGENCIES
The Company is a defendant in various legal actions and other disputes arising in the normal course of business. The Company believes that any liabilities that may arise pertaining to these matters will not have a material effect on its financial position.
Contractual obligations (in thousands of dollars)
Payments due by year
2017 2018 2019 2020 2021 Thereafter
Accounts payable $ 15,176 $ - $ - $ - $ - $ -
Bank debt(1)(2) - 29,755 - - - - Non-cancellable office
leases(3) 1,120 310 - - - - Flow-through share spending
commitments 1,707
Firm service(5) 550 291 79 50 19 -
Total $ 18,553 $ 30,356 $ 79 $ 50 $ 19 $ -

Management’s Discussion and Analysis
13 InPlay Oil Corp.
CRITICAL ACCOUNTING ESTIMATES
The Company’s significant accounting policies are disclosed in note 3 to the financial statements. Certain accounting policies require that management make appropriate decisions with respect to the formulation of estimates and assumptions that affect the reported amounts of assets, liabilities, revenues and expenses. These accounting policies are discussed below and are included to aid the reader in assessing the critical accounting policies and practices of the Company and the likelihood of materially different results than reported. The Company’s management reviews its estimates regularly. The emergence of new information and changed circumstances may result in actual results that differ materially from current estimates.
Oil and natural gas reserves
Proved and probable reserves, as defined by the Canadian Securities Administrators in NI 51-101 with reference to the COGE Handbook, are estimated using independent reserves evaluator reports and represent the estimated quantities of crude oil, natural gas and natural gas liquids which geological, geophysical and engineering data demonstrate with a specified degree of certainty to be recoverable in future years from known reservoirs and which are considered commercially producible. There should be a 50% statistical probability that the actual quantity of recoverable reserves will be more than the amount estimated as proved and probable and a 50% statistical probability that it will be less. The equivalent statistical probabilities for the proved component of proved and probable reserves are 90% and 10%, respectively. Determination of reserves is a complex process involving judgments, estimates and decisions based on available geological, engineering, production and any other relevant data. These estimates are subject to material change as economic conditions change and ongoing production and development activities provide new information.
Purchase price allocations and calculations of depletion and depreciation, impairment loss and deferred income tax assets are based on estimates of oil and natural gas reserves. Reserves estimates are based on engineering data, estimated future prices, expected future rates of production and timing of future capital expenditures. By their nature, these estimates are subject to measurement uncertainties and interpretations and the impact on the financial statements could be material. The Company expects that over time, its reserves estimates will be revised upward or downward based on updated information such as the results of future drilling, testing and production levels and may be affected by changes in commodity prices.
Recoverable amounts of CGUs
The recoverable amount of a CGU used in the assessment of impairment is the greater of its value-in-use (“VIU”) and its fair value less costs to sell (“FVLCTS”). VIU is determined by estimating the present value of the future net cash flows from the continued use of the CGU, and is subject to the risks associated with estimating the value of reserves. FVLCTS refers to the amount obtainable from the sale of a CGU in an arm’s length transaction between knowledgeable, willing parties, less costs of disposal. The criteria used in the estimation of this amount are discussed in note 5 to the financial statements.
Both VIU and FVLCTS estimates include the estimated reserves values in their determination. The key assumptions and estimates of the value of oil and natural gas reserves and the existing and potential markets for the Company’s oil and natural gas assets are made at the time of reserves estimation and market assessment and are subject to change as new information becomes available. Changes in international and regional factors, including supply and demand of commodities, inventory levels, drilling activity, currency exchange rates, weather, geopolitical and general economic environment factors, may result in significant changes to the estimated recoverable amounts of CGUs.
Decommissioning obligations
The Company is required to set up a provision for future removal and site restoration costs. The Company must estimate these costs in accordance with existing laws, contracts or other policies. These estimated costs are charged to property, plant and equipment and the appropriate liability account over the expected service life of the asset. The estimate of future removal and site restoration costs involves a number of estimates related to timing of abandonment, determination of the economic life of the asset, costs associated with

Management’s Discussion and Analysis
InPlay Oil Corp. 14
abandonment and site restoration, discount rates and review of potential abandonment methods.
Income taxes
The determination of the Company’s income and other tax assets and liabilities requires interpretation of complex laws and regulations often involving multiple jurisdictions. All tax filings are subject to audit and potential reassessment after the lapse of considerable time. Accordingly, the actual income tax asset or liability may differ from that estimated and recorded by management. The Company estimates its future income tax rate in calculating its future income tax asset or liability. Various assumptions are made in assessing when temporary differences will reverse and this may impact the rate used.
NEW AND PENDING ACCOUNTING STANDARDS
Standards that are issued and that the Company reasonably expects to be applicable at a future date are listed below.
IFRS 9 “Financial Instruments”. On July 24, 2015 the IASB issued the complete IFRS 9 (“IFRS 9 (2015)”). The mandatory effective date of IFRS 9 is for annual periods beginning on or after January 1, 2018 and must be applied retrospectively with some exemptions. Early adoption is permitted. The restatement of prior periods is not required and is only permitted if information is available without the use of hindsight. IFRS 9 (2015) introduces new requirements for the classification and measurement of financial assets. Under IFRS 9 (2015), financial assets are classified and measured based on the business model in which they are held and the characteristics of their contractual cash flows. The standard introduces additional changes relating to financial liabilities. It also amends the impairment model by introducing a new ‘expected credit loss’ model for calculating impairment. IFRS 9 (2015) also includes a new general hedge accounting standard which aligns hedge accounting more closely with risk management. This new standard does not fundamentally change the types of hedging relationships or the requirement to measure and recognize ineffectiveness, however it will provide more hedging strategies that are used for risk management to qualify for hedge accounting and introduce more judgment to assess the effectiveness of a hedging relationship. The Company intends to adopt IFRS 9 (2015) in its financial statements for the annual period beginning on January 1, 2018. The extent of the impact of the adoption of this standard has not yet been determined.
IFRS 15 “Revenue from Contracts with Customers”. In May 2015, the IASB issued IFRS 15 Revenue from Contracts with Customers (“IFRS 15”). The new standard is effective for annual periods beginning on or after January 1, 2018. Earlier adoption is permitted. The standard contains a single model that applies to contracts with customers and two approaches to recognizing revenue: at a point in time or over time. The model features a contract-based five-step analysis of transactions to determine whether, how much and when revenue is recognized. New estimates and judgmental thresholds have been introduced, which may affect the amount and/or timing of revenue recognized. The new standard applies to contracts with customers. It does not apply to insurance contracts, financial instruments or lease contracts, which fall in the scope of other IFRSs. The Company intends to adopt IFRS 15 in its financial statements for the annual period beginning on January 1, 2018. The extent of the impact of the adoption of this standard has not yet been determined.
IFRS 16 “Leases”. On January 13, 2016 the IASB issued IFRS 16 Leases. For lessees applying IFRS 16, a single recognition and measurement model for leases would apply, with required recognition of assets and liabilities for most leases. Certain short-term leases (less than 12 months) and leases of low-value assets are exempt from the requirements, and may continue to be treated as operating leases. The standard will come into effect for annual periods beginning on or after January 1, 2019 with earlier adoption permitted. The Company intends to adopt IFRS 16 in its financial statements for the annual periods beginning on January 1, 2019. The extent of the impact of the adoption of this standard has not yet been determined.
CHANGES IN ACCOUNTING POLICIES
There were no new or amended accounting standards or interpretations adopted in 2016.
Management’s Discussion and Analysis
15 InPlay Oil Corp.
CONTROLS AND PROCEDURES
December 31, 2016 is the Company’s first financial period following the completion of its reverse takeover of Anderson Energy Inc. (also known under IFRS as a ‘reverse acquisition’) and the Company was not a reporting issuer immediately before the reverse takeover.
Accordingly, in contrast to the full annual certificate required for non-venture issuers under National Instrument 52-109 – Certification of Disclosure in Issuer’s Annual and Interim filings (“NI-52-109”), the Company will file the alternative Form 52-109F1 – IPO/RTO for the year ended December 31, 2016 on the regulatory reporting website for the System for Electronic Document Analysis and Retrieval (“SEDAR”). Form 52-109F1 – IPO/RTO does not include representations relating to the establishment and maintenance of disclosure controls and procedures (“DC&P”) and internal control over financial reporting (“ICFR”), as defined in NI 52-109.
In particular, the Chief Executive Officer and the Chief Financial Officer (the Company’s “Certifying Officers”), did not make any representations relating to the establishment and maintenance of controls and other procedures designed to provide reasonable assurance that information required to be disclosed by the Company in its annual filings and other reports filed or submitted under securities legislation is recorded, processed, summarized and reported within the time periods specified in securities legislation; and a process to provide reasonable assurance regarding the reliability of financial reporting and the preparation of financial statements for external purposes in accordance with IFRS. However, the Certifying Officers did ensure that processes were in place to provide them with sufficient knowledge to support the representations they made in the certificates.
It should be noted that inherent limitations on the ability of the Certifying Officers to design and implement on a cost effective basis DC&P and ICFR as defined in NI 52-109 in the first financial period following the completion of the reverse takeover, since the Company was not a reporting issuer immediately before the reverse takeover, may result in additional risks to the quality, reliability, transparency and timeliness of the annual filings and other reports provided under securities legislation.
BUSINESS RISKS
Oil and natural gas exploration and production is capital intensive and involves a number of business risks including, without limitation, the uncertainty of finding new reserves, the instability of commodity prices, weather, and various operational risks. Commodity prices are influenced by local and worldwide supply and demand, OPEC actions, ongoing global economic concerns, the US dollar exchange rate, transportation costs, political stability, and seasonal and weather-related changes to demand. The concern over increasing US natural gas production, driven primarily by the US shale gas plays, continues to depress the natural gas futures market. Oil prices declined sharply in the latter part of 2015 and throughout 2016 and into 2017, and continue to remain volatile as oil is a geopolitical commodity, affected by concerns about global economic markets, continued instability in oil producing countries and increases in production from US tight oil plays. Differentials between WTI oil prices and prices received in Alberta are volatile. The industry is subject to extensive governmental regulation with respect to the environment. Over the past year, several new environmental regulations at both the Federal and Provincial level were announced, though the details of how some of the regulations will be implemented have yet to be released. Operational risks include well performance, uncertainties inherent in estimating reserves, timing of/ability to obtain and maintain drilling licences and other regulatory approvals, ability to obtain equipment, expiration of licences and leases, competition from other producers, third-party transportation and processing disruption issues, sufficiency of insurance, ability to manage growth, reliance on key personnel, third party credit risk and appropriateness of accounting estimates. These risks are described in more detail in the Company’s most recent AIF filed with certain Canadian securities regulatory authorities on SEDAR at www.sedar.com.
The Company makes substantial capital expenditures for the acquisition, exploration, development and

Management’s Discussion and Analysis
InPlay Oil Corp. 16
production of oil and natural gas reserves. As the Company’s revenues may decline as a result of decreased commodity pricing, it may be required to reduce capital expenditures. In addition, uncertain levels of near-term industry activity coupled with the present global economic concerns exposes the Company to additional access-to-capital risk. There can be no assurance that debt or equity financing, or funds generated by operations, will be available or sufficient to meet these requirements or for other corporate purposes or, if debt or equity financing is available, that it will be on terms acceptable to the Company. The inability of the Company to access sufficient capital for its operations could have a material adverse effect on the Company’s business, financial condition, results of operations and prospects.
InPlay manages these risks by employing competent and professional staff, following sound operating practices and using capital prudently. The Company generates its exploration and development prospects internally and performs extensive geological, geophysical, engineering, and environmental analysis before committing to the drilling of new prospects. InPlay seeks out and employs new technologies where possible. With the Company’s extensive potential drilling opportunities and advance planning, the Company believes it can manage the slower pace of regulatory approvals and the requirements for extensive landowner consultation.
The Company has a formal emergency response plan which details the procedures employees and contractors will follow in the event of an operational emergency. The emergency response plan is designed to respond to emergencies in an organized and timely manner so that the safety of employees, contractors, residents in the vicinity of field operations, the general public and the environment are protected. A corporate safety program covers hazard identification and control on the jobsite, establishes Company policies, rules and work procedures and outlines training requirements for employees and contract personnel.
The Company currently deals with a small number of buyers and sales contracts, and endeavours to ensure that those buyers are an appropriate credit risk. The Company continuously evaluates the merits of entering into fixed price or financial hedge contracts for price management.
The oil and natural gas business is subject to regulation and intervention by governments in such matters as the awarding of exploration and production interests, the imposition of specific drilling obligations, environmental protection controls, control over the development and abandonment of fields (including restrictions on production) and possibly expropriation or cancellation of contract rights. As well, governments may regulate or intervene with respect to prices, taxes, royalties, transportation and the exportation of oil and natural gas. Such regulation may be changed from time to time in response to economic or political conditions. The implementation of new regulations or the modification of existing regulations affecting the oil and natural gas industry could reduce demand for oil and natural gas, increase the Company’s costs, impact the Company’s ability to get its product to market, or affect its future opportunities. Over the last year, the Alberta provincial government has published its Royalty Review Advisory Panel Report. The details for implementing the recommendations have yet to be announced.
The oil and natural gas industry is currently subject to environmental regulations pursuant to a variety of provincial and federal legislation. Such legislation provides for restrictions and prohibitions on the release or emission of various substances produced in association with certain oil and natural gas industry operations. Such legislation may also impose restrictions and prohibitions on water use or processing in connection with certain oil and natural gas operations. In addition, such legislation requires that well and facility sites be abandoned and reclaimed to the satisfaction of provincial authorities. Compliance with such legislation can require significant expenditures and a breach of such requirements may result in, amongst other things, suspension or revocation of necessary licenses and authorizations, civil liability for pollution damage, and the imposition of material fines and penalties.
OUTLOOK
The InPlay team has put together a premier light, oil-weighted asset base highlighted by large oil in place, low recovery factors, low declines, long-reserve life and a large inventory of high rate of return drilling locations. Capital expenditures for 2017 are forecasted to be approximately $28 million which will encompass a 15 well (12.0 net) drilling program.

Management’s Discussion and Analysis
17 InPlay Oil Corp.
Since completion of its transformative transaction in November, 2016, the Company’s drilling program has achieved an average duration of eight days from spud to rig release. InPlay’s commitment to cost control, operational efficiencies and the use of innovative technologies has resulted in average costs of $1.65 million to drill, complete, equip, and tie-in InPlay’s first two, one mile long horizontal wells brought on production in late December 2016.
SELECTED QUARTERLY INFORMATION
The following table provides financial and operating results for the last eight quarters. Commodity prices
remain volatile, affecting funds flow from operations and profit (loss) throughout those quarters.
The dramatic decrease in commodity prices late in 2015 and early 2016 led to a significant decrease in
revenues, cash from operating activities, and funds flow from operations for the first three quarters of 2016.
The impact of lower commodity prices also led to a recognition of impairment losses of $25.1 million and
$13.1 million in profit (loss) in the third quarter and fourth quarter of 2015 respectively, and an impairment
loss of $12.2 million in the second quarter of 2016.
In the second quarter of 2015 InPlay completed an acquisition of a minority partner’s interest in producing
oil and gas properties in the Pembina area for consideration of $0.8 million that resulted in the recognition of
a gain on acquisition in the amount of $0.4 million. The Company drilled 2.0 net horizontal wells in the
quarter.
In the third quarter of 2015, the Company drilled 5.0 net horizontal wells, two of which were completed in
August, 2015 and three in October, 2015.
InPlay continued its development activity in the first quarter of 2016 drilling, completing and equipping two
(1.73 net) Belly River horizontal wells.
In the second quarter of 2016 InPlay recorded an impairment in the amount of $12.1 million.
In the fourth quarter of 2016 In Play successfully completed a private placement financing raising $70.3
million, closed on an asset acquisition in it’s core Pembina area and completed an plan of arrangement with
Anderson Energy Inc. which resulted in InPlay becoming publicly listed on the Toronto Stock Exchange.
The Asset Acquisition and Arrangement were treated as business combinations in the quarter.
SELECTED QUARTERLY INFORMATION
($ amounts in thousands, except per share amounts and prices) Q4 2016 Q3 2016 Q2 2016 Q1 2016
Oil and natural gas sales $ 10,578 $ 5,682 $ 6,377 $ 5,213 Oil and natural gas sales, net of royalties $ 9,642 $ 5,150 $ 5,874 $ 4,716 Profit (loss) $ 36,077 $ (1,538) $ (11,691) $ (2,829) Profit (loss) per share, basic and diluted(3) $ 0.86 $ (0.13) $ (0.97) $ (0.23) Cash from (used in) operating activities $ 845 $ (1,527) $ 2,919 $ 3,063 Funds flow from operations $ (29) $ 1,331 $ 2,177 $ 2,928 Funds flow from operations per share, basic and diluted(3) $ 0.00 $ 0.11 $ 0.18 $ 0.24 Net debt(2) $ 34,556 $ 56,564 $ 57,643 $ 57,594
Management’s Discussion and Analysis
InPlay Oil Corp. 18
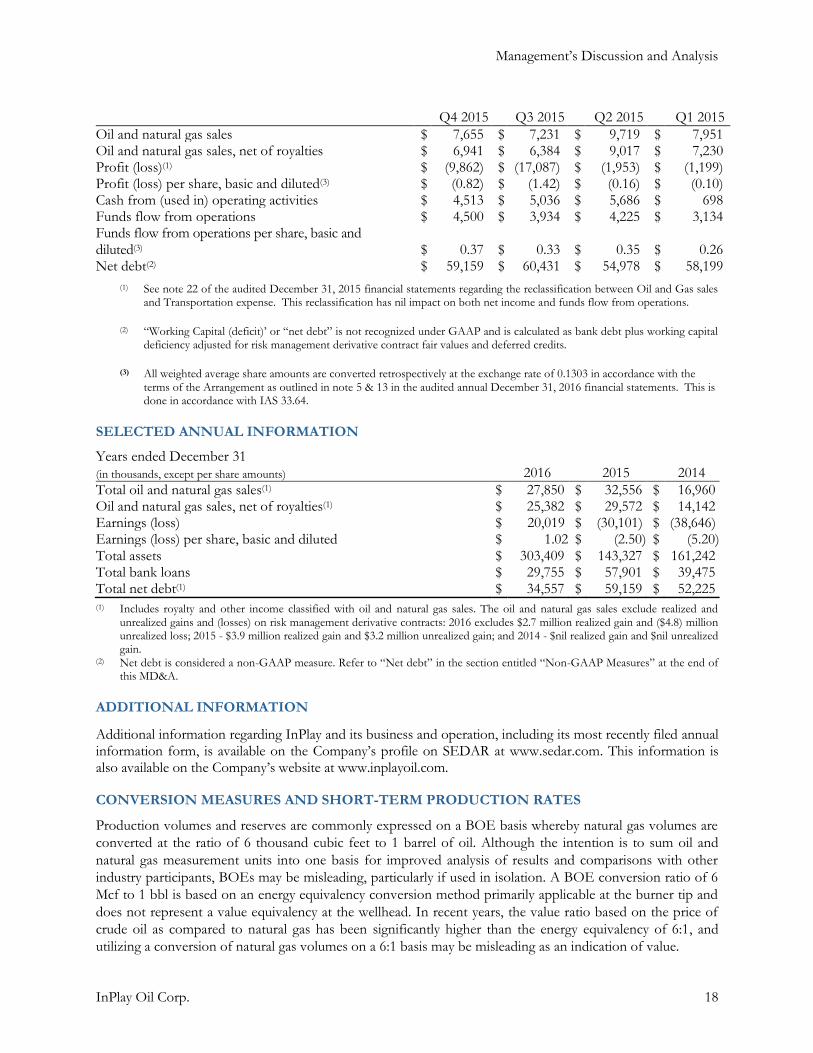
Q4 2015 Q3 2015 Q2 2015 Q1 2015
Oil and natural gas sales $ 7,655 $ 7,231 $ 9,719 $ 7,951 Oil and natural gas sales, net of royalties $ 6,941 $ 6,384 $ 9,017 $ 7,230 Profit (loss)(1) $ (9,862) $ (17,087) $ (1,953) $ (1,199) Profit (loss) per share, basic and diluted(3) $ (0.82) $ (1.42) $ (0.16) $ (0.10) Cash from (used in) operating activities $ 4,513 $ 5,036 $ 5,686 $ 698 Funds flow from operations $ 4,500 $ 3,934 $ 4,225 $ 3,134 Funds flow from operations per share, basic and diluted(3)
$
0.37
$
0.33
$
0.35
$
0.26
Net debt(2) $ 59,159 $ 60,431 $ 54,978 $ 58,199
(1) See note 22 of the audited December 31, 2015 financial statements regarding the reclassification between Oil and Gas sales and Transportation expense. This reclassification has nil impact on both net income and funds flow from operations.
(2) “Working Capital (deficit)’ or “net debt” is not recognized under GAAP and is calculated as bank debt plus working capital deficiency adjusted for risk management derivative contract fair values and deferred credits.
(3) All weighted average share amounts are converted retrospectively at the exchange rate of 0.1303 in accordance with the terms of the Arrangement as outlined in note 5 & 13 in the audited annual December 31, 2016 financial statements. This is done in accordance with IAS 33.64.
SELECTED ANNUAL INFORMATION
Years ended December 31
(in thousands, except per share amounts) 2016 2015 2014
Total oil and natural gas sales(1) $ 27,850 $ 32,556 $ 16,960 Oil and natural gas sales, net of royalties(1) $ 25,382 $ 29,572 $ 14,142 Earnings (loss) $ 20,019 $ (30,101) $ (38,646) Earnings (loss) per share, basic and diluted $ 1.02 $ (2.50) $ (5.20) Total assets $ 303,409 $ 143,327 $ 161,242 Total bank loans $ 29,755 $ 57,901 $ 39,475 Total net debt(1) $ 34,557 $ 59,159 $ 52,225 (1) Includes royalty and other income classified with oil and natural gas sales. The oil and natural gas sales exclude realized and
unrealized gains and (losses) on risk management derivative contracts: 2016 excludes $2.7 million realized gain and ($4.8) million unrealized loss; 2015 - $3.9 million realized gain and $3.2 million unrealized gain; and 2014 - $nil realized gain and $nil unrealized gain.
(2) Net debt is considered a non-GAAP measure. Refer to “Net debt” in the section entitled “Non-GAAP Measures” at the end of this MD&A.
ADDITIONAL INFORMATION
Additional information regarding InPlay and its business and operation, including its most recently filed annual information form, is available on the Company’s profile on SEDAR at www.sedar.com. This information is also available on the Company’s website at www.inplayoil.com.
CONVERSION MEASURES AND SHORT-TERM PRODUCTION RATES
Production volumes and reserves are commonly expressed on a BOE basis whereby natural gas volumes are
converted at the ratio of 6 thousand cubic feet to 1 barrel of oil. Although the intention is to sum oil and
natural gas measurement units into one basis for improved analysis of results and comparisons with other
industry participants, BOEs may be misleading, particularly if used in isolation. A BOE conversion ratio of 6
Mcf to 1 bbl is based on an energy equivalency conversion method primarily applicable at the burner tip and
does not represent a value equivalency at the wellhead. In recent years, the value ratio based on the price of
crude oil as compared to natural gas has been significantly higher than the energy equivalency of 6:1, and
utilizing a conversion of natural gas volumes on a 6:1 basis may be misleading as an indication of value.

Management’s Discussion and Analysis
19 InPlay Oil Corp.
Short-term production rates can be influenced by flush production effects from fracture stimulations in
horizontal wellbores and may not be indicative of longer-term production performance or reserves.
Individual well performance may vary.
NON-GAAP MEASURES
Included in this document are references to the terms “funds flow from operations”, “funds flow from
operations per BOE”, “operating netback,” “operating netback per share” and “net debt”. Management
believes these measures are helpful supplementary measures of financial performance and provide users with
similar, but potentially not comparable, information that is commonly used by other oil and natural gas
companies. These terms do not have any standardized meaning prescribed by GAAP and should not be
considered an alternative to, or more meaningful than, “net cash flow from operations”, “profit (loss) before
taxes” or “profit (loss) and comprehensive profit (loss)”, or assets and liabilities as determined in accordance
with GAAP as a measure of the Company’s performance and financial position.
Operating netback is calculated as oil and natural gas sales plus applicable realized gains/losses on derivative
contracts less royalties, operating expenses and transportation expenses and is a measure of the profitability
of operations before administrative, share-based compensation, financing and other non-cash items.
Net debt is calculated as the amount of outstanding bank loans plus current assets plus current liabilities, less
the impact of derivative contracts and deferred lease payments. See note 21 to the Company’s audited
financial statements for the years ended December 31, 2016 and 2015.
InPlay considers funds flow from operations to be an important measure of InPlay’s ability to generate the funds necessary to finance capital expenditures. All references to funds flow from operations throughout this MD&A are based on funds flow provided by operating activities before the change in non-cash working capital and decommissioning expenditures since InPlay believes the timing of collection, payment or incurrence of these items involves a high degree of discretion and as such may not be useful for evaluating InPlay’s operating performance. A reconciliation of cash provided by operating activities to funds flow from operations is as follows:
Three months ended December 31
Year ended December 31
(thousands of dollars) 2016 2015 2016 2015
Cashflow provided by operating activities
$ 845 $ 4,513 $ 5,300 $ 15,932
Changes in non-cash working capital
(874) (13 ) 1,107 (140 )
Funds flow from operations(1)
$ (29) $ 4,500 $ 6,407 $ 15,792
FORWARD-LOOKING STATEMENTS
This MD&A contains certain forward-looking statements and forward-looking information (collectively
referred to herein as "forward-looking statements") within the meaning of applicable Canadian securities
laws. All statements other than statements of present or historical fact are forward-looking statements.
Forward-looking information is often, but not always, identified by the use of words such as "anticipate",
"believe", "plan", "intend", "objective", "continuous", "ongoing", "estimate", "expect", "may", "will",
"project", "should", or similar words suggesting future outcomes. In particular, this MD&A contains forward-
looking statements relating, but not limited, to:
• drilling and development plans, including incurring qualifying exploration and development
expenditures related to the flow-through shares issued in 2016, and the timing thereof;
Management’s Discussion and Analysis
InPlay Oil Corp. 20
• plans to pursue additional land and acquisitions;
• InPlay’s business strategy, goals and management focus;
• sources of funds for the Company’s operations, capital expenditures and decommissioning
obligations;
• future liquidity and the Company’s access to sufficient debt and equity capital;
• InPlay’s asset base and future prospects for development and growth;
• expectations regarding the business environment, industry conditions and future commodity prices;
• expectations regarding InPlay’s 2017 forecasted capital expenditures, production and future operating
costs;
• expectations regarding InPlay’s tax horizon;
• expectations regarding InPlay’s Credit Facility and capital management strategies;
• the timing and impact of new accounting policies and standards; and
• treatment under governmental and other regulatory regimes and tax, environmental and other laws.
Forward-looking statements regarding InPlay are based on certain key expectations and assumptions of
InPlay concerning anticipated financial performance, business prospects, strategies, regulatory developments,
current commodity prices and exchange rates, applicable royalty rates, tax laws, future well production rates
and reserve volumes, future operating costs, the performance of existing wells, the success of its exploration
and development activities, the sufficiency and timing of budgeted capital expenditures in carrying out
planned activities, the availability and cost of labor and services, the impact of increasing competition,
conditions in general economic and financial markets, availability of drilling and related equipment effects of
regulation by governmental agencies, the ability to obtain financing on acceptable terms which are subject to
change based on commodity prices, market conditions, drilling success and potential timing delays.
These forward-looking statements are subject to numerous risks and uncertainties, certain of which are
beyond InPlay’s control. Such risks and uncertainties include, without limitation: the impact of general
economic conditions; volatility in market prices for crude oil and natural gas; industry conditions; currency
fluctuations; imprecision of reserve estimates; liabilities inherent in crude oil and natural gas operations;
environmental risks; incorrect assessments of the value of acquisitions and exploration and development
programs; competition from other producers; the lack of availability of qualified personnel, drilling rigs or
other services; changes in income tax laws or changes in royalty rates and incentive programs relating to the
oil and natural gas industry; hazards such as fire, explosion, blowouts, and spills, each of which could result in
substantial damage to wells, production facilities, other property and the environment or in personal injury;
and ability to access sufficient capital from internal and external sources.
Management has included the above summary of assumptions and risks related to forward-looking
statements provided in this MD&A in order to provide readers with a more complete perspective on InPlay’s
future operations and such information may not be appropriate for other purposes. InPlay’s actual results,
performance or achievement could differ materially from those expressed in, or implied by, these forward-
looking statements and, accordingly, no assurance can be given that any of the events anticipated by the
forward-looking statements will transpire or occur, or if any of them do so, what benefits that InPlay will
derive there from. Readers are cautioned that the foregoing lists of factors are not exhaustive. These
forward-looking statements are made as of the date of this MD&A and InPlay disclaims any intent or
obligation to update publicly any forward looking statements, whether as a result of new information, future
events or results or otherwise, other than as required by applicable securities laws. Additional information on
these and other factors that could affect Anderson’s operations and financial results are included in reports

Management’s Discussion and Analysis
21 InPlay Oil Corp.
on file with Canadian securities regulatory authorities and may be accessed through the SEDAR website
(www.sedar.com) or at InPlay’s website (www.inplayoil.com).
ABBREVIATIONS USED
bbl barrel AECO intra-Alberta Nova inventory transfer price
bpd barrels per day GJ gigajoule
BOE barrel of oil equivalent Mcf thousand cubic feet
BOED barrels of oil equivalent per day Mcfd thousand cubic feet per day
BOPD barrels of oil per day MMBtu million British thermal units
Mbbls thousand barrels MMcf million cubic feet
MBOE thousand barrels of oil equivalent MMcfd million cubic feet per day
MMBOE million barrels of oil equivalent Bcf billion cubic feet
Mstb thousand stock tank barrels NGL natural gas liquids
m3 cubic metres Cdn Canadian
WTI West Texas Intermediate US United States


