MANAGEMENT TRAINING, STRATEGIC PLANNING … · (Hisrich & Peters, 1998(1989), pp. 12), the...
48
MANAGEMENT TRAINING, STRATEGIC PLANNING EFFECTIVENESS AND THE GROWTH OF START-UPS AND EARLY GROWTH FIRMS WORKING PAPER FORUM Gent, 18 april 2002 Tom SCHAMP, Dirk DESCHOOLMEESTER and Stijn GRYMONPRÉ Department of Management and Organization Faculty of Economics and Business Administration Ghent University (Belgium) Tel.: +32/09264.34.96 Fax: +32/09264.78.88 e-mail: [email protected] [email protected]
Transcript of MANAGEMENT TRAINING, STRATEGIC PLANNING … · (Hisrich & Peters, 1998(1989), pp. 12), the...

MANAGEMENT TRAINING, STRATEGIC PLANNING EFFECTIVENESS
AND THE GROWTH OF START-UPS AND EARLY GROWTH FIRMS
WORKING PAPER FORUM
Gent, 18 april 2002
Tom SCHAMP, Dirk DESCHOOLMEESTER and Stijn GRYMONPRÉ
Department of Management and Organization
Faculty of Economics and Business Administration
Ghent University (Belgium)
Tel.: +32/09264.34.96
Fax: +32/09264.78.88
e-mail: [email protected]
2
ABSTRACT
This article focuses on strategic planning as a fundamental constituent of strategic
management and the survival and growth of two groups of start-ups and early growth
firms in Flanders (Belgium): firstly, a test group of business-owners that have taken
part of one of the most successful management training programs for starters and
early growth firms in Flanders (called ADEPT), and, secondly, a randomly selected
and matched control group of SME-start-ups and early growth firms on the basis of
start-up year (period 1987-1996), age, size, industry, and location (referred to as
NOVICE). In line with earlier findings demonstrating rather significant correlations
between the strategic importance attached to management training and the clusters
of entrepreneurship and management traits that sustain strategic planning
effectiveness for ADEPT (see also: Schamp & Deschoolmeester, 1998a, 1998b, 2001),
this reassessment paper gives a more thorough appraisal of the importance of three
underlying strategic planning effectiveness attributes, namely strategic targeting,
strategic planning correctness, and strategic planning accuracy. Contrary to
strategic targeting, strategic planning correctness and strategic planning accuracy
are found to be notably explanatory for the growth established by many management
trained start-ups and early growth firms. There is greater evidence for the impact of
strategic correctness and strategic accuracy on firm growth for ADEPT than for
NOVICE.
Keywords: start-ups & early growth firms, strategic planning, firm performance, anagement training, entrepreneurial characteristics and management techniques
3
INTRODUCTION:
CONTEXT, CONSTRUCTS AND PROPOSITIONS
AIMS AND SCOPE
Celebrating almost fifteen years of management education, training and counseling for
Flemish start-ups and (very) early growth firms (being operational not longer than 4
years) at the Vlerick Leuven Gent Management School, the need was felt to conduct for
the first time ever a profound follow-up study on the post-management training
survival, growth and general management of the alumni are called "ADEPT".1 Being
aware of the generally assumed impact of management training -more particularly the
impact of the business planning training- and networking on the starters' management
behavior, we expected ADEPT to clearly disclose different levels of post-training
business planning effectiveness and, therefore, survival and business growth rates
compared to a control group of starters that had not followed any comparable form of
training, hereafter called "NOVICE".
In line with the general belief that "entrepreneurs are not born, they develop"
(Hisrich & Peters, 1998(1989), pp. 12), the starting-point for this research for this
reason was a vague assumption about the potential beneficial contribution of
management education and training on the starter's and early growth firm‟s business-
owners‟ management behavior, more specifically their strategic planning aptitudes and
ultimately the business life cycle of business start-ups.
To begin with, this paper aims to develop further the thoughts on the strategic
planning behavior among starters and owner-managers of early growth firms as well as
on the level of their strategic well-planning, the scope and structuredness, the
groundwork version of which has been edited and adopted in Brockhaus e.a.
Entrepreneurship Education - A global view (see: Schamp & Deschoolmeester, 2001).
For this purpose an extensive review of the preceding research on the subject is
presented (see: PRECEDING RESEARCH).
Secondly this paper presents and discusses more recent research conclusions on
the link between strategic planning effectiveness and the survival and growth of start-
ups and early growth firms. The latter is based to a large extent on an examination of
three pivotal strategic management qualities, namely [1] strategic targeting, [2]
strategic planning correctness, and [3] strategic planning accuracy. (see: STRATEGIC
PLANNING EFFECTIVENESS AND FIRM PERFORMANCE)
PRECEDING RESEARCH
Methodology
Preceding research in the period 1996-1997 on the influence of management training on
the management behavior of starters and business-owners of early growth firms was
done among a test group of 114 ADEPT (response rate: 49 percent) and a control group
of 112 NOVICE (response rate of 11 percent). All privately independent and owner-
managed NOVICE were selected randomly out of a database of 1000 start-ups and
SMEs, based on the following matching criteria: age, industry, size (annual sales 1 The SME-Department of the Vlerick Leuven Gent Management School (formerly known as the Vlerick School
of Management (Ghent University, Belgium)) has up to date over 15 years experience in organising management
training and counselling for starting SME-businessmen or business-owners. Following programs for small
business starters were organized on a pseudo-continuous base during the 1987-1998 period: "(Pre-)Starters
Program", "SME-Challenge Program", " Women and Entrepreneurship" and "SME-Excellence".

4
turnover and number of employees), and location (= NOVICE or the control group).
Subsequently, in brief, Dillman‟s „Total Design Method‟ was followed combining data
bank research, telephonic interviews, and direct mailing of questionnaires (Dillman,
1978).2 A personalized questionnaire3 was mailed to all ADEPT and all NOVICE. Both
groups were rather equally distributed considering the basic indices and therefore
comparable for further research and statistical difference analysis4 (Schamp &
Deschoolmeester, 2001). Apart from ADEPT-specific questions dealing with the content, relevance,
impact, timing and practical use of the management training, the questionnaire was
kept the same for both the test and the control group. Embedded in the concepts of the
guidelines for the exploration of entrepreneurship, entrepreneurial and managerial
processes and new-firm performance (Cooper & Gascon, 1992), the questionnaire was
divided into three parts. Therefore, the first part of the questionnaire dealt with the
personal history and present motivational and economical situation/status of the small
business-owner and the evolution of the firm's activities (employment and sales
turnover). Starters that are motivated to enroll for one or more management training
programs share, gain and test each other‟s expertise, management skills, knowledge
and techniques that might eventually lead to better individual performance. Therefore,
apart from some typical follow-up questions about the pure economic and financial
status of the “Vlerick”-alumni, the business life cycle or fiscal diversification, also
"general management issues", "decision-making at the firm level" and "the firm‟s
management processes", especially concerning „strategic planning‟ were included. The
second part of the questionnaire dealt with the importance that businessmen attached
to the management education and training (positive and negative experiences, the
practical use and applicability of their business plan, etc.) Part three of the
questionnaire checked upon the starter's attitude towards business planning and the
strategic importance attached to another 28 entrepreneurial characteristics and
managerial techniques [EC+MT], for example personal, psychological, general and
strategic management and a broad range of entrepreneurial issues. Answers were to be
formulated by crossing, (nominal and ordinal) scaling, or by commenting writing out.
Who is who?
Venturing in Flanders (Belgium) Prior to the analysis of the test and control group start-up profiles, a picture of the
entrepreneurial activity (in essence the amount of nascent firms and new firms) and the
start-up condition in Flanders (Belgium) is essential. Firstly, "in Belgium one out of
every 70 adults is currently starting a business. This compares with one in ten in the
United States (US), about one in 80 in France, and one in 100 in Ireland or Japan"
(Manigart, Clarysse, Crijns, & Goossens, 2000), pp. 7). Flanders in particular has a
very low nascent firm prevalence rate: only 0,8 percent of all Flemish adults tries to set
2 At first the research group received 73 complete copies of the questionnaire and took the initiative to do
another mailing to all remaining non-respondents backed up by a broad telephonic audit. And another 45
questionnaires were returned in time. This operation totaled a very high response rate compared to other SME
follow-up studies and surveys. Four questionnaires were excluded from statistical analysis. 3 The questionnaire was based upon a six fold series of interviews with SME-businessmen in order to select and
include the utmost plausible and statistical useful topics questions and answering possibilities. 4 This is with the exception of a rather unequal distribution for the annual staffing and sales turnover of the
spread within the control group over the ten years selection period, containing older start-ups than the test group.
(Both elements will be linked to explain higher mean values for the annual staffing and turnover as are presented
in table 2.A and table 2.B, see further)

5
up a new firm compared to almost 10% in the US and over 2 percent in Europe. Also
the new firm prevalence rate (start-ups less than 4 years old) in Flanders is lower than
all other GEM-countries, except for Japan and Ireland5: only 0,7 percent of all adults
own and operate a new or young firm. Consistent with the previous findings, the total
entrepreneurial activity rate is very low in Flanders (1,4%) only preceding Ireland.
This means that only 1,4 percent of all Flemish adults are involved in some kind of
entrepreneurial activity, either trying to set up his or her own business or currently
running a newly started business. Secondly, overall, men are twice as likely as women
to be involved in entrepreneurial activities. Thirdly, Flemish adults are more
pessimistic about the future than most European countries, not believing there will be
good opportunities for new businesses at the beginning of the new millennium. Fourth,
in Belgium entrepreneurship education is considered insufficient at all levels of the
education system, and lacks completely at most. Most education is not practice oriented
or experience based and not enough attention is given to enhance creativity. In general
educating people for self-employment is only slowly being given priority. In contrast,
however, many initiatives are focused on SME management and training. The training
programs for pre-starters and starters at the Vlerick School for Management is one of
the most appreciated in Belgium.
Starters‟ start-up age
The start-up age is to a large extent determined by the level of education and of
entrepreneurial pre-start-up experience (see further). Although higher educated,
"Vlerick"-starters are significantly younger than NOVICE. About 70 percent of the test
group is between 21 and 40 years old (58 percent is in its thirties), the average start-up
age being only 30 years. The latter is regarded as a milestone age at which individuals
are more inclined to start an entrepreneurial career (Hisrich & Peters, 1998(1989)) and
in general in Flanders (Belgium) the entrepreneurial activity peaks among those aged
25-34 (Manigart et al., 2000)6. The rather low Vlerick-start-up age can be partly
explained by the fact that most of the management programs for SME-business-owners
is exclusively accessible for starting businessmen that are under 35 years old having a
business-owning experience of four years at maximum (these are SME-Challenge
(formerly Starters-program) and Women and Entrepreneurship; see footnote 3).
Although an average has little meaning, earlier starts in an entrepreneurial career are
better than later ones (Hisrich & Peters, 1998(1989), pp. 72). The on average younger
Vlerick-starter's age is to great extent also due to its younger start-up age. Other
plausible explanations for the on average lower ADEPT age might lay in the core
concept and public image of management training programs as they are organized at
the Vlerick Leuven Gent Management School and the motivation, need and proper timing to follow such management training programs. Elements such as the program
attractiveness, timing and motivation referring to the endeavor, effort and hard
working in order to produce a highly conceptual, complete and formal business plan of
strategic value clearly drops the average enrollment age way below 40. In 1997 not
even 3percent of the Vlerick-small business-owners was over 50 years old, which is very
little compared to the 23percent fraction for all NOVICE (see Table 1 for all further
specifications on the profile dimensions).
5 The GEM study included facts and figures on the US, Italy, Finland, UK, Sweden, Denmark, Germany, Spain,
Belgium, France, Japan, and Ireland. 6 Worldwide, most entrepreneurs initiate their entrepreneurial careers between 22 and 45 and the average start-
up age is 36 years old.

6
Pre-start-up education
Based on the results of the General Entrepreneurship Monitor 2000, "[…] the higher
the level of educational attainment, as measured by the percentage of the eligible
population enrolled at high school or taking post secondary education, the higher the
level of entrepreneurial activity. [In general, however,] the level of entrepreneurial
activity in Flanders (Belgium), drops significantly at the university level and Flemish
entrepreneurs are most likely to have at most three years of post-secondary education,
rather than a four-year university degree" (Manigart et al., 2000), pp.49). Moreover,
the further the student progresses in his/her study, the lower the degree to which
university students are attracted to the idea of becoming an independent business-
owner: 28,2 percent of all first year students are attracted to the idea of starting up a
business after they finished university studies versus 18,8 percent after attaining the
bachelor level and 12,5 percent in the last year of study (Deschoolmeester, Braet, &
Schamp, 2002). Overall, only 7 percent of the students leaving school think of starting
up their own company within the next three years (against 19 percent in the US)
(Manigart et al., 2000). ADEPT are pro rata significantly higher educated than
NOVICE. Moreover, the biggest difference concerns the highest degree ever took:
nearly half of the ADEPT have graduated from university (of which 10 percent even
with a post-graduate degree), respectively 25 percent (of which six percent post-
graduate diplomas) for NOVICE. This can be explained partly due to the fact that the
management training programs under consideration here are organized on a post-
experience level, however within the framework of the Vlerick School of Management
which has ever since its conception been closely tied to the Ghent University. Also one-
third of the Vlerick-alumni has an equivalent degree but outside university, again
slightly more than NOVICE. These results seem to agree with the thesis that a formal
education is not necessary for starting a business, however, it does provide a good
background (Hisrich & Peters, 1998(1989); Van Clouse, 1990).
Personal values and objectives as pre-start-up motivations
Nevertheless the amount of studies indicating that personal values and beliefs are
important for entrepreneurs, such studies have frequently failed to indicate that
entrepreneurs can be differentiated on these elements from managers, for example
effective leadership, creativity, veracity, resource seeking, aggression etc. Differences
in the attitudinal settings are noted however concerning the nature of the management
process and the business in general. Among NOVICE, the nature of the enterprise, the
opportunism as well as the individuality of the entrepreneur vary significantly from the
bureaucratic organization and the planning, rationality, and predictability of its
managers (Hisrich & Peters, 1998(1989)). (Pre-)start-up values, objectives and motivations will of course be linked to the already discussed pre-start-up age, the level
of education in order to complete theories of entrepreneurship and venture creation. In
these the decision to behave entrepreneurial as a result of the interaction of several factors has been repeatedly underlined: personal characteristics, the relevant business
context or environment, the availability of business idea(s) and the personal goal setting
(Hisrich & Peters, 1998(1989)). Examining why people start a business and how they
differ from those that do not is therefore useful for getting to understand the
“motivation” that entrepreneurs exhibit during the (pre-)start-up phase as a possible
explanatory fertile ground for an even wider range of entrepreneurial characteristics
and management traits which are exhibited later during the entrepreneur's life
(Kuratko, 1995). Hisrich and Peters (1998) stated that although the motivations for
venturing out alone vary greatly, the reason cited the most frequently for becoming an
7
entrepreneur is independence, the desire to be one's own boss. Money and opportunity
are the second and third reasons for starting a business for men, compared to job
satisfaction and achievement for women. Money is a far less important driver for most
women. Other triggers are the work and family situation as well as the role model of
the entrepreneur. In order to get an overview of the reasons why somebody launches a
business, a selection of sixteen pre-start-up motivations were tested. The respondents
had the possibility to mark three preferences in their order of importance: a first in
rank and most important preference, a second and a third in rank pre-start-up
motivation (read: reason for the start-up). Overall, 'the challenge to become an entrepreneur' and 'the challenge to become independent' are the number one and two
motivations for starting up a privately owned enterprise (more than 13 percent), both
within the test and the control group. At the level of the third foremost important
motivation, cited were 'the presence of an opportunity' for the group of ADEPT (about
11 percent first choice and 14 percent second choice) and 'the entrepreneurial parental role model' or the parental peer pressure for NOVICE (respectively 13 percent and 10
percent). Other significant differences between both groups concern the respectively
fourth, fifth and sixth choice: for example 'not longer willing to work for a boss', and 'the belief in the quality of one‟s product'. Less chosen and therefore less determining
motivations for start-up are „the start-up is a logical consequence of my studies‟, „the already high participation in this firm‟, „unemployment or joblessness at that time‟, „family reasons played (mainly due to inheritance)‟, „the wish of doing something else‟, „liking to work hard‟, „to earn lots of money‟, „to become rich‟, and „the personal status of an entrepreneur‟.7
7 Although „to earn lots of money‟ did not count high for the first and second choice, it has (surprisingly enough)
got the second highest rating as a third choice (behind „the challenge to become independent‟), respectively
10,71 for ADEPT and 14,29% for NOVICE.

Table 1
The pre-start-up business-owners‟ profile (in percentage of total counts, missing values not inclusive)
PRE-START-UP
CHARACTERISTICS & TRAITS
(PROFILE)
"VLERICK"-STARTERS
NOVICE
21-30 years 31-40 years 41-50 years >50 years 21-30 years 31-40 years 41-50 years >50 years
Age (N = 112 for both) T-test: p = .000
11,60
58,03
27,67 2,67 4,46 32,14 40,18 23,21
1 2 3 4 5 6 7 1 2 3 4 5 6 7
Education* (N = 112 for both) T-test: p = .000
0,89 1,78 16,06 33,03 36,6 10,71 0,89 3,57 13,39 29,46 30,36 16,96 6,25 -
entrepreneurial parents not entrepreneurial entrepreneurial parents not entrepreneurial
Entrepreneurial parental role model (N = 114 and 112) -test: p = .05429
53,98 46,02 68,75 31,25
0 years 1-5 y 6-10 y 11-15 y 16-20 y >20 y 0 years 1-5 y 6-10 y 11-15 y 16-20 y >20 y
In-sector experience (N = 61 and 111) T-test: p = .045
42,85 34,21 12,28 4,38 2,63 0,87 43,75 25,00 17,85 5,35 0,89 4,37
Outer-sector experience (N = 52 and 109) T-test: p = .015
52,67 23,68 14,03 5,26 1,75 0,87 67,86 12,50 5,35 6,25 5,35 1,78
management or
leading function
supporting
function or staff
no experience management or
leading function
supporting
function or staff
no experience
Experience
and expertise
gained
In-sector (N = 110 and 111)
T-test: p = .694
Outer-sector (N = 112 and 111)
T-test: p = .03
19,29
13,15
34,21
34,21
42,98
52,63
13,39
11,60
41,07
19,64
43,75
67,85
1 2 3 4 5 6 7 1 2 3 4 5 6 7
Motivation*
*
firstly (N = 110 and 112)°
secondly (N = 91 and 95)°°
thirdly (N = 90 and 96)°°°
14,28
4,46
5,35
12,50
17,85
13,39
10,71
14,28
2,67
10,71
5,35
6,25
10,71
5,35
8,92
2,67
4,46
5,35
7,14
0,00
2,67
20,54
7,14
3,57
10,71
15,18
15,18
13,39
6,25
2,68
4,46
5,37
4,46
2,68
3,57
4,46
13,39
9,82
5,36
3,57
1,79
1,79
*Educational levels: 1 = primary school; 2 = lower secondary school; 3 = higher secondary school; 4 = higher education outside university; 5 = university; 6 = post-university; 7 = other (for
example abroad);
**Motivations for start-up: 1 = the challenge to become independent; 2 = the challenge of becoming an entrepreneur; 3 = the presence of an opportunity; 4 = not longer willing to work for a
boss; 5 = belief in product quality; 6 = parental role model; 7 = other reasons. °T-test: p = .033; °°T-test: p = .408; °°°T-test: p = .809.
9
Entrepreneurial parental role model
Specific research topics concerning the family environment of the entrepreneur include
a.o. birth order, relationship with parents, and social status. Relations between these
factors and (successful) entrepreneurship seemed however not conclusive. In terms of
the occupation of the entrepreneur's parents, there is, however, strong evidence that
entrepreneurs tend to have self-employed or entrepreneurial parents (Hisrich & Peters,
1998(1989)). Research done by Deschoolmeester e.a. on the antecedents of
entrepreneurial awareness among 1303 university students in Belgium affirmed that
the entrepreneurial parental role modeling is of crucial importance in explaining
entrepreneurial activity in terns of new venture creation8. In general, 44 percent of all
students that have parents running their own business are thinking about starting a
business on their own once they finished university versus 19 percent of the students
who's parents are both employees.9 Moreover, in the case that either the mother or the
father has a privately owned business, the wish of starting an own private initiative is
respectively 53 percent (versus 20 percent of the students who's mother is employed by
a third party) and 40 percent (versus 19 percent of the students who's father is
employed by a third party) (Deschoolmeester et al., 2002). Having a parent that runs or
owns a business or is self-employed therefore provides a strong inspiration for the
entrepreneur ((Hisrich & Peters, 1998(1989)), pp. 71). Based on the above table 1
similar conclusions can be drawn for about 70 percent of the start-up cases in Flanders
(Belgium). With a 15 percent gap, the small business-owners of the control group (69
percent) are obviously more likely to originate from entrepreneurial households than
ADEPT (54 percent). Over 40 percent of all ADEPT started a new business on their
own (28 percent for NOVICE). This respectively higher versus lower entrepreneurial parental role modeling could also be concluded from the variety of motivations for
starting up a business (cf. infra pre-start-up motivations). For instance, in total more
than 39 percent of NOVICE stated that they took over or inherited their enterprise,
which is double the ADEPT‟ score. Based on the above pre-start-up motivations and the
fact that almost 70 percent of all NOVICE come from entrepreneurial households,
clearly sustains the thesis that entrepreneurial parental role modeling is a fabulous
catalyst for the entrepreneurial activity (Manigart et al., 2000). As an example, in
contrast to NOVICE, ADEPT more frequently appear to create a new idea in a new setting using the knowledge, resources and expertise of outsiders, whereas NOVICE
seem to follow to a great extent the more classic "join-the-family(-business)" start-up
route.
Networking
In general there is a very high correlation between knowing entrepreneurs personally,
being inside an entrepreneurial community or network and the willingness or interest
in starting up a business and the willingness by third parties of financing potential
entrepreneurs (Manigart et al., 2000). In Flanders, more particularly, seemingly very
few individuals know entrepreneurs personally. In turn, individuals who want to start
a new venture have difficulties in finding business angels who believe in their project.
8 Likewise, having one or both parents being employed by a third party discourages students to think about
starting up a new business. When either one of the parents or both parents are employed by a third party, 80% of
the university student asserts willing to work for a boss as well. 9 Note the elements that were discussed concerning the level of education of starters: a higher level of
educational attainment is correlated to setting up a new business up to the level of university. At university level,
however, entrepreneurial activity in terms of setting up a totally new firm drops again significantly (especially in
Flanders). (Manigart et al., 2000)

10
However, ADEPT are more inclined to set up a business together with one or more partners or backed up substantially by at least one (financial) institution.
Pre-start-up experience
The relation between the duration of pre-start-up experience and the venture success
rate or business performance and growth has been a major subject in academic studies.
Though, few studies came up with real evidence for a positive relationship (Cooper &
Gascon, 1992). Nevertheless it is assumed that individuals will tend to be more
successful in forming and growing business in fields were they have worked and gained
vital experience (Hisrich & Peters, 1998(1989)), described as "in-sector" or
intrapreneurial pre-start-up experience. In Belgium 1,94 percent and in Flanders 1,4
percent of the entrepreneurial activity comes from intrapreneurial activities (Manigart
et al., 2000), pp. 17). The overall very low entrepreneurial activity rates in Belgium and
Flanders (see above) are therefore not compensated by high intrapreneurship rates,
meaning that far more Belgian and Flemish entrepreneurs start their ventures after
having gained experience in another job in another sector (= outer-sector pre-start-up
experience). Both test and control group are marked by a higher in-sector over outer-
sector pre-start-up experience (> 56 percent). In total 10 percent more ADEPT gain a
frequently brief working experience (one to five years both in- and outside the business
sectors in which one launched his/her own enterprise). For the in-sector pre-start-up
experience, in 20 percent of the Vlerick-cases this happens to be in a leading
management function, which is about 50 percent more as for NOVICE. Concerning the
outer-sector experience the relative majority of ADEPT over NOVICE is a lot less and
varies around 12 percent for both groups. The much higher score on leading or managerial pre-start-up experience is most probably due to the longer and higher
education of the ADEPT and can be explained by the opportunities that highly educated
post-graduates can get in leading functions (often within their field of expertise). It also
explains why for ADEPT the difference between the experience from not-leading
functions in and outside the sector is not that big as for NOVICE. For the latter, the
combination of poorer education with the entrepreneurial parental role model evidently
push towards a superior in rank status inside the sector one knows the best, and a
subordinate status when it concerns the outer-sector. This apparently accounts for
about 55 percent of all NOVICE.
Motivation to carry on with the business
Once started a business, it is very important to know what drives the owner-manager of
this start-up to proceed with the business. According to the textbook all legitimacy,
wishing and wanting should be incorporated in a „mission‟ or some „business goals‟?
Also interesting to know is what the starter would change if he or she could start all over again? The most recurring reason for continuing the business for all respondents
is „to make one‟s firm as profitable as possible‟ (47percent of the ADEPT and 54 percent
of NOVICE). ADEPT and NOVICE further aim „to grow in a more controlled manner‟ (38 percent). In third instance, ADEPT want „to build out a firm with a high marketing value (selling price)‟ (7 percent). For NOVICE „to survive in the market‟ is the third
most important reason for proceeding with the business (10 percent). Following Hisrich
and Peters's start-up typology, the average Flemish starter typically heads a life-style
firm, which is privately held, and usually achieves only modest growth (see further:
table 2A) and exists primarily to support the owners (Hisrich & Peters, 1998(1989)). As
we will see in the next part, only after several years these firms may grow to over two
digit number of employees. „To grow as much as possible‟ and „to survive in

11
employment‟ (= actively seeking opportunities for employability) are not really
important "issues" for either group. Since most of the firms were existent and on
average 'growing' at the time of the questioning, not surprisingly about 90percent of all
interviewed small business-owners replied positively towards a re-start-up scenario
which means they wouldn't change a lot…
In sum, ADEPT can be characterized as highly educated (twice as many
university degrees as compared to the control group), trained and experienced to a large
extent outside as well as inside the actual business sector in mostly leading positions.
ADEPT most frequently are motivated to start a business on their own, supported by a
personal network. On the contrary, NOVICE were highly stimulated to take over a
venture due to the parents, largely due to the fact that a greater majority of NOVICE
originate from an entrepreneurial or family business environment. So far a broad set of
differences in start-up motivations for the group of ADEPT was disclosed: the challenge
of an opportunity, and in that way the sense for a challenge and a new product, and the
everlasting wish of getting independent. Furthermore, ADEPT joined management
training programs to learn and debate with other starters and small business-owners
the techniques and ways to meet their entrepreneurial and management shortcomings
while working out an own business concept or idea, most of it the NOVICE learn while
being confronted with the family businesses. The primary goal for a large majority of
both test and control group small business-owners is to grow the company as profitable
as possible whereas only a small partition is interested in becoming personally rich per
se.
Profiles of entrepreneurial characteristics and management techniques [EC+MT]
There is a general belief among researchers in the field of entrepreneurship, venture
creation and general management that management education and training (in its
different forms) positively influences the entrepreneurial characteristics and
management techniques [EC+MT], in particular those of business planning (see
introduction). In order to control for this relation a list of 28 entrepreneurial
characteristics and management techniques [EC+MT] that relate to business planning,
management and controlling was used.
The reader will discover that the proxies for strategic planning (based on its ten
dimensions) is -yes- strongly influenced by 'certain identifiable sets' of EC+MT (=
EC+MT profiles). But, more important, except for very specific combinations of EC+MT
and growth-related strategic planning profiles, in general a meaningful relation
between management training, EC+MT and growth-related strategic planning could not
be established. As demonstrated in the previous part, in general the discriminating
factor (namely the fact of being management trained or not) apparently does have an
explanatory value concerning the strategic planning proficiencies of the test groupp.
The question now is whether this can be linked to other EC+MT profiles, and if so to
which ones: common EC+MT or significantly differing ones?
Significant differences between both groups was found for the strategic
importance attached to the following EC+MT: „conceptual thinking and rational decision-making‟, „subcontracting‟, „human resource development (HRD)‟, and „stock management‟. ADEPT and NOVICE score significantly higher on respectively the first
and the latter two. To a lesser extent ADEPT attach more strategic importance to
'flexibility' (wage/hours < average of the sector), 'delegation of tasks', 'general management', 'strategy making' (strategic issues management (SIM)), local market
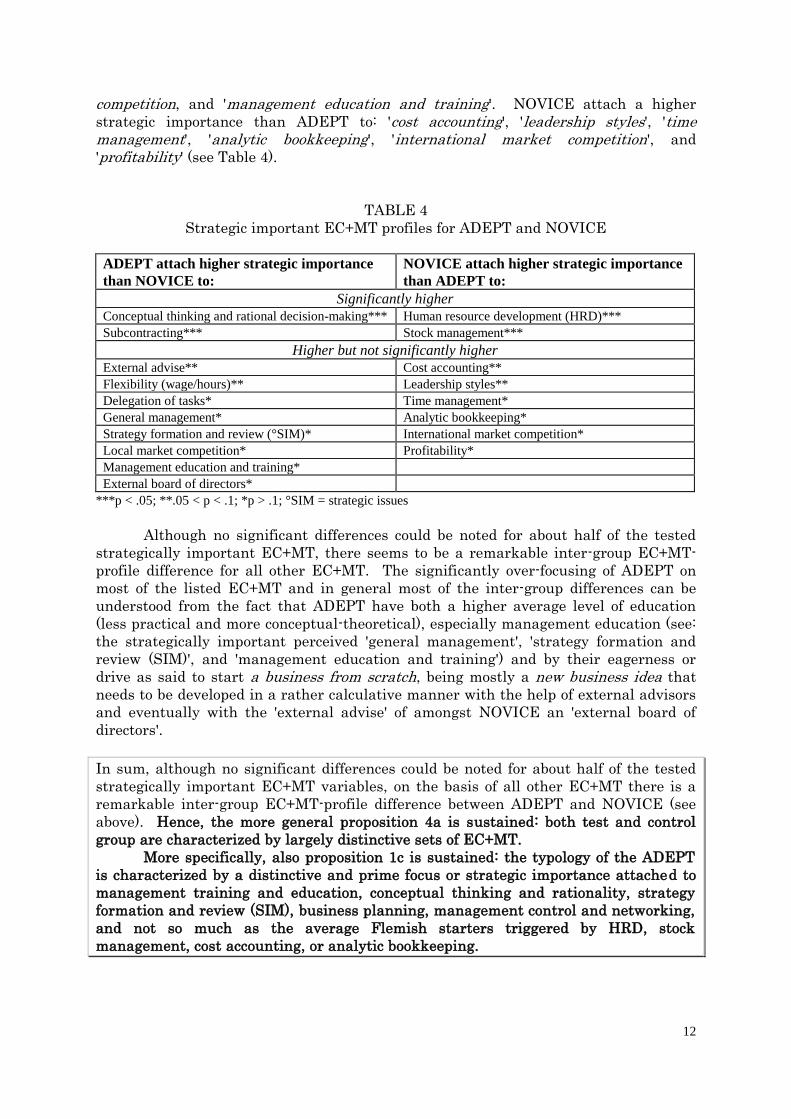
12
competition, and 'management education and training'. NOVICE attach a higher
strategic importance than ADEPT to: 'cost accounting', 'leadership styles', 'time management', 'analytic bookkeeping', 'international market competition', and
'profitability' (see Table 4).
TABLE 4
Strategic important EC+MT profiles for ADEPT and NOVICE
ADEPT attach higher strategic importance
than NOVICE to:
NOVICE attach higher strategic importance
than ADEPT to:
Significantly higher
Conceptual thinking and rational decision-making*** Human resource development (HRD)***
Subcontracting*** Stock management***
Higher but not significantly higher
External advise** Cost accounting**
Flexibility (wage/hours)** Leadership styles**
Delegation of tasks* Time management*
General management* Analytic bookkeeping*
Strategy formation and review (°SIM)* International market competition*
Local market competition* Profitability*
Management education and training*
External board of directors*
***p < .05; **.05 < p < .1; *p > .1; °SIM = strategic issues
Although no significant differences could be noted for about half of the tested
strategically important EC+MT, there seems to be a remarkable inter-group EC+MT-
profile difference for all other EC+MT. The significantly over-focusing of ADEPT on
most of the listed EC+MT and in general most of the inter-group differences can be
understood from the fact that ADEPT have both a higher average level of education
(less practical and more conceptual-theoretical), especially management education (see:
the strategically important perceived 'general management', 'strategy formation and
review (SIM)', and 'management education and training') and by their eagerness or
drive as said to start a business from scratch, being mostly a new business idea that
needs to be developed in a rather calculative manner with the help of external advisors
and eventually with the 'external advise' of amongst NOVICE an 'external board of
directors'.
In sum, although no significant differences could be noted for about half of the tested
strategically important EC+MT variables, on the basis of all other EC+MT there is a
remarkable inter-group EC+MT-profile difference between ADEPT and NOVICE (see
above). Hence, the more general proposition 4a is sustained: both test and control
group are characterized by largely distinctive sets of EC+MT.
More specifically, also proposition 1c is sustained: the typology of the ADEPT
is characterized by a distinctive and prime focus or strategic importance attached to
management training and education, conceptual thinking and rationality, strategy
formation and review (SIM), business planning, management control and networking,
and not so much as the average Flemish starters triggered by HRD, stock
management, cost accounting, or analytic bookkeeping.
13
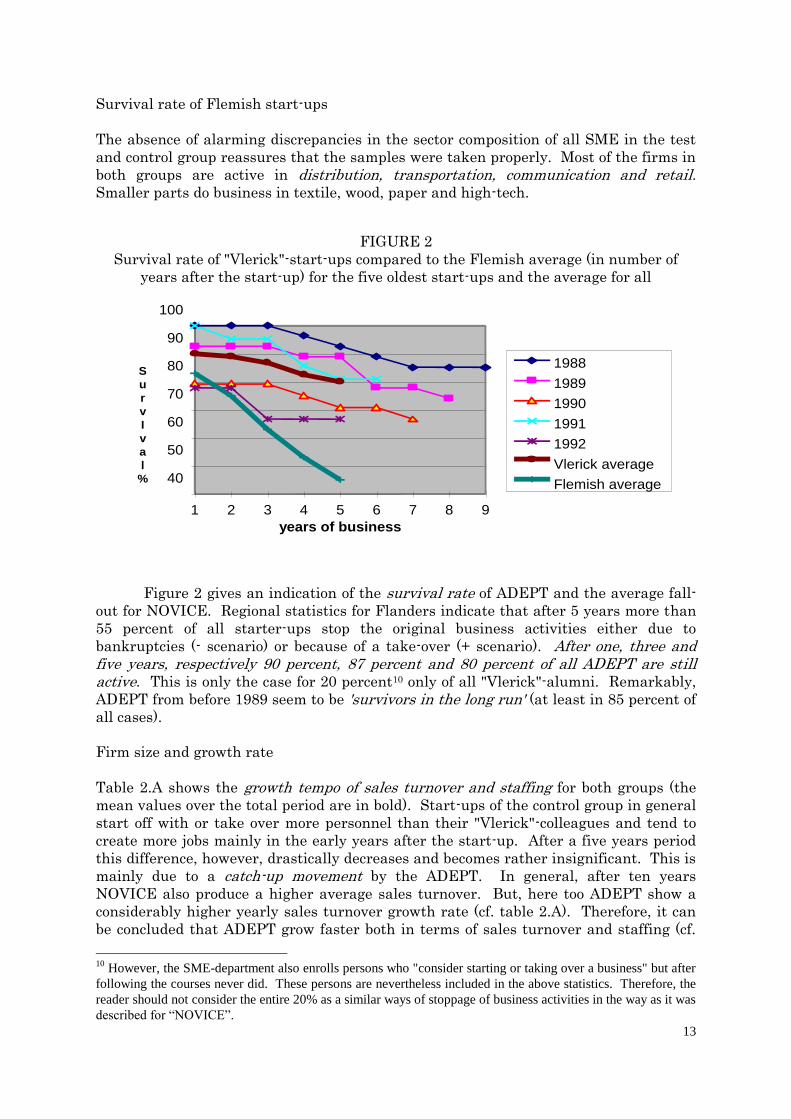
Survival rate of Flemish start-ups
The absence of alarming discrepancies in the sector composition of all SME in the test
and control group reassures that the samples were taken properly. Most of the firms in
both groups are active in distribution, transportation, communication and retail. Smaller parts do business in textile, wood, paper and high-tech.
FIGURE 2
Survival rate of "Vlerick"-start-ups compared to the Flemish average (in number of
years after the start-up) for the five oldest start-ups and the average for all
40
50
60
70
80
90
100
1 2 3 4 5 6 7 8 9
years of business
S
u
r
v
I
v
a
l
%
1988
1989
1990
1991
1992
Vlerick average
Flemish average
Figure 2 gives an indication of the survival rate of ADEPT and the average fall-
out for NOVICE. Regional statistics for Flanders indicate that after 5 years more than
55 percent of all starter-ups stop the original business activities either due to
bankruptcies (- scenario) or because of a take-over (+ scenario). After one, three and five years, respectively 90 percent, 87 percent and 80 percent of all ADEPT are still active. This is only the case for 20 percent10 only of all "Vlerick"-alumni. Remarkably,
ADEPT from before 1989 seem to be 'survivors in the long run' (at least in 85 percent of
all cases).
Firm size and growth rate
Table 2.A shows the growth tempo of sales turnover and staffing for both groups (the
mean values over the total period are in bold). Start-ups of the control group in general
start off with or take over more personnel than their "Vlerick"-colleagues and tend to
create more jobs mainly in the early years after the start-up. After a five years period
this difference, however, drastically decreases and becomes rather insignificant. This is
mainly due to a catch-up movement by the ADEPT. In general, after ten years
NOVICE also produce a higher average sales turnover. But, here too ADEPT show a
considerably higher yearly sales turnover growth rate (cf. table 2.A). Therefore, it can
be concluded that ADEPT grow faster both in terms of sales turnover and staffing (cf.
10
However, the SME-department also enrolls persons who "consider starting or taking over a business" but after
following the courses never did. These persons are nevertheless included in the above statistics. Therefore, the
reader should not consider the entire 20% as a similar ways of stoppage of business activities in the way as it was
described for “NOVICE”.

14
“>”). Mark that the unequal distribution for sales turnover for NOVICE is also due to a
respectively smaller number of start-ups and a relative higher number of early growth
firms (see the higher frequencies of over 30 million,- BEF [this is 0,7437 million EURO]
average sales turnover businesses).
TABLE 2.A
Annual personnel and total sales turnover size and growth rates
(average annual growth in percentages of total counts)
ADEPT NOVICE ADEPT NOVICE
Average
staffing°
mean value
(in absolute
numbers):
4,70
SIZE
6,95
Annual staffing
growth°°°
mean
percentage:
7,69
GROWTH
5,15
during 1987 1,10 3,95 -5 to 0** 0,87 percent 4,50 percent
1990 2,23 4,96 0 to 5 44,73 percent 45,94 percent
1993 3,15 6,73 5 to 10 14,91 percent 17,11 percent
1994 3,79 7,54 10 to 15 7,01 percent 4,50 percent
1995 4,64 8,15 >= 15 8,80 percent 6,33 percent
1996 6,40 8,87 missing cases 23,68 percent 21,62 percent
Average sales
turnover°°
mean value
(in absolute
numbers):
24,49
SIZE
41,20
Sales turnover
growth°°°°
Mean
percentage:
6,56
GROWTH
2,19
0 to 14,99* 41,96 percent 33,04 percent -5 to 0** 2,63 percent 8,92 percent
15 to 29,99 13,39 percent 9,82 percent 0 to 5 57,01 percent 70,53 percent
30 to 44,99 6,25 percent 13,39 percent 5 to 10 10,5 2 percent 0,89 percent
45 to 59,99 5,35 percent 10,71 percent 10 to 15 3,50 percent 1,78 percent
60 to 74,99 3,57 percent 2,68 percent >= 15 6,17 percent 2,71 percent
75 to 89,99 2,67 percent 1,79 percent
> 90 3,56 percent 9,82 percent
missing cases 23,25 percent 18,75 percent missing cases 20,17 percent 15,17 percent
*In million Belgian Francs (BEF) [1 EURO = 40,3399 BEF]; **In percentages
°T-test: p < .05; °°T-test: p = .005; °°°T-test: p = 0.21; °°°°T-test: p = .015.
The Box & Whisker-plots in figure 3 show that over time median-max variance
for growth (as a measure of "growth potential") in both personnel and in turnover is
higher for ADEPT (respectively 1,1 and 19 in 1987 versus 6,4 and 112 in 1996 for
personnel [resulting in a median-max growth 10-year coefficient of 105,6/17,9 = 5,9 with
a median growth of 0,53 annually] and 4 and 90 in 1987 versus 17 and 270 in 1996 for
turnover [resulting in a median-max growth coefficient of 253/86 = 2,94 with a median growth of 1,3 annually]) than for NOVICE (respectively 3,95-40 in 1987 versus 8,87-58
in 1996 for personnel [resulting in a median-max growth coefficient of 49,13/36,05 =
1,36 with a median growth of 0,49 annually] and 9-178 in 1987 versus 29-250 in 1996
for turnover [resulting in a median-max growth coefficient of 221/169 = 1,3 with a median growth of 2 annually]). Based on the 10-year median growth (as a measure of
on average effectuated growth) NOVICE established higher turnover growth, ADEPT a
higher slightly higher growth in personnel; growth numbers which are of course to be
corrected for the mean values that are in bold in the last two columns of table 2 (see
also the variance in the 25 percent to 75 percent percentile range). The latter 25
percent to 75 percent percentiles moreover suggest that over time more ADEPT
generate higher growth both in personnel and turnover (see also the far higher
steepness of the slope when connecting the 75 percent percentiles for ADEPT,
suggesting a clear growth pattern while the same slope for NOVICE has almost
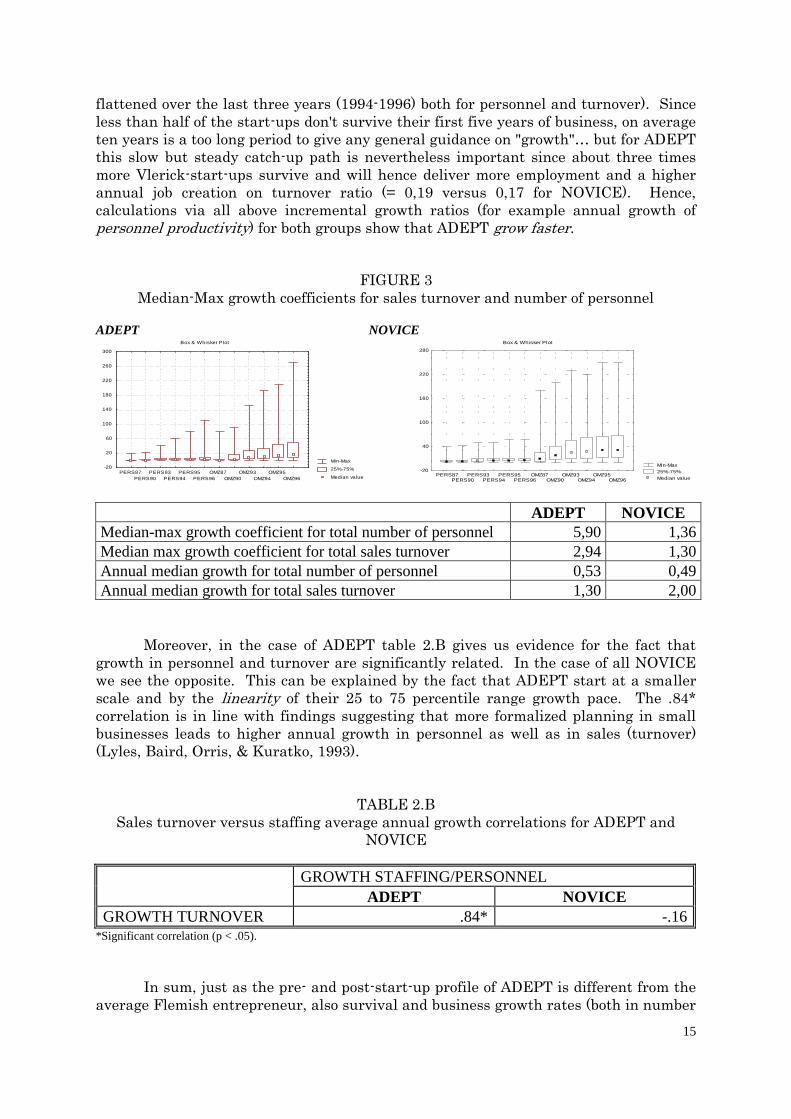
15
flattened over the last three years (1994-1996) both for personnel and turnover). Since
less than half of the start-ups don't survive their first five years of business, on average
ten years is a too long period to give any general guidance on "growth"… but for ADEPT
this slow but steady catch-up path is nevertheless important since about three times
more Vlerick-start-ups survive and will hence deliver more employment and a higher
annual job creation on turnover ratio (= 0,19 versus 0,17 for NOVICE). Hence,
calculations via all above incremental growth ratios (for example annual growth of
personnel productivity) for both groups show that ADEPT grow faster.
FIGURE 3
Median-Max growth coefficients for sales turnover and number of personnel
ADEPT NOVICE
Min-Max
25%-75%
Median value
Box & Whisker Plot
-20
20
60
100
140
180
220
260
300
PERS87
PERS90
PERS93
PERS94
PERS95
PERS96
OMZ87
OMZ90
OMZ93
OMZ94
OMZ95
OMZ96
Min-Max
25%-75%
Median value
Box & Whisker Plot
-20
40
100
160
220
280
PERS87PERS90
PERS93PERS94
PERS95PERS96
OMZ87OMZ90
OMZ93OMZ94
OMZ95OMZ96
ADEPT NOVICE
Median-max growth coefficient for total number of personnel 5,90 1,36
Median max growth coefficient for total sales turnover 2,94 1,30
Annual median growth for total number of personnel 0,53 0,49
Annual median growth for total sales turnover 1,30 2,00
Moreover, in the case of ADEPT table 2.B gives us evidence for the fact that
growth in personnel and turnover are significantly related. In the case of all NOVICE
we see the opposite. This can be explained by the fact that ADEPT start at a smaller
scale and by the linearity of their 25 to 75 percentile range growth pace. The .84*
correlation is in line with findings suggesting that more formalized planning in small
businesses leads to higher annual growth in personnel as well as in sales (turnover)
(Lyles, Baird, Orris, & Kuratko, 1993).
TABLE 2.B
Sales turnover versus staffing average annual growth correlations for ADEPT and
NOVICE
GROWTH STAFFING/PERSONNEL
ADEPT NOVICE
GROWTH TURNOVER .84* -.16 *Significant correlation (p < .05).
In sum, just as the pre- and post-start-up profile of ADEPT is different from the
average Flemish entrepreneur, also survival and business growth rates (both in number
16
of personnel and turnover) are markedly different: ADEPT have a higher survival rate
both on short and long term and they grow faster than the average Flemish start-up.
Whereas there is no relation between annual growth in number of personnel and sales
turnover for the latter, this relation is highly significant for ADEPT.
Strategic planning and firm performance measurement
A major weakness in strategy research is the operationalization and measurement of
firm performance. Rue and Ibrahim (1998) indicated that many studies have used
objective financial measures to determine business planning effectiveness, excluding
important non-financial indicators such as productivity growth (= turnover over the
number of personnel), product innovation, growth and development of the personnel
(HRD), customer relation and market share etc. In this sense, there are numerous field
studies that examine "the effects" or outcomes of various forms of strategic and
operational planning on a variety of financial performance measures for both large and
small firms, mainly drawing mixed conclusions based on whether and how the process
or the outcome was studied. Some authors concluded that, in the case of small firms,
strategic planning simply because of the lack of knowledge, time and staffing did not fit
the context of small firms and hence would have no potential payoff (Robinson &
Pearce, 1984; Sexton & Van Auken, 1985) or that there is little or no significant
relationship between strategic planning and the (financial) performance of small firms
(Robinson & Pearce, 1983; Schrader, Mulford, & Blackburn, 1989). These studies
report ambiguous planning/performance relations, and most suggest that the value of
planning is mitigated by factors such as environmental uncertainty (as perception of environmental uncertainty increases strategic planning decreases (Matthews & Scott,
1995)), managerial expertise or the stage of firm development (Schwenk & Schrader,
1993). For instance Rue and Ibrahim (1998) concluded that there is moderately
significant relationship between planning and perceived performance relative to the
industry. The results of Schwenk & Shrader's (1993) meta-analysis show two types of
performance measures. The first is growth in sales or revenue and the second includes
several measures of return (return on assets (ROA), return on investments (ROI),
return of equity (ROE)). In their study, Lyles e.a. (1993) used ROE, ROA and growth in
sales as business performance parameters. Smith (1998) for example found that high
performing business starters prefer to sustain growth through reinvested profits and
would seek equity investment rather than debt financing if further funds were required.
The average effect size for such parameters across studies is positive, indicating an
association between planning and sales and revenue growth under a 95percent
confidence that the effect is not due to chance. The relationship between planning and
return measures was also significant at the .05 level. On the other hand, no significant
relation was found with respect to return on investment (ROI).
Altogether, these reviews -having produced a large number of potential topics for
future research- have, however, not been tremendously illuminating as to the basic
question of how formal strategic planning affects firm performance… a subject that lies
at the very heart of the strategic management discipline. Ramanujam e.a. (1986) had
the following suggestion: the effectiveness of planning must be measured according to how well the planning system helps the organization fulfill the objectives of planning. Hence, firm performance was measured based on both financial and non-financial

17
criteria (Ramanujam & Venkatraman, 1987; Smith, 1998)11, respectively annual growth
in turnover/sales (or productivity) and personnel (total employment growth of the firm).
If we take business performance to be a function of strategic planning proficiency and
assert that the principle features of performance can be categorized by growth in sales
turnover (ST(ag)) and growth in the number personnel or staffing (P(ag)), then we have
a quantifiable measure.
Rue and Ibrahim (1998) operationalized strategic planning according to quantifiable
strategic objectives in the following areas: sales/turnover, return on investment (ROI),
return on equity (ROE), market share (customer relation), job creation and human
resource development (HRD), product innovation, return on assets (ROA) or general
firm development and global expansion (general success rate (= image, reputation,
market ranking versus competitors)). Based on these and other's findings (Lyles et al.,
1993; Schwenk & Schrader, 1993; Smith, 1998) the authors operationalized "strategic planning" by a mix of five financial [F] and five non-financial [NF] return and growth
measures including respectively return on assets (ROA), return on sales turnover
(ROS) (profitability), sales turnover, return on investment (ROI), and return on equity
(ROE) [F] and growth and development of personnel (human resource development or
HRD), product innovation, pro-active adaptation (probability and risk calculation),
general success rate (= image, reputation, market ranking versus competitors), and the
customer relation and market share [NF].
Proposition 3a: Small firm financial and non-financial performance, respectively growth
in annual sales turnover and number of personnel (employability) is strongly related to
financial versus non-financial strategic planning.
Proposition 3b: Following propositions 1a and 2a ADEPT in general produce higher
financial as well as non-financial firm growth (resp. sales turnover and employment)
than their non-trained counterparts.
Preliminary findings on the link between management training, strategic
planning and firm performance
Strategy, strategic management and planning
In general, over the past forty years writers on the fundamentals of corporate strategic
management (for instance Ansoff (1988(1965)), Steiner (1967), Timmons (1978), Porter
(1980) or Rowe, Mason, Dickel, Mann, & Mockler (1994) describe planning as one of the
basic, essential and primary managerial tasks. They mostly agree on planning being an
integral part of the business from the pre-start-up over early growth to maturity, and
entrepreneurs who learn early to plan will be able to cope with the process as their
businesses become more complex (Anderson & Dunkelberg, 1993). "Planning what is
our business, planning what will it be, and planning what should it be have to be
integrated. [Therefore] everything that is 'planned' becomes immediate work and
commitment" (Drucker, 1999(1973), pp. 122). Whereas business planning before and
during the start-up in the main includes defining the business, the company's strengths
and weaknesses, the nature of the industry and the market for its products and
services, and the resources and capabilities needed in order to market and survive
successfully in the short term (Anderson & Dunkelberg, 1993, pp. 117-120), business
11
Growth was understood by the respondents to be an increase in the number of branches, higher profile, more
business, more money, increased turnover and profitability, an increase in the client base, etc… as well as the
strength of their employees (human resource development (HRD)) (Smith, 1998, p. 864)
18
strategy and strategic planning are aimed primarily at sustainable long term firm
performance and growth including the setting of strategic goals, business policies
towards product and market development, human and other capital investment,
resource expansion planning, organization and production effectiveness, technical
management etc. (Smith, 1998). Business strategy and strategic management for the
development or growth of the firm and the creation of a (sustainable) competitive
advantage in the marketplace, therefore, will require some additional quite logical and
systematic planning of action that sets out where the business is determined to go to, at
the mean time identifying the means of getting there (strategy policies), and coherently
focusing all operations and necessary tasks (Gibb & Scott, 1985). Strategy is, therefore,
more broadly defined as a temporary bundle or cluster of logical frameworks for
management thinking, sense-making, understanding, decision-making and action that
guide the firm to exploit opportunities while neutralizing threats.
Strategic planning formalization
No precise figures exist about start-ups with or without a business plan and early
growth firms engaging in strategic planning, but it appears that planners outnumber
non-planners. Reasons for non-planning the business (in a formal manner) include that
the planning is done 'in the head', that plenty of examples exist of fabulous and
successful entrepreneurs who grew a business without formal plans, that its is too
difficult, that doing is more important than planning, that planning is notoriously
inaccurate etc… (Anderson & Dunkelberg, 1993). Indeed the problem often is that if
the owner does not perceive that his/her company is better of having planned he/she
will no longer allocate time nor resources to planning…(Shuman & Seeger, 1986). The
planners however argue that business plans allow to organize their thoughts, develop a
road map for the business, and gives them a way to communicate their thoughts to
bankers, investors, key employees, the management, and the network of suppliers,
customers, and other strategic partners or stakeholders.
There are various arguments as to what type of strategy is the more effective
one; for example, should it be more formal and written or rather informal and implicit?
For instance, while Porter believes that some degree of formalized planning is more
effective, Quinn advocates that strategy (and therefore strategic management) is the
representation of logical steps in the historical strategic evolution of the firm (Quinn,
1980) and Mintzberg favors the adaptive 'visionary' approach of strategy based on
implicit experiential learning, intuition and creativity of key personnel and cautions
that planning can be overdone, inherently incorrectly done, and therefore largely
ineffective (Mintzberg, 1994a). Mintzberg does not believe in no planning at all, but
argues that both pro-active adaptation, learning and dynamic processes should be used
in developing a final business strategy. As a matter of fact, however, small firms by
and large strive to achieve firm growth and competitive advantage by employing formal
Porterian strategies such as cost leadership, differentiation and focus (Reid, Jacobson,
& Anderson, 1993). Schwenk and Shrader (1993) have applied meta-analysis for the
first time to the results of a broad range of studies on formal strategic planning and
small firm performance, concluding that, firstly, the effect of strategic planning moderates or affects performance in small firms and, secondly and more specifically,
strategic planning is a beneficial activity for small firms. In their break-through work
Schwenk and Schrader (1993) refer to research on the effects of strategic planning on
the financial performance of small businesses done by Bracker (1986), Bracker e.a.
(1988), and Shrader e.a. (1989). Also reference is made to other meta-analyses by
Robinson & Pearce (1984) studying at the one hand "the process" of strategic planning

19
(see Armstrong (1982) and Bracker (1986)) and at the other hand "the degree of
formality" (Pearce, Freeman, & Robinson, 1987; Schrader, Taylor, & Dalton, 1984), for
example manual usage, the amount of emphasis on developing written plans covering at
least three years (at max 5 years), the formulation of goals and strategies, and/or the
existence of specific schedules for formulating and/or evaluating plans (Fredrickson,
1984; Ramanujam & Venkatraman, 1987) and by the planning comprehensiveness
(Fredrickson & Mitchell, 1984), thoroughness, sophistication (Robinson & Pearce, 1988)
or structuredness of the planning process used by the organization (Phillips &
Moutinho, 2000), for example business mission and objectives, contextual (internal
versus external) and environmental analysis, strategy formulation, definition of the
strategic planning and policies, implementation of the planning, monitoring policies,
control strategy outcomes, and feedback (in terms of further commitment to the
strategy process or change) (Hisrich & Peters, 1998(1989)). Although strategic planning
most likely improves performance, in relation to performance the simple fact of writing
out of the plans does not affect performance (Ackelsberg & Arlow, 1985). On the other
hand, small electronics firms that engaged in sophisticated strategic planning -
requiring a formal format- performed better than unstructured planners; strategic planning sophistication ranging from structured strategic planning over structured
operational planning and intuitive planning to unstructured planning (Bracker, 1986;
Bracker, Keats, & Pearson, 1988). Lyles e.a. (1993) concluded that greater planning
sophistication is associated with improved performance as measured by growth in sales.
Therefore, nevertheless the fact that firms with no written plans exhibit a slower
growth rate than firms with more sophisticated planning (Rue & Ibrahim, 1998), not
the degree of formality but rather the planning sophistication is expected to relate to
better firm performance. Analysis of the content, comprehensiveness or scope of
strategic planning started of with case studies, mostly of larger firms, followed by single
industry and intra-industry studies in order to develop typologies of generic business
strategies (Hofer & Schendel, 1978; Miles & Snow, 1978; Porter, 1980), providing a
common set of business strategies from which firms can select the most appropriate
depending on their own strengths and weaknesses relative to competitors (Rue &
Ibrahim, 1998) addressing different goals and objectives such as growth, profitability,
human resource development, company image, customer relations, new products
(innovation), new markets, finances etc. (Hisrich & Peters, 1998(1989)) Thus, planning
-being one of the major categories of strategy process research- and its content are
interrelated concepts when linked to performance (Olson & Bokor, 1995). Some
relations between content and performance have been shown; however, the
generalizability of the findings has been challenged.12 Notwithstanding the fact that
Fredrickson (1984, 1986) argues that planning formalization does not represent what
actually occurs during the strategic decision process, Lyles e.a. (1993) have found
evidence for the relationship between planning formality and three other elements - the
process by which strategic decisions are made, the content of small firm strategies, and
firm performance. One of the major findings was that a key effect of formal planning is that it alters specific elements of the overall strategic decision process (Ramanujan e.a.
(1986) in Lyles e.a., pp. 39), for example the variety of strategic decision-making (Rue &
Ibrahim, 1998). As suggested already at the beginning, many business-owners argue
that formal strategic planning provided a structure for decision-making, helping small
business managers to take a more realistic long-term view (Schwenk & Schrader, 1993,
12
Because a firm‟s performance is influenced by the main effects of strategy process and content as well as their
interaction effect, distinctive mixtures of strategic planning patterns for both test and control group will be made
even more apparent when the above characteristics are linked to other parameters such as the growth rate of the
firm, the creation of other firms, financing methods, etc.
20
pp. 53). For example (Robinson, 1982) found that small businesses that employed
consultants to help with strategic planning performed better than firms that did not.
Formal and non-formal planners follow basically the same strategic decision processing
differing only on one dimension - formal planners place more emphasis on formulating
strategic goals (Robinson & Pearce, 1983). According to Smith (1998) business-owners
that plan in a formal way deal more effectively with problems and risky situations as
they occur on a pro-active rather than a reactive basis.
Strategic planning effectiveness
Previous mentioned research has extensively elaborated the relationship between
(formal) business planning and organizational performance (survival rate, business
growth, etc…) and showed that a rather consistent and positive relation exists between
the extent of planning activities and performance (Lyles et al., 1993; Smith, 1998). In
the case of small business research, Rue and Ibrahim (1998) classified the business
planning versus performance research in two main streams: the first contends that
planning improves profitability (for example Aram & Cowen, 1990), and the second
stream recognizes that "good" planning is a key to "firm success" (for example Hillidge,
1990). However, the existence of a business plan was not, in itself, found to be a
predictor of success (Reid et al., 1993). As seen, the literature nevertheless strongly
supports the argument that, in small business, planning is a key issue (Rue & Ibrahim,
1998). Planning not only increases the company success rate (Jones, 1982), but it also
influences the level of performance and chances for survival (Perry, 2001). In essence,
Perry (2001, pp. 204) found that failed firms planned less prior to their failure than
non-failed firms indicating that "planning does make a difference and can reduce the
probability of firm failure". Effective business planning is so important to small
business management that it has since the late seventies received a great deal of
attention from researchers such as van Hoorn, 1979), Jones (1982), Ackelberg & Arlow
(1985), Timmons, 1998(1994), Trailer and Wolford (1997) or Rue and Ibrahim (1998).
Business plans draw conclusions regarding the feasibility and viability for both the
short term and the long term of business ideas, venture creation, or performance goals,
assessing the safety and social legitimacy of the business for all stakeholders (Trailer &
Wolford, 1997). It is, therefore, that, most commonly, small business-owners believe
that, firstly, the process or formalization of sophisticated planning, not just the plan,
enhances management decision-making (Pearce et al., 1987) as well as the evaluation of
the outcomes of strategic planning as well as a firm's performance (Lyles, Baird, Orris,
& Kuratko, 1993; Robinson & Pearce, 1984) and that, secondly, planning should not
only be the outcome of covering all the bases but also of covering them effectively (Lyles
et al., 1993; Watts & Ormsby, 1990). Therefore, planning is a continual and partly routine process, particularly in a rapid changing environment; changes are made over
time with the purpose of establishing an important long-term focus (Hisrich & Peters,
1998(1989)). Effective business plans (answering questions about what business are we
entering and how?) are however not a function of management and entrepreneurial
topics alone. Smith‟s work (1998) suggests a positive association between higher
intensity of information gathering on these issues and higher levels of performance
(Chi-square: .059 at p-level < .10). In general, it seems reasonable to believe that
greater knowledge of the environment in which the firm operates (perceived in terms of
opportunities and threats) and of the internal capabilities (in terms of strengths and
weaknesses) enables the business-owner to take more informed and therefore better
decisions, leading in turn to better management, more realistic and proficient planning
and thus enhanced performance (Madu & Kuei, 1993). The reality, however, still all too
often is that entrepreneurs get bogged down in the actual mechanics of writing. The
21
material often comes out too conceptual or disorganized, and they don't know how to fix
it… (Bygrave, 1990).
Management training and strategic planning
Since the mid-eighties institutions for graduate, post-graduate, advanced, and post-
experience education experienced a massive increase in the demand of general
management, planning and entrepreneurship modules in their training courses dealing
with start-ups or new venture creation. Universities and centers for continuous
education came up with a variety of course offerings, ranging from the more
traditionally structured ones consisting out of lectures and projects on business idea
development, venture design and business planning, case-study writing, and reading to
more innovative courses developed to address the unique personality (= entrepreneurial
characteristics and managerial techniques [EC+MT]) of the trainee. In the same way
most of the management programs at the SME-Department of The Vlerick School of
Management were re-oriented too… in a rather successful way, as we will see. In the
early nineties, the first studies and readings demonstrating the positive effect of
management education and training and individual counseling on entrepreneurship
and applied management techniques in general and on the business planning
proficiency of SME-businessmen more specifically appeared (Atherton & Hannon, 1995;
Gibb, 1995; Gibb & Nelson, 1996; Schwenk & Schrader, 1993). Some contributions
even manifestly suggest post-experience management training to be "an important explanatory factor" for a higher survival rate and chances for growth (Crant, 1996;
Rosa, Scott, & Klandt, 1996; Van Clouse, 1990) and that mortality risk for new
ventures is a function of mastering general management techniques (Douglas, 1997 pp.
1), especially business planning or strategy formulation (Smith, 1998). Moreover,
Smith (1998) found that "if there was a recurring management problem, (business
starters) would address it most effectively in a training way."
According to the 'pro-active entrepreneurial attitude' involving certain
entrepreneurial intentions and heritage (for example gender, education and
entrepreneurial parental role modeling) (Crant, 1996), and the above assumed positive
effect of management training on entrepreneurial skills and managerial techniques,
above all on business planning proficiency, ADEPT are likely to show 'a distinctive strategic planning‟ attitude from NOVICE.13 ADEPT were expected to differ not only
on the full list of entrepreneurial characteristics and management techniques
[EC+MT], but also on the strategic planning relating EC+MT (proposition 4a), in other
words the most distinctive EC+MT were expected to correlate better with the growth-
related strategic planning modes in the case of ADEPT (proposition 4b). Moreover, in
the case of ADEPT the strategic importance attached to management training (as a
control variable) was expected to relate significantly to the EC+MT as mentioned in
proposition 4b (proposition 4c); no relation was expected for NOVICE.
The above propositions are summarized and visualized in the research models
1A and 1B. Explanatory value of relations between (a) definite sets of entrepreneurial characteristics and managerial techniques [EC+MT] and (b) strategic planning proficiencies, and between the latter and (c) business growth rate of start-ups (both 13
Because it seems impossible to quantify and conglomerate the effects and entrepreneurial, managerial and
self-employing characteristics of entrepreneurship inside one definite holistic structure, this research must be
seen as nothing more than 'another attempt' to determine what kind of entrepreneurial characteristics
(entrepreneurship) versus managerial techniques (management) interrelations originate from what contextual
business background.

22
financial and non-financial) were sufficiently established for both the test and control
groups.
FIGURE 1A
Management training as a catalyst for better strategic business planning proficiency
Moreover, for ADEPT the catalyst role of "the strategic importance attached to management education and training" (= EC+MT control variable) and the fact of being
trained or not on the relation (a) (b) for more proficient strategic planning (both
quantitatively and qualitatively -see above-) was also be established (see figure 1B).
FIGURE 1B:
Is management education and training a "catalyst" for strategic planning effectiveness?
Entrepreneurial
characteristics
and managerial techniques
(EC+MT)
Management
education,
training and
counseling
Strategic planning
proficiency
Business growth
(annual turnover
and personnel)
Other elements:
age, education, experience,
pre- and post-start-up
motivations...
??
23
From here the authors will determine, firstly, what sets of strategically important
EC+MT relate best to what kind of business growth-related strategic planning,
secondly, if there are any significant differences between the test and control group, and
thirdly, if these EC+MT profiles for ADEPT significantly better links with the
discriminating EC+MT variable "the strategic importance attached to 'management education and training".14 One way to investigate possible explanatory one- or two-way
relations is by testing correlations resulting in a selection or set of positively correlating
EC+MT and by doing a regression analysis for all well-planners (assuming their
businesses indeed grew due to the strategic well planning). In brief, arguments pro or contra the fact that ADEPT show a higher survival rate, a higher business growth
related strategic planning proficiency and their general EC+MT profile (included the
fact of having enjoyed management education, training (and counseling)) is researched.
EC+MT-profiles versus strategic planning profiles
Research findings suggest that any of the above listed inter-group differentiating
specific EC+MT (see Table 4) may enhance the strategic planning proficiency ((1)
performance better or equal as planned, and (2) performance worse than planned) and
therefore the overall performance of the SMEs (Ballantine e.a, 1992). In this part
through correlation and multiple regression analysis at a 5percent level of significance
the explanatory value and causality between (sets of) EC+MT (= independent grouping
variable) and the dependent sets of growth-related (well-)planning attributes (see
previous part) will be examined, hence out-selecting all growth-restraining planning
profiles. Tripled correlations for all 28 EC+MT-variables and all ten dependent
strategic planning variables resulted in the analysis of EC+MT profiles for (1) well
planning businessmen (cf. Spearman R: R > .30) as well as for (2) the strategic planning
correctness (Spearman R: .10 < R < .30).15 The multiple regression analysis gives an
indication of how what the relation is between the EC+MT profiles and the growth-
related strategic (well-)planning profiles. Table 6 and 6 summarize the respective
EC+MT sets for ADEPT and NOVICE.
In the case of ADEPT (n=13 to 18 for well planning and n=90 to 105 for planning
(** see table 6: resulting regression optimization)) the significantly growth-related
(well-)planning of „pro-active adaptation‟, „sales turnover‟, „return on sales turnover‟,
„product innovation‟ and ROE are due in a rather indicative way to a focus on the
following strategic important EC+MT: „conceptual thinking and rational decision-making‟, 'delegation of tasks', and to a less significant extent to 'external advise',
'external board of directors', 'general management', and „management education and training‟.
This combined set of EC+MT items is to be considered to have a more than
average strong positive influence on the growth-related planning, explaining:
14
In order to comprehend better the possible explanatory value of the strategic importance of "management
education and training" for the above relationships between the distinguished pre- and post-start-up and
EC+MT-profiles and the business growth-related (well-)planning profiles we refer to figure 2.A and 1.B (see
above). 15
Only originally retrieved significant correlations by one-way ANOVA/ MANOVA which were reinforced by
either the sign or the intensity of the Spearman R rank correlation value for ordinal scales were selected for
further research on their relative impact on business growth. The adhered methodology is generally accepted
and is described in Huizingh, E. (1996) SPSS voor Windows, Academic Service - economie en bedrijfskunde,
Schoonhoven - Holland, p. 286.

24
4percent of the (well-)planning of return on sales turnover
4percent of the (well-)planning of sales turnover
1,7 to 7,7percent of the (well-)planning of product innovation
1,7 to 7,7percent of the (well-)planning of pro-active adaptation
1,7 to 7,7percent of the (well-)planning of ROE/personal wealth.
TABLE 6
EC+MT versus growth-related strategic planning attributes for ADEPT
EC+MT /
Growth-related strategic
planning attributes
Pro-active
adaptation
Return on
sales
turnover
Sales
turnover
Product
innovation
ROE
Conceptual thinking and rational
decision-making
-.12* .33 .16 .45 -
Delegation of tasks .38 .41 .32 (-.12) (-.10)
External advise - (.20) .33 - (.10)
External board of directors - (.16) .32 - (-.15)
General management - -.45 - - .36
Management education and
training
- - -.10 - .31
**Spearman R (R > .30 (t(N-2) > 1 and p < .32) confirmed by intensity of the T-test correlation value (p < .05)
(values) = based on Spearman R = .10 < R < .30 for all planners.
For NOVICE (n=13 to 17 for well planning and 91 to 108 for planning) only three
out of eight significantly differing EC+MT items correlated positively for the growth-
related strategic planning mode consisting out of planning 'return on sales turnover',
'sales turnover', and 'product innovation'. This combined growth-related planning
proficiency depends in 4 to 13percent of all cases on a combined strategy focus on
„analytic book-keeping‟ (.42), „international market competition‟ (.75), and „profitability‟
(= rentability; .43).
In the case of NOVICE, the above set of EC+MT is more than the average
positively influencing the growth-related planning profile, explaining:
18percent of the (well-)planning of return on sales turnover
10percent of the (well-)planning of sales turnover
17percent of the (well-)planning of product innovation.
Compared to ADEPT, the explanatory value of these EC+MT variables for
NOVICE is higher, which is partially due to the extreme low variance between the cases
included in the sample (based on the selection of all cases (well-)planning the three
strategic items simultaneously). However, only the strategic importance attached to
the internal market competition (.75) makes the growth-related planning profile of
NOVICE as conclusive as that of ADEPT.
TABLE 7
EC+MT versus growth-related strategic attributes for NOVICE
EC+MT /
Growth-related strategic
planning attributes
Return on sales
turnover
Sales turnover Product innovation
25
Profitability (rentability) - - .43
Analytic book-keeping .42 - -
International market competition - -.31** .75
**Spearman R confirmed by intensity of the T-test correlation value (p < .05).
For ADEPT most differentiating EC+MT variables (namely the strategic importance
attached to „conceptual thinking and rational decision-making‟, „external advise‟,
'external board of directors', 'general management', „delegation of tasks‟ and
'management education and training') relate extraordinary well with the growth-related
strategic (well-)planning profiles (for example 'pro-active adaptation' and 'product
innovation' in combination with 'return on sales turnover (ROS) (profitability)' for
growth of sales turnover, and in combination with 'sales turnover' and 'ROE/personal
wealth' for annual growth of personnel). In the case of NOVICE hardly any of the
significantly above-mentioned intra-group differentiating EC+MT relate to the business
growth-related strategic planning profiles. Hence, proposition 4a is sustained for
ADEPT only: business growth related EC+MT link significantly to the discriminating
EC+MT control variable for the relevance of management education and training for
business growth, namely the strategic importance attached to management education
and training.
In how far is the strategic importance attached to "management education and training" a catalyst for proficient strategic planning?
In essence, the above question summarizes existential issue for all business schools,
and the positive answer provides them with long-term legitimacy of their work and
ambition of teaching, counseling, networking etc. In this part the authors control for
the discriminating effect of the strategic importance attached to management training
and education for the growth-related strategic planning proficiencies. Therefore, as a
control variable for this "the strategic importance attached to management training and education" was adopted in the total EC+MT list. Firstly, the very simple logic that
business-owners that attach a high strategic importance to management education and
training will eventually get management trained was proven correct, the correlation
being 1.00** at a p-significance level of .01 (for ADEPT). Secondly, the higher the co-
alignment or correlation between the strategic proficiency-related EC+MT-attributes
and the control variable 'management training and education', the higher the
plausibility that management training has indeed an impact on the business
performance (survival and growth).
Following basic statistics, non-parametric statistics (since EC+MT concern
dummy variables), and correlation tests using „performance/growth‟ as the dependent
variable and controlling for the above proposition 4b and 4c the authors therefore
assume that (1) management training in general positively relates to the growth
pattern of those enterprises that attach a highly strategic importance to management
training and education and are therefore likely management trained, and (2) that this
is merely the case when the control variable 'management training' relates positively
with the respective growth-related planning profile related EC+MT variables.
A tree cluster for all EC+MT variables makes it possible to line up all EC+MT
that relate more or less to the EC+MT control variable "the strategic importance attached to management education and training". Concerning the 11 C+MT that more
or less significantly differed from NOVICE (see Table 4) in the case of ADEPT clearly

26
three sub-clusters could be detected: a first one combining 'subcontracting', 'external advise' and 'external board of directors', a second sub-cluster containing 'strategy making (SIM)' and 'delegation of tasks', and a third sub-cluster with 'management education and training', 'local market competition', 'general management', and
'conceptual thinking an rational decision-making'. Although only two of these EC+MT
relate within narrow Euclidean distances to the EC+MT control variable looking at the
growth-related strategic (well-)planning EC+MT profile for ADEPT (see Figure 5) all
three sub-clusters seem to be largely important in explaining the eventual growth path
of the start-ups.
FIGURE 5
Tree structure for all more or less 'strategically important' EC+MT, including
"management education and training"
Legend:
(the strategic importance of) ANALYST = analytic book-keeping; CREAT = creativity; DELBESL = delegation of decision-making; DELTAKEN = delegation of
tasks; EIGCONCE = conceptual thinking and rational decision-making; EXTADVE = external advise; EXTRVB = external board of directors; FINBEHEE =
financial management; INTMARKT = international market; KLANTGER = client oriented; KOSTCALC = cost-accounting; KWAL = quality management;
LAAGLOON = flexibility (wage/hours < average in the sector) LANGUREN = flexibility (hours/wage < average in the sector); LEIDERSCH = leadership;
LOKMARKT = local market; MANAGEME = general management; NIEUWPROD = product innovation; ONDERAAN = subcontracting; OPLEIDIN =
management education and training; PERSAMB = personal ambition; PERSBEHE = HRM/HRD; PRODPROC = production process; RENDAB = profitability
(rentability); STOCKBEH = stock management; STRAT = strategy making (strategic issues management) TEAMGEES = team spirit; TIMEMGT = time
management.
The same analysis for NOVICE suggests that only two sub-clusters and a couple
of loose related EC+MT can be identified: the sub-cluster containing 'time management', 'stock management', and 'analytic book-keeping' relates in some way with "the strategic importance attached to management education and training". These EC+MT are
however not as important for explaining the eventual business growth compared to the
EC+MT of the two sub-clusters for ADEPT (see Table 7).
In general it has become clear that the strategic importance of management education and training „by itself‟ does not relate significantly to any of the strategic planning
profiles nor to any of the strategy dimensions that have been identified as being growth-
related. Only in combination with or through other EC+MT the strategic importance of
management education and training and therefore the fact of being management
trained or not could be established. In the case of ADEPT proposition 4b has been
sustained to a rather positive extent and not sustained in the case of NOVICE:
business growth-related strategic planning proficiencies correlate only with the
EC+MT control variable for ADEPT.
Hence, based on the constitution of the above EC+MT sub-clusters and their
relative strength in explaining the growth-related strategic planning proficiencies as
well as on a positive relation with the EC+MT control variable "strategic importance
Tree Diagram for 28 Variables
Complete Linkage
Euclidean distances
Lin
ka
ge
Dis
tan
ce
2
3
4
5
6
7
8
PR
OD
PR
OC
INT
MA
RK
T
ON
DE
RA
AN
E
XT
RV
B
EX
TA
DV
IE
LA
AG
LO
ON
TIM
EM
GM
T
ST
OC
KB
EH
AN
AL
YS
T
S
TR
AT
NIE
UW
PR
O
OP
LE
IDIN
DE
LT
AK
EN
DE
LB
ES
L
KO
ST
CA
LC
R
EN
DA
B
FIN
BE
HE
E
MA
NA
GE
ME
TE
AM
GE
ES
LE
IDE
RS
H
PE
RS
BE
HE
LO
KM
AR
KT
LA
NG
UR
EN
EIG
CO
NC
E
KL
AN
TG
ER
KW
AL
PE
RS
AM
B
C
RE
AT
Tree Diagram for 28 Variables
Complete Linkage
Euclidean distances
Lin
ka
ge
Dis
tan
ce
1
2
3
4
5
6
7
8
ST
OC
KB
EH
NIE
UW
PR
O
PR
OD
PR
OC
INT
MA
RK
T
ON
DE
RA
AN
E
XT
RV
B
EX
TA
DV
IE
AN
AL
YS
T
TIM
EM
GM
T
LA
AG
LO
ON
S
TR
AT
DE
LT
AK
EN
DE
LB
ES
L
PE
RS
BE
HE
LE
IDE
RS
H
KO
ST
CA
LC
R
EN
DA
B
FIN
BE
HE
E
TE
AM
GE
ES
OP
LE
IDIN
LO
KM
AR
KT
MA
NA
GE
ME
LA
NG
UR
EN
EIG
CO
NC
E
PE
RS
AM
B
KL
AN
TG
ER
KW
AL
C
RE
AT
27
attached to management education and training", the catalyst function of this EC+MT
is not surprisingly more apparent in the case of ADEPT than for NOVICE. Hence,
proposition 4c has been sustained: the general firm growth-related EC+MT profile
relates to a great extent to the EC+MT control variable, whereas this is not the case
for NOVICE.
Within the boundaries of the above literature review, research questions and
basic tentative propositions, explanatory value of the business-owners'
entrepreneurship and management traits and more specifically the strategic planning
practice and the growth rate of their firms as well as the assumed catalyst effect of
management education and training hereupon are investigated. Since the touchstone
for the latter two is the proficiency with which small business-owners plan their future
businesses, strategic planning correctness and accuracy will be studied as critical
management traits and therefore potential growth factors.
Although many aspects on an entrepreneur's background have been explored, in
this part first of all the pre-start-up profile of the starting businessmen of both groups
(for example age, education, childhood family environment and the parental role
modeling, work history or pre-start-up experience, and start-up motivation or personal
values16) will be explored (Hisrich & Peters, 1998(1989)). These factors (see figure 1A
'Other elements') do not only mould diverse ranges of entrepreneurial characteristics
and management techniques [EC+MT] but could also directly affect the business
planning abilities. In most of the cases this background information indeed helped to
understand research findings regarding the relation between EC+MT profiles and
strategic planning proficiencies.
Secondly, the way in which post-start-up planning skills/abilities and EC+MT
(inclusive the motivation to continue the existing business) are supposed to be
influenced by management education and training during the start-up stage has been
studied. All variables -whether or not typically strategic of nature- were selected on
grounds of their relevance to the underlying research questions and tentative
propositions and because they are often cited as critical success factors for small
businesses (Attahir, 1995). In brief the growth and survival rate of both groups of start-
up firms will be analyzed. Where needed, T-test and/or ²-test results will indicate the
significance of the discrepancies between samples (variables or groupings) and their
average scores.
As we assumed a relationship between management education and training and
more effective planning, one would expect a majority of ADEPT to attach a higher
strategic importance to conceptual thinking, rational decision-making, strategy
formation, formalized and systematic planning and management control than their
average non-trained colleague-starters. Early findings (Schamp & Deschoolmeester,
1998a, 2001) indeed suggested that:
1. Management training increases the level of (strategic) planning proficiency,
meaning more formalized and better planning, and, secondly, more and better
planning leads to better firm performances. In particular, ADEPT produce
significantly higher average scores on the multidimensional proficiency
16
Ten years ago, the fraction of women in our management training programs was far too little to analyze. Since
then the Center of SME launched the “Women and Entrepreneurship” program. Still, statistical analysis is
insignificant compared to the total population of female entrepreneurs. No comparative study was done on this
matter between the “Vlerick”-starters and “NOVICE”.
28
scaling of strategic planning, both quantitatively (= the frequency and
correctness of the planning) and a qualitatively (= the sophistication, scope
and comprehensiveness of the planning) way.
2. Proficient planning is to a large extent be explained by the planning
formalization, its frequency, the sophistication or thoroughness of the plan
and the well planning of the strategy items.
3. As suggested, ADEPT attach a higher strategic importance to management education and training, conceptual thinking and rational decision-making, strategic (issues) management, business planning, general management control and networking.
STRATEGIC PLANNING EFFECTIVENESS AND FIRM PERFORMANCE
Introduction
Strategic planning formalization has been defined as the degree to which strategic
planning unfolds as an unending process of timely recurring evaluation of the firm
strategy and innate strategic planning, in which [1] a wide-ranging scope of strategic
issues is developed in a sophisticated and well-structured manner, [2] a set of strategic
targets are formulated and [3] proper evaluation mechanisms are defined.
From the above it may be assumed that more strategic planning formalization
(in other words proficient strategic planning) will lead to higher levels of strategic
planning effectiveness. There are, however, many layers in constructing strategic planning effectiveness. Planning formality, frequency, timing, scope, profoundness,
sophistication, etc. all influence the strategic planning success ratio in terms of firm
growth. From the preceding literature study and empirical data research (see above:
PRECEDING RESEARCH) this part of the study narrows down to three important
determinants of the strategic planning effectiveness: strategic targeting, the degree of
strategic planning correctness and the level of strategic planning accuracy. As we will
see a more general model could be derived, indicating that, firstly, more strategic
planning leads to more correct planning (lower overestimating), and that, secondly,
under these conditions more correct planning will lead to more accurate planning (i.e.
strategic planning leads to firm growth). Based on these assumptions, strategic
planning effectiveness is thus proposed as a viable measure for the way strategic
planning accuracy is due to correct strategic planning.
From the literature it may be concluded that there is an essential relationship
between the independent variable „business planning (attitude)‟ and the dependent
variable „business growth (performance)‟ and that planners out-perform non-planners.
As seen, past research efforts to determine the effect of the planning process on firm
performance mainly concentrated on dividing firms into those with formal planning
systems and planning sophistication and related these factors to measures of financial,
sales, turnover, etc. performance. Hence assuming that proficient business planning
will outperform firms informal, non-recurring and incomplete planning. Recent reviews
however also have pointed to certain gaps in our knowledge of planning versus
performance relationships, caused by (1) the standards used to define small businesses
and to assess formal planning, (2) the seldom relevant time periods during which it is
measured and (3) the lack of organizational and contextual background information
(Lyles et al., 1993; Mintzberg, 1991; Naffzinger & Kuratko, 1991; Schrader et al., 1989).
Assuming that formalized (and therefore written) strategic planning is rarely
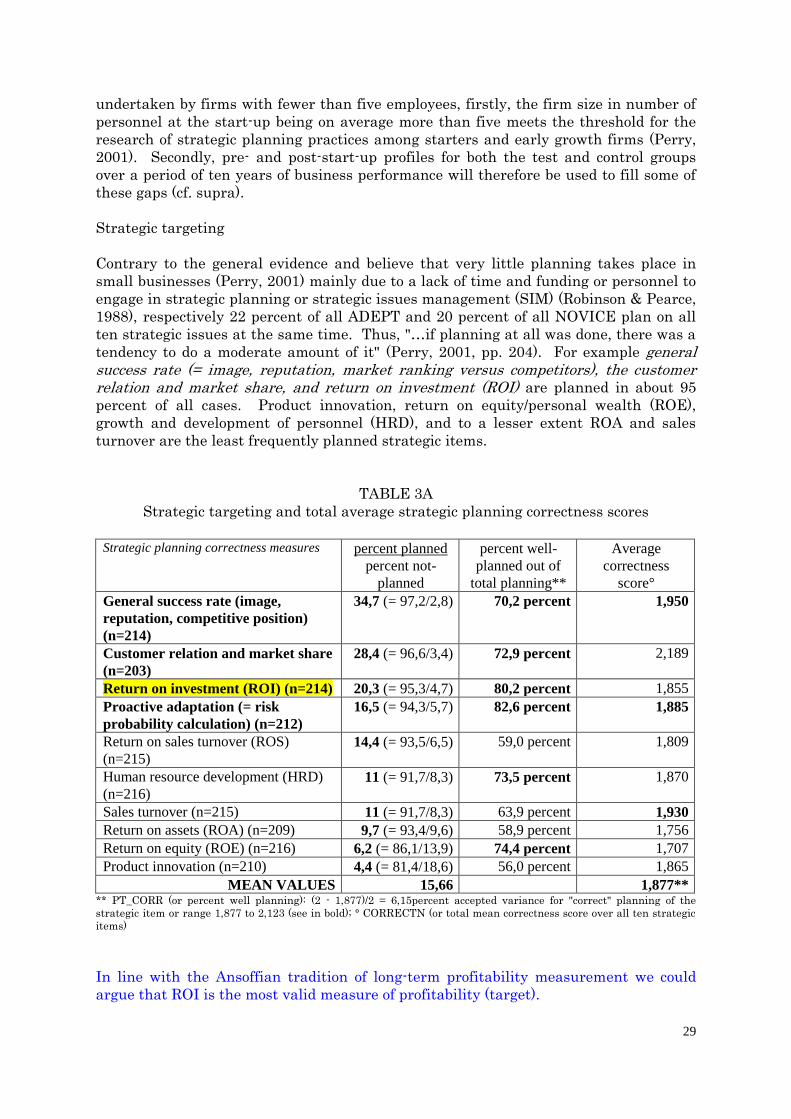
29
undertaken by firms with fewer than five employees, firstly, the firm size in number of
personnel at the start-up being on average more than five meets the threshold for the
research of strategic planning practices among starters and early growth firms (Perry,
2001). Secondly, pre- and post-start-up profiles for both the test and control groups
over a period of ten years of business performance will therefore be used to fill some of
these gaps (cf. supra).
Strategic targeting
Contrary to the general evidence and believe that very little planning takes place in
small businesses (Perry, 2001) mainly due to a lack of time and funding or personnel to
engage in strategic planning or strategic issues management (SIM) (Robinson & Pearce,
1988), respectively 22 percent of all ADEPT and 20 percent of all NOVICE plan on all
ten strategic issues at the same time. Thus, "…if planning at all was done, there was a
tendency to do a moderate amount of it" (Perry, 2001, pp. 204). For example general success rate (= image, reputation, market ranking versus competitors), the customer relation and market share, and return on investment (ROI) are planned in about 95
percent of all cases. Product innovation, return on equity/personal wealth (ROE),
growth and development of personnel (HRD), and to a lesser extent ROA and sales
turnover are the least frequently planned strategic items.
TABLE 3A
Strategic targeting and total average strategic planning correctness scores
Strategic planning correctness measures percent planned
percent not-
planned
percent well-
planned out of
total planning**
Average
correctness
score°
General success rate (image,
reputation, competitive position)
(n=214)
34,7 (= 97,2/2,8) 70,2 percent 1,950
Customer relation and market share
(n=203)
28,4 (= 96,6/3,4) 72,9 percent 2,189
Return on investment (ROI) (n=214) 20,3 (= 95,3/4,7) 80,2 percent 1,855
Proactive adaptation (= risk
probability calculation) (n=212)
16,5 (= 94,3/5,7) 82,6 percent 1,885
Return on sales turnover (ROS)
(n=215)
14,4 (= 93,5/6,5) 59,0 percent 1,809
Human resource development (HRD)
(n=216)
11 (= 91,7/8,3) 73,5 percent 1,870
Sales turnover (n=215) 11 (= 91,7/8,3) 63,9 percent 1,930
Return on assets (ROA) (n=209) 9,7 (= 93,4/9,6) 58,9 percent 1,756
Return on equity (ROE) (n=216) 6,2 (= 86,1/13,9) 74,4 percent 1,707
Product innovation (n=210) 4,4 (= 81,4/18,6) 56,0 percent 1,865
MEAN VALUES 15,66 1,877** ** PT_CORR (or percent well planning): (2 - 1,877)/2 = 6,15percent accepted variance for "correct" planning of the
strategic item or range 1,877 to 2,123 (see in bold); ° CORRECTN (or total mean correctness score over all ten strategic
items)
In line with the Ansoffian tradition of long-term profitability measurement we could
argue that ROI is the most valid measure of profitability (target).

30
Strategic planning correctness
Figure 4A visualizes the strategic planning versus performance axes defining the
following types of strategic planning: non-planning, bad-planning (overestimators as
well as underestimators), and correct planning. Non-planners don't plan and bad-
planners deliver business performance outcomes over the years for instance 10 percent
up or below what was originally planned for; hence, performance far of the expected and
planned for. In figure 4B this accepted deviation percentage from the optimal 2-score is
be calculated based on the total mean value of all ten strategic planning items. In the
case the business outcome are way above the expected we see underestimators at work,
when performances are way below expectations we have overestimators at hands.17
Correct planners deliver business performance outcomes over the years as was planned for; hence, performances in the line of the expected or planned for.
FIGURE 4A
Strategic planning correctness and accuracy versus a strategic planning typology
Tables 3A and 3C represents the results which formed the basis to set out a four-dimensional strategic planning scale (for example 1 = the business performance was
worse than planned; 2 = the performance was as planned; 3 = the performance was
better than planned; and the performance was not-planned) (Bracker, 1986; Lyles et al.,
1993). This scale enabled the measurement of the frequency, scope, and the strategic planning "correctness" for both test and control group. Due to the small number of
firms reporting that the performance was better than planned, strategic planning
correctness was dichotomised into (1) performance better (= underestimators) or equal (= correct planners) as planned, and (2) performance worse than planned. This 17
In order the mention the downside of this categorization we refer to the fact that the group of well planning
starters might also include some very proficient, realistic or even conservative planners (the latter setting rather
low, easy to fulfill targets). On the contrary the over-estimators might include some very progressive and
challenging business-owners.
Correct
planning
Strategic planning
(goals)
Strategic planning
outcomes
Accurate
planning
Strategic planning
proficiency
Firm
performance
Correct
planning
90%
correctness
Overestimators
Underestimators
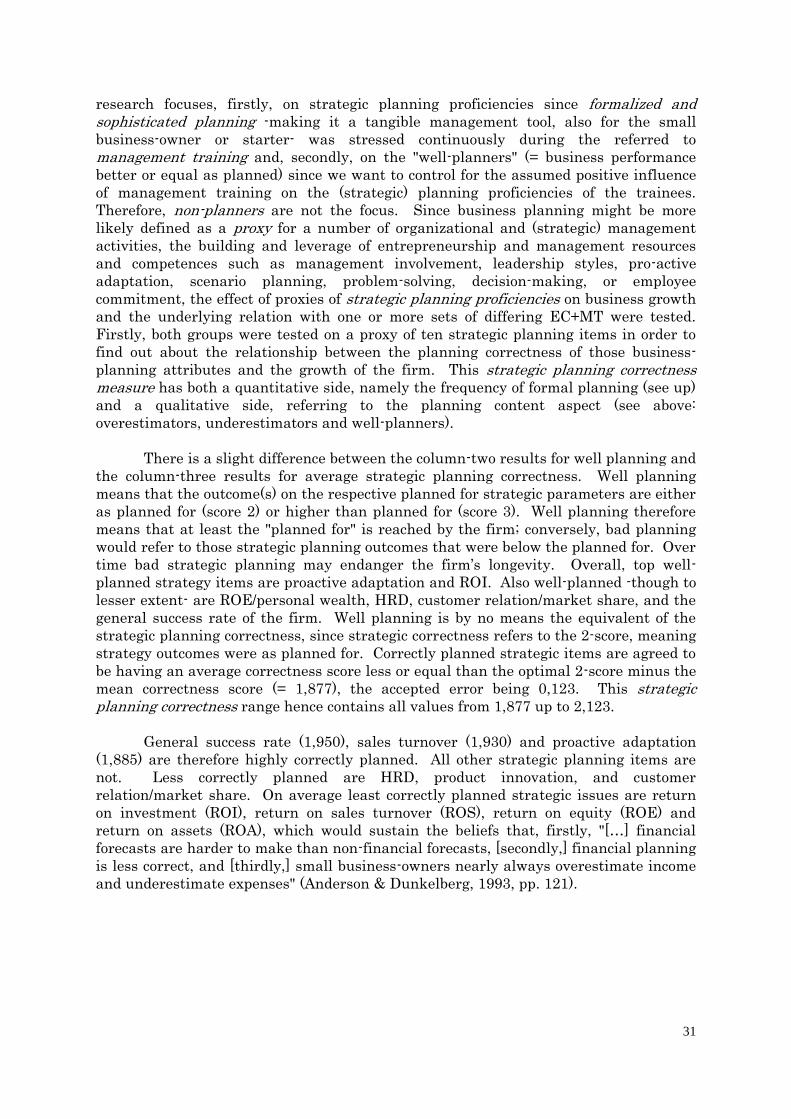
31
research focuses, firstly, on strategic planning proficiencies since formalized and sophisticated planning -making it a tangible management tool, also for the small
business-owner or starter- was stressed continuously during the referred to
management training and, secondly, on the "well-planners" (= business performance
better or equal as planned) since we want to control for the assumed positive influence
of management training on the (strategic) planning proficiencies of the trainees.
Therefore, non-planners are not the focus. Since business planning might be more
likely defined as a proxy for a number of organizational and (strategic) management
activities, the building and leverage of entrepreneurship and management resources
and competences such as management involvement, leadership styles, pro-active
adaptation, scenario planning, problem-solving, decision-making, or employee
commitment, the effect of proxies of strategic planning proficiencies on business growth
and the underlying relation with one or more sets of differing EC+MT were tested.
Firstly, both groups were tested on a proxy of ten strategic planning items in order to
find out about the relationship between the planning correctness of those business-
planning attributes and the growth of the firm. This strategic planning correctness measure has both a quantitative side, namely the frequency of formal planning (see up)
and a qualitative side, referring to the planning content aspect (see above:
overestimators, underestimators and well-planners).
There is a slight difference between the column-two results for well planning and
the column-three results for average strategic planning correctness. Well planning
means that the outcome(s) on the respective planned for strategic parameters are either
as planned for (score 2) or higher than planned for (score 3). Well planning therefore
means that at least the "planned for" is reached by the firm; conversely, bad planning
would refer to those strategic planning outcomes that were below the planned for. Over
time bad strategic planning may endanger the firm‟s longevity. Overall, top well-
planned strategy items are proactive adaptation and ROI. Also well-planned -though to
lesser extent- are ROE/personal wealth, HRD, customer relation/market share, and the
general success rate of the firm. Well planning is by no means the equivalent of the
strategic planning correctness, since strategic correctness refers to the 2-score, meaning
strategy outcomes were as planned for. Correctly planned strategic items are agreed to
be having an average correctness score less or equal than the optimal 2-score minus the
mean correctness score (= 1,877), the accepted error being 0,123. This strategic planning correctness range hence contains all values from 1,877 up to 2,123.
General success rate (1,950), sales turnover (1,930) and proactive adaptation
(1,885) are therefore highly correctly planned. All other strategic planning items are
not. Less correctly planned are HRD, product innovation, and customer
relation/market share. On average least correctly planned strategic issues are return
on investment (ROI), return on sales turnover (ROS), return on equity (ROE) and
return on assets (ROA), which would sustain the beliefs that, firstly, "[…] financial
forecasts are harder to make than non-financial forecasts, [secondly,] financial planning
is less correct, and [thirdly,] small business-owners nearly always overestimate income
and underestimate expenses" (Anderson & Dunkelberg, 1993, pp. 121).
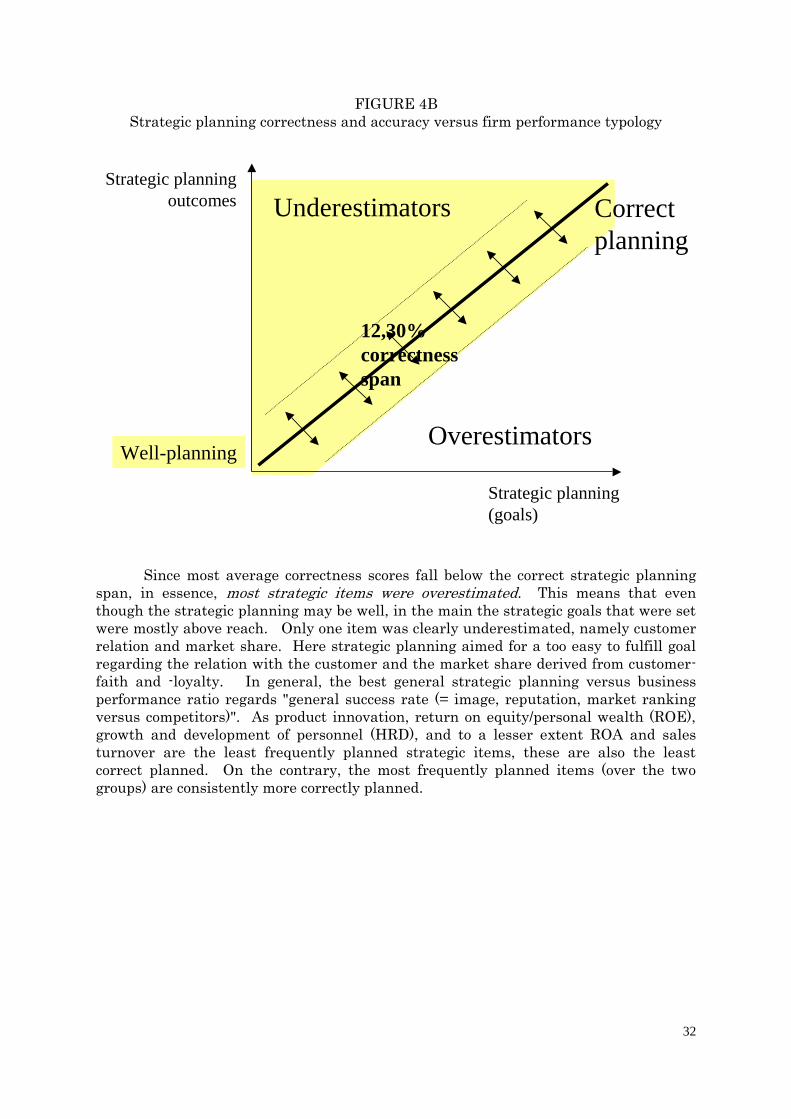
32
FIGURE 4B
Strategic planning correctness and accuracy versus firm performance typology
Since most average correctness scores fall below the correct strategic planning
span, in essence, most strategic items were overestimated. This means that even
though the strategic planning may be well, in the main the strategic goals that were set
were mostly above reach. Only one item was clearly underestimated, namely customer
relation and market share. Here strategic planning aimed for a too easy to fulfill goal
regarding the relation with the customer and the market share derived from customer-
faith and -loyalty. In general, the best general strategic planning versus business
performance ratio regards "general success rate (= image, reputation, market ranking
versus competitors)". As product innovation, return on equity/personal wealth (ROE),
growth and development of personnel (HRD), and to a lesser extent ROA and sales
turnover are the least frequently planned strategic items, these are also the least
correct planned. On the contrary, the most frequently planned items (over the two
groups) are consistently more correctly planned.
Correct
planning
Strategic planning
(goals)
Strategic planning
outcomes
12,30%
correctness
span
Overestimators
Underestimators
Well-planning

33
TABEL 3B
Planning, well planning and strategic planning correctness for the total population of
ADEPT and NOVICE
ADEPT + NOVICE Strategic planning° Well planning Planning
correctness
Strategic planning Pearson
Correlation
Sig. (2-tailed)
N
1.000
.
10
Well planning Pearson
Correlation
Sig. (2-tailed)
N
.413
.235
10
1.000
.
10
Planning
correctness
Pearson
Correlation
Sig. (2-tailed)
N
.638*
.047
10
.103
.177
10
1.000
.
10 *Correlation significant at the .05 level (2-tailed)
Based on the above table 3A and the correlations in table 3C we conclude that
more strategic planning (X-axis: the amount of planning versus non-planning ratio as
adopted in table 3A, first column) not only relates to better strategic planning in terms
of the amount of well planning (2- and 3-scores) (correlation coefficient: .413) but also to
more correct strategic planning (Y-axis: the correlation coefficient of .638* at a level p <
.05). Nevertheless the fact that the insignificance of the relation between planning -yes
or no- and the amount of correct strategic planning and that between the amount of
correctness and the level of well planning, because of the positive correlations, the
supposed model is adopted:
strategic planning (frequency) strategic planning correctness well planning [1]
strategic planning (infrequency) strategic planning incorrectness bad panning
[2]
Examples for [1]-relations (in decreasing order of significance) are for example
general success rate (image, reputation and competitive position), return on investment
(ROI), proactive adaptation, the customer relation/market share, return on sales
turnover (ROS), and sales turnover. Examples for [2]-relationships (in decreasing order
of significance) are return on equity/personal wealth (ROE), product innovation, return
on assets (ROA), and growth and development of personnel (HRD).

34
TABLE 3C
Strategic planning correctness: ADEPT versus NOVICE
ADEPT NOVICE
Strategic planning correctness
measures
outcome/
planning (= planning
correctness)*
well-
planning
(2-3)**
not-
planners
(out of
total)
outcomes/
planning (= planning
correctness)*
well-
planning
(2-3)**
not-
planners
(out of
total)
1. Sales turnover°
(N = 105 and 110)
1,87 65,1
percent
5,35
percent
1,90 62,7
percent
10,71
percent
2. Return on sales turnover
(ROS)°
(N = 106 and 109)
1,82 59,8
percent
4,46
percent
1,75 53,2
percent
8,04
percent
3. Return on equity (ROE) /
personal wealth
(N = 107 and 109)
1,54 62,9
percent
14,28
percent
1,84 68,8
percent
13,39
percent
4. Return on assets (ROA)°°
(N = 103 and 106)
1,68 55,7
percent
2,67
percent
1,78 51,9
percent
16,07
percent
5. Growth and development
of personnel (HRD)
(N = 108 for both)
1,75 70,6
percent
9,82
percent
1,99 66,1
percent
8,04
percent
6. Product innovation
(N = 105 for both)
1,63 62,3
percent
16,9
percent
2,10 41,9
percent
19,64
percent
7. Return on investments
(ROI)
(N = 107 for both)
1,86 79,6
percent
3,57
percent
1,85 73,2
percent
5,36
percent
8. Pro-active adaptation
(probability and risk
calculation)
(N = 106 for both)
1,90 85,0
percent
5,35
percent
1,87 72,3
percent
5,36
percent
9. General success rate (=
image, reputation, market
ranking versus competitors)
(N = 107 for both)
1,95 72,2
percent
1,78
percent
1,95 68,2
percent
3,57
percent
10. Customer relation and
market share
(N = 98 and 105)
2,15 88,9
percent
3,57
percent
2,08 80,0
percent
3,57
percent
*General planning/planning outcome = mean value on a tree-point scale (1 = performance was worse than planned, 2 = firm
results were as planned, and 3 = results were better than planned); **well planning percentages (hence categories 2 and 3); °T-test: p = .000; °T-test: .05 < p < .1.
Comparing both test and control group, we see that the correctness score of four
strategic planning items is higher for ADEPT than for NOVICE: ROS, ROI, customer
relation and market share, and proactive adaptation. The strategic planning
correctness score for general success rate is the same for both groups. NOVICE plan
more correct on the following strategic items: ROE, ROA, HRD, product innovation, and
sales turnover. Nevertheless these average scores for all ten strategic planning items,
we see that except for the strategic planning of ROE/personal wealth and growth and
development of personnel (HRD), ADEPT plan on all other strategic planning items

35
'more frequent' than NOVICE. Moreover, compared to NOVICE, the partition of well
planning (score 2 and 3) ADEPT is higher for all ten strategic items.
In the case of ADEPT the most correctly planned strategic items also are the
most frequently planned items. As said, ADEPT plan most correct on general success rate (= image, reputation, market ranking versus competitors), ROI, ROS, proactive
adaptation, and customer relation/market share. Less frequently planned by ADEPT
are the growth and development of personnel (HRD), return on equity (ROE)/personal
wealth and product innovation. These strategic items are also far less correct planned
compared to the other items. The tendency not to (over-)focus or even partially avoid
planning „ROE/personal wealth‟ can be understood from specific Belgian fiscal
regulations and the business motivations, the top-seven of which does not include „to gain lots of money‟ or „to become rich‟. (see above)
The least planned as well as least correctly planned by NOVICE are
ROE/personal wealth, ROA, product innovation, HRD, and sales turnover. The fact
that NOVICE plan most of these items as well as the customer relation/market share
more correctly than ADEPT can be explained by the relative higher partition of
overestimators within the group of NOVICE. Also in the case of NOVICE the most
frequently planned strategic items are eventually the most correctly planned: general
success rate, the customer relation/market share, ROI, and proactive adaptation. As
with ADEPT, the least planned strategic items are the worse planned: ROE/personal
wealth, ROA, and ROS.
TABEL 2D
Planning, well planning and strategic planning correctness
ADEPT NOVICE Strategic
planning°
Well
planning
Planning
correctness
Strategic
planning°
Well
planning
Planning
correctness
Strategic
planning
Pearson
Correlation
Sig. (2-
tailed)
N
1.000
.
10
1.000
.
10
Well
planning
Pearson
Correlation
Sig. (2-
tailed)
N
.316
.374
10
1.000
.
10
.815**
.004
10
1.000
.
10
Planning
correctness
Pearson
Correlation
Sig. (2-
tailed)
N
.585
.024
10
.756*
.011
10
1.000
.
10
.165
.972
10
.77
.832
10
1.000
.
10 *Correlation significant at the .05 level (2-tailed); ** correlation significant at the .01 level (2-tailed).
°Non-parametric scaling (0 = not planned; 1 = planned)
Also on a group level, it seems that higher strategic planning frequency leads to
more correct strategic planning. The only exceptions here are ROA (for ADEPT) and
HRD (in the case of NOVICE). Though there are important inter-group differences as
to the strengths of the relations between the level of planning and well planning,
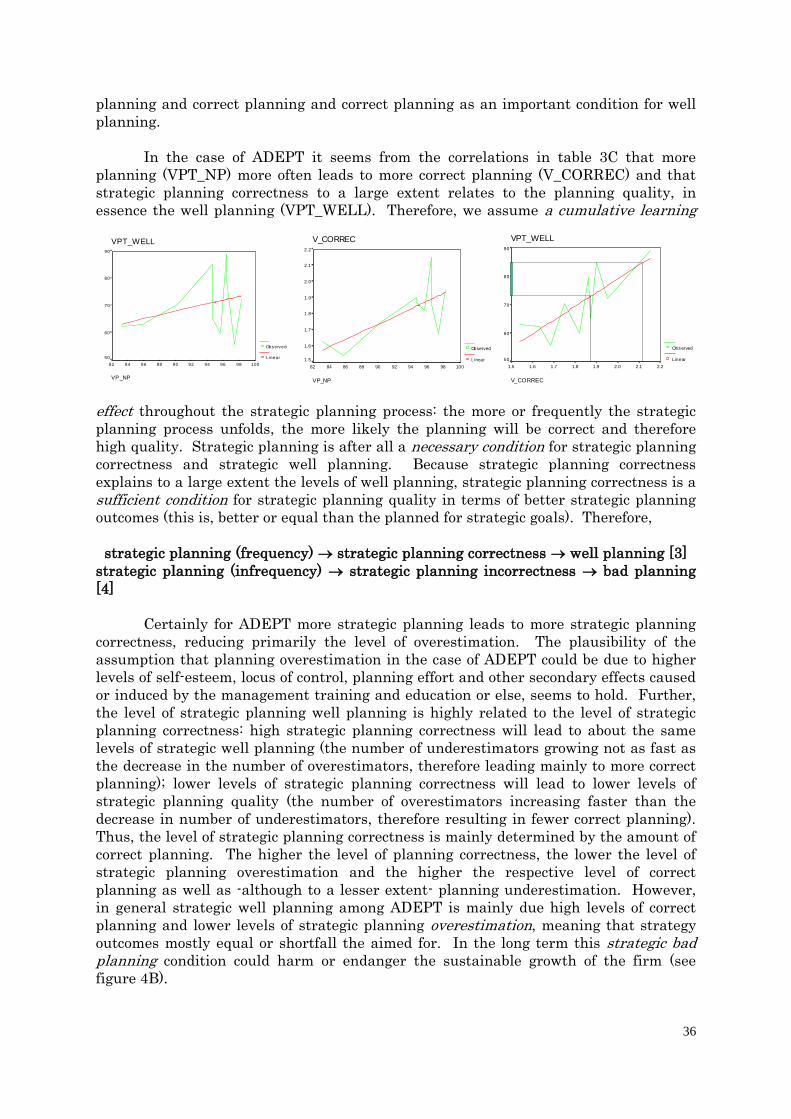
36
planning and correct planning and correct planning as an important condition for well
planning.
In the case of ADEPT it seems from the correlations in table 3C that more
planning (VPT_NP) more often leads to more correct planning (V_CORREC) and that
strategic planning correctness to a large extent relates to the planning quality, in
essence the well planning (VPT_WELL). Therefore, we assume a cumulative learning
effect throughout the strategic planning process: the more or frequently the strategic
planning process unfolds, the more likely the planning will be correct and therefore
high quality. Strategic planning is after all a necessary condition for strategic planning
correctness and strategic well planning. Because strategic planning correctness
explains to a large extent the levels of well planning, strategic planning correctness is a
sufficient condition for strategic planning quality in terms of better strategic planning
outcomes (this is, better or equal than the planned for strategic goals). Therefore,
strategic planning (frequency) strategic planning correctness well planning [3]
strategic planning (infrequency) strategic planning incorrectness bad planning
[4]
Certainly for ADEPT more strategic planning leads to more strategic planning
correctness, reducing primarily the level of overestimation. The plausibility of the
assumption that planning overestimation in the case of ADEPT could be due to higher
levels of self-esteem, locus of control, planning effort and other secondary effects caused
or induced by the management training and education or else, seems to hold. Further,
the level of strategic planning well planning is highly related to the level of strategic
planning correctness: high strategic planning correctness will lead to about the same
levels of strategic well planning (the number of underestimators growing not as fast as
the decrease in the number of overestimators, therefore leading mainly to more correct
planning); lower levels of strategic planning correctness will lead to lower levels of
strategic planning quality (the number of overestimators increasing faster than the
decrease in number of underestimators, therefore resulting in fewer correct planning).
Thus, the level of strategic planning correctness is mainly determined by the amount of
correct planning. The higher the level of planning correctness, the lower the level of
strategic planning overestimation and the higher the respective level of correct
planning as well as -although to a lesser extent- planning underestimation. However,
in general strategic well planning among ADEPT is mainly due high levels of correct
planning and lower levels of strategic planning overestimation, meaning that strategy
outcomes mostly equal or shortfall the aimed for. In the long term this strategic bad planning condition could harm or endanger the sustainable growth of the firm (see
figure 4B).
VPT_WELL
VP_NP
100989694929088868482
90
80
70
60
50
Obs erv ed
Linear
V_CORREC
VP_NP
100989694929088868482
2.2
2.1
2.0
1.9
1.8
1.7
1.6
1.5
Observed
Li near
VPT_WELL
V_CORREC
2.22.12.01.91.81.71.61.5
90
80
70
60
50
Observed
Linear
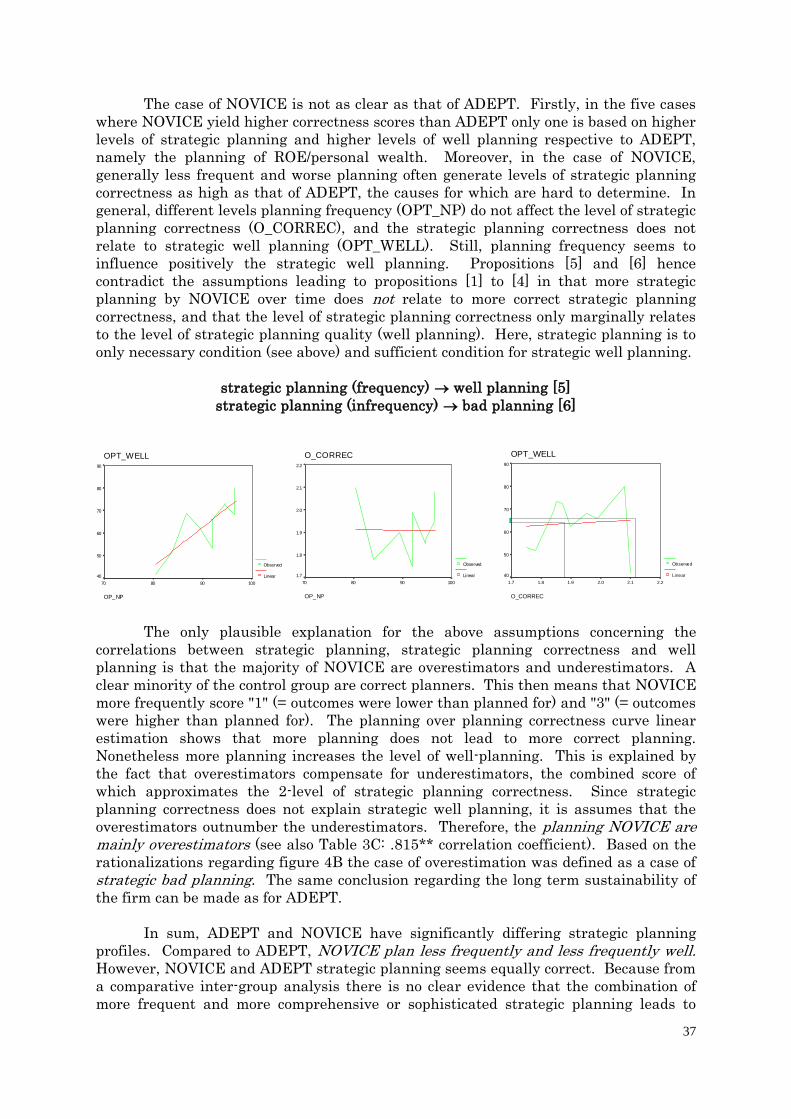
37
The case of NOVICE is not as clear as that of ADEPT. Firstly, in the five cases
where NOVICE yield higher correctness scores than ADEPT only one is based on higher
levels of strategic planning and higher levels of well planning respective to ADEPT,
namely the planning of ROE/personal wealth. Moreover, in the case of NOVICE,
generally less frequent and worse planning often generate levels of strategic planning
correctness as high as that of ADEPT, the causes for which are hard to determine. In
general, different levels planning frequency (OPT_NP) do not affect the level of strategic
planning correctness (O_CORREC), and the strategic planning correctness does not
relate to strategic well planning (OPT_WELL). Still, planning frequency seems to
influence positively the strategic well planning. Propositions [5] and [6] hence
contradict the assumptions leading to propositions [1] to [4] in that more strategic
planning by NOVICE over time does not relate to more correct strategic planning
correctness, and that the level of strategic planning correctness only marginally relates
to the level of strategic planning quality (well planning). Here, strategic planning is to
only necessary condition (see above) and sufficient condition for strategic well planning.
strategic planning (frequency) well planning [5]
strategic planning (infrequency) bad planning [6]
The only plausible explanation for the above assumptions concerning the
correlations between strategic planning, strategic planning correctness and well
planning is that the majority of NOVICE are overestimators and underestimators. A
clear minority of the control group are correct planners. This then means that NOVICE
more frequently score "1" (= outcomes were lower than planned for) and "3" (= outcomes
were higher than planned for). The planning over planning correctness curve linear
estimation shows that more planning does not lead to more correct planning.
Nonetheless more planning increases the level of well-planning. This is explained by
the fact that overestimators compensate for underestimators, the combined score of
which approximates the 2-level of strategic planning correctness. Since strategic
planning correctness does not explain strategic well planning, it is assumes that the
overestimators outnumber the underestimators. Therefore, the planning NOVICE are mainly overestimators (see also Table 3C: .815** correlation coefficient). Based on the
rationalizations regarding figure 4B the case of overestimation was defined as a case of
strategic bad planning. The same conclusion regarding the long term sustainability of
the firm can be made as for ADEPT.
In sum, ADEPT and NOVICE have significantly differing strategic planning
profiles. Compared to ADEPT, NOVICE plan less frequently and less frequently well. However, NOVICE and ADEPT strategic planning seems equally correct. Because from
a comparative inter-group analysis there is no clear evidence that the combination of
more frequent and more comprehensive or sophisticated strategic planning leads to
OPT_WELL
OP_NP
100908070
90
80
70
60
50
40
Observed
Linear
O_CORREC
OP_NP
100908070
2.2
2.1
2.0
1.9
1.8
1.7
Observed
Linear
OPT_WELL
O_CORREC
2.22.12.01.91.81.7
90
80
70
60
50
40
Observed
Linear

38
more correct strategic planning, hypothesis 1a is only partially sustained by the above
observations: in most cases more strategic planning and well planning of the strategic
items leads to better strategic correctness scores.
Nevertheless, on a non-comparative group level as well as on the aggregate level,
the relation between either the (frequency of) planning or the amount of well planning is evident. Proposition 1b is therefore sustained: strategic planning correctness is a
function of planning frequency (formalization).
Strategic planning accuracy
Strategic planning accuracy refers to the degree in which correct strategic planning (see
above) explains for firm performance. In other words, strategic planning accuracy
answers the question whether the business-owner or manager planned those strategic
parameters that ultimately determined firm performance. The level of strategic
planning accuracy is considered high when firm performance, in essence growth in sales
turnover and/or total number of employees- is explained mainly by those strategic
parameters that were highly correct planned. Conversely, inadequate strategic
planning include all the planning that does not explained firm performance, whether or
not the planning was done in a more or less correct way. The assumption therefore is
that accurate strategic planning excludes all forms of incorrect strategic planning.
Table 5 summarizes all strategic planning profiles that significantly correlate
with the business growth in sales turnover as well as in total number of personnel
(formulated as optimized regression sets according to relative significance). Some
general observations include, first of all, that all ten strategic planning items have
depending on the level of analysis a more or less significant positive or negative
influence on the (probability of) firm growth, both in terms of sales turnover as well as
in personnel, could be determined. This is mainly explained by the fact that there are
many differences between ADEPT and NOVICE regarding the strategic parameters
involved in accurate strategic planning.
Secondly, the focus on the strategic planning of 'return on sales turnover (ROS) (profitability)' and 'product innovation' (whether or not simultaneously) increases the
likeability for business growth [note: as it has become clear that on average the growth
speed of ADEPT is higher than that of NOVICE (see Table 2.A), and that, more
important, there is positive correlation between the growth pattern for the sales turnover and staffing is significantly for ADEPT (.84*), while this correlation is
negative for NOVICE (see table 2.B) the relevance of the strategic planning by ADEPT
of 'return on sales turnover (ROS)' and 'product innovation' for the growth in turnover
and personnel seems to be pretty high]
Third, the planning of 'growth and development of personnel' and/or 'customer relation and market share' generally lowers the likeability for the general growth in
sales turnover, and in the case of well planning ADEPT for the growth in annual
personnel too. Fourth, pro-active adaptation seems to be a most promising business
growth related value for well planning ADEPT. Fifth, the effects on firm growth of the
strategic planning of ROI and ROE are ambiguous.
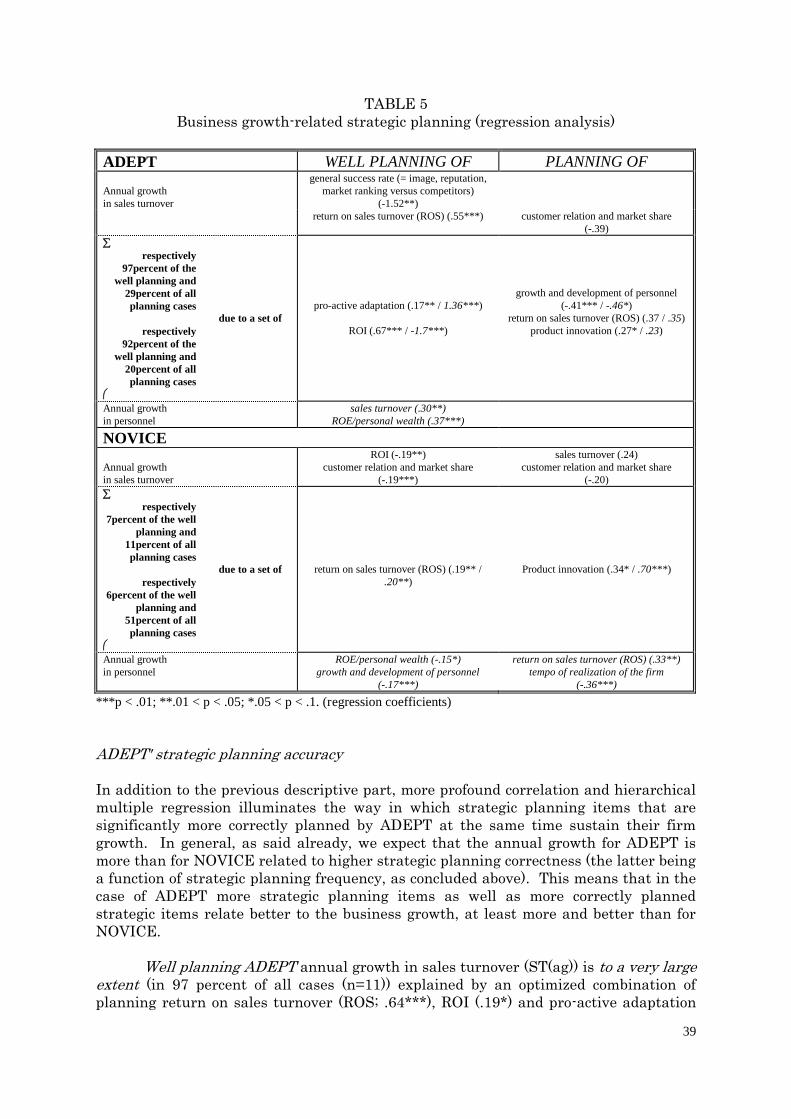
39
TABLE 5
Business growth-related strategic planning (regression analysis)
ADEPT WELL PLANNING OF PLANNING OF
Annual growth
in sales turnover
general success rate (= image, reputation,
market ranking versus competitors)
(-1.52**)
return on sales turnover (ROS) (.55***) customer relation and market share
(-.39)
respectively
97percent of the
well planning and
29percent of all
planning cases
respectively
92percent of the
well planning and
20percent of all
planning cases
due to a set of
pro-active adaptation (.17** / 1.36***)
ROI (.67*** / -1.7***)
growth and development of personnel
(-.41*** / -.46*)
return on sales turnover (ROS) (.37 / .35)
product innovation (.27* / .23)
Annual growth
in personnel
sales turnover (.30**)
ROE/personal wealth (.37***)
NOVICE
Annual growth
in sales turnover
ROI (-.19**)
customer relation and market share
(-.19***)
sales turnover (.24)
customer relation and market share
(-.20)
respectively
7percent of the well
planning and
11percent of all
planning cases
respectively
6percent of the well
planning and
51percent of all
planning cases
due to a set of
return on sales turnover (ROS) (.19** /
.20**)
Product innovation (.34* / .70***)
Annual growth
in personnel
ROE/personal wealth (-.15*)
growth and development of personnel
(-.17***)
return on sales turnover (ROS) (.33**)
tempo of realization of the firm
(-.36***)
***p < .01; **.01 < p < .05; *.05 < p < .1. (regression coefficients)
ADEPT' strategic planning accuracy
In addition to the previous descriptive part, more profound correlation and hierarchical
multiple regression illuminates the way in which strategic planning items that are
significantly more correctly planned by ADEPT at the same time sustain their firm
growth. In general, as said already, we expect that the annual growth for ADEPT is
more than for NOVICE related to higher strategic planning correctness (the latter being
a function of strategic planning frequency, as concluded above). This means that in the
case of ADEPT more strategic planning items as well as more correctly planned
strategic items relate better to the business growth, at least more and better than for
NOVICE.
Well planning ADEPT annual growth in sales turnover (ST(ag)) is to a very large
extent (in 97 percent of all cases (n=11)) explained by an optimized combination of
planning return on sales turnover (ROS; .64***), ROI (.19*) and pro-active adaptation
40
(ProAct; .17**), and non-planning of general success rate (= image, reputation, market
ranking versus competitors) (GSR; 1.09*)18 -see also table 5 for the combined influence
of these elements on growth of sales turnover-:
[1] ST(ag)WP-Vlerick (n=11) = .97 ƒ (ROS + ROI + ProAct - GSR)19
Annual growth in personnel (P(ag)) in the case of well planning ADEPT is for
92percent of all cases (n=11) determined by the combination of planning pro-active
adaptation (ProAct; 1.43***) and sales turnover (ST; .30**) and the non-planning of
ROE/personal wealth (.18) and ROI (-.42):
[2] P(ag)WP-Vlerick (n=11) = .92 ƒ (ST + ProAct - ROE - ROI)
In the case of all (not necessarily well planning) planning ADEPT, annual
growth in sales turnover is to a significantly large extent (in 29percent of all cases
(n=38)) determined by the planning of 'return on sales turnover' (ROS; .34**) and
'product innovation' (Inno; .27*) and the non-planning of 'growth and development of
the personnel' (HRD; -.35**) and 'customer relation and market share' (CM; -.31*):
[3] ST(ag)P-Vlerick (n=38) = .29 ƒ (ROS + Inno - HRD - CM)
In the same case, annual growth in number of staffing is to a smaller extent (in
20percent of all 38 cases) determined by planning of 'return on sales turnover' (ROS;
.39) and 'product innovation' (Inno; .23) and the non-planning of 'growth and
development of the personnel' (HRD; -.28*):
[4] P(ag)P-Vlerick (n=38) = .20 ƒ (ROS + Inno - HRD)
Although, in the case of ADEPT, most correctly planned strategic planning items
(see Table 3) were customer relation/market share and general success rate (= image,
reputation, competitive position), the (well-)planning of these strategic items seem to be
disadvantageous for the growth of sales turnover or number of personnel. Strategic
planning proficiency is rooted in the strategic planning of ROS, innovation, sales
turnover, and proactive adaptation. Except for innovation, these strategic planning
items are highly frequently planned as well as mostly well-planned. Moreover, the non-
planning of already least and worse planned strategic items such as HRD and
ROE/personal wealth seem to be beneficial for the growth in sales turnover and the
number of personnel. Despite inconsistencies concerning the strategic planning of
general success rate, customer relation/market share, and product innovation, the
combination of most frequently planned and most correctly planned strategic items
seem to explain rather vastly the yearly growth of ADEPT. Hence, the strategic
planning by ADEPT can be considered to be "proficient" in nature.
NOVICE strategic planning accuracy
There are not enough well planning cases for NOVICE to get sufficient variance on the
ten strategic planning items and to produce any meaningful statistical regression. Due
to this shortcoming, looking at table 5, annual growth in turnover (ST(ag)) is only to a
18
(GSR; 1.09*) e.a. refers to the individual Beta and hence relevance of the particular strategic planning profile
elements for the growth of annual turnover and/or personnel. ***p < .01; **.01 < p < .05; *.05 < p < .1. 19
.97, .92, .29 and so on refer to changes in the R² and the combined regression coefficients.

41
very small extent some extent (7percent of all cases (n=13 to 17)) due to the planning of
'return on sales turnover' (ROS; .12*) and non-planning of 'customer relation and
market share' (CM; -.20**) and 'ROI' (-.19*):
[5] ST(ag)WP-NOVICE (n=13-17°) = .07 ƒ (ROS - CM - ROI)20
Annual growth in personnel (P(ag)) in the case of well planning NOVICE is to a
similar extent (6percent of all cases (n=13 to 17)) determined by the planning of 'return
on sales turnover' (ROS; .16*) and non-planning of 'ROE'/personal wealth (-.15*) and
'growth and development of personnel' (HRD; -.19**):
[6] P(ag)WP-NOVICE (n=13-17°) = .06 ƒ (ROS -ROE - HRD)21
Conclusive enough, annual growth in turnover (ST(ag)) in the case of all
"planning" NOVICE (n=33) is partly related to planning 'sales turnover' (ST; .24) and
'product innovation' (Inno; .30*) and non-planning of 'customer relation and market
share' (CM; -.21):
[7] ST(ag)P-NOVICE (n=33) = .11 ƒ (ST + Inno - CM)
If the focus of strategic planning is on the combination of 'product innovation'
(Inno; .60***) and 'return on sales turnover' (ROS; .33**) and the non-planning of
'return on assets' (ROA; -.30**) NOVICE are in 51percent of all cases (n=33) likely to
grow both in terms of personnel:
[8] P(ag)P-NOVICE (n=33) = .51 ƒ (ROS + Inno - ROA)
For the most explanatory strategic planning factors, namely the strategic
planning of return on sales turnover (ROS) and product innovation and the non-
planning of HRD (and to a lesser extent to the customer relation/market share) the
conclusion differs in many respects from that drawn as for ADEPT. There seems to be
no relation between the frequency of the planning or the beneficial character of the well
planning for any of these strategic planning factors. Mostly planned and correctly
planned strategic items by NOVICE are customer relation/market share, general
success rate, proactive adaptation, and ROI. However, the planning of none of these
strategic items seems to be explanatory or significantly beneficiary to the firm growth
in annual sales turnover or number of personnel. On the contrary a strategic focus on
customer relation/market share and ROI seems to be disadvantageous. Moreover,
return on sales and sales turnover which explain to a rather large extent the annual
firm growth seems to be of the east planned and rather poorly planned strategic items
by NOVICE, apart from ROA and ROE. So there seems to be no evidence at all for a
plausible relation between the way that NOVICE strategically plan, correctly plan, and
the beneficial influence from that planning behavior on firm performance. Hence, the
strategic planning by NOVICE is typically "not-proficient" or "inadequate" in nature.
t last, annual growth in sales turnover and number of personnel for ADEPT and
NOVICE depends to a large extent on the well planning of two financial and two non-
financial strategy items, respectively of three financial and one non-financial strategy
20
Note: (°) too less valid cases and not enough variance were found for the well planning sets on all ten items;
hence this grouping variable was fragmented. 21
Note: (°) too less valid cases and not enough variance were found for the well planning sets on all ten items;
hence this grouping variable was fragmented.
42
item(s). Nonetheless the fact that the general strategic planning of firm growth is of a
rather non-financial nature for ADEPT and equally for NOVICE (see above Table 5),
"proficient" -thus, correct and accurate- strategic planning seems to be financial of
nature. Moreover, over-focusing on the (well-)planning of non-financial strategy items
seems to generate a rather negative effect on the sustainability of the business growth
(in 78percent of the cases), whereas only in 27percent of the (well-)planning of financial
strategy items this is the case.
Altogether, there are significant inter-group differences in the optimized sets
strategic planning accuracy (summarized in Table 5: most explanatory combinatory sets
of significant cumulative R²). Contrary to the findings for NOVICE, in the case of
ADEPT there are unmistakable indications of highly significant relations between
perfectly identifiable sets of correct strategic planning and business growth (explaining
business growth for at least 20 to 29 percent in the case of all planners and up to 95 to
97percent in the case of all well-planners), and therefore of a level of strategic planning proficiency. Hence, proposition 2a is sustained in general and proposition 2b is only
sustained in the case of ADEPT: strategic planning correctness leads to higher firm
performance and in the case of ADEPT increased firm performance is largely due to
unambiguous strategic planning proficiency.
Following this, the fact that in general more proficient strategic planning is
likely to sustain firm growth and that, more specifically, ADEPT plan more often, more
comprehensive and more proficient than NOVICE (see above), proposition 3b is
sustained: ADEPT in general produce higher growth in turnover and employment
than NOVICE.
The assumption that annual growth in sales turnover is mainly due to planning
financial strategy items and that annual growth in staffing (employability) is mainly
due to the strategic planning of non-financial items has been largely contradicted.
Hence, proposition 3a is not sustained: small firm financial and non-financial growth
measures, respectively growth in annual sales turnover and number of personnel, are
not significantly correlated to financial versus non-financial strategic planning
(proficiency).
GENERAL CONCLUSION
Nonetheless the fact that in general ADEPT are younger of age and running smaller
companies (during the first five start-up years), the fact that ADEPT plan more (frequent), more broadly, and more correctly enables them to generate a higher average
business growth rate over the following years. Not surprisingly, the growth rate of both
tested parameters (sales turnover size and number of personnel) is significantly higher
for the ADEPT than for NOVICE.
In the second part of the paper, the reader got an idea of what kind of strategic
planning is argued to effectively induce what levels of correct and/or well-planning, and
to what extent accurate planning can explain the business growth either in sales
turnover or in the number of personnel (as a measure of employability). Based on the
above, an extension to already existing studies, the authors proposed a new method in
which the degree of strategic planning formalization (= frequency, scope and
sophistication or structuredness) can be both quantitatively and qualitatively tested.
Also strategic planning correctness and strategic planning accuracy, referring to the

43
extent to which strategic goals is attained and strategic planning explains firm
performance and growth, were found to be meaningful and workable construct for the
study of the degree to which starters seem to be able to plan for company survival and
growth, or the "strategic planning proficiency". In essence, the link between formalized
strategic planning and firm performance (annual growth rate of in the number
personnel and sales turnover) could be explained by (1) the level of strategic planning
correctness, (2) the amount of strategic well planning, and (3) by the interrelations
between strategic planning correctness and accuracy. Although both the test and
control group hold large numbers of bad planners -in particular overestimators-, levels
of strategic planning accuracy in the case of (well) planning ADEPT topped those of
NOVICE considerably, the latter confirming that strategic planning by ADEPT is more
proficient.
The research findings even so clarify some plausible catalyst effect of
management education and training on the strategic planning proficiency of the starter
and early grower and evidence was found to conclude that management training
increases the probability of more proficient strategic planning and therefore for higher
small firm or start-up performance, survival as well as growth. As noted from the last
part of the paper, even though 'the strategic importance attached to management education and training' does not significantly explains the relationship between the
strategic planning mode and firm performance, pretty conclusive results were found on (broader) sets of entrepreneurial characteristics and management behavior [EC+MT]
that to a certain degree (ranging from 6percent to 97percent of all cases) determine the
business growth-related strategic planning proficiency modes. Moreover, the
convergence effect of most of the strategic planning proficiency-related EC+MT around
the variable „strategic importance attached to management education and training‟ for
ADEPT extents possibilities for interpretation for its relative impact on successful strategic management and managerial behavior in general. Moreover, ADEPT' average
strategic planning mode was identified as proficient as the growth pattern, pre-start-up
and post-start-up EC+MT, and strategic planning correctness were all linked by a
single control variable „strategic importance attached to management education and training‟. This therefore suggests also an interaction or catalyst effect of the latter on
the whole process. This observation does not stand for the control group of NOVICE.
Moreover, as we saw many of these strategic planning proficiency-related EC+MT were
supported by the pre- or post-start-up profiles. For instance, the assumption that
ADEPT typically start from an own business concept or an innovative business idea has
been sustained both in terms of their pre-start-up profile and their post-start-up
average strategic planning mode which is focused primarily on sustaining their
business and their personal lifestyles (cfr. life-style firms).
In conclusion, we offer some suggestions for further research. Despite the
support that we found in the literature, the multi-dimensional strategic planning
measure is easily subject to criticism, shortcomings and ambiguities. Moreover, the fact
that business growth has only been tested through the size of sales turnover and the
number of personnel and respective growth rates is open for discussion. These are of
course the most frequently quoted business growth parameters in most of the academic
management journals and other readings, but nevertheless the measurement of
“business success” can be made more comprehensive (for example by incorporating
ROA, ROI, and other pure financial measures of performance or by the incorporation of
more subjective measures such as market share, customer satisfaction, etc.) depending
on the strategy focus of the firm. Business success measurement has to be developed
based on the testing of the strategic planning parameters. Therefore we suggested

44
taking the broader dimensions such as profitability, market share, customer
satisfaction, growth in sales turnover etc… rather than more precise ones.
Other elements for discussion may concern the differences in the entrepreneurial
and managerial profiles, including the bias of being management trained or not, non-
planning, and the outfall (non-response). Management training and education may be
assumed to cause instantly different management styles and behavior in general and to
differentiate between strategic planning practices more specifically. The mission of the
referred to management training programs is to illuminate the advantages stemming
from more fundamental, profound and conceptual thinking, realistic, pragmatic and
rational business planning and decision-making, networking (mainly locally), etc.
Hence, the relationship between management training and education and business
planning proficiency (in terms of effectiveness in sustaining the firm growth) may be
self-feeding. And, it hopefully is! A potential bias however is in the management
training enrollment practice: only starters that clearly signal the need for refining their
conception of the firm and business planning abilities as well as a hunger for
networking will get accepted to the management training. The search for outside help
regarding these matters is considered to be just another indication of this distinct need.
But, also “other elements” (see figure 1.a) could have affected the relationship between
strategic planning and firm performance or growth, for example changes in the
environmental, economical and personal context. Therefore, notwithstanding the
validity of the here presented findings, further investigation on the linkage between the
pre-start-up motivation, age distribution, level of education, etc. on the personal and
other levels and the strategic planning modes and the growth pattern of the enterprise
is needed. Moreover, a very rigid selection was done by only checking on the EC+MT
and strategic planning proficiencies of (well-)planning starters and their relation to the
business growth rate. In addition, research also ought to be done on how this
relationship specifically looks like in the case of for not-planners.22
In sum, evidence has yet been found for the fact that typical sets of
entrepreneurial characteristics and management techniques [EC+MT] can with a
significant level of probability contribute to the business growth both in terms of sales
turnover as employment, although only through their energizing or multiplication effect
on the respective strategic planning proficiency. In the case of ADEPT the EC+MT
determinants that cluster around the catalyst „management education and training‟ are
of utmost importance and strategic value to future business growth. Knowing this, this
research will hopefully lead to further elaboration of management education and all
forms of management training, counseling etc. for start-ups and early stage growth
firms. Important for Europe's future is the awareness that such unique educational
and even vocational management training programs are "indeed" leading to better
performing and more sustainable businesses.
22
Because all firms of the control group were selected out of a last years‟ start-up database for
Flanders, all business-owners in the 1996 population were de facto still in business. Hence, to
this point no comparative survival analysis could be done. The current research will therefore
focus on the growth rate of all these firms and leave the mortality (for instance by bankruptcy),
stoppage (for instance because the firm was sold) or fall-out analysis of this first cohort for a
longitudinal revision of this study which is foreseen for 2001-2002, and currently ongoing.
45
REFERENCES
Ackelsberg, R., & Arlow, P. (1985). Small Business do Plan and it Pays off. Long Range Planning, 18(5 [October]), 61-67.
Anderson, R., & Dunkelberg, J. (1993). Managing Small Businesses. Minneapolis/St.
Paul: West Publishing Company.
Ansoff, I. (1988(1965)). Corporate Strategy ( Revised edition ed.). London: Penguin
Books.
Aram, J., & Cowen, S. (1990). Strategic Planning for Increased Profit in Family Owned
Business. Long Range Planning, 23(6 [December]), 63-70.
Armstrong, J. (1982). The Value of Formaln Planning for Strategic Decisions. Strategic Management Journal, 3(3), 197-211.
Atherton, A., & Hannon, P. (1995). The Business Plan - A 21st Century dinosaur? In H.
Klandt & Muller-Boling (Eds.), IntEnt '95 Proceedings (pp. 22).
Attahir, Y. (1995). Critical Success Factors for Small Business: perceptions of South
Pacific entrepreneurs. Journal of Small Business Management, 33(2 [April]), 68-
73.
Bracker, J. (1986). Planning and Financial Performance of Small, Mature Firms.
Strategic Management Journal, 7(6), 503-522.
Bracker, J., Keats, B., & Pearson, J. (1988). Planning and Financial Performance
among Small Firms in a Growth Industry. Strategic Management Journal, 9(6),
591-603.
Bygrave, W. (1990). The Portable MBA in Entrepreneurship [2e set]. NY: Wiley and
Sons Inc.
Cooper, A., & Gascon, F. (1992). Entrepreneurs, Processes of Founding and New-Firm
Performance. In D. Sexton & J. Kasarda (Eds.), The State of the Art of Entrepreneurship. Boston: PWS-Kent Publ. Company.
Crant, J. (1996). The Pro-active Personality Scale as a Predictor of Entrepreneurial
Intentions. Journal of Small Business Management, 34(3 [June]), 42-49.
Deschoolmeester, D., Braet, O., & Schamp, T. (2002). The Antecedents of Entrepreneurial Awareness among Belgian University Students. Gent: Ghent
University.
Dillman, D. (1978). Mail and Telephone Surveys. The total design method. NY: Wiley
Interscience.
Douglas, E. (1997). New Venture Survival: ignorance, external shocks and risk
reduction strategies. In S. Kunkel (Ed.), Journal of Best Papers 42nd World Conference of the International Council for Small Businesses. San Francisco:
University of Chicago.
Drucker, P. (1999(1973)). Management. Tasks, responsibilities, practices. Woburn/MA:
Butterworth-Heinemann.
Fredrickson, J. (1984). The Comprehensiveness of Strategic Decision Processes:
extension, observations, future directions. Academy of Management Journal, 27(3), 445-466.
Fredrickson, J., & Mitchell, T. (1984). Strategic Decision Process: comprehensiveness
and performance in an industry with an unstable environment. Academy of Management Journal, 27(2), 399-423.
Gibb, A. (1995). The Role of Education and Training in Small and Medium Enterprise in Europe: creating an agenda for action. Paper presented at the Inter-Ministerial
Conference of Education and Employment Ministries of the European Union and
Partner States, Italy.
46
Gibb, A., & Nelson, E. (1996). Personal Competencies, Training and Assessment: a challenge for small business trainers. Paper presented at the 26th EFMD
European Small Business Seminar, Vääsa/Finland.
Gibb, A., & Scott, M. (1985). Strategic Awareness, Personal Commitment and the
Process of Planning in the Small Business. Journal of Management Studies, 22(6
[November]), 597-631.
Hillidge, J. (1990). Planning for Growth in a Small Company. Long Range Planning, 23(3 [June]), 76-81.
Hisrich, R., & Peters, M. (1998(1989)). Entrepreneurship ( Fourth edition ed.). Boston:
Irwin/McGraw-Hill.
Hofer, C., & Schendel, D. (1978). Strategy Formulation: analytic concepts. NY:
West/Prentice Hell.
Jones, W. (1982). The Characteristics of Planning in Small Firms. Journal of Small Business Management, 20(3), 15-19.
Kuratko, D. (1995). The Real Challenges are Risk, Stress, Ego, and Motivation.
Entrepreneurship, Innovation, and Change, 4(1 [March]), 3-10.
Lyles, M., Baird, I., Orris, B., & Kuratko, D. (1993). Formalized Planning in Small
Business: increasing strategic choices. Journal of Small Business Management, 31(2 [April]), 38-50.
Madu, C., & Kuei, C.-H. (1993). Introducing Strategic Quality Management. Long Range Planning, 26(6), 121-131.
Manigart, S., Clarysse, B., Crijns, H., & Goossens, H. (2000). The General Entrepreneurship Monitor - Executive report Belgium and Flanders. Gent:
Vlerick Leuven Gent Management School.
Matthews, C., & Scott, S. (1995). Uncertainty and Planning in Small and
Entrepreneurial Firms: an empirical assessment. Journal of Small Business Management, 33(4 [October]), 34-52.
Miles, R., & Snow, C. (1978). Organizational Strategy - Structure and process. NY:
McGraw-Hill.
Mintzberg, H. (1991). The Entrepreneurial Organization. In H. Mintzberg & J. Quinn
(Eds.), The Strategy Process: concepts, contexts, cases (pp. 604-613). Englewood
Cliffs: Prentice-Hall.
Mintzberg, H. (1994a). The Rise and Fall of Strategic Planning. NY: The Free Press -
Pearson Professional Education.
Naffzinger, D., & Kuratko, D. (1991). An Investigation into the Prevalence of Planning
in Small Business. Journal of Small Business and Entrepreneurship, 3(2), 99-
109.
Olson, P. D., & Bokor, D. (1995). Strategy Process - Content Interaction: effects on
growth performance in small, start-up firms. Journal of Small Business Management, 33(1 [January]), 34-44.
Pearce, J., Freeman, E., & Robinson, R. (1987). The Tenuous Link between Formal
Strategic Planning and Financial Performance. Academy of Management Review, 12(4), 658-675.
Perry, S. (2001). The Relationship between Written Business Plans and the Failure of
Small Business in the U.S. Journal of Small Business Management, 39(3), 201-
208.
Phillips, P., & Moutinho, L. (2000). The Strategic Planning Index: a tool for measuring
strategic planning effectiveness. Journal of Travel Research, 38(4 [May]), 369-
379.
Porter, M. (1980). Competitive Strategy. Techniques for analyzing industries and competitors. NY: The Free Press.
Quinn, J. (1980). Strategies for Change. Homewood, IL: Irwin/McGraw-Hill Inc.
47
Ramanujam, V., & Venkatraman, N. (1987). Planning System Characteristics and
Planning Effectiveness. Strategic Management Journal, 8(5), 453-468.
Reid, G., Jacobson, L., & Anderson, M. (1993). Profiles in Small Business: a competitive strategy approach. London: Routledge.
Robinson, R. (1982). The Importance of "Outsiders" in Small Firm Strategic Planning.
Academy of Management Journal, 25(1), 80-93.
Robinson, R., & Pearce, J. (1983). The Impact of Formalized Strategic Planning on
Financial Performance in Small Organizations. Strategic Management Journal, 4(3), 197-207.
Robinson, R., & Pearce, J. (1984). Research Trusts in Small Firm Strategic Planning.
Academy of Management Review, 9(1), 128-137.
Robinson, R., & Pearce, J. (1988). Planned Patterns of Strategic Behavior and Their
Relationship to Business-Unit Performance. Strategic Management Journal, 14(4), 43-60.
Rosa, P., Scott, M., & Klandt, H. (1996). Educating Entrepreneurs in Modernizing Economies. Avebury/UK: Ashgate Publishing Group / Stirling School of
Management.
Rowe, A., Mason, R., Dickel, K., Mann, R., & Mockler, R. (1994). Strategic Management. A methodological approach ( Fourth edition ed.). reading, MA: Addison-Wesley
Publishing Company.
Rue, L., & Ibrahim, N. (1998). The Relationship between Planning Sophistication and
Performance in Small Businesses. Journal of Small Business Management, 36(4
[October]), 24-32.
Schamp, T., & Deschoolmeester, D. (1998a). Strategic and Operational Planning
Behavioural Changes and the Survival and Early Growth of Business Start-ups.
International Journal of Entrepreneurial Behaviour and Research, 4(2 [Special
Issue on Enterprise and Learning]), 141-177.
Schamp, T., & Deschoolmeester, D. (1998b). Survival and Growth Business Start-ups: strategic and operational planning through management training. Paper
presented at the The Babson College-Kauffman Foundation Entrepreneurship
Research Conference, Gent (Belgium).
Schamp, T., & Deschoolmeester, D. (2001). Planning and the Business Growth of Start-
ups: management training matters. In R. Brockhaus & G. Hills & H. Klandt &
H. Welsch (Eds.), Entrepreneurship Education - A global view (pp. 387-416).
Aldershot, UK: Ashgate.
Schrader, C., Mulford, C., & Blackburn, V. (1989). Strategic and Operational Planning,
Uncertainty, and Performance in Small Firms. Journal of Small Business Management, 27(4 [October]), 45-60.
Schrader, C., Taylor, L., & Dalton, D. (1984). Strategic Planning and Organizational
Performance: a critical review. Journal of Management, 10(2), 149-171.
Schwenk, C., & Schrader, C. (1993). Effects of Formal Strategic Planning on Financial
Performance in Small Firms: a meta-analysis. Entrepreneurship: Theory & Practice, 17(3 [Spring]), 53-64.
Sexton, D., & Van Auken, P. (1985). A Longitudinal Study of Small Business Strategic
Planning. Journal of Small Business Management, 23(1), 7-15.
Shuman, J., & Seeger, J. (1986). The Theory and Practice of Strategic Management in
Smaller Growth Firms. American Journal of Small Business, 31(1), 7-18.
Smith, J. (1998). Strategies for Start-Ups. Long Range Planning, 31(6), 857-872.
Steiner, G. (1967). Approaches to Long Range Planning for Smaller Business. California Management Review, 10(1), 3-16.
Timmons, J. (1978). Goal Setting and the Entrepreneur. Journal of Small Business Management, 16(2), 1-9.

48
Timmons, J. (1998(1994)). New Venture Creation: entrepreneurship for the 21st century ( Fifth edition ed.). Boston: McGraw-Hill International Editions [Irwin].
Trailer, J., & Wolford, C. (1997). On the Logic of Composition in Writing Business Plans: teaching argument structure. Paper presented at the 42nd World
Conference of the International Conference for Small Business (ICSB), San
Francisco (USA).
Van Clouse, G. (1990). A Controlled Experiment Relating Entrepreneurial Education to
Students' Start-Up Decisions. Journal of Small Business Management, 28(2
[April]), 45-53.
van Hoorn, T. (1979). Strategic Planning in Small Business and Medium Sized
Companies. Long Range Planning, 8(2), 84-91.