MANAGEMENT S DISCUSSION AND NALYSIS THREE MONTH …
20
MANAGEMENT’S DISCUSSION AND ANALYSIS THREE-MONTH PERIOD ENDED SEPTEMBER 30, 2020 MONARCH GOLD CORPORATION 68 AVENUE DE LA GARE, SUITE 205 SAINT-SAUVEUR (QUÉBEC) J0R 1R0 TEL.: 1-888-994-4465 WWW.MONARQUESGOLD.COM TSX: MQR
Transcript of MANAGEMENT S DISCUSSION AND NALYSIS THREE MONTH …
MANAGEMENT’S DISCUSSION AND ANALYSIS THREE-MONTH PERIOD ENDED
SEPTEMBER 30, 2020 MONARCH GOLD CORPORATION 68 AVENUE DE LA GARE, SUITE 205 SAINT-SAUVEUR (QUÉBEC) J0R 1R0 TEL.: 1-888-994-4465 WWW.MONARQUESGOLD.COM TSX: MQR
Management’s discussion and analysis
Three-month period ended September 30, 2020
TABLE OF CONTENTS
Forward-looking statements.................................................................................................................................................. 2 Description of the Company .................................................................................................................................................. 2 Location of properties ........................................................................................................................................................... 3 Highlights between september 30, 2020 and the date of the report .................................................................................... 4 Highlights as of September 30, 2020 ..................................................................................................................................... 4 Reserves ................................................................................................................................................................................. 5 Resources ............................................................................................................................................................................... 5 Outlook .................................................................................................................................................................................. 6 Key financial data ................................................................................................................................................................... 6 Reconciliation of net earnings (net loss) to EBITDA ............................................................................................................... 7 Key operating statistics .......................................................................................................................................................... 7 Review of financial results ..................................................................................................................................................... 7 Review of production activities ............................................................................................................................................. 8 Review of exploration and evalation activities ...................................................................................................................... 8 Selected quarterly financial information ............................................................................................................................. 13 Financial position ................................................................................................................................................................. 14 Liquidity and sources of financing ....................................................................................................................................... 14 Cash flows ............................................................................................................................................................................ 15 Outstanding share capital .................................................................................................................................................... 16 Related party trasactions ..................................................................................................................................................... 16 Off-balance sheet agreements ............................................................................................................................................ 16 Commitments and contingencies ........................................................................................................................................ 16 Non-IFRS financial measures ............................................................................................................................................... 17 Significant accounting policies ............................................................................................................................................. 17 Significant judgments and estimates ................................................................................................................................... 17 Financial Instruments .......................................................................................................................................................... 17 Risk factors ........................................................................................................................................................................... 18 Disclosure controls and procedures and internal controls over financial reporting ........................................................... 18 Disclosure controls and procedures .................................................................................................................................... 18 Internal controls over financial reporting ............................................................................................................................ 18 Additional information and continuous disclosure ............................................................................................................. 18 General Information ............................................................................................................................................................ 19
MANAGEMENT’S DISCUSSION AND ANALYSIS – SEPTEMBER 30, 2020 PAGE 2
The Management's Discussion and Analysis ("MD&A") of Monarch Gold Corporation (the “Company” or “Monarch”) dated November 10, 2020, is intended to help readers become more familiar with the Company’s business. In particular, it explains the changes in the financial position and results for the three-month period ended September 30, 2020 and compares the statements of financial position as at September 30, 2020 and June 30, 2020. It should be read in conjunction with the Company's consolidated financial statements for the year ended June 30, 2020, and the accompanying notes. The unaudited consolidated condensed interim financial statements have been prepared in accordance with International Financial Reporting Standards ("IFRS"). As a result, all comparative financial information presented in this MD&A reflects the consistent application of IFRS.
The unaudited consolidated condensed interim financial statements and the management report were reviewed by the Audit Committee and approved by the Company's Board of Directors on 10 November 2020. Unless otherwise indicated, all amounts presented in this MD&A are expressed in Canadian dollars. Additional information about Monarch can be found at www.sedar.com.
FORWARD-LOOKING STATEMENTS
Some statements contained in this MD&A, especially the opinions, the projects, the objectives, the strategies, the estimates, the intent and the expectations of the Company that are not historical data, are forward-looking statements. Such statements can be recognized by the terms “forecast”, “anticipate”, “consider”, “foresee” and other similar terms and expressions. These statements are based on information available at the time they are made, on assumptions and expectations by management, acting in good faith, concerning future events and concerning, by their nature, known and unknown risks and uncertainties mentioned herein (see the section entitled Risks and uncertainties). These forward-looking statements include, but are not limited to, the Company’s business objectives and its plans to develop the Wasamac gold deposit. The actual results for the Company could differ materially from those expressed or implied in these forward-looking statements. As such, it is recommended not to place undue reliance on forward-looking statements. These statements do not reflect the potential incidence of special events which could be announced or take place after the date of this MD&A. Except if the applicable legislation requires it, the Company does not intend to update these forward-looking statements to reflect, in particular, new information or future events, and it is by no means committed to doing so.
DESCRIPTION OF THE COMPANY
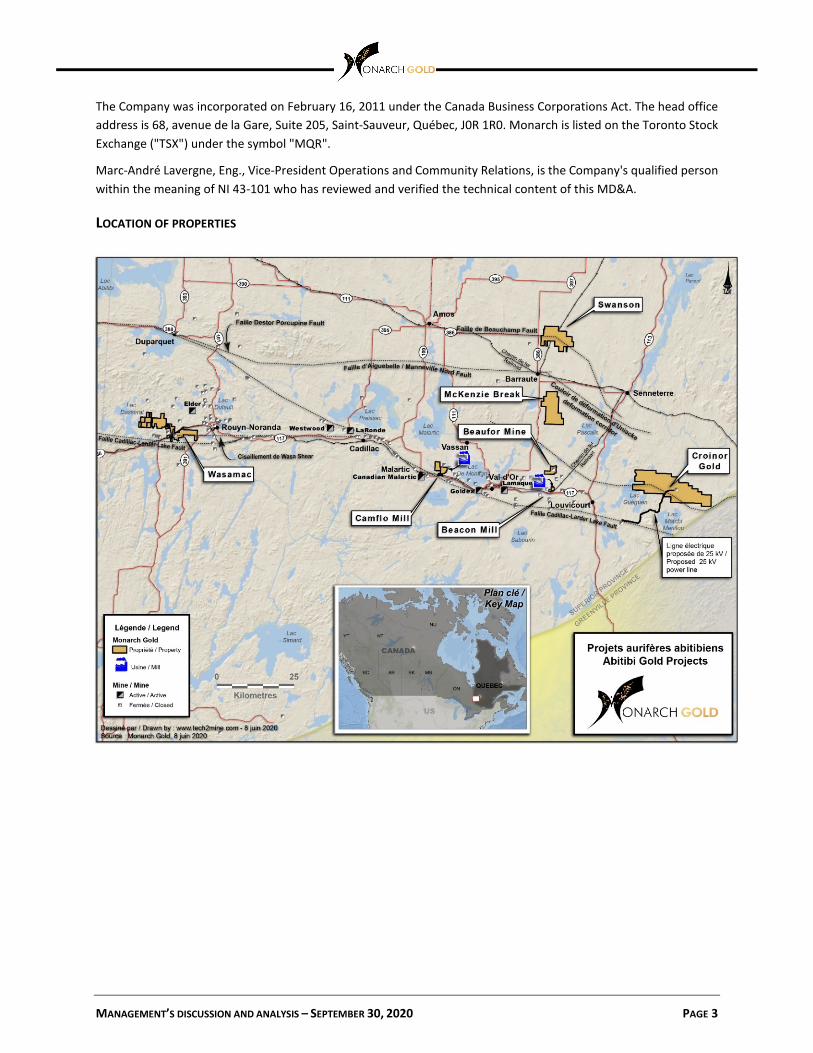
Monarch is an emerging gold mining company whose objective is to continue its expansion through its large portfolio of quality projects located in the Abitibi mining camp in Québec, Canada. The Company currently owns nearly 315 km² of gold properties including the Wasamac deposit, the Beaufor mine, the Croinor Gold and McKenzie Break advanced projects, the Camflo and Swanson exploration projects, as well as the Camflo and Beacon mills. It also offers custom milling services from its 1,600-ton-per-day Camflo mill.
The Company has determined that one of its mining properties, the Wasamac property, contains economically recoverable ore reserves, in accordance with a NI 43-101 feasibility study prepared by BBA Inc. dated December 1, 2018 and filed on SEDAR on December 3, 2018. As at September 30, 2020, the Company has determined that the Wasamac property is still at the prospecting stage, as the Company has not yet obtained the necessary financing to undertake the development and construction phase of the Wasamac project.
In June 2019, the Company decided to temporarily suspend the operations of the Beaufor mine and Camflo mill and place them in care and maintenance.
MANAGEMENT’S DISCUSSION AND ANALYSIS – SEPTEMBER 30, 2020 PAGE 3
The Company was incorporated on February 16, 2011 under the Canada Business Corporations Act. The head office address is 68, avenue de la Gare, Suite 205, Saint-Sauveur, Québec, J0R 1R0. Monarch is listed on the Toronto Stock Exchange ("TSX") under the symbol "MQR".
Marc-André Lavergne, Eng., Vice-President Operations and Community Relations, is the Company's qualified person within the meaning of NI 43-101 who has reviewed and verified the technical content of this MD&A.
LOCATION OF PROPERTIES

MANAGEMENT’S DISCUSSION AND ANALYSIS – SEPTEMBER 30, 2020 PAGE 4
HIGHLIGHTS BETWEEN SEPTEMBER 30, 2020 AND THE DATE OF THE REPORT
• On November 1, 2020, the Company entered into a definitive agreement with Yamana Gold Inc. ("Yamana") pursuant to which Yamana will acquire the Wasamac property and the Camflo property and mill by acquiring all of the outstanding shares of Monarch (not already owned by Yamana) for a total consideration of approximately $200 million or $0.63 per Monarch share on a fully diluted basis, by way of a plan of arrangement. The total consideration payable by Yamana to Monarch shareholders is approximately $60.8 million in cash and $91.2 million in Yamana shares. Pursuant to the Plan of Arrangement, Monarch will first complete a spin-off transaction to its shareholders, through a newly incorporated company ("SpinCo") that will hold its other mining properties and certain other assets and liabilities of Monarch, by issuing common shares of SpinCo having a value of approximately $47.5 million.
HIGHLIGHTS AS OF SEPTEMBER 30, 2020
• The Corporation fully repaid the balance of purchase price of the Beacon property, which includes the Beacon mill with a capacity of 750 tons per day.
• On September 17, 2020, the Company completed a financing of 9,030,000 provincial flow-through units (Québec) at a price of $0.72 per unit and 11,404,000 federal flow-through units (Canada) at a price of $0.57 per unit for gross proceeds of $13,001,880.
• On September 15, 2020, the Company retained the services of InnovExplo to carry out a compilation of historical data and 3D modeling of its Camflo property.
• On July 9, 2020, the Company signed a Memorandum of Understanding with Ontario Northland Railway to transport Wasamac ore to the Kidd Mill.

MANAGEMENT’S DISCUSSION AND ANALYSIS – SEPTEMBER 30, 2020 PAGE 5
RESERVES Tons (metric) Grade (g/t Au) Ounces
Wasamac property (1) (2) Proven Reserves 1.03 M 2.66 88,000 Probable Reserves 20.43 M 2.56 1,679,000 Proven and Probable Reserves 21.46 M 2.56 1,767,000
(1) The reserves of the Wasamac property are included in the resource calculation in the table below. (2) Source: NI 43-101 Technical Report, Feasibility Study of the Wasamac Project, Rouyn-Noranda, Québec, Canada, Carl Caumartin, P.
Eng., Alain Dorval, P. Eng., John Henning, P. Eng., Richard Jundis, P. Eng. and Luciano Piciacchia, P. Eng. from BBA Inc., and Tudorel Ciuculescu, P. Geo. from Roscoe Postle Associates Inc., December 1, 2018.
RESOURCES
Tons (metric) Grade (g/t Au) Ounces Wasamac property (1) Measured Resources 3.99 M 2.52 323,300 Indicated Resources 25.87 M 2.72 2,264,500 Total Measured and Indicated 29.86 M 2.70 2,587,900 Total Inferred 4.16 M 2.20 293,900 Croinor Gold property (2) Measured Resources 80,100 8.44 21,700 Indicated Resources 724,500 9.20 214,300 Total Measured and Indicated 804,600 9.12 236,000 Total Inferred 160,800 7.42 38,400 McKenzie Break property (3) Indicated Resources (pit constrained) 939,860 1.59 48,133 Indicated Resources (underground) 281,739 5.90 53,448 Total Indicated 1,221,599 2.58 101,581 Total Inferred 574,780 3.46 64,027 Swanson property (4) Indicated Resources (pit constrained) 1,694,000 1.80 98,100 Indicated Resources (underground) 58,100 3.17 5,900 Total Indicated 1,752,100 1.85 104,100 Total Inferred 74,000 2.96 7,100 Beaufor Mine (5) Measured Resources 74,400 6.71 16,100 Indicated Resources 271,700 7.93 69,300 Total Measured and Indicated 346,200 7.67 85,400 Total Inferred 46,100 8.34 12,400 TOTAL COMBINED (6)
Measured and Indicated Resources Inferred Resources
3,155,361 375,447
(1) Source: Technical Report on the Wasamac Project, Rouyn-Noranda, Québec, Canada, Tudorel Ciuculescu, M.Sc., P. Geo., October 25, 2017, Roscoe Postle Associates Inc.
(2) Source: Monarch prefeasibility study (January 19, 2018) and resource estimate (January 8, 2016). (3) Source: NI 43-101 Technical Report on the McKenzie Break Project, April 17, 2018, Alain-Jean Beauregard, P.Geo., and
Daniel Gaudreault, Eng., of Geologica Groupe-Conseil Inc. and Christian D’Amours, P.Geo., of GeoPointCom Inc. (4) Source: NI 43-101 Technical Report on the Swanson Project, June 20, 2018, Christine Beausoleil, P.Geo., and Alain Carrier, P.Geo.,
M.Sc., of InnovExplo Inc. (5) Source: NI 43-101 Technical Report on the Mineral Resource and Mineral Reserve Estimates of the Beaufor Mine as at
September 30, 2017, Val-d’Or, Québec, Canada, Carl Pelletier, P. Geo. and Laurent Roy, Eng. (6) Numbers may not add due to rounding.
MANAGEMENT’S DISCUSSION AND ANALYSIS – SEPTEMBER 30, 2020 PAGE 6
OUTLOOK
The main business objectives that the Company plans to achieve are: i) following the publication of the feasibility study for the Wasamac gold deposit, the Company is examining financing, partnership or other opportunities to advance the project; ii) continue the permitting process for Wasamac; iii) continue the analysis of drilling results on the McKenzie Break and Beaufor properties and continue exploration work; and iv) study the different possible scenarios for the Beaufor mine and the impacts on the Camflo and Beacon mills.
In September 2020, the Company completed a flow-through financing. Existing exploration programs will be updated in the coming weeks with these newly available funds.
KEY FINANCIAL DATA
(In dollars except per-share data) QUARTERS ENDED SEPTEMBER 30
2020 2019 Revenues – 3,144,699 Cost of sales – (1,558,101) Gross margin – 1,586,598 Administrative expenses (983,494) (792,517) Care and maintenance expenses (653,279) (596,069) Beaufor exploration expenses (1,146,864) – Gain on disposal of non-financial assets – 314,400 Change in fair value of investments 100,171 866,745 Net earnings (net loss) (2,531,837) 1,178,934 Cash flows from operating activities (2,740,849) (358,354) Cash flows from financing activities 7,916,638 (114,125) Cash flows from investing activities (640,518) 555,219 EBITDA (1) (2,304,649) 1,462,813 Key per-share data
Basic net earnings (net loss) (0.009) 0.005 Diluted net earnings (net loss) (0.009) 0.005
(In dollars) SEPTEMBER 30,
2020 JUNE 30,
2020 Cash and cash equivalents 15,809,741 11,274,470 Total assets 98,449,289 92,987,397 Non-current liabilities 18,532,512 19,691,713 Shareholders’ equity 72,510,388 65,985,291
MANAGEMENT’S DISCUSSION AND ANALYSIS – SEPTEMBER 30, 2020 PAGE 7
RECONCILIATION OF NET EARNINGS (NET LOSS) TO EBITDA
(In dollars) QUARTERS ENDED SEPTEMBER 30
2020 2019 Net earnings (net loss) (2,531,837) 1,178,934 Income and mining taxes 24,613 52,195 Finance expense 182,036 212,365 Amortization 20,539 19,319 EBITDA (1) (2,304,649) 1,462,813 (1) EBITDA: “Earnings before interest, taxes and depreciation” is a non-IFRS financial performance measure with no standard definition under
IFRS. It is therefore possible that this measure could not be comparable with a similar measure of another company. The Company uses this non-IFRS measure as an indicator of the cash generated by the operations and allows investors to compare the profitability of the Company with others by cancelling effects of different assets bases, effects due to different tax structures as well as the effects of different capital structures. See the “Non-IFRS Measures” section of this MD&A.
KEY OPERATING STATISTICS
Given that the Beaufor mine and the Camflo mill were put into care and maintenance mode in June 2019, no operational statistics comparable to previous periods will be presented for the 2020 and 2021 fiscal years.
REVIEW OF FINANCIAL RESULTS
Quarter ended September 30, 2020
Revenues for the current period consist of the sale of gold that was in inventory as at June 30, 2019, as well as the sale of ounces recovered from the clean-up of the Camflo mill. Revenues for fiscal year 2019 were generated while the Beaufor mine and the Camflo mill were in operation.
For the first quarter of the fiscal year beginning July 1, 2020 and ending June 30, 2021 ("Fiscal 2021"), general and administrative expenses were $1.0 million for the three-month period ended September 30, 2020 compared to $0.8 million for the same period last year, mainly due to higher share-based payments and higher consulting fees which were higher due to the process of closing the various transactions.
Care and maintenance expenses for the first quarter of Fiscal 2021 totaled $0.7 million compared to $0.6 million for the same period in Fiscal 2020. These costs began in the second quarter of 2020 at Camflo, after the cleaning and recovery of the last ounces. This explains an increase in care and maintenance expenses while those at Beaufor stabilized and some of them were reclassified in exploration expenses due to the change in the assignment of certain employees and facilities.
Exploration expenses amounted to $1.1 million for the three-month period ended September 30, 2020, compared to $nil for the three-month period ended September 30, 2019. These expenses are related to exploration activities at the Beaufor mine. The Company resumed exploration work in June 2020 following the CDPQ transaction completed in May 2020.
The Company recorded an exchange loss of $0.1 million related to the fluctuation of the Canadian dollar against the U.S. dollar at the balance sheet date. The balance of purchase price denominated in U.S. dollars is mainly subject to foreign currency fluctuations.
Investments held generated gains of $0.1 million for the quarter ended September 30, 2020 related to increases in fair value.
MANAGEMENT’S DISCUSSION AND ANALYSIS – SEPTEMBER 30, 2020 PAGE 8
The Company reported a net loss of $2.5 million or $0.009 per basic and diluted share for the three-month period ended September 30, 2020, compared to net income of $1.2 million or $0.005 per basic and diluted share for the corresponding period in Fiscal 2020. This $3.7 million decrease in net income is mainly due to an increase of $1.1 million in exploration expenses at the Beaufor mine and a decrease in gross margin of $1.6 million due to the cessation of production activities.
REVIEW OF PRODUCTION ACTIVITIES
Production activities at the Beaufor mine have been temporarily suspended since late June 2019. The decisions to suspend operations was taken in August 2018 and was mainly due to low grades ores mined from Beaufor in previous quarters. This negatively impacted the mine's profitability. As a result, the mine's workforce was reduced in December 2018 to limit operations to the recovery of ounces accessible in the following months while controlling costs. The workforce is again being reduced to what is strictly necessary to ensure the care and maintenance of the mine and its facilities.
In June 2019, the Company also decided to temporarily suspend operations of the Camflo mill and place it in care and maintenance mode. In July 2019, the Company began work to recover the remaining ounces of ore available at the mill while carrying out work to maintain the facilities and equipment in good condition and completed this work in October 2019.
REVIEW OF EXPLORATION AND EVALATION ACTIVITIES
(In dollars) QUARTER ENDED
SEPTEMBER 30, 2020 YEAR ENDED
JUNE 30, 2020
Exploration and evaluation expenses
Croinor Gold – 3,504 Wasamac 244,798 392,746 McKenzie Break 152,935 1,033,509 Fayolle – 959,336 Beaufor Mine 1,146,864 99,042 Others 7,396 31,920
Exploration and evaluation 1,551,993 2,520,057 Capitalized exploration and evaluation expenses 405,129 2,421,015
Exploration and evaluation expenses 1,146,864 99,042
MANAGEMENT’S DISCUSSION AND ANALYSIS – SEPTEMBER 30, 2020 PAGE 9
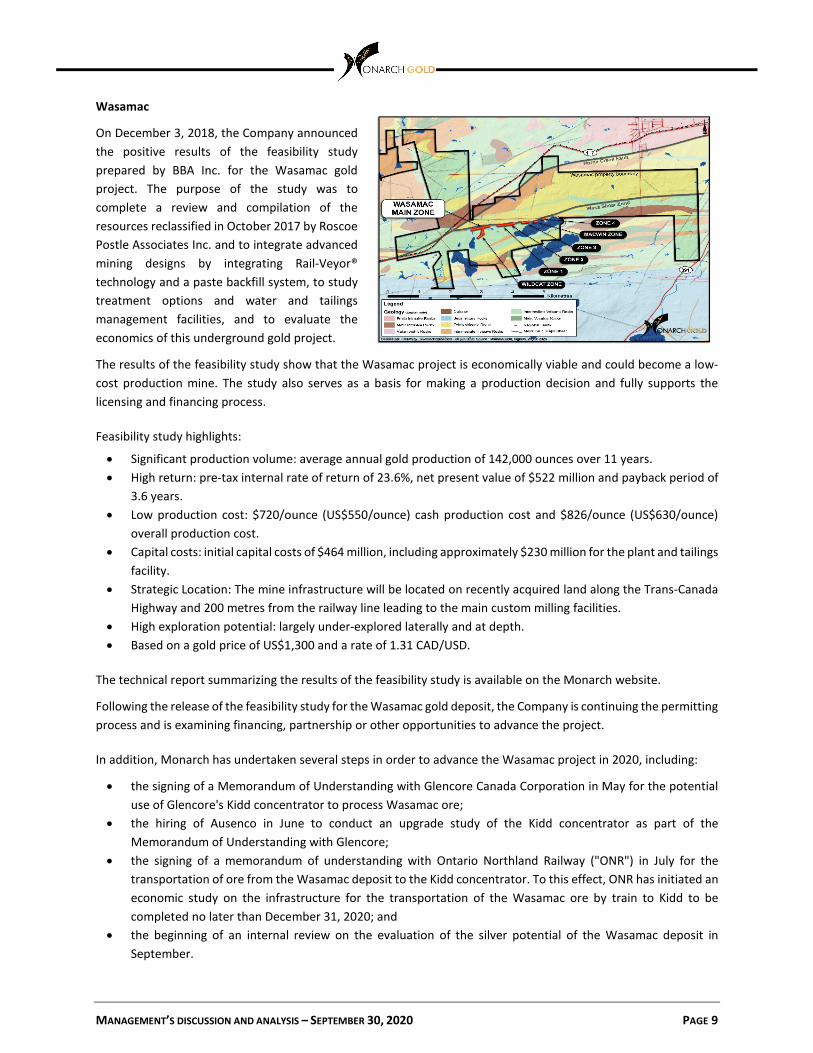
Wasamac
On December 3, 2018, the Company announced the positive results of the feasibility study prepared by BBA Inc. for the Wasamac gold project. The purpose of the study was to complete a review and compilation of the resources reclassified in October 2017 by Roscoe Postle Associates Inc. and to integrate advanced mining designs by integrating Rail-Veyor® technology and a paste backfill system, to study treatment options and water and tailings management facilities, and to evaluate the economics of this underground gold project.
The results of the feasibility study show that the Wasamac project is economically viable and could become a low-cost production mine. The study also serves as a basis for making a production decision and fully supports the licensing and financing process.
Feasibility study highlights:
• Significant production volume: average annual gold production of 142,000 ounces over 11 years. • High return: pre-tax internal rate of return of 23.6%, net present value of $522 million and payback period of
3.6 years. • Low production cost: $720/ounce (US$550/ounce) cash production cost and $826/ounce (US$630/ounce)
overall production cost. • Capital costs: initial capital costs of $464 million, including approximately $230 million for the plant and tailings
facility. • Strategic Location: The mine infrastructure will be located on recently acquired land along the Trans-Canada
Highway and 200 metres from the railway line leading to the main custom milling facilities. • High exploration potential: largely under-explored laterally and at depth. • Based on a gold price of US$1,300 and a rate of 1.31 CAD/USD.
The technical report summarizing the results of the feasibility study is available on the Monarch website.
Following the release of the feasibility study for the Wasamac gold deposit, the Company is continuing the permitting process and is examining financing, partnership or other opportunities to advance the project.
In addition, Monarch has undertaken several steps in order to advance the Wasamac project in 2020, including:
• the signing of a Memorandum of Understanding with Glencore Canada Corporation in May for the potential use of Glencore's Kidd concentrator to process Wasamac ore;
• the hiring of Ausenco in June to conduct an upgrade study of the Kidd concentrator as part of the Memorandum of Understanding with Glencore;
• the signing of a memorandum of understanding with Ontario Northland Railway ("ONR") in July for the transportation of ore from the Wasamac deposit to the Kidd concentrator. To this effect, ONR has initiated an economic study on the infrastructure for the transportation of the Wasamac ore by train to Kidd to be completed no later than December 31, 2020; and
• the beginning of an internal review on the evaluation of the silver potential of the Wasamac deposit in September.

MANAGEMENT’S DISCUSSION AND ANALYSIS – SEPTEMBER 30, 2020 PAGE 10
McKenzie Break
McKenzie Break is a high-grade, narrow, multi-vessel, narrow-grained gold deposit hosted in the Pascalis dioritic batholith and covered with porphyry diorite and mafic and felsic volcanic rocks. In total, the McKenzie Break property now comprises a total of 134 mining claims covering a total area of 5,106.9 ha (51 km2).
Since the acquisition of the property, the Company has carried out several drilling campaigns. The table and figure below show the best drilling results obtained from these campaigns:
The Company is currently planning a drilling program starting this fall to follow up on these excellent results.
The width shown is the length of the core. True thickness is estimated at 90-100% of core length.
Survey Length (m)
From (m)
To (m)
Width (m)
Grade (g/t Au)

MANAGEMENT’S DISCUSSION AND ANALYSIS – SEPTEMBER 30, 2020 PAGE 11
Beaufor Mine
Monarch holds a 100% interest in the Beaufor mine, which consists of two mining leases, one mining concession and 23 mining claims covering an area of 5.9 km2 . The mine is located approximately 20 kilometers northeast of the town of Val-d'Or, in the Abitibi-Est county, Province of Québec. The Beaufor mine is an underground mine.
On June 27, 2019, production activities at the Beaufor mine were temporarily suspended and the mine was placed under care and maintenance.
On May 7, 2020, Monarch announced an agreement with the Caisse de dépôt et placement du Québec for the sale of a 3% net smelter royalty on net smelter revenues from gold production at the Beaufor mine in consideration of $5 million.
Since then, the Company has undertaken one of the most important exploration programs on the Beaufor property with a total of about 270 drill holes over 42,500 metres. Exploration drilling will include several phases, including:
• Underground work in the vicinity of the mine's exploration targets (high-grade intervals and isolated resource blocks)
• Near-surface and mine targets • Targets under the current mine bottom • Regional exploration targets
Underground work in the vicinity of the mine’s exploration targets
This initial phase represents the bulk of the exploration drilling and will focus on underground targets close to the mine, as defined by the recent 3D modeling. These holes will test zones located near historical high-grade intervals intersected in the drilling and associated with known vein structures that remain open. All of these targets are defined by high-grade intersections located in proximity to existing underground infrastructure, which requires minimal development for mining purposes. These defined targets are all located above the lowest level of mine development, at less than 900 metres in depth. Testing of these targets can easily be carried out from the available underground developments, with the majority of drill holes being less than 200 metres in length.
The second type of targets related to underground targets in the vicinity of the mine will be the follow-up of isolated resource blocks that still have significant expansion potential. These resource blocks are generally defined by a single hole along a known mineralized structure, but continuity has not been demonstrated due to a lack of nearby drilling.
Near Surface and Mine Targets
A surface drilling program in the vicinity of the mine will follow to test both high-grade targets and isolated resource blocks that cannot be adequately tested from the existing underground infrastructure. These targets are located in the vicinity of the mine and at a maximum depth of 300 metres from surface.
Targets under the current mine fund
An exploration drilling program to test the zone below the current bottom of the mine (over 900 metres deep) will be undertaken to continue testing the extension of known mineralization at depth, where mining operations prior
MANAGEMENT’S DISCUSSION AND ANALYSIS – SEPTEMBER 30, 2020 PAGE 12
to the temporary shutdown had ceased. Recent widely-spaced drilling below the bottom of the mine has confirmed the extension of the mineralization. Drilling will target specific zones defined by previous high-grade intersections in an area up to 230 metres below the current workings.
Regional Exploration Targets
The final phase of exploration drilling will consist of surface drilling to test regional targets defined by historical intersections and potential structures beyond the current limits of underground infrastructure.
Camflo
On September 15, 2020, the Company announced positive results from a helicopter-borne magnetic survey conducted on its behalf by Novatem Inc. on the Camflo property.
The Camflo mine was in production for 27 years, from 1965 to 1992, and produced a total of 1.65 million ounces of gold from 8,862,240 tonnes of ore grading 5.78 g/t Au (Source: QERPUB-M.E.R. Publication DV93-01 Resident Geologists' Reports on Regional Mining Activity, 1993).
Given that Camflo Mines discovered the Camflo deposit while drilling separate magnetic anomalies in 1962, Monarch decided to conduct a detailed helicopter-borne magnetic survey over the property at 25 m intervals to identify folds similar to those hosting the Camflo stock and mineralization along the southern branch of a larger, more regional fold. The survey clearly defined the folded iron formation associated with the Camflo mineralization, as confirmed by the underground workings of the mine. It also identified potential targets to the southeast, defined by a similar fold along the same stratigraphy, and two other potential folds to the northwest of the mine.
As a next step, Monarch will undertake a detailed compilation of historical data from the Camflo property. The Company has retained the services of InnovExplo of Val-d'Or, Quebec, a company experienced in this type of historical data compilation and 3D modeling, to undertake this important project. Work will begin in early September and should be completed before the end of the year.
A preliminary compilation of historical surface drill holes completed by Monarch geologists has identified a syenite intrusion intersected in two holes drilled in 1962, located approximately 800 metres southeast along the stratigraphic horizon hosting the Camflo.
Croinor Gold
On January 19, 2018, the Company announced the positive results of the pre-feasibility study prepared by Innovexplo Inc. The results of the pre-feasibility study show that the Croinor project is economically viable and could become a low-cost mine. The study is also used as a basis for making a production decision since all the permits are currently held by Innovexplo Inc.
Feasibility Study Highlights:
• High return: pre-tax internal rate of return of 47.56%, net present value of $32 million.
• Low cost of production: cash cost of production of $818/ounce (US$639/ounce) and overall cost of production of $1,155/ounce (US$902/ounce).
• Based on a gold price of US$1,280 and a rate of 1.28 CAD/USD.
• The study does not include drilling after November 2015.
The technical report summarizing the results of the pre-feasibility study is available on the Monarch website.
It is also important to mention that the results of the 2018 drilling program totalling 26,580 metres are not part of the pre-feasibility study and could considerably improve the project's potential. The next phase of exploration will

MANAGEMENT’S DISCUSSION AND ANALYSIS – SEPTEMBER 30, 2020 PAGE 13
focus on upgrading the deposit through definition and exploration drilling to test high-potential targets on the 151 km2 property. The Company will also analyze the various mining options to optimize the deposit's production potential.
Swanson
On August 3, 2018, the Company reported an NI 43-101 pit-constrained resource of 98,100 ounces in the indicated category on the property, as well as an underground resource of 5,900 ounces in the indicated category, for a total of 104,100 ounces of gold. An analysis of the economic potential of the deposit will have to be carried out in the context of the current gold price.
SELECTED QUARTERLY FINANCIAL INFORMATION
Selected quarterly financial information for the last eight quarters is presented below:
THREE-MONTH PERIODS ENDED: (In dollars)
SEPTEMBER 30 2020
JUNE 30 2020
MARCH 31 2020
DECEMBER 31 2019
Revenues – – 1,058,947 2,458,842 Cost of sales (1) – – (301,179) (821,873) Gross margin – – 757,768 1,636,969 Net earnings (net loss) (2,531,837) 8,474,270, (247,533) 127,263 Basic and diluted net earnings (net loss)
per share 0.009 0.03 (0.001) 0.000 EBITDA (2,304,649) 9,779,274 (114,020) 340,205 Cash and cash equivalents 15,809,741 11,271,470 4,339,304 5,079,132 Working capital 29,096,591 23,360,106 4,401,985 5,240,152 Total assets 98,449,289 92,987,397 75,982,259 76,097,411
Operating activities (2,740,849) (1,732,110) (1,056,820) (453,475) Financing activities 7,916,638 5,193,839 886,821 (1,015,428) Investing activities (640,518) 3,473,437 (569,829) 83,988 THREE-MONTH PERIODS ENDED: (In dollars)
SEPTEMBER 2019
JUNE 30 2019
MARCH 31 2019
DECEMBER 31 2018
Revenues 3,162,901 7,349,262 5,114,247 11,411,996 Cost of sales (1,430,313) (5,408,922) (5,094,175) (8,516,247) Gross margin 1,732,588 1,940,340 20,072 2,895,749 Net earnings (net loss) 1,178,934 926,602 (765,854) 2,175,702 Basic and diluted net earnings (net loss)
per share 0.005 0.005 (0.003) 0.009 EBITDA 1,462,813 1,237,876 59,088 3,500,614 Cash and cash equivalents 6,464,047 6,381,307 4,848,417 9,272,840 Working capital 6,889,250 7,282,511 4,842,048 4,533,091 Total assets 77,191,632 72,577,395 69,743,397 72,548,922 Operating activities (358,354) 990,724 (3,790,188) 2,319,106 Financing activities (114,125) 1,867,493 (478,365) 853,020 Investing activities 555,219 (1,325,327) (155,870) (4,636,647) (1) The Company changed the classification of certain expenses during the quarter ended December 31, 2019. The figures for the quarter ended
September 30, 2019 have been adjusted to reflect the new presentation.

MANAGEMENT’S DISCUSSION AND ANALYSIS – SEPTEMBER 30, 2020 PAGE 14
FINANCIAL POSITION
(In dollars) AS AT SEPTEMBER 30 2020
AS AT JUNE 30 2020 EXPLANATIONS OF VARIATIONS
Current assets 36,502,980 30,670,499
The increase in current assets is mainly due to funds from the issuance of shares partly offset by share issue expenses and the repayment of a balance of purchase price.
Non-current assets 61,946,309 62,316,898 Non-current assets decreased mainly due to the replacement of certain financial guarantees by an insurance guarantee.
Total assets 98,449,289 92,987,397
Current liabilities 7,406,389 7,310,393
Current liabilities are stable despite an increase related to flow-through share liabilities with the financing completed, largely offset by the decrease related to the repayment of a balance of purchase price.
Non-current liabilities 18,532,512 19,691,713 Non-current liabilities decreased largely as a result of the repayment of a balance of purchase price.
Total liabilities 25,938,901 27,002,106
Shareholders’ equity 72,510,388 65,985,291 Shareholders' equity increased mainly as a result of the shares issued during the quarter in connection with the financing completed.
LIQUIDITY AND SOURCES OF FINANCING
The Company’s strategy is based on achieving positive cash flows from operations to internally fund operating, capital and project development requirements. Material increases or decreases in the Company’s liquidity and capital resources will be substantially determined by the success or failure of the Company’s operations, exploration, and development programs, the ability to obtain equity or other sources of financing.
As at September 30, 2020, the Company had cash and cash equivalents of $15.8 million, compared to $11.3 million as at June 30, 2020. Of this amount, $14.5 million is reserved for exploration expenses. The Company also has investments in shares and warrants of publicly traded Canadian companies as well as gold ounces totalling $14.8 million.
MANAGEMENT’S DISCUSSION AND ANALYSIS – SEPTEMBER 30, 2020 PAGE 15
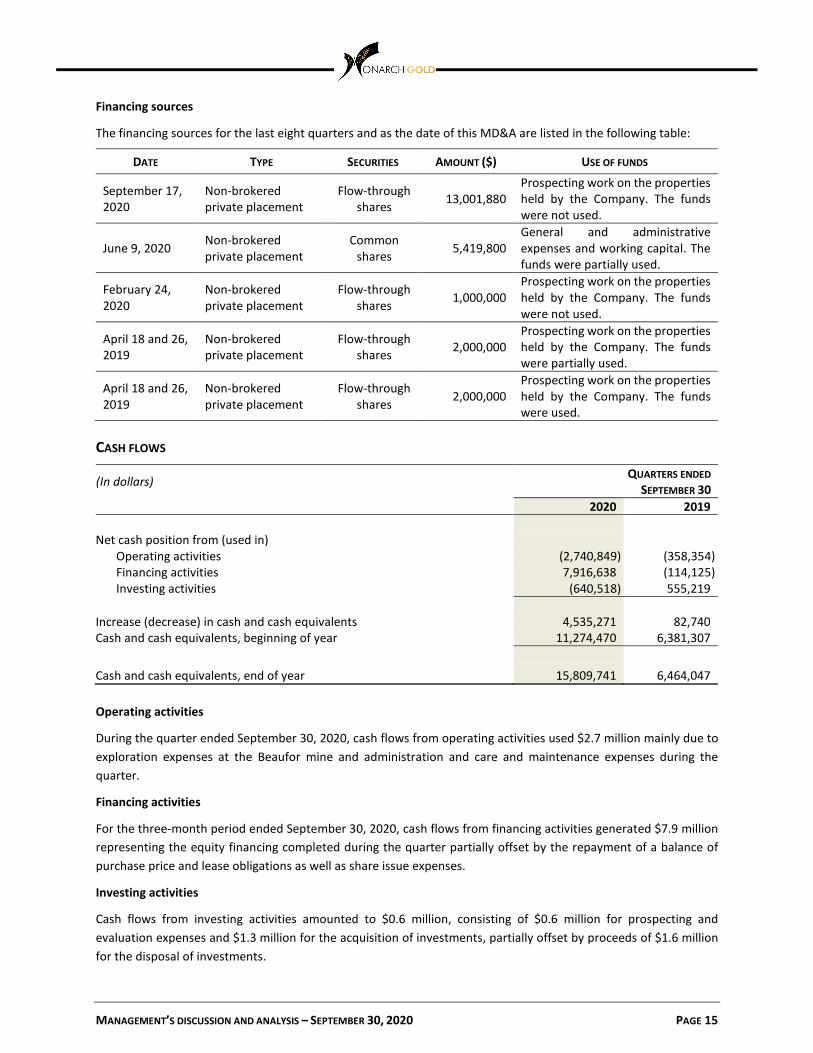
Financing sources
The financing sources for the last eight quarters and as the date of this MD&A are listed in the following table:
DATE TYPE SECURITIES AMOUNT ($) USE OF FUNDS
September 17, 2020
Non-brokered private placement
Flow-through shares 13,001,880
Prospecting work on the properties held by the Company. The funds were not used.
June 9, 2020 Non-brokered private placement
Common shares 5,419,800
General and administrative expenses and working capital. The funds were partially used.
February 24, 2020
Non-brokered private placement
Flow-through shares 1,000,000
Prospecting work on the properties held by the Company. The funds were not used.
April 18 and 26, 2019
Non-brokered private placement
Flow-through shares 2,000,000
Prospecting work on the properties held by the Company. The funds were partially used.
April 18 and 26, 2019
Non-brokered private placement
Flow-through shares 2,000,000
Prospecting work on the properties held by the Company. The funds were used.
CASH FLOWS
(In dollars) QUARTERS ENDED SEPTEMBER 30
2020 2019 Net cash position from (used in)
Operating activities (2,740,849) (358,354) Financing activities 7,916,638 (114,125) Investing activities (640,518) 555,219
Increase (decrease) in cash and cash equivalents 4,535,271 82,740 Cash and cash equivalents, beginning of year 11,274,470 6,381,307 Cash and cash equivalents, end of year 15,809,741 6,464,047
Operating activities
During the quarter ended September 30, 2020, cash flows from operating activities used $2.7 million mainly due to exploration expenses at the Beaufor mine and administration and care and maintenance expenses during the quarter.
Financing activities
For the three-month period ended September 30, 2020, cash flows from financing activities generated $7.9 million representing the equity financing completed during the quarter partially offset by the repayment of a balance of purchase price and lease obligations as well as share issue expenses.
Investing activities
Cash flows from investing activities amounted to $0.6 million, consisting of $0.6 million for prospecting and evaluation expenses and $1.3 million for the acquisition of investments, partially offset by proceeds of $1.6 million for the disposal of investments.
MANAGEMENT’S DISCUSSION AND ANALYSIS – SEPTEMBER 30, 2020 PAGE 16
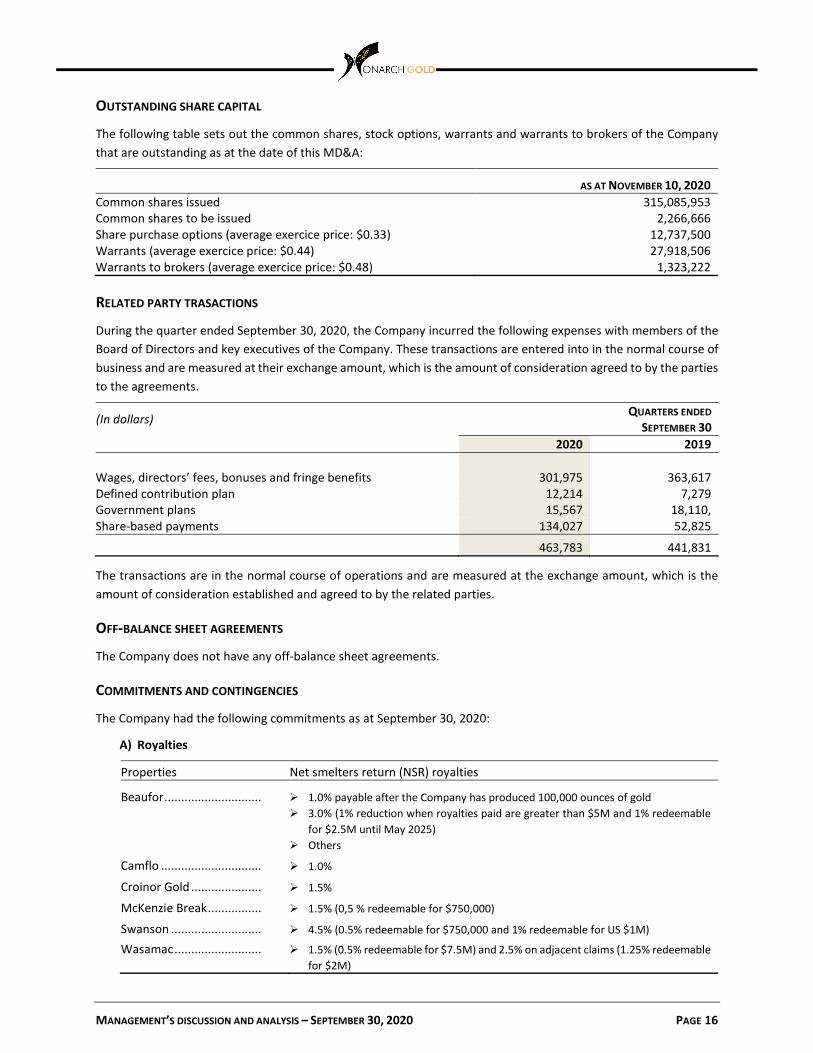
OUTSTANDING SHARE CAPITAL
The following table sets out the common shares, stock options, warrants and warrants to brokers of the Company that are outstanding as at the date of this MD&A:
AS AT NOVEMBER 10, 2020 Common shares issued 315,085,953 Common shares to be issued 2,266,666 Share purchase options (average exercice price: $0.33) 12,737,500 Warrants (average exercice price: $0.44) 27,918,506 Warrants to brokers (average exercice price: $0.48) 1,323,222
RELATED PARTY TRASACTIONS
During the quarter ended September 30, 2020, the Company incurred the following expenses with members of the Board of Directors and key executives of the Company. These transactions are entered into in the normal course of business and are measured at their exchange amount, which is the amount of consideration agreed to by the parties to the agreements.
(In dollars) QUARTERS ENDED SEPTEMBER 30
2020 2019 Wages, directors’ fees, bonuses and fringe benefits 301,975 363,617 Defined contribution plan 12,214 7,279 Government plans 15,567 18,110, Share-based payments 134,027 52,825
463,783 441,831
The transactions are in the normal course of operations and are measured at the exchange amount, which is the amount of consideration established and agreed to by the related parties.
OFF-BALANCE SHEET AGREEMENTS
The Company does not have any off-balance sheet agreements.
COMMITMENTS AND CONTINGENCIES
The Company had the following commitments as at September 30, 2020:
A) Royalties
Properties Net smelters return (NSR) royalties
Beaufor ............................. 1.0% payable after the Company has produced 100,000 ounces of gold 3.0% (1% reduction when royalties paid are greater than $5M and 1% redeemable
for $2.5M until May 2025) Others
Camflo .............................. 1.0%
Croinor Gold ..................... 1.5%
McKenzie Break ................ 1.5% (0,5 % redeemable for $750,000)
Swanson ........................... 4.5% (0.5% redeemable for $750,000 and 1% redeemable for US $1M)
Wasamac .......................... 1.5% (0.5% redeemable for $7.5M) and 2.5% on adjacent claims (1.25% redeemable for $2M)

MANAGEMENT’S DISCUSSION AND ANALYSIS – SEPTEMBER 30, 2020 PAGE 17
B) Flow-through shares
During the years ended June 30, 2019 and 2020, as well as the quarter ended September 30, 2020, the Company is committed to disbursing, prior to certain dates, amounts in eligible exploration and evaluation expenses, in accordance with the Income Tax Act (Canada) and the Québec Taxation Act, and to transfer these tax deductions to the subscribers of the completed flow-through share investments of each of the financings. In connection with these commitments, the table below provides important details:
DATE OF THE
FINANCINGS AMOUNT OF
FINANCINGS DEADLINE FOR
DISBURSEMENTS RESERVED FUNDS AS AT
SEPTEMBER 30, 2020
LIABILITIES RELATED TO FLOW-THROUGH SHARES AS AT
SEPTEMBER 30, 2020 $ $ $ September 17, 2020 13,001,880 December 31, 2021 13,001,880 3,193,560 February 24, 2020 1,000,000 December 31, 2021 1,000,000 280,000 April 18 and 26, 2019 2,000,000 December 31, 2020 545,926 156,925
14,547,806 3,630,485
The Canada Revenue Agency and Revenue Québec have granted additional 12-month delays for disbursements related to flow-through financings completed in 2019 and 2020. As a result, the maximum delay is 12 months longer than the deadlines presented in the previous table.
NON-IFRS FINANCIAL MEASURES
Throughout this document, the Company has provided measures prepared according to IFRS as well as some non-IFRS financial performance measures. Because the non-IFRS performance measures do not have any standardized definition prescribed by IFRS, they may not be comparable to similar measures presented by other companies. The Company provides these non-IFRS financial performance measures as they may be used by some investors to evaluate our financial performance. Accordingly, they are intended to provide additional information and should not be considered in isolation or as a substitute for measures of performance prepared in accordance with IFRS. These non-IFRS financial performance measures were reconciled to reported IFRS measures within the document (refer to the section "Reconciliation of net earnings (loss) to EBITDA" for a description and reconciliation of this measure not defined by IFRS).
SIGNIFICANT ACCOUNTING POLICIES
Full disclosure and a description of the Company's significant judgments and estimates are detailed in the audited consolidated financial statements for the year ended June 30, 2020.
SIGNIFICANT JUDGMENTS AND ESTIMATES
Full disclosure and a description of the Company's significant judgments and estimates are detailed in the audited consolidated financial statements for the year ended June 30, 2020.
FINANCIAL INSTRUMENTS
There is a full disclosure and description of the Company’s financial instruments, financial risk management and capital management in Notes 28 and 29 of the audited consolidated financial statements for the year ended June 30, 2020.
MANAGEMENT’S DISCUSSION AND ANALYSIS – SEPTEMBER 30, 2020 PAGE 18
RISK FACTORS
Risk factors are discussed in detail in the Company's Management's Discussion and Analysis for the year ended June 30, 2020.
DISCLOSURE CONTROLS AND PROCEDURES AND INTERNAL CONTROLS OVER FINANCIAL REPORTING
As a publicly traded entity, management must take steps to ensure that material information relating to reports filed or submitted under securities laws presents financial information fairly. This responsibility is the responsibility of management, including the President and Chief Executive Officer and the Chief Financial Officer. Management is responsible for establishing, maintaining and evaluating the design of disclosure controls and procedures and internal control over financial reporting.
DISCLOSURE CONTROLS AND PROCEDURES
Management is responsible for establishing and maintaining a system of disclosure controls and procedures designed to provide reasonable assurance that material information relating to the Corporation and its subsidiaries is obtained and made known to senior management in a timely manner so that appropriate decisions can be made regarding disclosure.
INTERNAL CONTROLS OVER FINANCIAL REPORTING
Management is responsible for establishing and maintaining internal controls over financial reporting designed to provide reasonable assurance regarding the reliability of financial reporting and the preparation of financial statements for external purposes in accordance with IFRS.
During the period from July 1, 2020 to September 30, 2020, no changes were made to the Company's internal control over financial reporting that have materially affected or are reasonably likely to materially affect the Company's internal control over financial reporting.
In designing disclosure controls and procedures and internal control over financial reporting, the Company recognizes that, regardless of how such controls are designed and performed, they can provide only reasonable and non-absolute assurance that the objectives expected of the system of controls are being achieved.
ADDITIONAL INFORMATION AND CONTINUOUS DISCLOSURE
This MD&A was prepared as at the date shown in the header of this document. Additional information relating to the Company, including the technical reports mentioned herein and the Company’s Annual Information Form and Proxy Circular can be found on the SEDAR website www.sedar.com and on our website at www.monarquesgold.com.
MANAGEMENT’S DISCUSSION AND ANALYSIS – SEPTEMBER 30, 2020 PAGE 19
GENERAL INFORMATION
HEAD OFFICE
68, avenue de la Gare, Suite 205 Saint-Sauveur (Québec) J0R 1R0 CANADA
WEBSITE
www.monarquesgold.com
STOCK EXCHANGE
TSX Symbol (shares) : MQR
OTC Markets Symbole (shares): MRQRF
EXECUTIVE MANAGEMENT
Jean-Marc Lacoste President and CEO
Alain Lévesque CPA, CA Chief Financial Officer and Vice-President Finance
Marc-André Lavergne, ing. Vice President Operations and Community Relations
Mathieu Séguin Vice President, Corporate Development
BOARD OF DIRECTORS
Michel Bouchard, Chairman of the Board*
Jean-Marc Lacoste, Director
Guylaine Daigle, Director*, **
Yohann Bouchard, Director
Christian Pichette, Director*, **
Laurie Gaborit, Director**
* Member of the audit committee
** Member of the Compensation Committee
LEGAL COUNSEL
Stein Monast S.E.N.C.R.L. Stein Monast Building 70, Dallhousie street, Suite 300 Québec (QC) G1K 4B2 CANADA
TRANSFER AGENT
Computershare Trust Company of Canada 1500, Robert-Bourassa boulevard 7e floor Montréal (QC) H3A 3S8 CANADA
AUDITORS
KPMG LLP KPMG Tour 600, De Maisonneuve boulevard West Suite 1500 Montréal (QC) H3A 0A3 CANADA
INVESTORS RELATIONS
Jean-Marc Lacoste
Phone: 1 888 994-4465