Management Review - NMIMS Review Volume XXII October - November 2012 ... Mari Sudha Babita Kumar ......
114
Management Review Volume XXII October - November 2012 ISSN: 0971-1023 Is Advertising Effective or Not? Evidence from the Pharmaceutical Market Dana Costea Franklin Carter Shin-Yi Chou Art King , Indiana University South Bend , Pennsylvania State University , Lehigh University , Lehigh University
Transcript of Management Review - NMIMS Review Volume XXII October - November 2012 ... Mari Sudha Babita Kumar ......
ManagementReview
Volume XXII October - November 2012
ISSN: 0971-1023
Is Advertising Effective or Not?Evidence from the Pharmaceutical MarketDana Costea
Franklin Carter
Shin-Yi Chou
Art King
, Indiana University South Bend
, Pennsylvania State University
, Lehigh University
, Lehigh University

2ISSN: 0971-1023NMIMS Management ReviewVolume XXII October - November 2012

Table of Contents
3Table of ContentsISSN: 0971-1023NMIMS Management ReviewVolume XXII October - November 2012
Is Advertising Effective or Not? 9
Evidence from the Pharmaceutical Market
A Multi Objective and Multi Constraint Approach to the Investment and 29
Financing of a Multinational Enterprise: A Synthesis
Customer Loyalty Attributes: A Perspective 49
Advertising during Recession: 77
An Agency Perspective from India
Perception and Attitude of Farmers and 89
Agri Firms Towards Commodity Finance
Dana Costea
Franklin Carter
Shin-Yi Chou
Art King
Augustine C. Arize
Krishna M. Kasibhatla
John Malindretos
Brian Maruffi
Moschos Scoullis
Alok Kumar Rai
Medha Srivastava
Varsha Jain
Subhadip Roy
Aarzoo Daswani
Mari Sudha
Babita Kumar
Gagandeep Banga
Ajay Jindal
School of Business Management Advisory Committee
Dr. Gurumurthy Kalyanaram, Editor
Dr. B.M. Kacholia
Dr. Bala Krishnamoorthy
Dr. Debashis Sanyal
NMIMS, Mumbai
NMIMS, Mumbai
Dean, School of Business Management,
NMIMS, Mumbai
The NMIMS Management Review, its Editorial Board, Editor and Publisher (Registrar SVKM’s Narsee Monjee
Institute of Management Studies) disclaim responsibility and liability for any statement of fact or opinion
made by the contributors.
Views expressed by authors in this publication do not represent the view of SVKM's Narsee Monjee Institute
of Management Studies. The Authors are wholly and solely responsible for the articles including the source of
information and references.
All communication should be addressed to:
The Editor
V.L. Mehta Road,
Vile Parle (W), Mumbai-400056.
Email: [email protected] or [email protected]
NMIMS Management Review
Dr. Gurumurthy Kalyanaram
Published by Ms. Varsha Parab, Director (Admin) & I/C Registrar, on behalf of SVKM’s Narsee Monjee
Institute of Management Studies.
Dr. Gita A. Kumta
Dr. Nilay Yajnik
Dr. Sangita Kamdar
NMIMS, Mumbai
NMIMS, Mumbai
NMIMS, Mumbai
School of Business Management Advisory Committee4ISSN: 0971-1023NMIMS Management ReviewVolume XXII October - November 2012

Editorial Board
Editorial Board
The journal’s editor is Dr. Gurumurthy Kalyanaram, Dean, Research for NMIMS University. He is assisted by a
distinguished editorial board.
1) Editor, International Journal of Pharmaceutical and Healthcare Marketing,
Emerald Publishers, US
2) Tata Institute of Social Sciences, Mumbai
3) The University of Texas, US
4) Penn State University, US
5) Eastern Michigan University, US
6) Former Executive Assistant to the US Secretary of Health and Human Services and
now at University of New Haven, US
7) Northwestern University, US
8) IIT Bombay, India
9) Aston School of Business, UK
10) Singapore Management University, Singapore
11) National Institute of Public Finance and Policy, New Delhi, India
12) Head, Intellectual Property Division, Dr. Eyal Bressler & Co., Israel
13) The University of Texas at Dallas, US
14) Consultant (Financial and Economic Analysis), New York, US
15) LUISS Guido Carli University, Italy and University of Groningen, Netherland
16) Director, Institute for Social and Economic Change, Bengaluru, India
17) New York University, US
18) Vice-President, Regulatory Affairs, Alnylam, US
19) University of Cincinnati, US
Dr. Avinandan Mukherjee,
Dr. Bino Paul,
Dr. David L. Ford,
Dr. Franklin Carter,
Dr. Jennifer Rice,
Dr. John J. Phelan,
Dr. Kalyan Raman,
Dr. K. Narayanan,
Dr. Kishore Gopalakrishna Pillai,
Dr. Michael Benoliel,
Dr. N.R. Bhanumurthy,
Dr. Neil Wilkof,
Dr. Orlando Richard,
Dr. Paul R. Kutasovic,
Dr. Peter Leeflang,
Dr. R.S. Deshpande,
Dr. Russell Winer,
Dr. Saraswathy (Sara) Nochur,
Dr. Umanath S. Narayan,
5ISSN: 0971-1023NMIMS Management ReviewVolume XXII October - November 2012

1) IIM Ahmedabad
2) Amrita University
3) Syracuse University, US
4) IIM Calcutta
5) Management
Development Institute, Gurgaon
6) L & T College of
Engineering, Mumbai
7) IIM Bangalore
8) Tsinghua University, Beijing,
China
9) Tricertes, US
10) William Patterson
University, US
11) President, Vidya
Technologies, US
12) IIM Indore
13) IIM Bangalore
14) Office of the Editor, International
Journal of Pharmaceutical and Healthcare
Marketing, Emerald Publishers, UK
Dr. Ajay Pandey,
Dr. Amalendu Jyothishi,
Dr. Amiya Basu,
Dr. Anindya Sen,
Dr. Ashok Pratap Arora,
Bhuvan Damahe,
Dr. Devnath Tirupati,
Dr. Hao Chen,
Dr. Jim Sund,
Dr. John Malindretos,
Dr. Kumar Nochur,
Dr. M.B. Ragupathy,
Dr. Nagasimha Kanagal,
Naz Onel,
Panel of ReviewersThe Journal is grateful to the following outstanding panel of reviewers.
15) Amrita University
16) IIM Calcutta
17) Amrita University
18) Retired Executive,
Bangalore
19) Consultant, India
20) The University of Texas,
Austin, US
21) Ashland
University, US
22) Amrita University
23) NMIMS University, Shirpur
24) Kurukshetra
University
25) Lamar University, US
26) Tata Institute of Social
Sciences, Mumbai
Dr. Neerpal Rathi,
Dr. Panduranga Bhatta,
Dr. P. Balasubramanian,
P. K. Ramakrishnan,
S.P. Agarwal,
Dr. Steve Gilbert,
Dr. Sivakumar Venkataramany,
Dr. Sushanta Mahapatra,
Dr. Tapan Bagchi,
Dr. Tejinder Sharma,
Dr. Vivek Natarajan,
Dr. Zubin Mulla,
Panel of Reviewers6ISSN: 0971-1023NMIMS Management ReviewVolume XXII October - November 2012

Editorial From Dr. Gurumurthy Kalyanaram
EditorialFrom Dr. Gurumurthy Kalyanaram
In this third issue of the revamped journal, we
present five diverse manuscripts. The manuscripts
address the role of advertising in pharmaceutical
industry, investment decisions by a multinational
corporation, consumer behavior and loyalty
measurement, a firm's marketing investment
decisions (e.g., advertising) and the status of
commodity financing in agricultural sector. The
contributors come from different disciplines and
traditions. And the manuscripts offer interesting
insights, and compelling theory and empirics.
In this editorial, I want to raise an important
intellectual issue for our discussion. This issue is
central to our study of public management and
policy. What is good governance and how is related
to productivity/prosperity?
The research questions are as follows.
1. Are there boundary conditions to elements of
good governance?
2. Do we need pluralism in polity and economy for
prosperity and development of a society
(pluralism as defined by Europe and the United
States)?
3. Do we good governance for increased
productivity?
4. Is good governance an outcome of prosperity or
is prosperity an outcome of good governance?
Similarly, is productivity endogenous to good
governance?
I have been studying the economic and political
experiments of China and India, and the lessons
from these two important societies offer
inconclusive answers.
China's experiment advises us that a minimum level
of political reforms is necessary for the economy to
grow even when economy is designed to be
pluralistic. The experience also shows that greater
political participation, even if it were incremental,
facilitates inclusive development.
India's experiment tell us that even such apparently
favorable conditions as pluralism in polity and
economy, reasonable economic parameters and
independent judiciary are not sufficient conditions
for inclusive growth or social transformation.
Clearly, effective delivery of products and services is
necessary for such inclusive growth.
It is evident, from China's approach, that low-skills
based model of growth will absorb larger numbers
from the labor force, thus providing an opportunity
for immediate and perceptible reduction in poverty.
And the most significant reduction in poverty will
come from improvements in agricultural
productivity, as demonstrated by China's success
and India's failure in this regard.
The basic structure of India's economy (driven by
consumer investment) places better odds on India
to achieve mass-prosperity. If China manages to
achieve mass-prosperity through its current
economic structure (when more than one-third of
the economy driven by exports-imports), it will be a
new model indeed.
As we learn from the experiments of China and
India, it is not possible to develop robust
instruments to ensure accountability and
transparency without credible democracy, i.e.,
7ISSN: 0971-1023NMIMS Management ReviewVolume XXII October - November 2012

pluralism in polity. Pluralism in economy is not
enough. It is pluralism in polity that creates a self-
enforcing dynamic for design of accountable
governance in all sectors.
Non-democratic forms of governance, when benign
and focused, may be able to deliver well in the
traditional metrics (e.g. , life expectancy,
nourishment, infant mortality) of quality of life and
inclusive development. However, such governance
cannot deliver on the fundamental rights of human
life: liberty and freedom.
Building and designing a robust democracy
requires self-reinforcing mechanisms and
institutions. Elections and ability to express
preferences in political choices is necessary, but not
sufficient. Freedom of speech, unimpeded access to
information, credible judiciary all have to be built
and fostered together simultaneously. This is clear
from India's experiment.
It is also clear that in a democracy accountable and
transparent governance is more central to
productive delivery of goods and services (for
inclusive development) because the pushes and
pulls of democracy demand more redundancies.
We can infer this from Chinese and Indian
experiments.
China is going to transition to some form of
pluralism in polity or eventually its progress on all
fronts will recede and there may even be regressive
steps. Progress to pluralism in polity is not certain
or inevitable, but that's the only path to continued
growth and progress in society. With pluralism
both in polity and economy, greater levels of and
sensitivities to inclusiveness and accountability will
be organic outcomes.
Editorial From Dr. Gurumurthy Kalyanaram
Dr. Gurumurthy Kalyanaram was appointed as Dean for Research at NMIMS University in December
2011. In this capacity, he leads and facilitates the research activities and efforts across schools of the
university. As the Dean for Research, Dr. Kalyanaram serves as the Editor of NMIMS Management Review.
For a profile of D. Kalyanaram, please visit: http://business.nmims.edu/dr-gurumurthy-kalyanaram
8ISSN: 0971-1023NMIMS Management ReviewVolume XXII October - November 2012
1Franklin Carter is the corresponding author. He can be reached at [email protected]
Is Advertising Effective or Not?Evidence from the Pharmaceutical Market
Dana Costea, Indiana University South Bend
Franklin Carter, Pennsylvania State University
Shin-Yi Chou, Lehigh University
Art King, Lehigh University
1
Abstract
In this paper, we study the effect of direct
advertising to consumers in pharmaceutical drugs.
This is an empirical study. We conclude that DTCA
has a greater effect on market expansion, whereas
the use of contacts and detailing could lead to
“business stealing.” That is, an increase in the
number of contacts that a pharmaceutical
company's representative has will create an
increase in the market share for that company's
drug, to the detriment of other drugs in the same
therapeutic class. Our results also support the
conclusions of the theoretical models and of the
other empirical research that these two types of
advertising have different effects on a drug's
performance on the market: Direct-to-consumer
advertising serves an informative role, and the use
of contacts serves a persuasive role.
Direct-to-consumer advertising (DTCA),
Pharmaceutical drugs, Physician detailing
Keywords:
9ISSN: 0971-1023NMIMS Management ReviewVolume XXII October - November 2012

10Is Advertising Good or Bad?
Evidence from the Pharmaceutical Market
Advertising has long been a controversial subject in
the economic literature: In addition to its
educational role—to inform consumers about new
products and their attributes—advertising is also
believed to lead to an increased demand for goods
and services, sometimes at the risk of inducing
unnecessary expenses for consumers. There is an
ongoing debate about whether the predominant
role of advertising is persuasive or informative.
Of particular interest amid the advertising debate is
the marketing of pharmaceutical products. The
pharmaceutical market is different from other
markets in that the decision maker (i.e., the one who
decides whether a product is needed) is not the
purchaser; health care professionals recommend a
drug, and patients must follow through with the
purchase of the drug and the recommended course
of treatment. Advertising in the pharmaceutical
market is either physician oriented or direct-to-
consumer, depending on the target of the ads.
Physician-oriented advertising, which represents
the core of pharmaceutical advertising, consists of
sales visits to doctors’ offices; distribution of free
samples; advertising in industry journals; and
promotional spending on meetings, conferences,
and other events where pharmaceutical companies
promote their products. Direct-to- consumer
advertising (DTCA), a newer approach by drug
manufacturers, consists of ads on television, radio,
or billboards; in magazines; and in other media
directed toward a general audience. The
pharmaceutical industry relies heavily on
advertising, with marketing expenses varying
between 20 and 30 percent of sales and sometimes
exceeding expenditures on research and
development (R&D). Although traditionally
2
physician-oriented advertising has been the most
widely used form of drug advertising, during the
past decade DTCA has become increasingly
important.
Direct-to-consumer advertising gained a significant
role in the promotional mix for pharmaceutical
companies after 1997 when the Food and Drug
Administration (FDA) released new, tentative
guidelines for the use of TV and other media to
promote drugs directly to patients. The original
guidelines, imposed in 1985, required all print ads
to include an in-depth “brief summary” of the risks
and side effects of advertised drugs, whereas
broadcast ads were required to include a “major
statement” of risks. Both types of ads were required
to provide adequate information so that viewers
could obtain full FDA-approved prescribing facts.
Based on these requirements, two types of ads were
most prevalent: (a) one that would alert consumers
to the existence of certain symptoms and suggest
that they consult a physician about the treatment of
those symptoms without actually mentioning the
name of a drug, and (b) one that reminded
consumers about the existence of a drug brand
without mentioning the associated conditions. The
new guidelines released in 1997 eased the
requirements for print and broadcast ads by
requiring only the inclusion of a concise summary of
risks and related information, by specifying more
sources for complete information (like a toll-free
number or an internet web address), and by
mentioning that physicians and pharmacists were
able to provide more detailed information. The
1997 DTCA tentative guidelines became final in
1999.3
2
3
See for example, Leffler (1981), Hurwitz and Caves (1988), Rizzo (1999), Ackerberg (2001 and 2003),and Manchanda and Chintagunta (2004)www.fda.gov/cder/guidance/1804fnl.htm
ISSN: 0971-1023NMIMS Management ReviewVolume XXII October - November 2012

11Is Advertising Good or Bad?
Evidence from the Pharmaceutical Market
From 1997 to 2006, pharmaceutical companies’
spending on DTCA increased almost 20 percent
each year, reaching a value of over $4.8 billion in
2006. Over the same period, their spending on drug
advertising through other traditional promotional
channels (i.e., direct promotion to physicians)
increased by only 9 percent annually. Spending on
research and development also increased at a rate of
9 percent annually. Despite the fast growth in DTCA
expenditures, the costs incurred by promoting
drugs directly to physicians ($7.2 billion) remained
the largest part of advertising expenditures in 2006.
In this paper, we focus on the effect of different
forms of advertising on a drug’s market share within
its therapeutic class and on the size of the market for
that particular class. Using sales and advertising
data about drugs in four therapeutic classes, we
answer the question of whether advertising leads to
market expansion (i.e., the size of the market
increases altogether) or to “business stealing”
between different competitors in the same
therapeutic class. The remainder of the paper is
organized as follows: In section 2, we provide a brief
review of the related literature; in section 3, we
present the data that we used in our empirical
estimation. In section 4, we describe the empirical
model and the identification strategy. In section 5,
we discuss the model estimates and in section 6, we
provide concluding comments on our research
results.
4
4IMS Health Inc., “Total U.S. Promotional Spend by Type, 2006,” http://www.imshealth.com
II. Related Literature
2.1 Theoretical Comments on the Economics of
Advertising
The role of advertising in an economic market, both
on a firm's performance and on consumers' utility
and their welfare, has been the subject of many
economic and industrial organization papers.
Stigler (1961) and Grossman and Shapiro (1984)
developed theoretical models in which they
analyzed the informative role of advertising,
defined as the use of advertising to send potential
consumers information about existing products and
their characteristics. Unlike Stigler (1961) and
Grossman and Shapiro (1984), Nelson (1974) and
Milgrom and Roberts (1986) constructed
theoretical models in which firms used advertising
to inform potential consumers about the
unobserved characteristics of their products (e.g.,
higher quality). In these types of models, the
purported higher-quality products were advertised
more often, and the advertisements were viewed as
a signal that the products advertised were of higher
quality.
When considering the effects of advertising on
consumers' utility function and implicitly on their
consumption and welfare, Becker and Murphy
(1993) proposed a theoretical model that suggests
that consumers believe they are increasing their
utility by consuming goods that are advertised and
that the prestige consumers experience from using
more advertised goods increases their sense of their
own welfare.
The foundation for the economics of advertising
was laid in a paper by Dorfman and Steiner (1954),
which showed that for a monopolist facing a
ISSN: 0971-1023NMIMS Management ReviewVolume XXII October - November 2012
12Is Advertising Good or Bad?
Evidence from the Pharmaceutical Market
downward sloping demand curve, the optimal
“amount” of advertising is achieved when the ratio
of advertising expenditure to dollar sales is equal to
the ratio of advertising elasticity to price elasticity.
But Dorfman and Steiner's theory fails to account
for one important aspect of advertising activity:
Advertising is dynamic, and its effects last for more
than one period. This characteristic of advertising is
not part of their optimality condition, and that is
why many authors have tried to adapt the theorem
to a more realistic setting. Currently, the most
predominant form of market structure is oligopoly,
characterized by having a few firms produce goods
that are similar but not identical; each participant in
the market, therefore, must consider the actions of
the other players in the market. Realizing the
importance of non-price instruments like
advertising, quality, or R&D strategies in
differentiating products and in determining market
structure, Roberts and Samuelson (1988)
incorporated advertising in their competition
model, which analyzed the U.S. cigarette industry.
Their dynamic model of non-price competition
allows advertising activity to affect both the firm's
market share and the total size of the market for
high-tar and low-tar cigarettes in the U.S. from 1971
to 1982. The conclusions of their study show that
advertising mainly affects market demand and that
if a firm's advertising affects another firm's market
share, that effect is seen through variations in the
number of brands sold.
Articles in the economic and medical literature have
examined various aspects of the impact of
advertising on drugs' prices, individual market
share, or total market size for a drug/therapeutic
class. In one of the earliest studies by Berndt et al.
(1995), the authors used data on anti-ulcer drugs
2.2 Related Empirical Literature on Drug
Advertising
from 1977 to 1994 to conclude that indeed
advertising positively affects pharmaceutical sales
and, from the advertising forms analyzed, detailing
has the biggest influence, followed by journal pages
and direct-to-consumer advertising. Iizuka (2004)
examined the factors that affect DTCA and
concluded that newer, high-quality drugs and ones
that are directed toward under-treated diseases are
more often advertised. The author also emphasized
the market expanding effect of DTCA. Findlay
(2002) found solid evidence that advertising is an
important factor in increasing drug sales to
consumers. Using data on DTCA spending and
prescription drug retail sales from 1999 to 2000, the
author found that sales of the most advertised drugs
increased at a rate of 2.3 times the increase in sales
for other drugs. Ling et al. (2002) examined the
effect of DTCA in the prescription drug market and
also in the over-the-counter (OTC) market for anti-
ulcer drugs and found some small spill over effects
of DTCA for prescription drugs on same-brand OTC
versions of the drugs. Rizzo (1999) studied the
effect of advertising on the price elasticity of
demand for the name-brand antihypertensive drug
market in the United States. The author found
strong evidence that detailing efforts would lower
the price sensitivity, implying that consumers end
up paying more because of advertising. Gonul et al.
(2001) found that the use of detailing and free
samples increase price sensitivity, where price was
measured as the average retail price for the drug.
Brekke (2006) analyzed the effect of DTCA in the
drug market, especially the interaction between
consumer-oriented and physician-oriented
advertising and concluded that allowing DTCA in
the pharmaceutical market would increase
detailing and prices. The author also emphasized
the market-expanding nature of DTCA and the
business-stealing nature of detailing. Calfee et al.
ISSN: 0971-1023NMIMS Management ReviewVolume XXII October - November 2012

13Is Advertising Good or Bad?
Evidence from the Pharmaceutical Market
(2002) used data from 1995 to 2000 on cholesterol-
reducing drugs to investigate the relationship
between advertising and the market demand for
that class, and they found that in the short run,
advertising does not directly cause an increase in
total market demand or in individual firms' market
shares. Using a dataset with advertising
information about drugs from five therapeutic
classes (i.e., antidepressants, proton-pump
inhibitors, antihistamines, cholesterol-reducing
drugs, and nasal sprays), Rosenthal et al. (2003)
examined the relationship between advertising and
market size. The authors found that DTCA primarily
induced an increase of the entire market size for a
specific therapeutic class but not for each particular
drug. The same conclusion was reached by another
study of the effect of DTCA on market size
(Wosinska, 2001). The author used a dataset
containing prescription drugs' claim data for
cholesterol-reducing drugs in the Blue Shield of
California plans and found that DTCA caused an
increase in the total size of the market, but it did not
always positively influence the market share for an
individual drug. Parker and Pettijohn (2003)
concluded that DTCA was likely to increase the
request for different drugs in the same therapeutic
category and also for an advertised drug. In
addition, they found that once a patient required a
drug, the likelihood that the physician would
prescribe that drug also increased. Hurwitz and
Caves (1988) analyzed the effect of generic entry on
an off-patent drug's market share and also on the
ad-to-sales ratio for the incumbent. The authors
concluded that the leader's market share would
increase with the increase in its own advertising
expenditure and would decrease with the entrant's
marketing efforts. See also Kalyanaram (2009) and
Kalyanaram and Phelan (2011) for additional
discussions of the DTCA effect.
As we can see from the economic theory and also
from the work of previous researchers, DTCA will
lead to an increase in the size of the market for a
specific drug's therapeutic class and also could
cause an increase in the market share of an
advertised drug. Our paper follows the work of
Rosenthal et al. (2003), and using a different
dataset, we will show whether the most
predominant role of DTCA is to expand the overall
market for a therapeutic class or to steal market
share from other similar drugs with the class.
III. Data and Descriptive Statistics
For our analysis, we use a dataset that contains five
years (1995-1999) of detailed information about
the advertising activity for drugs in four therapeutic
classes: gastrointestinal, cardiovascular, cholesterol
reducing, and psychotherapeutic. The dataset
provides information not only about all brand-name
prescription drugs but also about all of their OTC,
generic versions. The four therapeutic classes
comprise a total of 3,796 drugs: 1,315
psychotherapeutic drugs, 561 gastrointestinal
drugs, 1,766 cardiovascular drugs, and 154
cholesterol-reducing drugs. The data set includes
multiple versions of the generic and OTC drugs,
depending on the manufacturer and the launch
date. In some cases, there are more than 20 versions
of the same generic drug, as is the case with
Gemfibrozil, a drug from the cholesterol-reducing
therapeutic class that is used to lower lipid levels
and has 30 generic versions manufactured by
different companies. For all drugs, IMS collected
data on a number of sales and advertising measures
including (a) total dollars; (b) total units sold; (c)
contacts; (d) cost of contacts; (e) samples; (f) ads;
5
5The dataset that we use is called Dataview and is provided by IMS America, a firm specializing in collecting phar maceutical data.
ISSN: 0971-1023NMIMS Management ReviewVolume XXII October - November 2012

14Is Advertising Good or Bad?
Evidence from the Pharmaceutical Market
(g) cost of ads; (h) total promotion dollars; (i)
number of dispensed new, refilled, and total
prescriptions; and (j) average cost of prescriptions
in the retail sector. The descriptive statistics of some
of these measures, presented by therapeutic class
and year, are presented in Table 1. We note that sales
for drugs in the psychotherapeutic category more
than doubled, from approximately $6 billion in 1995
to more than $13 billion in 1999. This is the biggest
increase in sales among the four therapeutic
categories. For the five years combined,
cardiovascular drugs achieved the greatest sales in
dollars and in units sold. (Figure 1 shows the
evolution of dollar sales from 1995 to 1999 by
therapeutic class). Cardiovascular drugs are also the
ones with biggest value of the total promotional
dollars and for each individual marketing variable,
such as contacts, samples and ads. Among
cardiovascular drugs, Norvasc was the leader in
sales, with a combined value of nearly $4.5 billion.
Prozac was the leader in the psychotherapeutic
class, reaching approximately $9.6 billion dollars in
sales. Among cholesterol-reducing drugs, Zocor had
the biggest sales (approximately $6 billion), and
among gastrointestinal drugs, Prilosec was the sales
leader (approximately $11 billion). Tables 2-3
present detailed information about the top three
best-selling drugs in each therapeutic class. For
each drug, we present aggregate data for all five
years of our study, including total dollar sales
(Tdollars), total units sold (Tunits), total number of
contacts (Tcontacts), total number of samples left at
the doctors’ offices (Tsamples), total number of ads
in the media (Tads), and total promotional
expenditures (Tpromotion).
More descriptive statistics are presented in Table 4.
Of the 3,796 drugs, 1,230 had no dollar sales
registered; therefore, we eliminated those
observations. (We would have to construct a
measure of market share based on total sales for
each individual drug, and without sales data, that
would be impossible.) The remaining sample of
2,566 drugs contains 881 psychotherapeutic drugs,
362 gastrointestinal drugs, 1,199 cardiovascular
drugs, and 124 cholesterol-reducing drugs. From
these drugs, only 440 have promotional
expenditures registered, and only 230 have DTCA
spending in the five years comprised in our dataset.
To estimate the influence of advertising on a drug's
performance in the market, we study the effect of
promotional expenditure (i.e., the use of DTCA and
of contacts and samples) on total sales for a
therapeutic class (measured in dollars and units).
We also study the effect of DTCA and detailing on a
drug's performance as measured by its market
share within its therapeutic class.
Cobb Douglas demand functions are used to
estimate the size of the market for a specific
therapeutic class and to determine the market share
for an individual drug. The market-size model has
the following general form:
IV. The Empirical Model
where q represents the total size of the market for
therapeutic class j in a given quarter t, DTCA
represents direct-to-consumer advertising
expenditures, Contacts represents the cost of
contacts, and Xj represents other independent
variables.
ISSN: 0971-1023NMIMS Management ReviewVolume XXII October - November 2012

15Is Advertising Good or Bad?
Evidence from the Pharmaceutical Market
The market share for a specific drug follows the
following form:
We constructed the market-share variables as a
ratio of total sales for a drug (i) from a therapeutic
class (j) in a quarter (t), divided by total sales of all
drugs in the same therapeutic category as our drug
in that quarter. We will use different measures of
sales, either dollar value or units sold.
The advertising measure DTCA represents the total
value of the ads featured for a drug in a given
quarter. Detailing represents the total value of
contacts with physicians. We also estimate the
model using the number of ads as a measure of
DTCA. In this case, Detailing includes not only the
total number of contacts but also the total number
of free samples left at doctors' offices.
For an individual drug's market share, we also
estimate a log model that has log of market share
divided by (1-market share) as a dependent
variable. We estimate this model with and without
the price measure included in the equation.
where,
P i j
t P
X s
ijt
i
represents the price of drug from class in
quarter , and represents the average price of all
drugs in therapeutic class j in a given quarter t.
We use two different measures of price: average
price per prescription—retail and average price per
prescription—pharmacy. The first one represents
how much the consumer pays, and the pharmacy
price represents how much the pharmacy pays.
The other covariates used in all models, the , are
year and quarter dummies, class dummies, and the
interaction of these terms.
V. Estimation Results
The estimation results are presented in Tables 5 -11.
Table 5 present the estimates for the class DTCA
effect on the total size of the market for a specific
therapeutic category. Specifically, Table 5 shows the
coefficients for the regressions when the market
size is expressed in total dollars sold. For each
model, we present multiple specifications
depending on what dummy variables (and
interactions) are included. In addition, for all the
specifications we present the random effects
estimates and the fixed effects ones. As evident from
the tables, the DTCA elasticities are between 0.004
and 0.123, suggesting that a 10 percent increase in
DTCA expenditures could lead to an increase in
market size between .04 and 1.23 percent. The
coefficients are bigger for cases in which we express
the size of the market in terms of total units sold.
Our results are of the same magnitude as those of
Rosenthal et al. (2003), who found that a 10 percent
increase in DTCA spending would result in
approximately a 1 percent increase in sales, other
variables remaining equal. The elasticity of
detailing, represented in our case by the number of
dollars spent on physicians' contacts, suggests that
ISSN: 0971-1023NMIMS Management ReviewVolume XXII October - November 2012

16Is Advertising Good or Bad?
Evidence from the Pharmaceutical Market
a 10 percent increase in detailing expenses could
lead to an increase in class market size of up to 8
percent. In particular, when market size is
expressed in total units sold and the interaction
terms between class dummies and quarter
dummies are not included in the regression, and
when the coefficient of detailing is negative and
significant, we can infer that in fact, detailing could
lower the total class market size. Tables 6 and 7
present the coefficients for the models when the
advertising activity is expressed in terms of the
number of (a) ads, (b) contacts with the physicians,
and (c) free samples. The coefficients for DTCA
activity range between 0.032 and 0.110, indicating
once again that a 10 percent increase in the number
of ads will increase the total size of a market for a
therapeutic class by approximately 1 percent. The
coefficients for contacts and number of samples are
also statistically significant, sometimes positive and
sometimes negative.
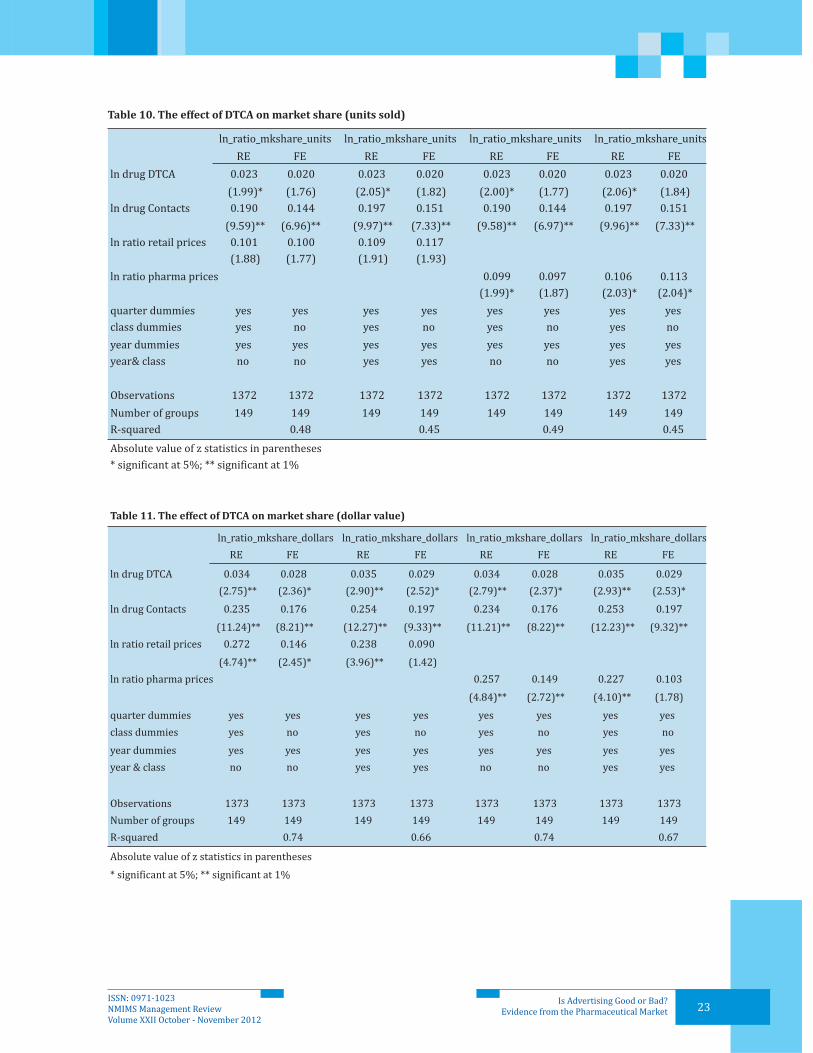
Beginning with Table 8, we present estimates for an
individual drug's performance. The market share is
expressed in dollars (Tables 8 and 11) or units sold
(Tables 9 and 10). The coefficients for DTCA are
positive, significant, and of a magnitude lower than
those from the class market size models; therefore,
we can conclude that DTCA has a greater market-
expanding effect than a business-stealing effect. In
other words, DTCA has a greater effect on overall
market expansion for a therapeutic category than it
does on the expansion of one drug in a therapeutic
category at the expense of another drug in that same
category. The detailing coefficients are positive and
significant, and the coefficients on drug prices are
significant and of the right sign only in a few
specifications, indicating that in fact, the price
measures that we have are not a perfect proxy for
the actual prices that consumers pay for the drugs.
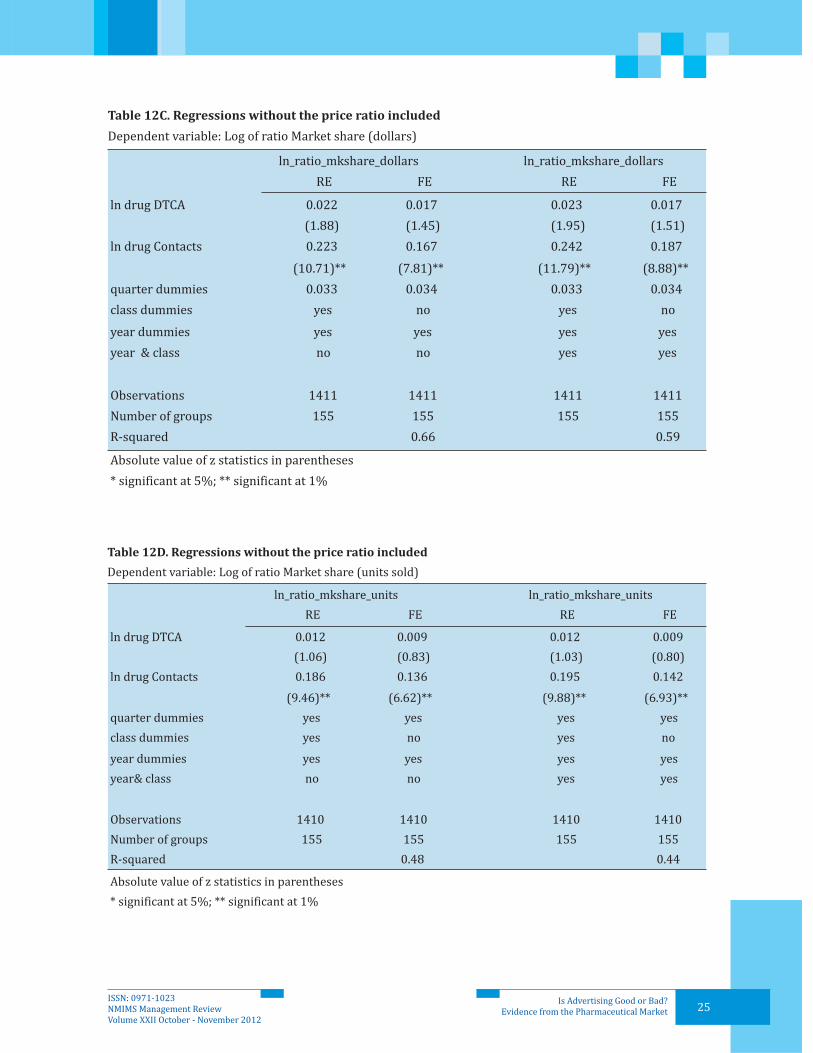
Tables 12 shows the estimates from the regressions
in which price measures were not included. For the
models with market share as the dependent
variable, the coefficients of the DTCA variable are
positive, significant, and of the same magnitude as
in the previous models. The detailing activity
estimates also are positive and significant.
In this paper, we have analyzed the influence of
different types of advertising on a drug's
performance on the market. Due to the specific
characteristics of the pharmaceutical market,
wherein the final consumer-purchaser (i.e., the
patient) is not the one who decides whether a drug
is needed (i.e., the health care professional is the
decider), advertising activity is targeted both
toward patients through direct-to-consumer
advertising and physicians through detailing and
contacts. Using a dataset containing advertising and
sales information about all the drugs in four
therapeutic classes for a period of four years (1995
to 1999), we have evaluated the different effects of
DTCA and contacts on a drug's market share and on
the total size of the market for an entire therapeutic
class. The empirical results show that DTCA has the
primary effect of increasing the total size of the
market for a therapeutic class and has a small effect
on the individual market share for a specific drug. If
we examine the individual market share estimates,
however, Contacts coefficients are always of greater
magnitude than DTCA coefficients, suggesting that
the Contacts coefficient has more influence in
determining the market share of a specific drug
within a therapeutic class.
We conclude, therefore, that DTCA has a greater
effect on market expansion, whereas the use of
contacts and detailing could lead to “business
VI. Summary and Conclusions
ISSN: 0971-1023NMIMS Management ReviewVolume XXII October - November 2012

17Is Advertising Good or Bad?
Evidence from the Pharmaceutical Market
stealing.” That is, an increase in the number of
contacts that a pharmaceutical company's
representative has will create an increase in the
market share for that company's drug, to the
detriment of other drugs in the same therapeutic
class. Our results also support the conclusions of the
theoretical models and of the other empirical
research that these two types of advertising have
different effects on a drug's performance on the
market: Direct-to-consumer advertising serves an
informative role, and the use of contacts serves a
persuasive role.
Figure 1 Total dollar sales (Thousands)
ISSN: 0971-1023NMIMS Management ReviewVolume XXII October - November 2012

18Is Advertising Good or Bad?
Evidence from the Pharmaceutical Market
ISSN: 0971-1023NMIMS Management ReviewVolume XXII October - November 2012

19Is Advertising Good or Bad?
Evidence from the Pharmaceutical Market
ISSN: 0971-1023NMIMS Management ReviewVolume XXII October - November 2012

20Is Advertising Good or Bad?
Evidence from the Pharmaceutical Market
ISSN: 0971-1023NMIMS Management ReviewVolume XXII October - November 2012

21Is Advertising Good or Bad?
Evidence from the Pharmaceutical Market
ISSN: 0971-1023NMIMS Management ReviewVolume XXII October - November 2012

22Is Advertising Good or Bad?
Evidence from the Pharmaceutical Market
ISSN: 0971-1023NMIMS Management ReviewVolume XXII October - November 2012
23Is Advertising Good or Bad?
Evidence from the Pharmaceutical Market
ISSN: 0971-1023NMIMS Management ReviewVolume XXII October - November 2012

24Is Advertising Good or Bad?
Evidence from the Pharmaceutical Market
ISSN: 0971-1023NMIMS Management ReviewVolume XXII October - November 2012
25Is Advertising Good or Bad?
Evidence from the Pharmaceutical Market
ISSN: 0971-1023NMIMS Management ReviewVolume XXII October - November 2012

26
References
• Ackerberg Daniel (2001), “Empirically Distinguishing Informative and Prestige Effects of Advertising,” The
RAND Journal of Economics, vol. 32, no. 2, pp. 316-333.
Ackerberg Daniel (2003), “Advertising, Learning and Consumer Choice in Experience Good Markets: An
Empirical Examination,” International Economic Review, vol. 44, no. 3, pp. 1007-1040.
Becker, Gary and K. Murphy (1993), “A Simple Theory of Advertising as Good or Bad,” The Quarterly Journal
of Economics, vol. 108, no. 4, pp. 941-964.
Berndt, E.R., L. Bui, D.R. Reiley, and G. L. Urban (1995), “Information, Marketing, and Pricing in the U.S.
Antiulcer Drug Market,” American Economic Review, vol. 85, no. 2, pp. 100–105.
Brekke, Kurt and Michael Kuhn (2006), “Direct to Consumer Advertising in Pharmaceutical Markets,”
Journal of Health Economics, vol. 26, pp. 102-130.
Calfee, J., et al. (2002), “Direct-to-consumer Advertising and the Demand for Cholesterol Reducing Drugs,”
Journal of Law and Economics, vol. 55, pp. 673-690.
Dorfman, R and Peter O. Steiner (1954), “Optimal Advertising and Optimal Quality,” The American
Economic Review, vol. 44, no. 5, pp. 826-836.
Findlay, Steven (2002), “Do Ads Really Drive the Pharmaceutical Sales?” Marketing Health Services, vol. 22,
issue 1, pp. 20.
Gonul, Fusun, Franklin Carter, Elina Petrova and Kannan Srinivasan (2001), “Promotion of Prescription
Drugs and Its Impact on Physician Choice Behavior,” Journal of Marketing, vol. 65, no.3, pp. 79-90.
Grossman, Gene and C. Shapiro (1984), “Informative Advertising with Differentiated Products,” The
Review of Economic Studies, vol. 51, pp. 63-81.
Hurwitz, Mark and R. Caves (1988), “Persuasion or Information? Promotion and the Shares of Brand Name
and Generic Pharmaceuticals,” Journal of Law and Economics, vol. 31, no. 2, pp. 299-320.
Iizuka, Toshiaki (2004), “What Explains the Use of Direct to Consumer Advertising of Prescription Drugs,”
Journal of Industrial Economics, vol. 52, no. 3, pp. 349 –379.
Kalyanaram, Gurumurthy, “The endogenous modeling of the effect of direct advertising to consumers
(DTCA) in prescription drugs” International Journal of Pharmaceutical and Healthcare Marketing, Volume
3 No. 2, 2009, 137-148.
Kalyanaram, Gurumurthy and John Phelan, “Effects of Direct-to-Consumer Advertising of Prescription
Drugs on Prices,” The Journal of Business and Economic Studies, Vol. 17, No. 2, Fall 2011, 67-77.
Leffler, Keith (1981), “Persuasion or Information? The Economics of Prescription Drug Advertising,”
•
•
•
•
•
•
•
•
•
•
•
•
•
•
Is Advertising Good or Bad?Evidence from the Pharmaceutical Market
ISSN: 0971-1023NMIMS Management ReviewVolume XXII October - November 2012

27Is Advertising Good or Bad?
Evidence from the Pharmaceutical Market
ISSN: 0971-1023NMIMS Management ReviewVolume XXII October - November 2012
Journal of Law and Economics, vol. 24, no. 1, pp. 45-74.
Ling, D., Ernst Berndt and Margaret Kyle (2002), “Deregulating Direct-to-Consumer Marketing of
Prescription Drugs: Effects on Prescription and Over-the-Counter Product Sales,” Journal of Law and
Economics, vol. 45.
Milgrom, Paul and J. Roberts (1986), “Price and Advertising Signals of Product Quality,” Journal of Political
Economy, vol. 94, pp. 798-821.
Nelson, Philip (1974), “Advertising as Information,” Journal of Political Economy, vol. 82, pp. 729-753.
Parker, S. and Charles Pettijohn (2003), “Ethical Considerations in the Use of Direct-To-Consumer
Advertising and Pharmaceutical Promotions: The Impact on Pharmaceutical Sales and Physicians,”
Journal of Business Ethics, vol. 48, pp. 279–290.
Rizzo, John (1999), “Advertising and Competition in the Ethical Pharmaceutical Industry: The Case of
Antihypertensive Drugs,” Journal of Law and Economics, vol. 42, no.1, pp. 89-116.
Roberts, M. and Larry Samuelson (1988), “An Empirical Analysis of Dynamic, Nonprice Competition in an
Oligopolistic Industry,” The RAND Journal of Economics, vol. 19, no. 2, pp. 200-220.
Rosenthal, M. et al. (2003), “Demand Effects of Recent Changes in Prescription Drug Promotion,” Forum for
Health Economics and Policy, vol. 6, pp. 1044.
Stigler, Garry (1961), “The Economics of Information,” Journal of Political Economy, vol. 71, pp. 213-225.
U.S. Department of Health and Human Services, F.D.A. Center for Drug Evaluation and Research (2004),
“Patient and Physician Attitudes and Behaviors Associated With DTC Promotion of Prescription Drugs —
Summary of FDA Survey Research Results.”
U.S. Government Accountability Office (2006), “Prescription Drugs: Improvements Needed in FDA's
Oversight of Direct-to-Consumer Advertising.”
Wosinska, Marta (2001), “The Effects of Direct-to-Consumer Drug Advertising on Prescription Choice,”
working paper, University of California, Berkeley.
•
•
•
•
•
•
•
•
•
•
•

28Is Advertising Good or Bad?
Evidence from the Pharmaceutical Market
ISSN: 0971-1023NMIMS Management ReviewVolume XXII October - November 2012
Franklin J. Carter, Jr. is the William A. Donan Clinical Professor of Marketing at Pennsylvania State
University. Prior to his appointment at Penn State, he was the James T. Kane Faculty Fellow and Assistant
Professor of Marketing at Lehigh University, Assistant Professor of Pharmaceutical Marketing at Saint
Josephs University and Assistant Professor of Marketing at University of Illinois. His research has been
published in the Journal of Marketing, the International Journal of Pharmaceutical and Healthcare
Marketing, the Journal of Personal Selling and Sales Management, AMA Proceedings, Information and
Management: An International Journal of Information Technology and the Journal of Healthcare
Management Science.
Shin-Yi Chou, Ph.D., holds the Frank L. Magee Distinguished Professorship. She is part of the Department of
Economics at Lehigh University and is a Research Associate at the National Bureau of Economic Research.
Her research areas are health economics and applied econometrics. Portions of her work have been
published in the Journal of Health Economics, Rand Journal of Economics, Review of Economics and
Statistics, Health Economics, Journal of Public Economics and Journal of Applied Econometrics.
Dana Costea is an Assistant Professor of Economics at Indiana University South Bend School of Business
and Economics. She is a member of the American Economic Association, American Public Health
Association and Eastern Economic Association. Her main field of research is health economics
Arthur King has been on the faculty of Lehigh University (Bethlehem, PA) since 1976. He established
Lehigh in the Prague summer program in 1994 and continues to direct it annually. He serves as a Board
member for the Visiting Nurse Association of St. Luke's Health Care System (Bethlehem, PA) and on the
Scientific Committee of the International Health Economics Association (iHEA).

29ISSN: 0971-1023NMIMS Management ReviewVolume XXII October - November 2012
A Multi Objective and Multi ConstraintApproach to the Investment and Financingof a Multinational Enterprise: A Synthesis
Augustine C. Arize
Krishna M. Kasibhatla
John Malindretos
Brian Maruffi
Moschos Scoullis
1
Abstract
In this paper, we study the investment decisions of
Multinational enterprises (MNEs). MNEs have
several additional objectives and rules of operation.
This is because MNEs have to satisfy all of the
following entities and conditions in addition to
fulfilling all of the goals of domestic companies.
First, they have to obey any restrictions foreign
governments impose upon them, including
expropriation itself. Additionally, they have to watch
global tax rates and attempt to mitigate their tax
bills. Third, they have to disallow themselves from
borrowing too much. Fourth, they have to have a
certain remission rate from both the subsidiaries
and the parent company. Further, they have to
consider the exchange rates between the currencies
where their subsidiaries operate and that of the
parent country.
Multinational enterprises (MNEs),
investment decision, optimization
Keywords:
1John Malindretos is the corresponding author.
He can be reached at [email protected].

30ISSN: 0971-1023NMIMS Management ReviewVolume XXII October - November 2012
A Multi Objective and Multi Constraint Approach to the Investmentand Financing of a Multinational Enterprise: A Synthesis
I. Introduction
The goals which domestic firms may pursue may
not be the ones which multinational enterprises
(MNEs) follow. The goals of profit and/or wealth
maximization which a few theorists propose have
come under attack over the years by several others.
Those with contending views have offered goals
which compete with those of profit and wealth
maximization. In our study, we do not discard these
goals but merely supplement them with a few other
objectives for which some evidence is given that
holds true at times. We basically propose that a firm
does not have a single goal, but rather several
interrelated ones working together. Thus, a firm
may be trying to both maximize profit and share
price to satisfy stockholders as well as minimize the
cost of capital while also trying to increase sales and
still behave altruistically.
Compared to domestic firms, MNEs have several
additional objectives and rules of operation. This is
because MNEs have to satisfy all of the following
entities and conditions in addition to fulfilling all of
the goals of domestic companies. First, they have to
obey any restrictions foreign governments impose
upon them, including expropriation itself.
Additionally, they have to watch global tax rates and
attempt to mitigate their tax bills. Third, they have
to disallow themselves from borrowing too much.
Fourth, they have to have a certain remission rate
from both the subsidiaries and the parent company.
Further, they have to consider the exchange rates
between the currencies where their subsidiaries
operate and that of the parent country.
This study examines the numerous objectives and
constraints which an MNE could face and develops a
model of international investment and financing in
a global context.
II. Literature Survey
A. Overall Survey On Goals of a Firm
These objectives are:
The theory of finance was developed in the last
century over a period of four to five decades. The
proponents of that theory, which we shall call
traditional finance (TF), are theorists such as Fama
and Miller (1972), Friedman, Markowitz (1952),
Lintner, Sharpe (1970), and others. They developed
a theory which has several presuppositions, namely
that:
1. Humans are rational, have immense (almost
perfect) knowledge, and can predict the future
in an unbiased way.
2. Top managers and owners have the same
wishes and motives.
3. The goal of a firm is a single one. A firm is
basically a domestic one.
4. Goals are unconstrained.
5. Humans are motivated by their own welfare.
They do not derive utility from others' welfare.
TF developed a few objectives based on the
aforementioned analysis.
1. The company attempts to maximize profit over
a pre-specified period of time.
2. Such aggregation leads to the maximization of
the company's share price.
3. The cost of capital is minimized while the above
two items are attained.
4. The firm maximizes the summation of the net
present value of all of its projects.
However, several proponents have objected that
there is a substantial lack of perfect information in
the real world (Simon, 1948). In addition, top
executives have different views and motives from

31ISSN: 0971-1023NMIMS Management ReviewVolume XXII October - November 2012
A Multi Objective and Multi Constraint Approach to the Investmentand Financing of a Multinational Enterprise: A Synthesis
business owners. As a result, there are two different
objectives that have been put forth. The first,
proposed by Simon (1948), says that top executives,
in the face of imperfect information, attempt to
satisfy owners with a certain profit for the firm.
This is called “profit satisficing”. Of course, owners
do not know that managers do not maximize profits,
since neither they nor top executives know the exact
amount of such profit maximization.
An alternative theory proposed by Baumol (1959)
states that top executives primarily want to raise
their own compensation. He argues that they
attempt to maximize sales, since executives of larger
companies tend to accrue bigger pay and benefits
packages.
The motivation of pure self interest by humans has
also been questioned by several economists
(Vernon Smith, 1976). These theorists give evidence
that human beings derive pleasure from other
people deriving satisfaction from certain economic
activities.
To formulate this attitude, we can state that if has a
higher income, then enjoys a having such higher
income and so derives a higher utility from it. If b is
a top manager and he/she has hiring authority, then
b will hire additional employees, since he/she will
derive a higher welfare. We can offer the theory that
as long as the marginal productivity of labour is
positive, he/she will hire people and will stop when
such productivity is zero.
Maximize Nt => N*
Furthermore, many economists put forth the fact
that there are numerous constraints in pursuing
business activity. These constraints should be
a
b
explicitly stated in an investment and financing
context. Finally, financiers propose that the true
model should be a multi-objective and multi-
constraint one.
In the following several pages, we want to explicitly
state the several objectives and constraints which a
firm may encounter as it pursues investment and
financing in a multinational context.
1. Maximization of Net Present Value
Boucher (1987) builds a corporate planning model
for capital investment and financing in the context
of foreign direct investment. This model has a single
objective of maximizing the sum of liquid assets (net
project cash flows) remaining after T years.
B. Detailed Literature Survey on Goals of a Firm
where:
= the net present value of post-T cash flows
from project p in country j.
= a selection variable (0,1) for project p of the
subsidiary in country j.
= the horizon lending position of the firm
(parent and subsidiaries).
= the horizon borrowing position of the firm.
= the time T present worth of post-T cash
flows from sources outside the project set in
subsidiary j.

32ISSN: 0971-1023NMIMS Management ReviewVolume XXII October - November 2012
Boucher argues that maximizing the net present
value of cash flows should be the goal for
multinational corporations (MNCs). We use the
firm's weighted average cost of capital by
discounting expected future cash flows to derive net
present value. If a firm maximizes the sum of the net
present value of cash flows of all individual
investment projects, given its financing structure,
the firm would maximize the net earnings after
taxes over the long run. In the short run, of course,
net earnings would not necessarily be maximized
because of the accrual basis of accounting, where
several benefits accrue to the firm over the long run.
In a survey in Financial Management (Stonehill,
1975) MNC managers have totally different
viewpoints concerning the above objective. Most
managers have more than one objective in a given
decision situation. Therefore, additional objectives
are necessary to supplement Boucher's model.
Since the structure of international business
operations has increased in complication, we need
multiple objective functions to satisfy the
requirements of MNCs' global strategies and
business operations.
This survey indicates that different MNC managers
have different priorities in mind. Some prefer
maximizing stockholders' equity, while some are
concerned about financial risk. Others want to take
advantage of the sources of financing, thus
minimizing the average cost of capital. Thus, we
develop a multi-objective linear model to
supplement Boucher's model.
Presently, companies are rigorously assessing the
extent to which functions and processes enhance
the value of the organization. Heightened economic
uncertainty naturally translates into higher levels of
B. Minimization of the Cost of Capital
financial market volatility. Hard economic times is
another key contributor to global volatility.
Consequently, more companies are examining their
exposures to currencies, interest rates, equities, and
commodities, to find out if they can manage the
above more efficiently (Chodi, Rudi and
Mieghem,2010).
Boucher discusses that real interest rate
differentials exist due to restrictions on borrowing,
concessionary loans and subsidies. He mentions
that the reduction of borrowing costs through the
evaluation of specific borrowing sources was
possible and concludes that other relevant
considerations in computing real interest rates are
devaluation and corporate income tax effects. We
address these concerns in our constraints.
Financing risk can be considerably reduced for
MNCs in comparison with domestic firms.
Multinationals have access to both international
and national debt and equity markets. Ceteris
Paribus, this added ability reduces their cost of
capital compared with domestic firms that are
restricted to raising funds from only one capital
market. In addition, when foreign exchange markets
are in disequilibrium, multinational firms have the
choice to finance in different currencies, some of
which may offer temporarily lower required rates of
return than would be justified by the law of interest
rate parity (Cunha and Paisana, 2010).
Exchange rate instability is one of the most difficult
and persistent problems with which the financial
executives of MNCs must cope. Profits and cash
flows can be impacted substantially negatively. On
the other hand, unexpected changes in foreign
exchange rates can create disequilibria, which can
lead to opportunities for increased profit.
A Multi Objective and Multi Constraint Approach to the Investmentand Financing of a Multinational Enterprise: A Synthesis

33ISSN: 0971-1023NMIMS Management ReviewVolume XXII October - November 2012
The aforementioned support Boucher's assumption
of capital market segmentation. A national capital
market is segmented if the required rate of return
on securities in that market differs from the
required rate of return on securities of comparable
expected return and risk that are traded on other
national securities markets.
On the other hand, if all capital markets are fully
integrated, securities of comparable expected
return and risk should have the same required rate
of return in each national market after adjusting for
foreign exchange risk and political risk (Domowitz,
Glen and Madhavan, 1997).
Market segmentation is a financial market
imperfection caused by investor attitudes and
government actions. First, investors are influenced
by financial risk, foreign exchange risk, political risk,
transaction costs and information barriers such as
the quality of corporate disclosure and familiarity
with securities markets and institutions. Second,
government constraints include: quotas on trade,
tax policies and controls on foreign exchange use,
restrictions on the free transfer of capital and
interference in the functioning of domestic
securities markets.
A firm's cost of capital is affected by the extent of
market segmentation. On the one hand, if a firm is
sourcing its capital in a fully segmented market, it is
likely to have a higher cost of capital than if it had
access to other capital markets. However, most
multinational corporations have access to other
capital markets, so a firm may be able to overcome
this constraint and lower its cost of capital.
On the other hand, the cost of capital of a firm with
access to fully integrated capital markets may be
lower because that cost may reflect a lower
international price of risk. If economic activities are
less than perfectly correlated among countries,
investors can improve their portfolio performance
by diversifying internationally. Adding foreign
securities to a domestic portfolio should reduce that
portfolio's systematic risk (Reeb, 2000). Therefore,
the required rate of return on internationally traded
securities should reflect their higher value to
internationally diversified portfolios rather than
just their value to investors in the country in which
the firm is located.
The following analyzes how market imperfection
and other foreign influences are theoretically likely
to affect a firm's cost of capital as well as project-
specific discount rates. Although the main concepts
used to analyze cost of capital in the domestic case
provide the foundation for the multinational case, it
is necessary to analyze the unique impact of foreign
risks and foreign institutional variables (Shapiro,
1978).
A comparison of nominal rates is insufficient in a
total analysis of costs. The reason is the cost
elements differ across countries and sources. Some
alternatives involve risk of exchange, whereas
others do not. Also, tax deductibility varies among
nations. Nominal interest rates can be meaningless
due to the diversity in different countries of
compensating balance requirements, commitment
fees, commissions and securities flotation costs.
However, the focus on the financing decision is also
very important. Whereas capital budgeting helps a
firm allocate its funds in the most efficient way, thus
maximizing operating earnings, the financing
decision determines how operating earnings will be
divided among creditors, stockholders, and the
income tax collector.
A Multi Objective and Multi Constraint Approach to the Investmentand Financing of a Multinational Enterprise: A Synthesis

34ISSN: 0971-1023NMIMS Management ReviewVolume XXII October - November 2012
Furthermore, capital budgeting itself requires the
measurement of a firm's weighted average cost of
capital. Thus, the investment decision and the
financing decision are inter-dependent (Wald,
1999).
A lot of work was done on deriving the appropriate
required rate of return, or the cost of capital. If the
cost of capital were minimized, the total value of the
firm's securities would be maximized, by definition.
Thus, maximizing the value of a firm's securities
becomes the “proper” financial objective as a result
of the need to minimize the cost of capital for capital
budgeting purposes for the parent company.
The cost of capital is generally defined as the
weighted average cost of capital (WACC). This WACC
approach assumes that projects of leveraged firms
are simultaneously financed with both debt and
equity. Therefore, the cost of capital is a weighted
average of the cost of debt and the cost of equity.
Minimizing the MNC's weighted average cost of
capital becomes the following:
where
= the risk-adjusted cost of equity.
= the before-tax cost of debt. If the monetary
market segmentation theory is not
considered, is simply the borrowing rate
or the interest rate. However, in a segmented
monetary marketplace, the factors affecting
the cost of debt would include exchange
rate, currency devaluation, or revaluation
effects.
= the marginal corporate tax rate.
E = the market value of the firm's equity.
b = the market value of the firm's debt.
V = the total market value of the firm's securities
(E + b).
The cost of equity for a multinational corporation
can be measured as the sum of the total dividend
payouts from all subsidiaries on a market value per-
share basis and the market price of a share of the
parent company stock at time t. It can be expressed
as (Kibet, 2010):
where
= the market value per share at time t-1 (the
beginning of the year).
N = the total number of shares outstanding.
g = the expected growth rate of dividends or
market price of a share of the parent
company's stock.
= the expected sum of dividends from all
subsidiaries.
A Multi Objective and Multi Constraint Approach to the Investmentand Financing of a Multinational Enterprise: A Synthesis

35ISSN: 0971-1023NMIMS Management ReviewVolume XXII October - November 2012
1-f) = the earnings retention rate.
= profit available from sources outside the
project analysis in country j during period t.
= the profit from project P of subsidiary j in
period t.
Deregulation of major international money and
capital markets has freed MNCs from the confines of
domestic markets. Increasingly, companies are
tapping investors worldwide to meet their funding
requirements. In addition, financial executives
today have a vast array of sophisticated and
complex arrangements from which to choose, all
designed to take advantage of investor preferences
and arbitrage opportunities in different markets.
Assume the optimal source (country) to obtain the
funding is i. The normal procedure for measuring
the cost of debt for a multinational firm requires a
forecast of interest rates, the exchange rates for
projects in different countries, the proportions of
various classes of debt the firm expects to use, and
the corporate income tax rate. The interest costs of
the different debt components and exchange rates
are then averaged according to their proportion in
the debt structure. The before-tax average, , is
then adjusted for corporate income taxes by
multiplying it by the expression (1 - ) to find the
weighted average after-tax cost of debt. Therefore,
for a multinational corporation can be expressed
as the following:
Kb
Kb
�c
where
= the loan from country i to subsidiary j at
time t-1.
= the interest rate at time t-1.
= the devaluation or revaluation ratio.
= the devaluation or revaluation ratio.
Assuming some of the capital would be used to fund
the subsidiary projects and the capital acquired
from source i to subsidiary j is negotiated in country
i's currency, the ratio
adjusts the local currency equivalent of the loan to
the amount of local currency required for
repayment at time t after any devaluations or
revaluations. is the exchange rate from
country i's currency to country j's currency at the
beginning of time t and at the end of time t.
Since the analysis is in U.S. dollars,
would convert the ratio to the U.S. dollar equivalent.
The ratio
=
adjusts the devaluation or revaluation in subsidiary
j's currency to the U.S. dollar.
is the exchange rate (local currency / U.S.
Dollars) existing at time t.
Developing a good system to evaluate currency
fluctuation and performance is vital for the
management of an MNC, but this challenge is
d i f f i c u l t a n d e ve r - c h a n g i n g u n d e r a ny
circumstances. The decrease in the rate of inflation
in the U.S. has also lessened companies' concern
with the distortions caused by historic cost
A Multi Objective and Multi Constraint Approach to the Investmentand Financing of a Multinational Enterprise: A Synthesis

36ISSN: 0971-1023NMIMS Management ReviewVolume XXII October - November 2012
accounting even though a portion of corporate
profits comes from countries with high rates of
inflation. When our analysis accounts for
corporations being taxed on their net income while
interest incurred is tax deductible, we find that the
firm's debt/equity mix does have an impact on its
stock price. In particular, the judicious use of debt
financing should increase share prices since it is no
longer possible for individual investors to duplicate
the results of corporate borrowing in the
international money markets through their own
actions.
The majority of finance theorists throughout the
world today profess that a firm's financial goal
should be to maximize the wealth of its
stockholders. Although not everyone agrees with
that objective (Simon, 2007), the goal of most MNCs
is to at least maximize the value of the home
company's stock. The market value of the common
stock for a leveraged firm is estimated as the
weighted dividend income plus the tax deduction
from leveraged debts b times the corporate tax rate
as the following:
3. Maximization of Market Value of the Common
Stock.
�c
where:
V(t) = the aggregate market value of the common
stock.
= the corporate income tax rate.
= the mean of the probability distribution of
their respective total earnings (and, of
course, their total dividends) each year.
= the after-tax discount rate used by the
market to evaluate a level annual income
stream of the sort generated by firms in
this risk class – the Fortune 500 companies
index. While some theorists argue that a
different index should be used for
multinational corporations since their
financing risks are lower than those of
domestic firms, others argue that most
Fortune 500 companies are MNCs
themselves. The index should have already
reflected and addressed these concerns,
and I personally agree with the latter
argument.
t = 1, 2, 3, …, n.
Then, the market value on a per-share basis is:
Therefore, we can rewrite the above formula as:
where N denotes the number of shares outstanding
for each firm.
3. Maximization of Shareholder Profits.
If the firm now decides, as before, to borrow an
amount at an interest rate from country i
in order to retire the fraction b/V(t) of its stock as a
strategy to take advantage of the international
monetary markets, the annual income available to
each of its remaining shares becomes:
A Multi Objective and Multi Constraint Approach to the Investmentand Financing of a Multinational Enterprise: A Synthesis

37ISSN: 0971-1023NMIMS Management ReviewVolume XXII October - November 2012
Thus, * (b + * ) per year must be paid
to creditors, leaving a total of [ - * (b + *
)] for stockholders. The interest payments are
tax-deductible for the corporation; however, it is
taxable as an income to the stockholder under
his/her tax rate, so that a net after-tax annual
income of [ - * (b + * ) (1 - )]
(1 - ) is provided.
3. Maximization of a Firm's Sales.
C. Review of the Literature on Constraints
Max. Summation of Pr*Q
Pr= price of the product or service.
Q=volume of the product or service
Diverse financiers have proposed numerous
constraints inter-temporally (Boucher, 1987).
These constraints include costs associated with
transfer pricing, managerial fees and royalties,
inter-subsidiary loans, and foreign dividend
remissions. However, since this paper has
secondary objective functions with additional
concerns, the minimum acceptable rate of return
and the debt / equity ratio constraints are added to
the original constraints functions.
In addition, Boucher assumes all subsidiaries are
wholly owned; the tax laws varied somewhat from
country to country and the appropriate set of
governing restrictions depends on which projects
were selected. This paper also discusses the joint
venture scenario and establishes a Joint venture
Fact to redistribute dividend payouts by basically
assuming that a joint venture partner has the
contractual right to retain a portion of the operating
profits. Therefore, the dividend payouts in a joint
venture should be constructed differently from
those of a wholly owned subsidiary. On the other
hand, there are no differences regarding the
Jjt
minimum acceptable rate of return for projects,
whether carried on either a wholly owned
subsidiary or in a joint venture.
1. Minimum Acceptable Rate of Return:
Most theorists support the idea that a key rationale
for the existence of multi-national firms is their
ability to take advantage of national and
international financial market imperfections
through a process called internalization (Dunning,
1988). This comparative advantage should
theoretically result in lower capital costs for an MNC
compared to domestic firms. This international
availability permits an MNC to maintain its desired
debt ratio, even when significant new funds must be
raised, and keep its marginal cost of capital constant
for considerable ranges of its capital budget.
The cost in this connection refers to the rate of
return which investments financed by either debt or
equity must earn in order to justify acquiring the
capital to undertake them. If they do not provide
that return (i.e., if their present values are negative),
then the firm's shareholders will have been made
worse off, with the main criterion for shareholder
welfare again being stock price and expressed as
follows:
The increase in the total market value of the firm,
(V(t)), which results from undertaking a new
investment must be at least as great as the dollar
amount of the funds raised for that investment,
(I). Since the market value of the common stock as
previously defined is:
A Multi Objective and Multi Constraint Approach to the Investmentand Financing of a Multinational Enterprise: A Synthesis

38ISSN: 0971-1023NMIMS Management ReviewVolume XXII October - November 2012
Applying (2’) into (1’), then
The factors over which the firm has control are its
anticipated earnings, , its debt, b, and the
investment expenditure, (I). The remaining items
are constant insofar as the investment is concerned.
From this expression, we can determine the
minimum acceptable rate of return on a project as a
function of the method chosen to finance it.
The above formula can be expressed as the
combination of the costs of equity and debt in
proportion to the relative weight of each in the
firm’s optimal long-term financial structure. Most
MNCs have fixed debt/equity ratios strategically
denoted as a constant K.
Dt
2. The Debt / Equity Ratio:
If it is further desired per management policy to set
an upper limit to the debt/ equity ratio in the MNC's
financing structure, this can be introduced as a
further constraint on the model's range of solutions.
Though the quantitative description of the MNCs'
structural characteristics may be thus changed,
depending on whether the critical debt/equity ratio
would be reached in a solution outcome of the
model that is not bounded in this respect, the
qualitative nature of the result would again remain
unaltered.
However, while the substitution of borrowed funds
for shareholders' capital should produce a favorable
effect on the price of a firm's (remaining) shares,
there is obviously a limit as to how far this argument
can be carried. At its extreme, it would suggest that
the corporation should keep issuing debt and
retiring more stock until there is but one share left,
which would then sell at a very high price. Apart
from the legal constraints the firm would eventually
confront in doing this – there are limits on how
much repurchasing of stock is permissible – there is
a more practical constraint which would take hold
much earlier: creditors would eventually refuse to
lend the firm any more money. The company would
not be able to make promises of annual interest
obligations with any degree of confidence and its
supply of debt would be shut off.
The institutional investors which provide the bulk
of MNCs' debt financing have developed a set of
formal and informal guidelines directing how much
debt firms in industries can stand in relation to their
equity capital. Not only do these guidelines place
limits on the amount of borrowing that can be done,
but average investors also begin to worry when a
firm approaches its generally accepted debt limit
and thus become less attracted to its shares because
they perceive themselves as being subject to
substantially increased risks of bankruptcy or
reorganization in the event of default.
Theoretically, when a firm borrows up to its debt
limit, the desired stock price will become less
attainable and the current share price is likely to fall
because of this additional borrowing. In reality, of
course, there is no one figure that can be agreed
upon by all concerned as the debt limit for a
particular firm. Instead of a specific number, some
range of possible debt levels would make more
sense as an indication of the maximum permissible
A Multi Objective and Multi Constraint Approach to the Investmentand Financing of a Multinational Enterprise: A Synthesis
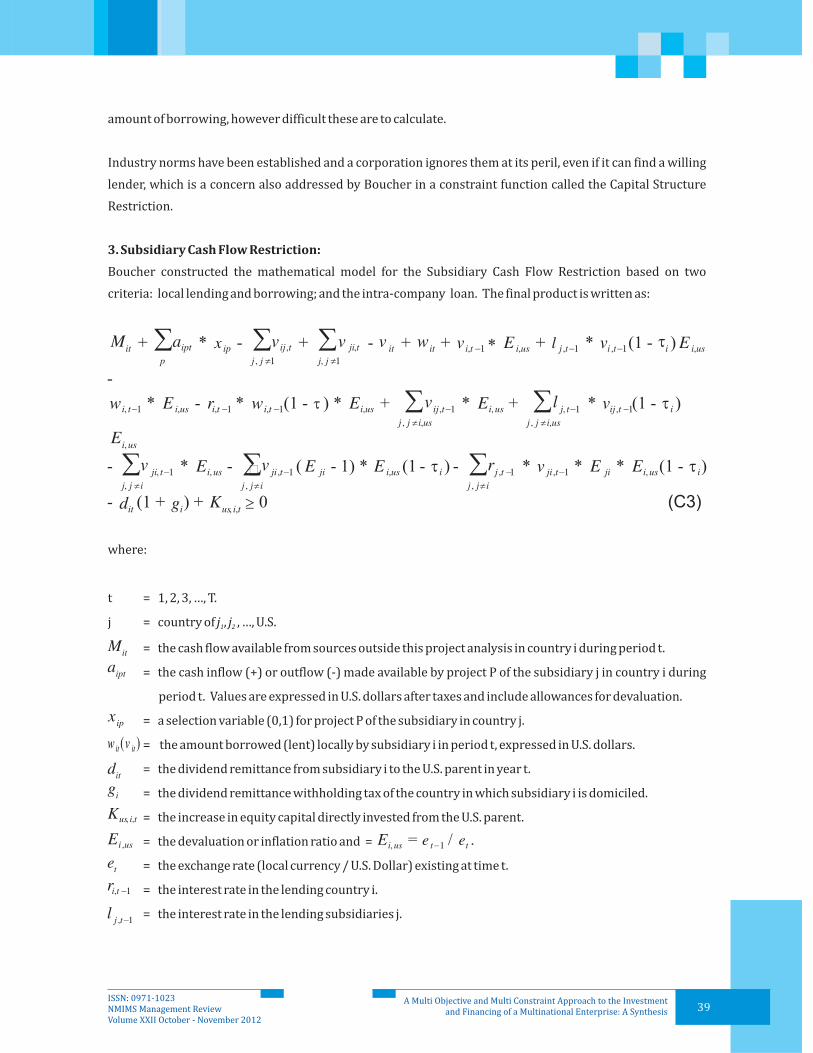
39ISSN: 0971-1023NMIMS Management ReviewVolume XXII October - November 2012
amount of borrowing, however difficult these are to calculate.
Industry norms have been established and a corporation ignores them at its peril, even if it can find a willing
lender, which is a concern also addressed by Boucher in a constraint function called the Capital Structure
Restriction.
Boucher constructed the mathematical model for the Subsidiary Cash Flow Restriction based on two
criteria: local lending and borrowing; and the intra-company loan. The final product is written as:
3. Subsidiary Cash Flow Restriction:
where:
t = 1, 2, 3, …, T.
j = country of , , …, U.S.
= the cash flow available from sources outside this project analysis in country i during period t.
= the cash inflow (+) or outflow (-) made available by project P of the subsidiary j in country i during
period t. Values are expressed in U.S. dollars after taxes and include allowances for devaluation.
= a selection variable (0,1) for project P of the subsidiary in country j.
= the amount borrowed (lent) locally by subsidiary i in period t, expressed in U.S. dollars.
= the dividend remittance from subsidiary i to the U.S. parent in year t.
= the dividend remittance withholding tax of the country in which subsidiary i is domiciled.
= the increase in equity capital directly invested from the U.S. parent.
= the devaluation or inflation ratio and =
= the exchange rate (local currency / U.S. Dollar) existing at time t.
= the interest rate in the lending country i.
= the interest rate in the lending subsidiaries j.
j j1 2
A Multi Objective and Multi Constraint Approach to the Investmentand Financing of a Multinational Enterprise: A Synthesis
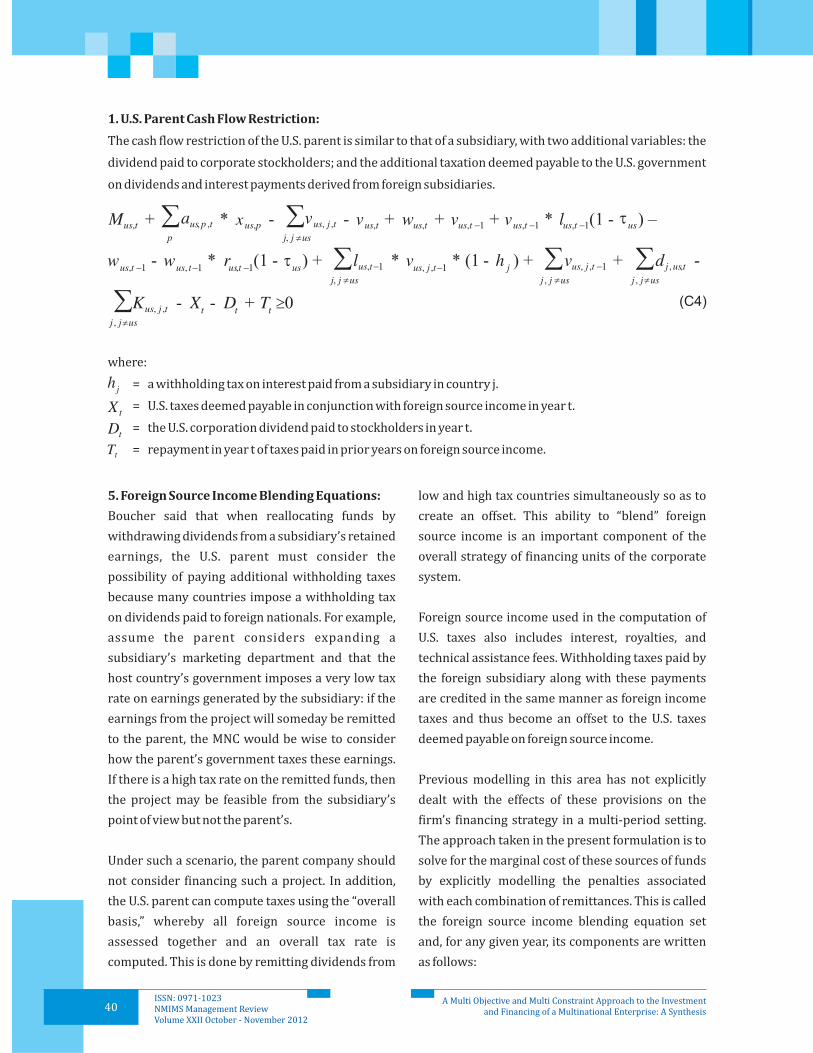
40ISSN: 0971-1023NMIMS Management ReviewVolume XXII October - November 2012
1. U.S. Parent Cash Flow Restriction:
The cash flow restriction of the U.S. parent is similar to that of a subsidiary, with two additional variables: the
dividend paid to corporate stockholders; and the additional taxation deemed payable to the U.S. government
on dividends and interest payments derived from foreign subsidiaries.
where:
= a withholding tax on interest paid from a subsidiary in country j.
= U.S. taxes deemed payable in conjunction with foreign source income in year t.
= the U.S. corporation dividend paid to stockholders in year t.
= repayment in year t of taxes paid in prior years on foreign source income.
5. Foreign Source Income Blending Equations:
Boucher said that when reallocating funds by
withdrawing dividends from a subsidiary’s retained
earnings, the U.S. parent must consider the
possibility of paying additional withholding taxes
because many countries impose a withholding tax
on dividends paid to foreign nationals. For example,
assume the parent considers expanding a
subsidiary’s marketing department and that the
host country’s government imposes a very low tax
rate on earnings generated by the subsidiary: if the
earnings from the project will someday be remitted
to the parent, the MNC would be wise to consider
how the parent’s government taxes these earnings.
If there is a high tax rate on the remitted funds, then
the project may be feasible from the subsidiary’s
point of view but not the parent’s.
Under such a scenario, the parent company should
not consider financing such a project. In addition,
the U.S. parent can compute taxes using the “overall
basis,” whereby all foreign source income is
assessed together and an overall tax rate is
computed. This is done by remitting dividends from
low and high tax countries simultaneously so as to
create an offset. This ability to “blend” foreign
source income is an important component of the
overall strategy of financing units of the corporate
system.
Foreign source income used in the computation of
U.S. taxes also includes interest, royalties, and
technical assistance fees. Withholding taxes paid by
the foreign subsidiary along with these payments
are credited in the same manner as foreign income
taxes and thus become an offset to the U.S. taxes
deemed payable on foreign source income.
Previous modelling in this area has not explicitly
dealt with the effects of these provisions on the
firm’s financing strategy in a multi-period setting.
The approach taken in the present formulation is to
solve for the marginal cost of these sources of funds
by explicitly modelling the penalties associated
with each combination of remittances. This is called
the foreign source income blending equation set
and, for any given year, its components are written
as follows:
A Multi Objective and Multi Constraint Approach to the Investmentand Financing of a Multinational Enterprise: A Synthesis

41ISSN: 0971-1023NMIMS Management ReviewVolume XXII October - November 2012
where:
= the foreign tax credit associated with the withdrawal of foreign income in year t available for use in
year ( = t-2, t-1, t+1, t+2, t+3, t+4, t+5).
= the U.S. tax on foreign source income deemed payable in conjunction with the withdrawal of
foreign source income in year t prior to offsetting with foreign tax credits earned in other years.
= a withholding tax rate on royalties and fees.
= the dividend remittance withholding tax of the subsidiary j.
= the income tax rate in subsidiary j.
= the dividend remittance from subsidiary i to the U.S. parent in year t.
= the U.S. income tax rate.
= the interest rate charged by the U.S. parent company.
= the amount lent from the U.S. to subsidiary j.
6. Dividend Remittance Constraint:
Joint Ventures:
Under the laws of various countries, the absolute
size of the dividend that can be remitted to a foreign
parent is often limited. The specific form of the
limitation can be written from the dividend
remittance laws of the various subsidiary
companies.
In joint ventures, the presence of local stockholders
poses a major constraint on an MNC's ability to
adjust its dividend policy in accordance with global
factors, such as in hesitating to increase dividends
for fear of the difficulty in reducing them later,
should earnings decline. However, local equity
participation tended to result in a more stable
dividend record because these shareholders
expected to receive a designated return on their
investment regardless of earnings. Other conflicts
include local investors demanding a shorter
payback period and the MNC insisting on a higher
earnings retention rate.
Joint ventures with the host country in private or
public companies have been one answer to national
demands for an ownership share in their own
industries. Nevertheless, more than 90% of U.S.
foreign investments (by value) are without joint
venture partners, despite the technical, monetary,
and public relations advantages that such alliances
can bring. Conflict over dividend policy is
particularly likely, since there is no assurance that
they will have the same need for funds or the same
outlook on growth prospects in the case of
reinvestment. Transfer pricing on products or
components bought from or sold to related
companies presents another knotty problem.
This paper addresses conflicts of interests in
dividend payouts by assigning the joint venture
ratio J, which represents an interest on funds,
namely, retention of dividends. Dividend remittance
can thus be expressed as the following involving
joint ventures.
A Multi Objective and Multi Constraint Approach to the Investmentand Financing of a Multinational Enterprise: A Synthesis

financing costs. The capital structure restriction for
any year t is maintained as follows:
42ISSN: 0971-1023NMIMS Management ReviewVolume XXII October - November 2012
where
= the upper limit in country j and year t.
= the joint venture ratio of country j and year t (e.g., wholly owned subsidiary J=1).
7. Capital Structure Restrictions:
Following Shapiro, an optimal capital structure is
assumed wherein the average cost of capital curve is
relatively flat over a range of leverage options. We
further agree with Shapiro that this capital
structure should be a company-wide target and that
lending and borrowing within subsidiaries should
be unconstrained in order to minimize overall
where (W / ) and ( / E) are the lower and upper
limits on the overall debt to equity ratio. , the year
t equity position, can be approximated by:
where:
= profit available from sources outside the project analysis in country j during period t.
= the profit of project P of subsidiary j in period t.
= the beginning equity position.
8. Parent Company Dividend Payout:
This is the most important means of transferring funds from foreign affiliates back to the parent. Among the
various factors that MNCs consider when deciding on dividend payments by their affiliates are taxes,
financial statement effects, exchange risk, currency controls, financing requirements, availability and cost of
funds, and the parent's dividend payout ratio, all of which are built into the previous constraint functions.
Therefore, the parent company dividend payout is simply the ratio of the profit available from sources
outside the project in subsidiary j and the profit from project P of subsidiary j in period t.
where f is the payout ratio and (1-f) is the earnings retention rate.
A Multi Objective and Multi Constraint Approach to the Investmentand Financing of a Multinational Enterprise: A Synthesis

43ISSN: 0971-1023NMIMS Management ReviewVolume XXII October - November 2012
9. Profit Constraint
In socialistic countries, excessive profits are
unwelcome and attract the ire of the governing
authorities. Thus, a foreign subsidiary will have to
limit its profitability over time.
10. Monopoly Profits
III. Issues to Address
A firm has to be careful about having an extremely
big market share, or else it could face antitrust suits
and possible break up of the company. Thus, its
sales have to be a certain amount less than one
hundred percent, with that amount either defined
or undefined.
[Pr]Q= MS*
Where
Pr= price of the product or service
Q= quantity of the product or service.
MS* = a certain market share less than one hundred
per cent.
In our design of the model, we need to ask the
following crucial questions:
1. Are the presuppositions of the traditional
finance appropriate? Specifically, are they
totally, somewhat, or not at all unrealistic?
a. The assumption of perfect or close to
perfect knowledge needs to alter.
b. The equality in the perceptions of owners
and managers has to be questioned.
c. The axiom of no existence of altruism does
not hold.
d. Is the domestic firm similar to the
international firm?
2. Given a certain realism of the assumptions, is
there a single goal or are there multiple goals?
If a few objectives are used, which ones are the
most likely? Is there a difference in the
intensity of each of the objectives? Can we
quantify the diverse objectives?
3. Should we use constraints? Is that more
realistic than unconstrained optimization? If
we should use constraints, is there a
difference in the values of each of the
constraints? Is there an exact specification of
the values, or is there only a ranking of
constraints from more important to less
important ones?
All of the optimizing models built by Boucher,
Shapiro, Krainer, Ness, and the others have involved
optimizing a single function of the decision
variables. However, since multi-criterion
programming is still a new theory and is difficult to
solve, its applicability at present is limited to a
somewhat restricted set of decision scenarios. In
our analysis, since all the objective functions are in
dollars, they are in commensurable quantities
which are somewhat easier to solve.
There are many different methods and techniques
used in solving multi-objective functions. Most of
the techniques are computer programs that are
commercially available. However, there is one
simple method that could explain the theory behind
these commercial programs. Since our objective
functions have weighted importance, the Linear
Combinations Approach is not only applicable in
this aspect but also resets the multi-objective
functions into a weighted single linear objective
function.
IV. Model:
A Multi Objective and Multi Constraint Approach to the Investmentand Financing of a Multinational Enterprise: A Synthesis

44ISSN: 0971-1023NMIMS Management ReviewVolume XXII October - November 2012
In general mathematical terminology, the linear
combinations model is
Max or Min
Since the K linear objective functions *X, k=1, …,
K are commensurable, the single objective function
has the same dimensional units as the K functions
that it represents.
The weights represent a set of relative priorities,
assigned by the importance, for the various
objective functions.
Finally, we can rewrite the above K linear objective
functions as:
Max or Min
where f {… }is the notation for “is a function of.” The
function f expresses some relationship among the K
linear objective functions. For example, if K=1 and f
is the identity function, we would have the single
objective linear programming model equations; if
we are concerned about the priorities among the K
linear objective functions, f would represent a
matrix of the prioritized functions.
The above approach, called Preemptive Goal
Programming (PGP), was first introduced by
Charnes and Cooper in 1962, and many
mathematicians have modified it since. The goal of
PGP is to represent the prioritized managerial goals
as a set of constraints and associated deviational
variables, which are similar to slack and surplus
variables in ordinary linear programming models;
our idea is to treat functions of these deviational
variables as objectives that we wish to minimize or
maximize. One approach to incorporating the
multi-objective linear (or nonlinear) functions into
a Multi-objective Linear Programming (MOLP)
model is to have the decision maker make
preemptive decisions as to the objectives'
importance or identify the objective that in his or
her judgment has primary importance in the
particular decision situation at hand. Once the
manager identifies this overriding objective, he/she
identifies the next most important goal, and so on,
until we obtain a preemptive prioritization of all K
goals or objectives.
Suppose an MNC manager would like to optimally
determine his or her goals as closely as possible
within a priority structure. If the MOLP
assumptions are also met, the problem can be
modelled and analyzed using preemptive
programming. These underlying assumptions are:
(1) we can state the multiple objectives in
commensurable quantities; and (2) we can state
two or more of the object ives only in
incommensurable quantities.
Since all the objectives are in commensurable
quantities, the objective functions are preemptively
prioritized as the following, according to the MNC
manager's requirements.
Objective Functions:
1. Maximize the firm's net project cash flow:
Maximize
2.Minimize the cost of capital:
Minimize
A Multi Objective and Multi Constraint Approach to the Investmentand Financing of a Multinational Enterprise: A Synthesis

45ISSN: 0971-1023NMIMS Management ReviewVolume XXII October - November 2012
3. Maximize the firm's common stock value:
Maximize
4. Maximize the stockholders' profits:
Maximize
5. Maximize the sales of the parent firm:
X = S Pr*Q
Constraints Functions:
1. Minimum Acceptable Rate of Return:
2. The Debt / Equity Ratio:
3. Subsidiary Cash Flow Restriction:
A Multi Objective and Multi Constraint Approach to the Investmentand Financing of a Multinational Enterprise: A Synthesis
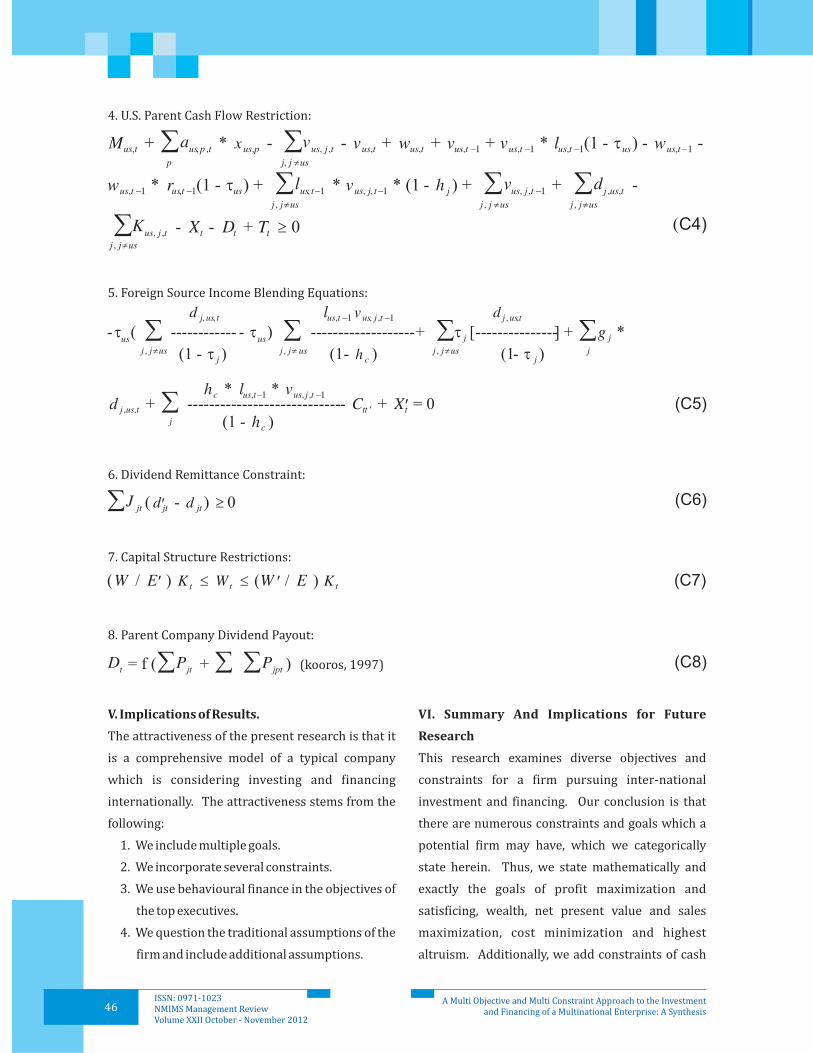
46ISSN: 0971-1023NMIMS Management ReviewVolume XXII October - November 2012
4. U.S. Parent Cash Flow Restriction:
5. Foreign Source Income Blending Equations:
6. Dividend Remittance Constraint:
7. Capital Structure Restrictions:
8. Parent Company Dividend Payout:
V. Implications of Results.
The attractiveness of the present research is that it
is a comprehensive model of a typical company
which is considering investing and financing
internationally. The attractiveness stems from the
following:
1. We include multiple goals.
2. We incorporate several constraints.
3. We use behavioural finance in the objectives of
the top executives.
4. We question the traditional assumptions of the
firm and include additional assumptions.
VI. Summary And Implications for Future
Research
This research examines diverse objectives and
constraints for a firm pursuing inter-national
investment and financing. Our conclusion is that
there are numerous constraints and goals which a
potential firm may have, which we categorically
state herein. Thus, we state mathematically and
exactly the goals of profit maximization and
satisficing, wealth, net present value and sales
maximization, cost minimization and highest
altruism. Additionally, we add constraints of cash
A Multi Objective and Multi Constraint Approach to the Investmentand Financing of a Multinational Enterprise: A Synthesis

47ISSN: 0971-1023NMIMS Management ReviewVolume XXII October - November 2012
flows among subsidiaries as well as from the
subsidiary to the parent and limitations on
dividends and certain profit targets, as well as limits
on debt to equity levels, monopoly power, and
productivity targets.
The next research we want to do is to actually run
this model by choosing a certain ranking so that we
can compute exact values for our objectives and
constraints.
1. Baumol, William, J. , Macmillan, 1959
2. Beatrice, Auko Okatch, Mukulu Elegwa and Luke Oyugi, “Constraints to Subcontracting Arrangements
Between Small and Large Firms in the Motor Vehicle Industry in Kenya”,
2.15 (August , 2011)
3. Boucher, Thomas, “A Mixed-Integer Programming Planning Model for Optimal Investment and
Financing in Segmented International Capital Markets,” The Engineering Economist, 1987.
4. Charnes, Alan, John Wiley &
Sons, Inc., 1990.
5. Chodi, Jiri; Nils Rudi and Jan A. Van Mieghem, “Operational Flexibility and Financial Hedging:
Complements or Substitutes?” , 56.6 (June 2010), pp.1030-1045
6. Cunha, Jorge and Antonio Paisana, “The Financing Constraints Hypothesis Controversy: Some Evidence
for the Portuguese Manufacturing Sector, , 9,6,
June 2010, pp11-25.
7. Cyert, Richard, M. and March, James G. , Prentice -Hall, 1963
8. Domowitz, Ian, Jack Glen and Ananth Madhavan, “Market Segmentation and Stock Prices: Evidence
From An Emerging Market,” , June 1997, Vol. 52 , No. 3. pp.1059-1085
9. Dunning, John H., The Eclectic Paradigm of International Production: A Restatement and Some Possible
Extensions,” , Spring 1988, pp.1-32.
10. Fama, Eugene, F. and Miller, Merton, H. Holt, Rinehart and Winston, 1972
11. Foerster, Stephen R., and G. Andrew Karolyi, “The Effects of Market Segmentation and Investor
Recognition on Asset Prices : Evidence from Foreign Stock Listing in the United States,”
, June 1999, vol.54, No. 3, pp.981-1013.
12. Kibet, Bitok, et al, “The Level of Corporate Dividend Payout to Stockholders; Does Optimal Dividend
Policy Exist for Firms Quoted at the Nairobi Stock Exchange” The International Business and Economics
Research Journal, 9, 3 (March, 2010), pp.71-84
13. Kooros, Syrous K. and Bruce L. Mcmanis, “A Multiattribute Optimization Model for Strategic Investment
Decisions”, , 15.2 (June, 1998), pp. 152-164.
14. Lawrence, Kenneth, D.G.R. Reeves and S. M. Lawrence, “The Leasing Or Purchasing Of Major Capital
Equipment: A Multi Criteria Financial Model”,
, 1990, Vol.2, pp. 129-138.
Business Behavior, Value and Growth .
International Journal of Business
and Social Science
Management Models and Industrial Applications of Linear Programming,
Management Science
The International Business and Economic Research Journal
A Behavioral Theory of the Firm
The Journal of Finance
Journal of International Business Studies
The Theory of Finance
The Journal of
Finance
Canadian Journal of Administrative Sciences
Advances in Mathematical Programming and Financial
Planning
,
References
A Multi Objective and Multi Constraint Approach to the Investmentand Financing of a Multinational Enterprise: A Synthesis

48ISSN: 0971-1023NMIMS Management ReviewVolume XXII October - November 2012
15. Markowitz, Harry, “Portfolio Selection,” , vol. 7 , March 1952, pp. 77-91
16. Mills, Lillian, F. and Kaye J. Newberry, “Do Foreign Multinationals Tax Incentives Influence Their US
Income Reporting and Debt Policy?” ,57 (March,2004):, pp.89-107
17. Reeb, David M., Chuck C. Y. Kwok and H. Young Baek, “Systematic risk of the Multinational Corporation,”
18. Shapiro, Alan, “Financial Structure and Cost of Capital in the Multinational Corporation,” Journal of
Financial and Quantitative Analysis, (June,1978) vol.13, no.2, pp. 211-226.
19. Simon, Herbert,
, Macmillan, 1948
20. Sharpe, William, McGraw Hill, 1970.
21. Skully, Michael, Dryden Press Australia, 1978.
22. Smith, Vernon, L. “Experimental Economics: Induced Value Theory,” , 1976,
66(2), pp. 274-279
23. Stonehill, Arthur, et al “Financial Goals and Debt Ratio Determinants: A Survey of Practice in Five
Countries”, (Autumn, 1975), pp.27-4
24. Stulz, Rene M., “Does the Cost of Capital Differ Across Countries? An Agency Perspective,”
, 1996, vol.2, pp.11-22.
25. Vickers, Douglas, , McGraw-Hill Book Company, 1989.
26. Voronin, A.N., “A Method of Multicriteria Evaluation and Optimization of Hierachical Systems”,
, 43, 3 (May, 2007), pp 384
27. Wald, John K., “How Firm Characteristics Affect Capital Structure: An International Comparison, “
, summer, 1999, vol.12, No. 2, pp.161-187.
28. Wells, Louis T. Jr., “Multinationals and the Developing Countries,”
First Quarter 1998, vol. 29, No 1, pp.101-114.
29. Williamson, Oliver., E.,
30. Wood, Michael, C. and John C. Wood, editors, Herbert Simon:
, Routledge, 2007.
Journal of Finance
National Tax Journal
Journal of International Business Studies, vol.31, Issue 4, 2000, pp.611-630
Administrative Behavior: A Study of the Decision Making Processes in Administrative
Organizations
Portfolio Theory and Capital Markets,
A Multinational Look at The Transnational Corporation,
American Economic Review
Financial Management,
European
Financial Management
The Theory of The Firm
Cybernetics and Systems Analysis
The
Journal Of Financial Research
Journal of International Business
Studies,
The Economics of Discretionary Behavior Managerial Objectives in a Theory of the
Firm, Prentice Hall, 1964
Critical Evaluations in Business and
Management
Dr. Augustine C. Arize teaches in the College of Business and Technology, Texas A&M University. Drs. Krishna
Kasibhatla, John Malindretos, Brian Maruffi and Moschos Scoullis teach at North Carolina Agricultural and
Technical State University, William Paterson University, Yeshiva University and Montclair State University
respectively.
A Multi Objective and Multi Constraint Approach to the Investmentand Financing of a Multinational Enterprise: A Synthesis

49ISSN: 0971-1023NMIMS Management ReviewVolume XXII October - November 2012
Customer Loyalty Attributes:A Perspective
Abstract
Many academicians have accepted the significance
of loyalty in service industries (Bloemer et al., 1999;
Caruana, 2002; Asuncion et al., 2004) and its
potential impact on the development of sustainable
competitive edge (Keaveney, 1995; Gremler and
Brown, 1996) for the service firms. This may be
attributed to the unique nature of services,
increased dependency on technology and greater
customer involvement in service delivery. A base of
loyal customers can do wonder in terms of
economic rewards and new business prospects as
winning a new customer can cost as much as 6 times
more than the cost of retaining an old one
(Rosenberg and Czepiel, 1984) whereas profits can
be increased from 25% to 125% if the potential
migration is decreased by 5% depending upon the
particular industry (Reichheld and Sasser, 1990).
Customer loyalty clearly brings in significant
benefits to the business and calls for a deeper
investigation into the factors that act as its
originator and contribute in its enhancement since,
as mentioned by Johnson, Herrmann, and Huber
(2006), the antecedents of customer loyalty are
convoluted and dynamic, changing and evolving
over time.
The purpose of this paper is to discuss customer
loyalty and its significance in the modern business
arena through a comprehensive survey of literature.
Further, it seeks to explore various factors that serve
as antecedents to customer loyalty development. In
other words, investigating the customers' checklist
that they refer before deciding to sustain and
develop their relationship with the company and its
offerings is the key issue that this paper aims to
address. The study intends to provide a framework
for development of a scale for assessing customer
loyalty and identifying what a particular class of
loyalty would result into in terms of its contribution
to the organization. The above identified framework
would prove to be of great significance for service
organizations in appraising different loyalty
programs and also in segmenting customers
depending upon organizational requirements.
Customer Loyalty, Service Quality,
Customer Satisfaction, Attitudinal Loyalty,
Behavioural Loyalty
Keywords:
Alok Kumar Rai
Medha Srivastava1
1Medha Srivastava is the corresponding author.
She can be reached at [email protected]

50ISSN: 0971-1023NMIMS Management ReviewVolume XXII October - November 2012
Introduction:
Globalized markets and borderless flow of
information have resulted in intense competitive
pressures and increased customer expectations.
Productivity, quality, customer satisfaction are the
buzz-words in today's business scenario that
demand considerable efforts on the part of the
company. Further, to attain the basic business goals
of survival and growth, businesses are looking for
ways to attract and retain customers in the long run.
It is established now that every business needs to
understand and meet customers' expectations in
order to strive and thrive in the market. Customers
have become the focal point of almost all the
businesses now and thus, deserve all the attention
and importance. However, due to heightened
expectations, escalated competition and rapid
ingress of new business concepts and formats,
companies are finding it increasingly difficult to
retain their customers along with managing to be
profitable. Instability of the economic environment
in recent times has also contributed to the loyalty
issues in businesses.
In order to develop and sustain loyalty among the
customers, it is important to find out what drives
loyalty in a particular market. The factors which
lead to loyalty need to be uncovered and understood
before designing and implementing the strategies
for customer retention and loyalty. Literature
proposes relationships between customer loyalty
and various other business constructs such as
quality, satisfaction, trust and so on. These
relationships need to be investigated and
understanding the effect of these constructs on
loyalty will surely provide an insight into customer
loyalty formation.
Review Of Literature:
Services have been widely researched and analyzed
for their unique characteristics and intensive
customer orientation. Some of the major concepts
that have been studied to explore the true nature of
services are Service Quality (Parasuraman,
Zeithaml & Berry, 1985; Gronroos, 1988; Cronin &
Taylor, 1992; O.Neill, 1992; Oliver, 1997),
Satisfaction (Oliver, 1993 & 1997; Wirtz & Bateson,
1999; Zeithaml & Bitner, 2000), Loyalty (Dick &
Basu, 1994; Oliver, 1997; Bowen & Shoemaker,
1998; Reichheld & Sasser, 1990; Heskett, Sasser &
Schlesinger, 1994; McMullan & Gilmore, 2003;
McMullan, 2005) and Complaint Management
Systems (Boshoff, 1997 & 1999; Mattila, 2001;
Boshoff & Staude, 2003; Craighead, Karwan, &
Miller, 2004; Mattila & Patterson, 2004). Role of
customer loyalty gains more prominence when
applied in the context of services due to the higher
human involvement in comparison to goods. Such
people intrinsic character of services along with its
intangible and perishable nature, enhance the scope
for error at the time of service delivery and amplify
the role and significance of human relationships in
business transact ions . Also , heightened
competition has resulted in fewer possibilities for
differentiation. To tackle the competitive pressures
and gain an edge in the market, companies are now
looking forward to leverage upon the intangible
nature of services and the significant human
interface involved there. Customer loyalty has been
included in the strategic objectives of many
companies due to the competitive strength it offers.
Dwyer et al. (1987); Morgan and Hunt (1994) noted
that the interest in customer relationships mounted
first in business to business relationships and later
extended to business to customer relationships as
stated by Sheth and Pravatiyar (1995) and
Customer Loyalty Attributes: A Perspective

51ISSN: 0971-1023NMIMS Management ReviewVolume XXII October - November 2012
Sirdeshmukh et al. (2002). Ball et al. (2003) opined
that customer loyalty needs to be incorporated as an
essential construct in the theory and practice of
relationships in marketing and its antecedents
should also be included for a better understanding.
Bharatwaj et al. (1993) mentioned that the
organizations should start taking customer loyalty
as a source of competitive advantage. Reichheld and
Sasser (1990), Sheth and Parvatiyar (1995) opined
that customer relationship management has got the
concepts of customer loyalty and business
performance fore-grounded in its framework. As
put by Oliver (1999), Reichheld (2001), customer
loyalty has been drawing attention from both the
business and academic worlds. Majumdar (2005)
stated that “Customer loyalty is a complex,
multidimensional concept”.
Thus, it becomes imperative to explore the
conceptual domain of customer loyalty as offered by
the literature for a precise idea of its concept,
classification and antecedents in order to develop a
sound pedestal for further research.
Day (1969) opined that in its most initial stage of
conception, customer loyalty was perceived as the
combination of repeat purchases from one service
provider or brand coupled with the customers'
psychological attachment toward the provider.
Newman and Werbel (1973) defined it as a
characteristic of those who repurchased a brand,
considering only that brand, without seeking any
information related to it. However, Oliver (1997)
suggested that lack of information should not be
seen as a factor leading to loyalty as true loyalty
Customer Loyalty - A Conceptual
Framework:
exists when the customer, despite being aware of
the competitor's offer, “fervently desires to rebuy a
product or service; will have no other, against all
odds and at all costs”.
Jaishankar, Arnold and Kristy (2000) described
loyalty as a product of repeat purchase, self stated
retention, price insensitivity, resistance to counter
persuasion, and recommendation to others. Dwyer,
Schurr, and Oh (1987); Fornell (1992) found that
willingness to spread positive word-of-mouth about
a service provider and repeat purchasing behaviour
are the most common indicators of customer
loyalty. A number of studies have treated these two
behaviours as loyalty indicators (Zeithaml et al.
1996; Sirdeshmukh et al. 2002). However, loyalty
manifests itself in not only behavioural fashion but
it also gets influenced by the attitudinal setup of
mind.
Dick and Basu (1994) brought out the idea of
relative attitudes while defining various forms of
loyalty depicted below. They described loyalty as
the strength of the relationship between a
customer's relative attitude and repeat patronage
and four dimensions had been identified: true
loyalty, latent loyalty, spurious loyalty and no
loyalty.
Oliver (1999) defined loyalty as “a deeply held
commitment to re-buy or re-patronize a preferred
product/service consistently in the future, thereby
causing repetitive same-brand or same brand-set
purchasing...”
Customer Loyalty Attributes: A Perspective

52ISSN: 0971-1023NMIMS Management ReviewVolume XXII October - November 2012
Figure 1(a) Categories of Loyalty
Repeat Patronage
Relative Attitude
High Low
High
Low
True Loyalty Latent Loyalty
Spurious Loyalty No Loyalty
Dick & Basu (1994) Customer Loyalty: Toward an Integrated Conceptual Framework
Dick and Basu (1994); Pritchard et al. (1999);
Mattila (2001) defined relative attitudes as the
evaluation of the service characteristics comprising
the strength of that evaluation and the attitudinal
differentiation which refers to the level of
differentiation from substitutes.
Oliver, (1999); Knox and Walker (2001); Tsaur et al.,
(2002) made efforts to dig out greater knowledge
and understanding in relation to the process of
developing customer loyalty. Palmer et al. (2000);
Knox and Walker (2001); Rowley (2005) proposed
that the development of customer loyalty involves
different stages and the customers who are at
different stages require differentiated strategies.
Customer loyalty development had been
categorized into four sequential phases by Oliver
(1999):
Figure 1(b) Phases of Customer Loyalty Development
Cognitive
loyalty
Affective
loyalty
Conative
loyalty
Action
loyalty
• The customer believes the product to be superior than others and thus, chooses it over
others.
Information about the brand and its perceived benefits affect the buying decision.•
• Reiterated confirmations of customers' expectations lead to affective form of loyalty
where a particularly favourable attitude gets developed towards the brand.
• High involvement and motives fueled by strong buying intentions give way to the
development of an intense form of loyalty i.e., conative loyalty.
• Strong motivations that ultimately lead to actions directed by the ‘need to remove’
every possible problem that might hinder the loyalty driven decision of purchasing a
specific brand.
Oliver (1999) Whence customer loyalty?
Customer Loyalty Attributes: A Perspective

53ISSN: 0971-1023NMIMS Management ReviewVolume XXII October - November 2012
Oliver (1999) also suggested that action loyalty is perceived as a necessary result of engaging previous
phases of loyalty and is accompanied by an additional desire to overcome obstacles that may prevent a
customer from patronizing the service organization.
McMullan (2005) presented studies concerned with the classification of customer loyalty as follows:
Table 1(a). Key Classifications of Customer Loyalty
Author (s), year Contribution
Jacoby and Chesnut (1978)
3-fold classification characterising approaches to measuring brand
loyalty:
- behaviour
- psychological commitment
composite indices-
Dick and Basu (1994)
Study concentrated on the relative attitude and potential moderators
of the relative attitude to repeat-patronage based on social norms and
situational factors.
Relative attitude is the degree to which the consumer's evaluation of
one alternative brand dominates over another.
True loyalty only exists when repeat patronage coexists with high
relative attitude.
Classification including spurious, latent and sustainable categories of
loyalty.
Christopher et al. (1993)
The Loyalty Ladder
Examined the progress up or along the rungs from prospects,
customers, clients, supporters and advocates
Progression requires increased discussion between exchange parties,
commitment and trust, which develops within a consumer's attitude
based on their experiences including dialogue.
Baldinger and Ruben (1996)
A composite approach
Investigated the predictive ability of behavioural and attitudinal data
towards customer loyalty across five sectors.
Customer Loyalty Attributes: A Perspective

54ISSN: 0971-1023NMIMS Management ReviewVolume XXII October - November 2012
Author (s), year Contribution
Examined the links between profitability, customer satisfaction and
customer loyalty.Hallowell (1996)
Effectiveness of loyalty programmes.O'Malley (1998)
Developed scale to measure loyalty within the Exploratory Tendencies
in Consumer Behaviour Scales (ETCBS).Raju (1980)
Developed scale to measure commitment, based on the assumption
that commitment is similar to loyalty.
This scale included items, which reflected ego involvement, purchase
involvement and brand commitment.
Beatty et al. (1988)
Conceptualised customer loyalty in a commitment-loyalty measure,
termed Psychological Commitment Instrument (PCI).Pritchard et al. (1999)
Extended the concept of customer loyalty to intangible goods with
their definition of service loyalty.
They recommended a 12-item measure; with a seven-point scale
described at either end strongly agree to strongly disagree.
Gremler and Brown (1999)
Greater emphasis on the notion of situational influences.
Developed four-phase model of customer loyalty development
building on previous studies but uniquely adding the fourth action
phase.
Oliver (1999)
Explored a further aspect of customer loyalty identified as “cognitive
loyalty”, which is seen as a higher order dimension involving the
consumer's conscious decision-making process in the evaluation of
alternative brands before a purchase is affected.
One aspect of cognitive loyalty is switching/repurchase intentions,
which moved the discussions beyond satisfaction, towards
behavioural analysis for segmentation and prediction purposes.
Jones et al. (2000)
Customer Loyalty Attributes: A Perspective

55ISSN: 0971-1023NMIMS Management ReviewVolume XXII October - November 2012
Author (s), year Contribution
Developed measure of customer loyalty.
Empirical study of grocery brands.
Found that brand commitment and brand support were necessary and
sufficient conditions for customer loyalty to exist.
Produced a classification-loyals, habituals, variety seekers and
switchers.
Provides guidance for mature rather than new or emerging brands.
Knox and Walker (2001)
McMullan (2005) A multiple-item scale for measuring customer loyalty development
Determinants Of Customer
Loyalty:
Dick and Basu (1994); Oliver (1999) pointed out
that over the years, researchers have recognized
and studied many antecedents of customer loyalty
to stores, companies, and brands. Terblanche and
Boshoff (2006) said that it is imperative to
understand the precursor drivers of loyalty in order
to leverage the greatest benefits available from it.
Johnson, Herrmann and Huber (2006) as well as
many other practitioners and academicians in the
field of customer loyalty ascertained that the factors
leading to loyalty are complex and dynamic,
changing and evolving over time. Taylor, Hunter and
Longfellow (2006) noted a number of important
gaps in the understanding of loyalty and other
relationship marketing constructs.
Ball et al. (2004) mentioned that measuring
customer loyalty and its determinants into different
markets and countries may bring out significant
variance in the explanation of loyalty. Brady et al.
(2005) argued that despite various studies focusing
on drivers of loyalty, scholars as well as
practitioners are still lacking in the understanding
of loyalty determinants and their relative
importance.
The following section elaborates upon a number of
service evaluation and relationship marketing
variables which are considered to be the
antecedents of customer loyalty in the extant
literature and attempts to mark out their
consequences in terms of loyalty specific
behaviours:
Grönroos (1983) stated that service quality
contains two components – technical quality
(“what” is delivered) and functional quality (“how”
is delivered). Parasuraman, Zeithaml, & Berry
(1988) noted that early researches projected
service quality as an attitude shaped on the basis of
disparity between customers' expectations
regarding a service to be received and perceptions
of the service being received. Fogli (2006) defined
service quality as “a global judgement or attitude
relating to a particular service; the customer's
overall impression of the relative inferiority or
superiority of the organization and its services.
Service quality is a cognitive judgement”.
1. Service Quality
Customer Loyalty Attributes: A Perspective

56ISSN: 0971-1023NMIMS Management ReviewVolume XXII October - November 2012
Anderson and Sullivan (1993), Parasuraman,
Zeithaml, and Berry (1994), Anderson, Fornell and
Lehmann (1994), Fornell et al . (1996),
Athanassopoulos (2000) and Cronin, Brady, and
Hult (2000) postulated that empirical researches
have proposed service quality as one of the main
antecedents of customer satisfaction which is also
treated as a primary source of loyalty.
Zeithaml et al., (1996) and Zeithaml (2000) posited
that a customer's behavioural intentions such as
repeat purchase get affected with the perceived
service quality. Anderson and Mittal (2000) claimed
that a customer's decision to recommend a
company's product through positive word-of-
mouth depends upon the level of product quality.
Ranaweera and Neely (2003) also confirmed that
there exists a direct linear relationship between
perceived service quality and customer retention.
Simon, Seigyoung and Karen (2005) accepted the
relationship between service quality and customer
loyalty.
Mano and Oliver (1993) described satisfaction as a
post consumption attitude or evaluative judgement
which varies along with the hedonic continuum
focused on the product. Rust and Oliver (1994)
defined customer satisfaction or dissatisfaction as a
“cognitive or affective reaction” that surfaces in the
form of a response to a single or prolonged set of
service encounters. Giese and Cote (2000) believed
that there are three main components of consumer
satisfaction namely cognitive, affective or conative
(the type of response); the subject at which the
response is directed; and the duration in between
which evaluation is done. Besterfield (1994);
Barsky (1995) and Kanji and Moura (2002) opined
that customer satisfaction has been approached
2. Customer Satisfaction
differently, which makes it complex. According to
Levesque and McDougall (1996), satisfaction is
understood as an overall attitude that customers
hold towards a service provider. Halstead et al.
(1994) perceived customer satisfaction as an
affective response evoked from a comparison of the
product's performance with some pre-purchase
standard during or after consumption.
Newman and Werbel (1973); Oliver and Linda
(1981); LaBarbera and Mazursky (1983); Bearden
and Teel (1983); Bitner (1990); Fornell (1992);
Anderson and Fornell (1994); Dick and Basu
(1994); Oliver (1996) contended that customer
satisfaction has often been held responsible for
customer loyalty during the past few years. Cronin
and Taylor (1992); Cronin, Brady, and Hult (2000);
McDougall and Levesque (2000); Chiou, Droge, and
Hanvanich (2002) argued that literature provides
empirical evidences of satisfaction influencing
customer loyalty which is referred to as
continuously positive buying behaviour of a
customer towards a certain company or brand.
Oliver and Linda (1981); Cronin and Taylor (1992);
Fornell (1992); Oliver et al. (1992); Reichheld
(1993); Anderson and Fornell (1994) found that
satisfaction is the most significant factor leading to
customer loyalty. Abdullah et al. (2000) reviewed
previous studies and found that they also indicate
that customer satisfaction can affect customer
loyalty and future purchase intentions.
Coyne (1989) established that loyalty and customer
satisfaction share a weak relationship when
customer satisfaction is low, moderate when
customer satisfaction is intermediate and strong
when customer satisfaction is high. Fornell (1992)
pointed that high customer satisfaction will lead to
Customer Loyalty Attributes: A Perspective

57ISSN: 0971-1023NMIMS Management ReviewVolume XXII October - November 2012
improved loyalty for the firm and it will also
decrease customers' sensitivity towards
competitive offers. Jones and Sasser (1995) also
supported him stating that customers enjoying
higher position on the satisfaction scale are more
likely to be loyal with an increase in customer
satisfaction which reflects the strong impact of
satisfaction on loyalty. However, Jones & Sasser
(1995) found that the satisfaction - loyalty
relationship is neither simple nor linear and
defection may take place among satisfied customers
also.
3. Trust
Moorman et al., (1993) defined trust as ''a
willingness to rely on an exchange partner in whom
one has confidence ''. Morgan and Hunt (1994)
found that trust exists “when one party has
confidence in an exchange partner's reliability and
integrity”. Reichheld and Sasser (1990) opined that
to achieve customer satisfaction and retention and
consequently, long term business profitability, it's
important to fulfil the promises.
Geyskens et al. (1996); Rousseau et al. (1998); Singh
& Sirdeshmukh (2000) indicated that trust has been
given great importance for building and
maintaining long term relationships in business.
Moorman et al., (1993); Morgan and Hunt, (1994);
Sharma (2003) accepted trust as a significant
variable for achieving relationship commitment
and customer loyalty and it is a critical factor for
relationships both logically and experientially.
Geyskens et al. (1996); Doney and Cannon (1997);
Rousseau et al. (1998); Singh and Sirdeshmukh
(2000); Papadopoulou et al. (2001) confirmed that
trust is needed to build long-term customer
relationship in a volatile business environment.
Gremler and Brown (1996) and Reichheld et al.
(2000) perceived trust as a conceptual and
important antecedent of customer loyalty. Working
on similar lines, Garbarino and Johnson (1999) also
identified trust as a driver of customer behavioural
intentions that might lead to customer loyalty and
found that trust and commitment are key
antecedents to loyalty for customers who value
relationships.
Bearden and Teel (1983); Cronin and Taylor (1992);
Oliver et al. (1997); Selnes (1998) found a direct link
between trust and loyalty whereas Doney and
Cannon (1997) perceived trust as the principal
antecedent of repurchase intentions. Lim et al.
(1997); Garbarino and Johnson (1999); Chaudhuri
and Holbrook (2001); Singh and Sirdeshmukh
(2000) and Sirdeshmukh et al. (2002) found trust to
be an important factor for loyalty building. Foster
and Cadogan (2000) showed that in a company,
trust works as an antecedent to attitudinal loyalty.
According to Pavlou (2003) trust is a prerequisite
for patronage behaviour. Ranaweera and Prabhu
(2003) stated that trust is likely to result in
customer retention when it comes to maintaining
long term relationships between service provider
and customer.
Dwyer et al. (1987) defined commitment in service
provider-customer relationships as “an implicit or
explicit pledge of relational continuity between
exchange partners”. Moorman et al. (1992)
described commitment as an enduring desire for
preserving a valued relationship.
Jacoby and Kyner (1973) suggested that
commitment is an important tool to differentiate
loyalty from repeat purchase behaviour. Dwyer et al.
(1987); Morgan and Hunt (1994); Gundlach et al.
4. Commitment
Customer Loyalty Attributes: A Perspective

58ISSN: 0971-1023NMIMS Management ReviewVolume XXII October - November 2012
(1995) proposed that commitment is an essential
determinant of the strength of a marketing
relationship as well as a useful construct for
assessing the possibility of customer loyalty and
forecasting future purchase frequency. Garbarino
and Johnson's (1999) research proposed that for
customers who share a strong relationship with an
organization, trust and commitment were the
mediators between attitudes and future intentions.
Jackson (1985) posited that switching cost is the
sum of economic, psychological and physical costs.
Gremler and Brown (1996) defined switching cost
as the time, money and effort invested by the
customer which makes it difficult to switch. Porter
(1998) defined switching cost as the cost a
customer incurs in the process of changing service
providers. As put by Hellier, Rickard, Carr, and
Geursen (2003), switching cost refers to the
customer's assessment of the personal loss or
sacrifice in terms of time, effort and money
associated with shifting to another service provider.
Klemperer (1987) suggested that switching cost
can inspire brand loyalty among customers
surrounded with a number of functionally identical
brands. Fornell (1992) found switching cost to be an
important factor among others that influence the
relationship of customer satisfaction and customer
loyalty. Hauser et al. (1994) analyzed the
relationship between switching cost and
satisfaction level i.e., an increase in switching cost
leads to a decrease in satisfaction, thereby
exercising a moderator impact on customer loyalty.
Andreassen and Lindestad (1998) in their research
found that customers may turn loyal if faced with
high switching barriers or lack of real substitutes.
Eber (1999); Jones et al. (2002); Bloemer et al.
5. Switching Cost
(1998); Burnham et al. (2003); Feick et al. (2001)
posited that switching cost affects the customer's
responses to price level which in turn, influences
customer loyalty. Jones et al., (2000) argued that
switching cost operates as an antecedent of loyalty
in both business-to-business and business-to-
consumer transactions.
6. Corporate Image
Kunkel and Berry (1968); Doyle and Fenwick
(1974); James et al. (1976) reviewed several
conceptualisations of image that have been
proposed in the past. Barich and Kotler (1991)
proposed that corporate image is the overall
impression of a company on the minds of the public.
Nguyen and Leblanc (2001) found corporate image
to be related with a company's physical and
behavioural aspects such as business identity,
infrastructure, product/service lines, and
employees' quality of interaction during service
encounter.
Lindestad and Andreassen (1997) perceived
corporate image as an extrinsic information cue that
may or may not influence customer loyalty and it
applies for both existing and new set of customers.
Yet, Andreassen (1999) posited that corporate
image does affect customer loyalty in a positive
manner. Rowley and Dawes (1999) revealed that
brand or corporate image and customers'
expectations regarding the nature and quality of
services influence customer loyalty. Ball, Coelho,
and Macha (2003) suggested that customers may
turn loyal towards a company or brand due to the
fact that it is perceived in positive light among other
customers. Kandampully and Hu (2007)
established that corporate image bears a direct
effect on and customer loyalty and the two are
positively related. Wang (2010) suggested that
Customer Loyalty Attributes: A Perspective
59ISSN: 0971-1023NMIMS Management ReviewVolume XXII October - November 2012
customers may act loyal to a company or brand due
to the positive image it enjoys among other
customers and this holds true especially in the
context of credence goods which may also help in
controlling the switching behaviour.
According to Reynolds et al. (1974-1975) it is found
that customers' overall assessment of corporate
image is deemed to influence customer loyalty.
Fishbein and Ajzen (1975) argue that attitudes and
behavioural intentions have a functional
re l a t i o n s h i p , w h i c h p re d i c t b e h av i o u r.
Consequently, corporate image is considered as an
attitude that must affect behavioural intentions
such as customer loyalty (Johnson et al., 2001).
Nguyen and Leblanc (2001) demonstrate that in
three business sectors (telecommunication,
retailing and education), corporate image and
customer loyalty are positively related.
Boshoff (1997) stated that “Mistakes are an
unavoidable feature of all human endeavour and
thus also of service delivery.” Duffy et al. (2006)
defined service failure as the real or perceived
service breakdown either in terms of outcome or
process.
Gronroos (1988) suggested that the response a
service provider emits in the event of service failure
is known as service recovery. Zemke and Bell (1990)
defined service recovery as a “thought-out, planned
process for returning aggrieved customers to a state
of satisfaction with the firm after a service or
product has failed to live up to expectations.”
Johnston (2005) found that literature related to
traditional services presents substantial work
regarding the impact of service failure and recovery
7. Service Recovery
on customer loyalty. It brought out four major
findings:
• Zeithaml et al. (1996); Roos (1999); Hays and
Hill (1999); McCollough et al. (2000) opined
that loyalty intentions get negatively affected
with service failures and failures work as a
prominent driving force for switching
behaviour.
According to Colgate and Norris (2001)
service failures leads to the disconfirmation of
expectations from service resulting in the
negative effects on different types of loyalty,
word-of-mouth and customer retention.
Spreng (1995); Zeithaml et al. (1996); Tax and
Brown (1998); Miller et al. (2000) contended
that satisfaction with service recovery not
only resolves the problem but also increases
customer loyalty.
McCollough et al. (2000) found that initial
service failures negatively affect loyalty
whereas recovery actions mitigate these
effects.
Miller, Craighead, & Karwan (2000); Smith & Bolton
(2002) reviewed service recovery literature and
found that it gives evidence of customer satisfaction
and loyalty getting affected with resolution of the
customer's problems. Swanson and Kelley (2001)
affirmed that customers' perception of a firm
consistently implementing service recovery when
failures occur affect their behavioural intentions
favourably. Robbins and Miller (2004) agreed that
customer loyalty gets influenced with effectively
managed service recovery.
Hart, Heskett, and Sasser (1990) stated that “a good
recovery can turn angry, frustrated customers into
loyal ones. It can, in fact, create more goodwill than if
things had gone smoothly in the first place”. They
•
•
•
Customer Loyalty Attributes: A Perspective
60ISSN: 0971-1023NMIMS Management ReviewVolume XXII October - November 2012
further argued that recovery encounters should be
seen as an opportunity to achieve greater customer
retention for service providers. McCollough, Berry,
and Yadav (2000) proposed that since service
failures play an important role behind customers'
switching intentions, a proper understanding of
service recovery may result in customer retention
which, in turn, will affect the profitability of the firm.
Izard (1977) found emotions to be primary
motivators of behaviour. Westbrook (1987)
discovered that the customers' experiences
generated emotions and concluded that emotions
have a direct relationship with post-purchase
behaviour, such as re-purchase intentions. Allen et
al. (1992) demonstrated that predicting purchasing
behaviour could be less cumbersome with the
understanding of “emotive experiences”. Stauss and
Neuhaus (1997) showed a significant relationship
between emotions and loyalty. Studies conducted
by Liljander and Strandvik (1997); Bagozzi et al.
(1999); Yi-Ting and Dean (2001) also proved that
emotions and behaviour share a link.
8. Emotions
9. Communication
Anderson and Norus (1990) presented a new idea
of communication that is an interactive dialogue
between the company and its customers, which
takes place during pre-selling, consuming and part-
consuming stages. Ndubiri and Chan (2005) opined
that communication is responsible for building
awareness in the early stage, developing customer
preference, convincing and encouraging the
customers to make the decision to purchase.
Based upon the literature reviewed above, the
following table is constructed for presenting the
significant determinants responsible for the
configuration of customer loyalty and their
respective impact:
Customer Loyalty Attributes: A Perspective

61ISSN: 0971-1023NMIMS Management ReviewVolume XXII October - November 2012
Table 1(b) Determinants of Customer Loyalty and their impact on loyalty
S. No. Determinant Contributing Author (s) Consequential Behaviour
1 Service Quality • Anderson and Sullivan (1993);
Parasuraman, Zeithaml, and
Berry (1994); Anderson,
Fornell and Lehmann (1994);
Fornell et al. (1996);
Athanassopoulos (2000);
Cronin, Brady, and Hult (2000)
Zeithaml et al., (1996), (2000)
Anderson and Mittal (2000)
•
•
• Customer satisfaction
(confirmation of
expectations)
Positive behavioural
intentions (Repurchase,
recommendation, etc.)
Positive word of mouth
•
•
2 Customer satisfaction • Cronin and Taylor (1992);
McAlexander et al. (1994)
Liang and Wang (2007)
Fornell (1992)
Barsky (1992)
•
•
•
• Future Purchase Intentions
(Repeat purchases)
Customers' active
participation in terms of
buying additional services
and spreading favourable
word-of-mouth
communication
Decrease in customers'
sensitivity towards
competitive offers
Increased market share
from repeat business and
referrals
•
•
•
3 Trust • Doney and Cannon (1997)
Bendapudi and Berry (1997)
Morgan and Hunt (1994)
Ranaweera and Prabhu (2003)
•
•
•
• Repurchase intentions
Reduction in the cost of
negotiations and removal of
the customer's fear of
opportunistic behaviour by
the service provider
Formation of highly valued
exchange relationships
Maintenance of long term
relationships
•
•
•
4 Commitment • Beatty et al. (1998); Morgan &
Hunt (1994)
Pritchard, Havitz and Howard
(1999)
•
•
•
Liking and emotional
attachment to the firm
Resistance to switching
behaviour
Customer Loyalty Attributes: A Perspective
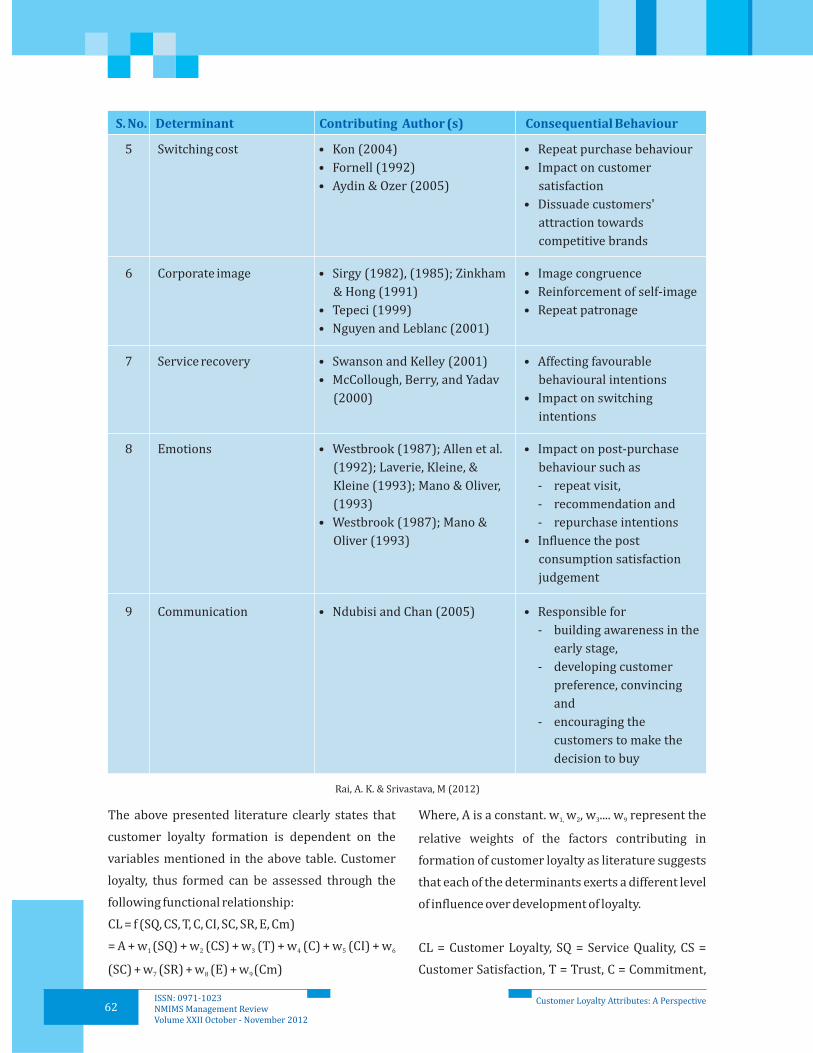
62ISSN: 0971-1023NMIMS Management ReviewVolume XXII October - November 2012
S. No. Determinant Contributing Author (s) Consequential Behaviour
5 Switching cost • Kon (2004)
Fornell (1992)
Aydin & Ozer (2005)
•
•
•
•
•
Repeat purchase behaviour
Impact on customer
satisfaction
Dissuade customers'
attraction towards
competitive brands
6 Corporate image • Sirgy (1982), (1985); Zinkham
& Hong (1991)
Tepeci (1999)
Nguyen and Leblanc (2001)
•
•
•
•
•
Image congruence
Reinforcement of self-image
Repeat patronage
7 Service recovery • Swanson and Kelley (2001)
McCollough, Berry, and Yadav
(2000)
•
•
•
Affecting favourable
behavioural intentions
Impact on switching
intentions
8 Emotions • Westbrook (1987); Allen et al.
(1992); Laverie, Kleine, &
Kleine (1993); Mano & Oliver,
(1993)
Westbrook (1987); Mano &
Oliver (1993)
•
•
•
Impact on post-purchase
behaviour such as
- repeat visit,
- recommendation and
- repurchase intentions
Influence the post
consumption satisfaction
judgement
9 Communication • Ndubisi and Chan (2005) •
-
Responsible for
- building awareness in the
early stage,
- developing customer
preference, convincing
and
encouraging the
customers to make the
decision to buy
Rai, A. K. & Srivastava, M (2012)
The above presented literature clearly states that
customer loyalty formation is dependent on the
variables mentioned in the above table. Customer
loyalty, thus formed can be assessed through the
following functional relationship:
CL = f (SQ, CS, T, C, CI, SC, SR, E, Cm)
= A + w (SQ) + w (CS) + w (T) + w (C) + w (CI) + w
(SC) + w (SR) + w (E) + w (Cm)
1 2 3 4 5 6
7 8 9
Where, A is a constant. w w , w .... w represent the
relative weights of the factors contributing in
formation of customer loyalty as literature suggests
that each of the determinants exerts a different level
of influence over development of loyalty.
CL = Customer Loyalty, SQ = Service Quality, CS =
Customer Satisfaction, T = Trust, C = Commitment,
1, 2 3 9
Customer Loyalty Attributes: A Perspective

63ISSN: 0971-1023NMIMS Management ReviewVolume XXII October - November 2012
CI = Corporate Image, SC = Switching Cost, SR =
Service Recovery, E = Emotions , Cm =
Communication
The relationship depicted above can act as a base for
construction of a loyalty measurement scale. It
would be interesting to test the relationship
between customer loyalty and its antecedents
across different industries and cultural contexts.
Unearthing the relative weights of these
antecedents in the process of customer loyalty
formation can lead to significant revelation for the
loyalty strategists as they can focus on the factors in
the order of their relative importance and bring out
an effective loyalty program for their firm. Further,
the relationship among various antecedents of
customer loyalty and their moderating impact on
each other also need to be tested for a more lucid
understanding of their respective roles in customer
loyalty formation.
Outcomes of Customer Loyalty:
Loyalty is principally valued for its outcomes since
it's the outcome behaviours of loyal customers that
exercise a huge impact over the revenues and
growth of a firm. The literature provides a multitude
of behavioural, attitudinal and cognitive outcomes
of customer loyalty some of which are widely
recognized and accepted whereas others demand
further probing for clarity.
The manifestations of loyalty among customers are
generally pinned down through their actions or
their attitude towards the company or a particular
product/ service. However, recent literature
suggests that another outcome of loyalty is the
customer preferring a particular service provider to
others based upon the conscious evaluation of
brand attributes.
Jones and Taylor (2007) affirmed that advanced
literature has proposed loyalty to be a three
dimensional construct as the resultant outcomes of
loyalty can broadly be classified into behavioural,
attitudinal and cognitive loyalty. The following
section enlists these outcomes of customer loyalty
as identified through extensive survey of literature:
Jones and Taylor (2007) noticed that the
behavioural outcomes including repeat buying
intentions or customers' chain buying behaviour
has been the focus of initial researches in the area of
service loyalty. Reichheld (1994) asserted that the
reason behind most of the customer loyalty
researches considering customer retention as a
proxy for loyalty is that retention can be calculated
and a precise net present value can be obtained.
Behavioural outcomes of loyalty include:
i) Repurchasing from the same service provider
(Zeithaml et al., 1996; Jones et al., 2000),
ii) Lower switching intentions (Bansal and Taylor,
1999; Dabholkar and Walls, 1999), and
iii) Making all purchases in a particular category
from a single service provider (Reynolds and
Beatty, 1999; Reynolds and Arnold, 2000).
Dick and Basu (1994); Pritchard et al. (1999) found
that loyalty can be seen not only in its behavioural
manifestations but in the attitudinal dispositions
towards a service provider. Jones and Taylor (2007)
argued that relative attitude (an emotions based
assessment of the brand) has mostly been put
across as following:
i) Recommending the service provider to others
(Butcher et al., 2001; Javalgi and Moberg, 1997),
ii) Strong preference to the service provider (Mitra
and Lynch, 1995),
1. Behavioural Loyalty
2. Attitudinal Loyalty
Customer Loyalty Attributes: A Perspective

64ISSN: 0971-1023NMIMS Management ReviewVolume XXII October - November 2012
iii) Feeling a sense of affiliation with the product,
service, or organization (Fournier, 1998), and
iv) Altruistic behaviour which includes helping the
service provider or other customers for better
service delivery (Patterson and Ward, 2000;
Price et al., 1995).
Bloemer et al. (1999); de Ruyter et al. (1998); Oliver
(1999) confirmed cognitive loyalty as another form
of loyalty. Lee and Cunningham (2001) described
cognitive loyalty as a conscious assessment of a
brand and its attributes or a conscious assessment
of the advantages and incentives of repurchasing
which as suggested by Dwyer et al. (1987), makes
customers deem a particular service provider to be
superior to others. Jones and Taylor (2007)
reviewed that loyalty based upon the cognitive
judgement of the customers is expressed in the
following ways:
i) Occupying a prominent space in the mind of the
customer (Dwyer et al., 1987),
ii) Being the first preference of the customer
(Ostrowski et al., 1993),
iii) Lesser sensitivity towards price fluctuation
(Anderson, 1996; de Ruyter et al., 1998),
iv) Considering a service provider exclusively for a
particular service (Gremler and Brown, 1996),
and
v) Identifying a service provider as an extension of
one's self and accepting this by using terms such
as “my service provider”, or by including oneself
with the service provider and referring
collectively with “us” and “we”. (Butcher et al.,
2001).
Above mentioned literature substantiates the
distinct forms that outcomes of customer loyalty
can take. The functional relationships between
3. Cognitive Loyalty
customer loyalty and its outcomes are as follows:
CL = f (BO, AO, CO)
= P + p BO + p AO + p CO
CL = f (RI, SI, EI)
= A + a RI + a SI + a EI
CL = f (RA, WR, A)
= B + b RA + b WR + b A
CL = f (WP, EC, I)
= C + c WP + c EC + c I
Where, P, A, B and C represent the constant values
whereas p p a a b b and c c are the relative
weights of variables accompanying them.
CL = Overall Customer Loyalty, BO = Behavioural
Outcomes, AO = Attitudinal Outcomes, CO =
Cognitive Outcomes
CL = Behavioural Loyalty, RI = Repurchase
Intentions, SI = Switching Intentions, EI = Exclusive
Intentions
CL = Attitudinal Loyalty, RA = Relative Attitude, WR
= Willingness to Recommend, A = Altruism
CL = Cognitive Loyalty, WP = Willingness to pay
more, EC = Exclusive Consideration, I =
Identification
The above illustrated relationships between
customer loyalty and its outcomes hold significance
for the marketers intending to design fruitful loyalty
programs. With an understanding of the various
sets of outcomes of customer loyalty, marketers can
effectively segment their customers based upon the
type of loyalty they exhibit and thereby, design
effective loyalty programs to enrich and reinforce
the existing loyalty.
o
1 2 3
b
1 2 3
a
1 2 3
c
1 2 3
1... 3, 1... 3, 1... 3 1... 3
o
b
a
c
Customer Loyalty Attributes: A Perspective
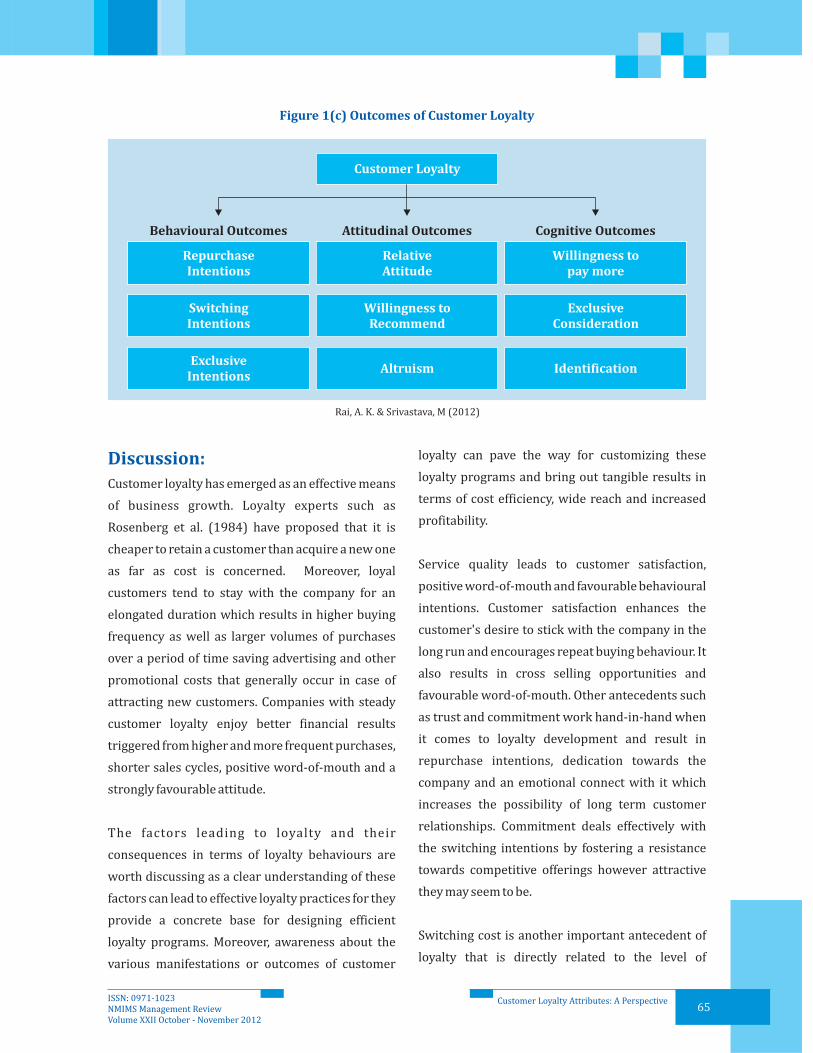
65ISSN: 0971-1023NMIMS Management ReviewVolume XXII October - November 2012
Figure 1(c) Outcomes of Customer Loyalty
Customer Loyalty
Behavioural Outcomes Attitudinal Outcomes Cognitive Outcomes
Repurchase
Intentions
Switching
Intentions
Exclusive
Intentions
Relative
Attitude
Willingness to
Recommend
Altruism
Willingness to
pay more
Exclusive
Consideration
Identification
Rai, A. K. & Srivastava, M (2012)
Discussion:
Customer loyalty has emerged as an effective means
of business growth. Loyalty experts such as
Rosenberg et al. (1984) have proposed that it is
cheaper to retain a customer than acquire a new one
as far as cost is concerned. Moreover, loyal
customers tend to stay with the company for an
elongated duration which results in higher buying
frequency as well as larger volumes of purchases
over a period of time saving advertising and other
promotional costs that generally occur in case of
attracting new customers. Companies with steady
customer loyalty enjoy better financial results
triggered from higher and more frequent purchases,
shorter sales cycles, positive word-of-mouth and a
strongly favourable attitude.
The factors leading to loyalty and their
consequences in terms of loyalty behaviours are
worth discussing as a clear understanding of these
factors can lead to effective loyalty practices for they
provide a concrete base for designing efficient
loyalty programs. Moreover, awareness about the
various manifestations or outcomes of customer
loyalty can pave the way for customizing these
loyalty programs and bring out tangible results in
terms of cost efficiency, wide reach and increased
profitability.
Service quality leads to customer satisfaction,
positive word-of-mouth and favourable behavioural
intentions. Customer satisfaction enhances the
customer's desire to stick with the company in the
long run and encourages repeat buying behaviour. It
also results in cross selling opportunities and
favourable word-of-mouth. Other antecedents such
as trust and commitment work hand-in-hand when
it comes to loyalty development and result in
repurchase intentions, dedication towards the
company and an emotional connect with it which
increases the possibility of long term customer
relationships. Commitment deals effectively with
the switching intentions by fostering a resistance
towards competitive offerings however attractive
they may seem to be.
Switching cost is another important antecedent of
loyalty that is directly related to the level of
Customer Loyalty Attributes: A Perspective
66ISSN: 0971-1023NMIMS Management ReviewVolume XXII October - November 2012
satisfaction among the customers. Corporate image
of a company affects the concept of image
congruence and encourages repeat patronage.
Service failures can be managed but can't be
stopped completely. Service recovery, though
designed to tackle failure, can win customers back
with greater level of satisfaction and trust. If
managed appropriately, service recovery can lead to
positive behavioural intentions and reduce the
switching intentions. Emotions are an inseparable
and powerful part of any customer experience.
Positive handling of emotions results in favourable
behaviours such as repeat visit, repurchase and
recommendation. Communication is the most vital
part of any relationship whether inter-personal or
business. It helps in creating awareness and enables
decision making in favour of the company.
Customer satisfaction and loyalty strongly influence
the process of acquiring new customers. Positive
word-of-mouth from the existing customers may
increase the company's revenues greatly but
negative feedback from the same customers may
also ruin the profits and prospects for the company.
A satisfied customer shares his consumption
experience with 3 people on an average whereas, a
dissatisfied customer does the same thing and the
number of people may range anywhere from 8 to 16
on an average. The negative impact a dissatisfied
customer may leave on existing as well as potential
customers of the company is significant.
A customer can express his degree of loyalty
towards a service provider by either displaying a
positive attitude or indulging in favourable actions
or making conscious evaluations and finding a
particular service worth sticking to.
Behavioural loyalty is generally seen in the form of
repurchase intentions, low level of inclination
towards switching and exclusive intentions. On the
other hand, attitudinal loyalty is based upon the
strength of preference and willingness to
recommend. Cognitive outcomes of loyalty are
characterized by the customer's consideration of a
service provider above others in the same category
stemmed from his evaluation of the benefits
associated with continued patronage.
The above mentioned literature and findings call for
the establishment of a research question pertaining
to a comprehensive model for comprehension and
elaboration of the assessment of customer loyalty
and resultant behaviours.
The study intends to provide a framework for:
• Development of a scale for assessing customer
loyalty.
Identifying the impact of a particular class of
loyalty in terms of its contribution to the
organization.
The above identified framework would prove to
be of great significance for service organizations
in appraising different loyalty programs and also
in segmenting customers depending upon
organizational requirements.
Survival and growth of a company in today's
complex business environment characterized with
ever-increasing competition and entry of new
market forces demand a broad vision as well as
strong strategies directed at customer relationship
management. Companies need to understand and
assess the potential of retaining customers in the
long run and make customer centricity a focal point
•
•
Significance of the Study:
Implications
Customer Loyalty Attributes: A Perspective

67ISSN: 0971-1023NMIMS Management ReviewVolume XXII October - November 2012
of all business activities. Losing a customer not only
results in decreased revenues but also acts as a
warning for the company. While difficult economic
conditions may pose challenges for the company,
what matters is how the company deals with them;
the company may either locate opportunities in
these conditions or lapse in the turbulent waters. To
strengthen its position in the market and achieve
better growth rate, a company needs to foster trust
among its target audience, offer products and
services with significant differentiation and
understand customers' expectations.
This study bears important implications for
managers as it brings to light the antecedents as
well as outcomes of customer loyalty. With
heightened use of technology in service delivery,
little scope for differentiation is left. A service firm's
approach to customer relationship is what singles it
out against competitors. Customer loyalty has
become the new mantra for sustained growth and
profitability. It is important to understand and
communicate with the staff about the role customer
loyalty can play in the long term interest of business.
Service personnel should be educated and trained
for comprehending and managing customers'
expectations with the right attitude. Further, the
antecedents of loyalty can serve as an effective base
of brand building strategies. A careful analysis will
reveal the factors a service firm lacks in terms of
loyalty thereby enabling the managers to rectify the
situation with appropriate loyalty building
practices. Managers can develop loyalty programs
specifically designed for different loyalty groups as
per the loyalty outcomes and work upon enhancing
the existing level of customer loyalty.
Scope for Future Studies
This study presents a universal set of factors leading
to customer loyalty on the basis of an extensive
survey of literature. Future research could focus
upon identifying and testing the context specific
antecedents of customer loyalty. Distinct markets
and consumer groups with varying psychographic
characteristics may display different loyalty
attitudes and behaviours driven by various
combinations of loyalty antecedents. It would be
interesting to find out industry specific set of factors
that determine loyalty.
Further, the antecedents and their relationships
with customer loyalty need to be tested statistically
in order to establish their validity. Different factors
exert varying levels of influence over loyalty.
Determining their weight in overall loyalty
assessment would be a significant contribution in
the body of customer loyalty literature.
Each of these antecedents shares a connection with
others in the group. For example, customer
satisfaction is often seen as a consequence of
maintaining good product quality. Similarly, service
recovery affects a customer's switching intentions
to a considerable extent. Future research may test
and establish the relationship between various
antecedents of loyalty and their relative importance
in the overall loyalty score of a company.
Customer Loyalty Attributes: A Perspective

68ISSN: 0971-1023NMIMS Management ReviewVolume XXII October - November 2012
1. Abdullah, M., Alnasser, A., Aamjad, D. & Husain, N. (2000). Evaluating functional relationship
between image, customer satisfaction and customer loyalty using general maximum entropy.
, 1 (4 – 6), 826 – 30.
2. Allen, C.T., Machleit, K.A., Kleine, S.S. (1992). A comparison of attitudes and emotions as predictors of
behavior at diverse levels of behavioral experience. Journal of Consumer Research, 18, 493-504.
3. Anderson, E. W. and V. Mittal (2000). Strengthening the Satisfaction-Profit Chain. Journal of Service
Research, 3 (2), 107.
4. Anderson, E. W., Fornell, C. & Lehmann, D. R. (1994). Customer Satisfaction, Market Share, and
Profitability: Findings from Sweden. Journal of Marketing, 58, 4, 53-66.
5. Anderson, Erin W. and Mary Sullivan. (1993). The Antecedents and Consequences of Customer
Satisfaction for Firms. Marketing Science, 12, 125–143.
6. Anderson, Eugene W. (1996). Customer Satisfaction and Price Tolerance. Marketing Letters, 7 (3),
256-274.
7. Anderson, J.C. & Narus, J. (1990). A model of distributor firm and manufacturer firm working
partnerships. Journal of Marketing, 48 (Fall), 62-74.
8. Andreassen, T.W. and Lindestad, B. (1997). Customer Loyalty and Complex Services: The Impact of
Corporate Image on Quality, Customer Satisfaction and Loyalty for Customers with Varying Degrees of
Service Expertise. The International Journal of Service Industry Management, 8 (4). Retrieved from
http://www.kundebarometer.com/discourse/cicscann.pdf on 10th Oct. 12.
9. Andreassen, T.W. and Lindestad, B. (1998). Customer loyalty and complex services. International
Journal of Service Industry Management, 9 (1), 7-23.
10. Andreassen, W.T. (1999). What drives customer loyalty with complaint resolution? Journal of Service
Research, 1 (4).
11. Asuncion, B., Martin, D.J. & Quintana, A. (2004). Model of customer loyalty in the retail banking
market. European Journal of Marketing, 38(1), 253-275.
12. Athanassopoulos, A. D. (2000). Customer Satisfaction Cues to Support Market Segmentation and
Explain Switching Behavior. Journal of Business Research, 47, 191-207.
13. Aydin, S. & Ozer, G. (2005). The analysis of antecedents of customer loyalty in the Turkish mobile
telecommunication market. European Journal of Marketing, 39 (7/8), 910-925.
14. Bagozzi, R et al. (1999). The role of emotions in marketing. Journal of the Academy of Marketing Science,
27 (2), 184-206.
15. Bagozzi, R. P., Wong, N., & Yi, Y. (1999). The role of culture and gender in the relationship between
positive and negative affect. Cognition and Emotion, 13, 641-672.
16. Ball, D. and Coelho P.S. and Macha´s, A. (2004). The role of communication and trust in explaining
customer loyalty: An extension to the ECSI model. European Journal of Marketing, 38 (9/10), 1272-
1293.
17. Ball, D., Coelho, P. and Machás, A. (2003). The role of communication and trust in explaining
customer loyalty: An extension to the ECSI Model. European Journal of Marketing, 38 (9/10), 1272-
1293.
18. Bansal, H.S. & Taylor, S.F. (1999). The service provider switching model (SPSM): a model of consumer
switching behaviour in the service industry. Journal of service Research, 2 (2), 200- 218.
19. Barich, H. and Kotler, P. (1991). A framework for marketing image management. Sloan Management
Total
Quality Management
References
Customer Loyalty Attributes: A Perspective

69ISSN: 0971-1023NMIMS Management ReviewVolume XXII October - November 2012
Review, 32 (2), 94-104.
20. Barsky, J.D. (1992). Customer Satisfaction in the Hotel Industry: Meaning and Measurement. Hospitality
Research Journal, 16 (1), 51-73.
21. Bearden, W.O. and Teel, J.E. (1983). Selected determinants of consumer satisfaction and complaint
reports. Journal of Marketing Research, 20, 21-8.
22. Beatty, S.E., L.R. Kahle, and P. Homer (1988). The Involvement-Commitment Model: Theory and
Implications. Journal of Business Research, 16 (2), 149-167.
23. Bendapudi, N. and Berry, L.L. (1997). Customers' motivations for maintaining relationships with
service providers. Journal of Retailing, 73 (1), 15-37.
24. Besterfield, D.H. (1994), Quality Control, Prentice- Hall, Englewood Cliffs, NJ Claes-Robert Julander and
Magnus Soderlund Ragnar (2003). Effects of Switching Barriers on Satisfaction, Repurchase Intentions
and Attitudinal Loyalty. SSE/EFI Working Paper Series in Business Administration. No.2003:1.
25. Bharadwaj, S.G., P., Varadarajan, R., and Fahy, J. (1993). Sustainable Competitive Advantage in Service
Industries: A Conceptual Model and Research Propositions. Journal of Marketing, 57 (October), 83-99.
26. Bitner, M.J. (1990). Evaluating service encounters: the effects of physical surroundings and employee
responses. Journal of Marketing, 54, 69-82.
27. Bloemer, J., Ruyter, K. and Wetzels, M. (1998). On the relationship between perceived service quality,
service loyalty and switching costs. International Journal of Industry Management, 9 (5), 436-53.
28. Bloemer, Josee, Ko de Ruyter, and Martin Wetzels (1999). Linking perceived service quality and
service loyalty: a multi-dimensional perspective. European Journal of Marketing, 33 (11/12), 1082-
106.
29. Boshoff, C. (1997). An experimental study of service recovery options. International Journal of Service
Industry Management, 8 (2), 110-130.
30. Boshoff, C. (1999). RECOVSAT: an instrument to measure satisfaction with transaction-specific service
recovery. Journal of Service Research, 1(3), 236-49.
31. Boshoff, C., & Staude, G. (2003). Satisfaction with service recovery: Its measurement and its outcomes.
South African Journal of Business Management, 34 (3), 9-16.
32. Bowen, J. T., & Shoemaker, S. (1998). Loyalty: A strategic commitment. Cornell Hotel and Restaurant
Administration Quarterly, 39 (1), 12-25.
33. Brady, M. K., Knight, G. A., Cronin Jr. J. Toma, G., Hult, M. and Keillor, B. D. (2005). Removing the Contextual
Lens: A Multinational, Multi-setting Comparison of Service Evaluation Models. Journal of Retailing, 81
(3), 215 – 230.
34. Burnham, T.A., Frels, J.K. and Mahajan, V. (2003). Consumer switching costs: a typology, antecedents and
consequences. Journal of The Academy of Marketing Science, 31 (2), 109-26.
35. Butcher, K. (2001). Evaluative and relational influences on service loyalty. International Journal of
Service Industry Management, 12 (4), 310-327.
36. Butcher, Ken, Beverley Sparkes, and Frances O'Callaghan (2001). Evaluative and relational influences
on service loyalty. International Journal of Service Industry Management, 12 (4), 310-27.
37. Caruana, A. (2002). Service loyalty. The effects of service quality and the mediating role of customer
satisfaction. European Journal of Marketing, 36 (7/8), 811-828.
38. Chaudhuri, A. and Holbrook, M.B. (2001). The chain effects from brand trust and brand affect to brand
performance: the role of brand loyalty. Journal of Marketing, 65 (April), 31-93.
39. Chiou, J. S., Droge C., and Hanvanich S., (2002). Does Customer Knowledge Affect How Loyalty is
Formed? Journal of Service Research, 5 (2), 113-124.
Customer Loyalty Attributes: A Perspective

70ISSN: 0971-1023NMIMS Management ReviewVolume XXII October - November 2012
40. Chiung-Ju Liang, Wen-Hung Wang, (2007). The behavioral sequence of information education
services industry in Taiwan: relationship bonding tactics, relationship quality and behavioral loyalty.
Measuring Business Excellence, 11(2), 62 - 74
41. Colgate, M. and Norris, M. (2001). Developing a comprehensive picture of service failure. International
Journal of Service Industry Management, 12 (¾), 215-34.
42. Coyne, K. P (1989). Beyond service fads: Meaningful strategies for the real world. Sloan Management
Review, 30, 69-76.
43. Craighead, C., Karwan, K., & Miller, J. (2004). The effects of severity of failure and customer loyalty on
service recovery strategies. Production and Operations Management, 13 (4), 307-321.
44. Cronin, J. and Taylor, S. (1992). Measuring service quality: A reexamination and extension,
, 56 (3), 55 – 68.
45. Cronin, J.J., Brady, M.K., & Hult, G.T.M. (2000). Assessing the effects of quality, value, and customer
satisfaction on consumer behavioral intentions in service environments. Journal of Retailing, 76 (2),
193-218.
46. Dabholkar, Pratibha A. and Simon Walls (1999). Service Evaluation and Switching Behavior for
Experiential Services: An Empirical Test of Gender Differences within a Broader Conceptual
Framework. Journal of Consumer Satisfaction, Dissatisfaction and Complaining Behaviour, 12, 123-
137.
47. Day, G. S. (1969). A two-dimensional concept of brand loyalty. Journal of Marketing Research, 9, 29 – 36.
48. Dick, A. S.and Basu, K. (1994). Customer Loyalty: Toward an Integrated Conceptual Framework.
, 22, 99-113.
49. Doney, P. M. and Cannon, J. P. (1997). An Examination of the Nature of Trust in Buyer-Seller Relationship.
Journal of Marketing, 61, 35-51.
50. Doyle, P. and Fenwick, I. (1974). Shopping habits in grocery chains. Journal of Retailing, 50, 39-52.
51. Duffy, J. A. M., Miller, J. M., Bexley, J. B. (2006). Banking customers' varied reactions to service recovery
strategies. International Journal of Bank Marketing, 24 (2), 112-132.
52. Dwyer FR, Schurr PH, Oh S (1987). Developing Buyer-Seller Relationships. Journal of Marketing, 51,
11–27.
53. Eber, N. (1999). Switching costs and implicit contracts. Journal of Economics, 69 (2), 159-71.
54. Feick, L., Lee, J. and Lee, J. (2001). The impact of switching costs on the customer satisfaction-loyalty
link: mobile phone service in France. Journal of Services Marketing, 15, (1), 35-48.
55. Fishbein, M. and Ajzen, I. (1975). Belief, Attitude, Intention, and Behavior: An Introduction to Theory
and Research, Addison-Wesley, Reading, MA.
56. Fogli, L. (2006). Customer Service Delivery, San Francisco: Jossey-Bass.
57. Fornell C, Johnson MD, Anderson EW, Cha J, Bryant BE (1996). The American customer satisfaction
index: nature, purpose, and findings. Journal of Marketing, 60, 7-18.
58. Fornell, C. (1992). A national customer satisfaction barometer: the Swedish experience. Journal of
Marketing, 56, 6-21.
59. Foster, B.D. and Cadogan, J.W. (2000). Relationship selling and customer loyalty: an empirical
investigation. Marketing Intelligence and Planning, 18 (4), 185-99.
60. Fournier, S. (1998). Consumers and their brands: Developing relationship theory in consumer
research. Journal of Consumer Research, 24 (4), 343 – 373.
61. Garbarino, E. and Johnson, M.S. (1999). The different roles of satisfaction, trust, and commitment in
customer relationships. Journal of Marketing, 63, 70-87.
Journal of
Marketing
Journal
of the Academy of Marketing Science
Customer Loyalty Attributes: A Perspective

71ISSN: 0971-1023NMIMS Management ReviewVolume XXII October - November 2012
62. Geyskens I., Steenkamp J. E. M., Scheer L. K., and Kumar N. (1996). The effects of trust and
interdependence on relationship commitment: A trans-Atlantic study. International Journal of
Research in Marketing, 13 (4), 303-15.
63. Giese, J. L. and Cote, J. A. (2000). Defining customer satisfaction. Academy of Marketing Science Review,
1, 1-59.
64. Gremler, D.D. and Brown, S.W. (1996). “Service loyalty: its nature, importance, and implications”, in
Edvardsson, B., Brown, S.W., Johnston, R. and Scheuing, E. (Eds), QUIS V: Advancing Service Quality: A
Global Perspective, International Service Quality Association, New York, NY, 171-80.
65. Gro¨nroos, C. A. (1988). Service quality: the six criteria of good perceived service quality. Review of
Business, 9 (3), 10–13.
66. Grönroos, C. (1983). “Seven key areas of research according to the Nordic School of Service Marketing”,
In Berry, L. Shotack, G.L. and Upah, G.D. (Eds), Emerging Perspectives on Services Marketing, American
Marketing Association, Chicago, 108-110.
67. Gundlach, G. T., Achrol, R. S., and Mentzer, J. T. (1995). The structure of commitment in exchange, Journal
of Marketing, 59, 78-92
68. Halstead, D., Hartman, D. and Schmith, S.L. (1994). Multisource effects on the satisfaction formation
process. Journal of the Academy of Marketing Science, 22 (2), 114-29.
69. Hart, C. W. L., Heskett, J. L., & Sasser, W. E. J. (1990). The profitable art of service recovery. Harvard
Business Review, 68 (July-August), 148-156.
70. Hauser, J. R., Simester, D. I. and Wernerfelt, B. (1994). Customer satisfaction incentives, Marketing
Science, 13 (4), 327-50.
71. Hays, J. M. and A. V. Hill (1999). The Market Share Impact of Service Failures. Production and Operations
Management, 8 (3), 208–220.
72. Hellier, P. K. ,Geursen, G. M., Carr, R. A. & Rickard, J. A. (2003). Customer repurchase intention: A
general structural equation model. European Journal of Marketing, 37(11/12), 1762-1800.
73. Heskett, J. L., Sasser, Jr. W. E., & Schlesinger, L. A. (1994). The service profit chain, New York: The Free
Press.
74. Izard, C. E. (1977), Human Emotions, Plenum Press, New York, NY.
75. Jackson, B. B. (1985). Building Customer Relationship. Last Harvard Business Review, (Nov/Dec), 120-
128.
76. Jacoby, Jacob and David B. Kyner (1973). Brand Loyalty Vs. Repeat Purchasing Behavior. Journal of
Marketing Research, 10 (1), 1-9.
77. Jaishankar Ganesh, Mark J Arnold, Kristy E Reynolds (2000). Understanding the customer base of
service providers: An examination of the differences between switchers and stayers. Journal of
Marketing, (Jul), 65.
78. James, D.L., Durand, R.M. and Dreves, R.A. (1976). The use of a multi-attributes attitudes model in a
store image study. Journal of Retailing, 52, 23-32.
79. Javalgi, RG and CR Moberg (1997). Service loyalty: implications for service providers. The Journal of
Services Marketing 11 (3), 165-179.
80. Jennifer Rowley, Jillian Dawes, (1999). Customer loyalty – a relevant concept for libraries? Library
Management, 20 (6), 345 - 351
81. Johnson, M.D., Gustafsson, A., Andreassen, T.W., Lervik, L. and Cha, J. (2001). The evolution and future of
national customer satisfaction index models. Journal of Economic Psychologyy, 22, 217-45.
82. Johnson, Michael D., Andreas Herrmann, and Frank Huber (2006). The Evolution of Loyalty Intentions.
Customer Loyalty Attributes: A Perspective

72ISSN: 0971-1023NMIMS Management ReviewVolume XXII October - November 2012
Journal of Marketing, 70 (April), 122–32.
83. Johnston, R. (2005). Service failure and recovery: impact, attributes and process. Advances in services
Marketing and Management: Research and Practice, 4, 221 – 228.
84. Jones, M.A., Beatty, S.E. and Mothersbaugh, D.V. (2000). Switching barriers and repurchase intentions in
services. Journal of Retailing, 76 (2), 259-74.
85. Jones, M.A., Beatty, S.E. and Mothersbaugh, D.V. (2002). Why customers stay: measuring the underlying
dimensions of services switching costs and managing their differential strategic outcomes. Journal of
Business Research, 55, 441-50.
86. Jones, T. O and Sasser, W. E (1995). Why satisfied customers defect. Harvard Business Review, 73
(November/December), 88–99.
87. Kandampully, J. and Hu, H. (2007). Do hoteliers need to manage image to retain loyal customers?
International Journal of Contemporary Hospitality Management, 19 (6), 435-443.
88. Kanji, G. and Moura, P. (2002). Kanji's Business Scorecard. Total Quality Management, 13 (1), 13-27.
89. Keaveney, Susan M. (1995). Customer switching behavior in service industries: an exploratory study.
Journal of Marketing, 59, 71-82.
90. Klemperer, P. (1987). Markets with consumer switching costs. The Quarterly Journal of Economics. 102,
376-94.
91. Knox, S. & Walker, D. (2001). Measuring and Managing Brand Loyalty. Journal of Strategic Marketing, 9,
111-128.
92. Ko de Ruyter, Martin Wetzels, & Josée Bloemer, (1998). On the relationship between perceived
service quality, service loyalty and switching costs. International Journal of Service Industry
Management, 9(5), 436-453.
93. Kon,M. (2004). Customer Churn, Stop it before it starts. Mercer Management Journal, 17, 54-60.
94. Kunkel, J.H. and Berry, L.L. (1968). A behavioral conception of retail image. Journal of Marketing, 32, 21-
7.
95. LaBarbera, P.A. and Mazursky, D. (1983). A longitudinal assessment of consumer
satisfaction/dissatisfaction. Journal of Marketing Research, 20, 393-404.
96. Laverie, D. A., Kleine, R. E., & Kleine, S. S. (1993). Linking emotions and values in consumption
experiences: An exploratory study. Advances in Consumer Research, 20, 70-75.
97. Lee, M., & Cunningham, L. F. (2001). A cost/benefit approach to understanding service loyalty.
Journal of Services Marketing, 15(2), 113–130.
98. Levesque, T. and McDougall, G.H.C. (1996). Determinants of customer satisfaction retail banking.
International Journal of Bank Marketing, 14 (7), 12-20.
99. Liljander, V. and Strandvik, T. (1997). Emotions in service satisfaction. International Journal of Service
Industry Management, 8 (2), 148-69.
100. Lim, K.G., Thompson, S.H., & Sook Hat, W. (1997). “Working at home- myth or reality: An empirical study
of factors affecting attitudes towards teleworking”, Research Paper Series. Singapore: Faculty of
Business Administration. National University of Singapore.
101. Majumdar, A. (2005). A model for customer loyalty for retail stores inside shopping malls - An Indian
perspective. Journal of Services Research - Special Issue, December, 47-64.
102. Mano, H., and R. Oliver (1993). Assessing the Dimensionality and Structure of the Consumption
Experience: Evaluation, Feeling and Satisfaction. Journal of Consumer Research, 20, 451–466.
103. Mattila, A. S., & Patterson, P. G. (2004). Service recovery and fairness perceptions in collectivists and
individual contexts. Journal of Service Research, 6 (4), 336-346.
Customer Loyalty Attributes: A Perspective

73ISSN: 0971-1023NMIMS Management ReviewVolume XXII October - November 2012
104. Mattila, A.S. (2001). The impact of relationship type on customer loyalty in a context of service failures.
Journal of Service Research, 4(2), 91-101.
105. McAlexander JH, Kaldenberg DO, Koenig HF (1994). Service quality measurement. Journal of Health
Care Marketing, 14 (3), 34 –9.
106. McCollough, M. A., Berry, L. L., & Yadav, M. S. (2000). An empirical investigation of customer satisfaction
after service failure and recovery. Journal of Service Research, 3 (2), 121-137.
107. McDougall, G. H. G., and T. Levesque (2000). Customer satisfaction with services: putting perceived
value into the equation. Journal of Services Marketing 14 (5), 392–410.
108. McMullan, R (2005). A multiple-item scale for measuring customer loyalty development. Journal of
Services Marketing, 19 (7), 470–481.
109. McMullan, R., & Gilmore, A. (2003). The conceptual development of customer loyalty measurement: A
proposed scale. Journal of Targeting, Measurement and Analysis for Marketing, 11 (3), 230-243.
110. Miller, J. L., Craighead, C. W., and Karwan, K. R. (2000). Service recovery: A framework and empirical
investigation. Journal of Operations Management, 18, 387–400.
111. Mitra, A. and Lynch, J. (1995). Toward a reconciliation of market power and information theories of
advertising effects on price elasticity. Journal of Consumer Research, 21(4), 644-60.
112. Moorman C, Deshpande´ R, Zaltman R (1993). Factors affecting trust in market research relationships.
Journal of Marketing, 57 (1), 81-101.
113. Morgan, Robert M. and Shelby D. Hunt (1994). The Commitment- Trust Theory of Relationship
Marketing. Journal of Marketing, 58 (July), 20-38.
114. Ndubisi, N.O. and K.W. Chan (2005). Factorial and Discriminant Analyses of the Underpinnings of
Relationship Marketing and Customer Satisfaction. International Journal of Bank Marketing, 23 (3),
542-557.
115. Newman, J.W. and Werbel, R.A. (1973). Multivariate analysis of brand loyalty for major household
appliances. Journal of Marketing Research, 10, 404-09.
116. Nguyen, N. and Leblanc, G. (2001). Corporate image and corporate reputation in customers' retention
decisions in services. Journal of Retailing and Consumer Services, 8 (4), 227-236.
117. O'Neill, M. (1992). Service Quality Management in Hospitality, Tourism and Leisure, The Haworth
Hospitality Press, New York.
118. Oliver RL, Roland TR, Sajeev V (1997). Customer delight: Foundations, findings, and managerial
insight. Journal of Retailing, 311-336.
119. Oliver, R. L. (1993). Cognitive, affective, and attribute bases of the satisfaction response. Journal of
Consumer Research, 20 (3), 418-430.
120. Oliver, R. L. (1999). Whence customer loyalty? Journal of Marketing. 63. 33–44.
121. Oliver, R.L. (1996). Satisfaction: A Behavioural Perspective on the Consumer. McGraw-Hill, New York,
NY.
122. Oliver, R.L. (1997). Loyalty and profit: long-term effects of satisfaction. Satisfaction: A Behavioural
Perspective on the Consumer, McGraw-Hill Companies, Inc., New York, NY.
123. Oliver, R.L. and G. Linda (1981). Effect of Satisfaction and its Antecedents on Consumer Preference
and Intention. Advances in Consumer Research, 8, 88-93.
124. Ostrowski, P.L., O'Brien, T. and Gordon, G.L. (1993). Service quality and customer loyalty in the
commercial airline industry. Journal of Travel Research, 32(2), 16-24.
125. Palmer, J. W.; Bailey, J. P.; and Faraj, S. (2000). The Role of Intermediaries in the Development of Trust on
the WWW: The Use and Prominence of Trusted Third Parties and Privacy Statements. JCMC, 5 (3).
Customer Loyalty Attributes: A Perspective

74ISSN: 0971-1023NMIMS Management ReviewVolume XXII October - November 2012
126. Papadopoulou, P., Andreou, A., kanellis, P. and Martakos, D. (2001). Trust and relationship building in
electronic commerce. Internet Research: Electronic Networking and Policy, 11 (4), 322-332.
127. Parasuraman, A., Zeithaml, V. A. & Berry, L. L. (1988). SERVQUAL: a multiple-item scale for measuring
consumer perceptions of service quality. Journal of Retailing, 64 (Spring), 12-40.
128. Parasuraman, A., Zeithaml, V., and Berry, L. (1985). A conceptual model of service quality and its
implications for future research. , 49 (4), 41 – 50.
129. Parasuraman, A., Zeithaml, V.A., & Berry, L.L. (1994). Reassessment of expectations as a comparison
standard in measuring service quality: Implications for future research. Journal of Marketing, 58 (1),
111–124.
130. Patterson, P. G., Ward, T. (2000). Relationship marketing and management. In: Swartz, T., Iacobucci,
D. (Eds.), Handbook of Services Marketing and Management. Sage Publications, Thousand Oaks,
Calif, 317-342.
131. Pavlou, P.A. (2003). Consumer acceptance of electronic commerce-integrating trust and risk with the
technology acceptance model. International Journal of Electronic Commerce, 7 (3), 101-134.
132. Porter, M. (1998). Competitive Strategy: Techniques for Analyzing Industries and Competitors, The
Free Press, New York, NY.
133. Price, L.L., Arnould, E.J. and Thierney, P. (1995). Going to extremes: managing services encounters
and assessing provider performance. Journal of Marketing, 59, 83-97.
134. Prichard, M., Havitz, M., & Howard, D. (1999). Analyzing the commitment-loyalty link in service
contexts. Journal of the Academy of Marketing Science, 27 (3), 333-348.
135. Ranaweera, C. and Prabhu, J. (2003). The influence of satisfaction, trust and switching barriers on
customer retention in a continuous purchasing setting. International Journal of Service Industry
Management, 14 (4), 374-395.
136. Ranaweera, C., & Neely, A. (2003), “Some moderating effects on the service quality customer retention
link: Mobile phone service in France”, International Journal of Operations and Production
Management, 23 (2), 230–248.
137. Reichheld F, Sasser EW Jr (1990). Zero defections: Quality comes to services. Harvard Business Review,
68 (5), 105-111.
138. Reichheld, F. F. (2001). Loyalty Rules! How Today's Leaders Build Lasting Relationships, Boston,
Massachusetts: Harvard Business School Press.
139. Reichheld, F.F. (1993). Loyalty-based management. Harvard Business Review, 71 (March- April), 64-73.
140. Reichheld, Frederick F. (1994). Loyalty and the renaissance of marketing, Marketing Management, 2
(4), 10.
141. Reynolds, F.D., Darden, W.R. and Martin, W.S. (1974-75). Developing an image of the store loyal
customer. Journal of Retailing, 50 (4), 73-84.
142. Reynolds, K.E., Arnold, M. (2000). Customer Loyalty to the Salesperson and the Store: Examining
Relationship Customers in an Upscale Retail Context. Journal of Personal Selling & Sales
Management, 20(2), 89-98.
143. Reynolds, Kristy E. and Sharon E. Beatty (1999). Customer Benefits and Company Consequences of
Customer-Salesperson Relationships in Retailing. Journal of Retailing, 75 (1), 11–32.
144. Robbins, T. L., Miller, J. L. (2004). Considering customer loyalty in developing service recovery
strategies. Journal of Business Strategies, 21, 95-109.
145. Roos, Inger (1999 a). Switching Processes in Customer Relationships. Journal of Service Research, 2 (1),
68-85.
Journal of Marketing
Customer Loyalty Attributes: A Perspective
75ISSN: 0971-1023NMIMS Management ReviewVolume XXII October - November 2012
146. Rosenberg, L., Czepiel, J.A. (1984). A Marketing Approach to Customer Retention. Journal of
Consumer Marketing, 1, 45–51.
147. Rousseau, D., Sitkin, M., Burt, R., & Camerer, C. (1998). Not so different after all: A cross-discipline view
of trust. Academy of Management Review, 23 (3), 393-404.
148. Rowley, J. (2005). The Four Cs of Customer Loyalty. Marketing Intelligence and Planning, 23 (6), 574-
581.
149. Rust, R.T. and Oliver, R.L. (1994). “Service quality: insights and managerial implications from the
frontier'', in Rust, R.T. and Oliver, R.L. (Eds), Service Quality: New Directions in Theory and Practice,
Sage, London, 1-19.
150. Sharma, N. (2003). The role pure and quasi-moderators in services: an empirical investigation of
ongoing customer-service-provider relationships. Journal of Retailing and Consumer Services, 10 (4),
253-62.
151. Sheth, Jagdish N. and Atul Parvatiyar (1995). Relationship Marketing in Consumer Markets:
Antecedents and Consequences. Journal of the Academy of Marketing Science, 23 (Fall), 255-71.
152. Simon, J. B., Seigyoung, A., & Karen, S. (2005). Customer relationship dynamics: service quality and
customer loyalty in the context of varying levels of customer expertise and switching costs. Journal of
the Academy of Marketing Science, 33 (2), 169-183.
153. Singh, Jagdip and Deepak Sirdeshmukh (2000). Agency and Trust Mechanisms in Relational Exchanges.
Journal of the Academy of Marketing Science, 28 (Winter), 150-167.
154. Sirdeshmukh, D., Singh, J. and Sabol, B. (2002). Consumer trust, value, and loyalty in relational
exchanges. Journal of Marketing, 66 (January), 15-37.
155. Sirgy, M. Joseph (1982). Self-concept in Consumer Behavior: A Critical Review. Journal of Consumer
Research, 9, 287-299.
156. Smith, A. K. and Bolton, R. N. (2002). The effect of customers' emotional responses to service failures on
their recovery effort evaluations and satisfaction judgments. Journal of the Academy of Marketing
Science, 30 (1), 5–23.
157. Spreng, R.A, Harrell, G.D, Mackoy, R.D (1995). Service recovery: impact on satisfaction and intentions.
Journal of Services Marketing, 9 (1), 15-23.
158. Stauss, B. and Neuhaus, P. (1997). The Qualitative Satisfaction Model. International Journal of Service
Industry Management, 8 (3), 236-49.
159. Swanson, S. R., & Kelley, S. W. (2001). Service recovery attributions and word-of-mouth intentions.
European Journal of Marketing, 35 (1/2), 194-211.
160. Tax, S. S. and Brown, S. W. (1998). Recovering and learning from service failure. Sloan Management
Review, 40 (1), 75–88.
161. Taylor, S.A., Hunter, G.H. and Longfellow, T.A. (2006). Testing an expanded attitude model of goal-
directed behavior in a loyalty context. Journal of Consumer Satisfaction, Dissatisfaction and
Complaining Behavior, 19, 18-39.
162. Tepeci, M. (1999). Increasing brand loyalty in the hospitality industry. International Journal of
Contemporary Hospitality Management, 11 (5), 223-229.
163. Terblanche, N.S. and Boshoff, C. (2006). A generic instrument to measure customer satisfaction with the
controllable elements of the in-store shopping experience, South African Journal of Business
Management, 37 (3), 1-14.
164. Tim Jones, Shirley F. Taylor, (2007). The conceptual domain of service loyalty: how many dimensions?
Journal of Services Marketing, 21 (1), 36 – 51
Customer Loyalty Attributes: A Perspective

76ISSN: 0971-1023NMIMS Management ReviewVolume XXII October - November 2012
165. Tsaur S.H, Y.C. Chiu and C.H Huang (2002). Determinants of guest loyalty to international tourist
hotels–a neutral network approach. Tourism Management, 23, 397-405.
166. Wang, C. (2010). Service quality, perceived value, corporate image, and customer loyalty in the context
of varying levels of switching costs. Psychology & Marketing, 27 (3), 252-262.
167. Westbrook, R.A. (1987). Product/consumption-based affective responses and post-purchase
processes, Journal of Marketing Research, 24 (3), 258–270.
168. Wirtz, J. & Bateson, J. E. G. (1999). Consumer satisfaction with services: integrating the environment
perspective in services marketing into the traditional disconfirmation paradigm, Journal of Business
Research, 44 (1), 55-66.
169. Yu, Yi-Ting and Alison Dean (2001). The Contribution of Emotional Satisfaction to Consumer Loyalty.
International Journal of Service Industry Management, 12 (3/4), 234-250.
170. Zeithaml, V. A., & Bitner, M. J. (2000). Services Marketing: Integrating Customer Focus across the Firm.
New York: Irwin McGraw-Hill.
171. Zeithaml, Valarie A. (2000). Service Quality, Profitability, and the Economic Worth of Customers: What
We Know and What We Need to Learn. Journal of the Academy of Marketing Science, 28, 1, 67–85.
172. Zeithaml, Valarie A., Leonard L. Berry, and A. Parasuraman (1996). The Behavioral Consequences of
Service Quality. Journal of Marketing, 60 (2), 31–46.
173. Zemke, R. and C. R. Bell (1990). Service Recovery - Doing It Right the Second Time. Training, June, 42-48.
174. Zinkhan G.M. and Hong J.W. (1991). Self concept and advertising effectiveness: A conceptual model of
congruency, conspicuousness and response model. Advances in consumer research, 18, 348-354.
Dr. Alok Kumar Rai is Associate Professor in the Faculty of Management Studies at Banaras Hindu
University. Ms. Medha Srivastava is a research scholar in the same institution.
Customer Loyalty Attributes: A Perspective

77ISSN: 0971-1023NMIMS Management ReviewVolume XXII October - November 2012
1Varsha Jain is the corresponding author,
and she can be reached at [email protected] or at [email protected]
Advertising during Recession:An Agency Perspective from India
Abstract
Research has addressed the issues of advertising
during recession mostly from the industry
perspective or at the conceptual level. The present
study has explored the advertising agency's
viewpoint of recession and its subsequent fallouts
in the industry. The study was based on twenty
seven in-depth interviews conducted with top
management representatives of 23 major
advertising firms in India. The questions were
related to the external and internal changes that
take place in the advertising agency during
recession. The findings suggested that there were
changes in the advertising budget, advertising
strategies, advertising appeals, media and internal
changes in the agency during recession.
Advertising, Recession, Qualitative
Study, Agency Perspective, India
Keywords:
Varsha Jain
Subhadip Roy
Aarzoo Daswani
Mari Sudha
1

78 Advertising during Recession: An Agency Perspective from IndiaISSN: 0971-1023NMIMS Management ReviewVolume XXII October - November 2012
1. Introduction
The global economic meltdown of 2008 resulted
due to a credit crunch and affected most countries of
the world including India. Firms looked to redefine
their strategies and did a rethink to obtain
proportionate returns through smart moves
(Trivedi, 2008). The slowdown resulted in
widespread gloom across the country and affected
various business sectors like Finance & Banking,
Transportation, Telecom, etc. Most of these sectors
depend upon advertising for their business.
Pitch-Madison Media Advertising Outlook
(highlights) showed that the advertisement
industry was expected to grow by 2% in 2009 as
compared to 15-20% during the previous year
(Chandran, 2009). The effect of recession on
advertising exists namely because of two reasons:
(1) Advertising budgets are typically set as a
percentage of sales. (2) Some marketers think that
advertising will not change the demand of products
in a weak market and so they cut their advertising
budget (Baxter, 1999; Dyson, 2008).
During recession, companies expect more returns
than normal market returns. They want to reduce
costs in various aspects of advertising. In television
commercials, this is carried out by re-running the
same commercials and shorter duration ads
(Chatterjee, 2008). In print media, full-page
advertisements shrink in size (Mohanty, 2008). In
outdoor media too, hoardings are decreased by 20%
(Aikara, 2008). The clients also cut their budget,
forcing advertisers to reset their targets resulting in
slow growth (Trivedi, 2008).
In such a scenario, a relevant question would be to
explore what the advertising agency thinks about
recession and how it affects the overall performance
of the advertising function. Thus, the present study
explores the advertising agency's viewpoint of
recession and its subsequent fallouts in the
industry. The rest of the paper is organized as
follows. The next section provides a brief literature
review of the key papers dealing with advertising
and recession. This is followed by the methodology
and the data collection procedure. Section 4
presents the findings and discussions. Lastly, the
managerial implications derived from the study are
presented.
2. Literature Review
Recession leads firms to cut back expenditures
including advertising. However, there are very few
papers that have discussed the effects of recession
on advertising from an empirical perspective. A
literature search of the available databases such as
EBSCO, WARC, PROQUEST, and ABI INFO yielded
around 40 studies that have analyzed the effect of
recession on advertising expenditure and only 10
were empirical studies. The primary studies
focused on the macro aspects as well as the
relationship of advertising with the performance of
the firm.
Studies investigating the effect of advertising on
sales found that firms increasing ad spend during
recession performed better than those who reduced
it (Vaile, 1927). Similar findings were found in a
study conducted by Meldrum and Fewsmith (1979)
and subsequently in McGraw Hill Research, (1986).
Similarly, Kamber (2002) analyzed the effect of
advertising on sales over a six year period and
concluded that the group of companies who
maintained/increased ad spend had a higher sales
growth than those that had decreased it.
2.1 Effect of Advertising on Sales during
Recession

79Advertising during Recession: An Agency Perspective from IndiaISSN: 0971-1023NMIMS Management ReviewVolume XXII October - November 2012
2.2 Effect of Advertising on Profitability During
Recession
2.3 Effect of Advertising on Market Share During
Recession
2.4 Macro Perspective of Advertising During
Recession
The effect of advertising expenditures on firm
profitability was studied by various researchers (for
ex. Frankenberg and Graham, 2003) who found that
increasing the advertis ing expenditures
significantly increased the earnings of the firm
during recession. Similarly, Kijewski (1982) found
that firms experienced loss in ROI during a
recession as compared to during a normal period.
Studies also found that decreasing advertising costs
did not give a boost to the short-term profits and led
to a significant damage in the long-term profit
(Carter, 2009). Biel and King (1990) also studied the
impact of advertising on ROI and found that all the
business units experienced loss in ROI during
recession and reduction in the advertising
expenditure did not decrease these losses.
Market share was also a key variable in measuring
the performance of the firm. A research study
carried out by Biel and King, (1990) showed that
there was a 0.5% increase in the market share of
firms that increased their advertising expenditure
during recession. In comparison, firms that
increased ad spend by 20% to 100% had a 0.9%
increase in market share. A related research by
Baxter (1999) found that companies that increased
their spending on advertising during recession
performed better.
In addition to research conducted on firms'
performance, studies were also conducted at the
macro level which indicated that advertising
expenditures were sensitive to changes in the
Gross-Domestic Product (GDP) of an economy
(Tellis and Tellis, 2009; Deleersnyder et al., 2009).
Most of these studies indicated that an increase in
advertising expenditures was actually beneficial for
the firm. It was very crucial to understand the
relationship of advertising expenditure with the
economy, apart from the performance of the firm.
There have been other studies that have focused on
other aspects of advertising during recession such
as appeals used during recession (Carter, 2009;
Elliott, 2009), budget allocation during recession
(Dyson, 2008) or creative strategy during recession
on reputation and goodwill (Grande, 2008; Goorha,
2008; Agarwal, 2008; Kannan, 2009). The review of
all these studies gave an idea about the research
carried out in the area of advertising during
recession. However, all these research studies were
concerned with western countries and they have
not focused on issues faced by the Asian
counterparts. Moreover, there has not been a single
study to the author's knowledge that has tried to
address the issues related to advertising during
recession from the agency perspectives and include
the internal issues of the agency during recession.
Thus we generate the research questions based as:
RQ1. What are the macro level effects of recession?
RQ2. What are the effects of recession on
Advertising objectives and Appeals?
RQ3. What are the effects of recession on Media?
RQ4. What are the effects of recession on the
internal issues of the agency?

80ISSN: 0971-1023NMIMS Management ReviewVolume XXII October - November 2012
3. Methodology
Most empirical studies on the effects of recession on
advertising have used secondary data pertaining to
companies in terms of sales data, market share and
profitability. However, the objective of the present
study was to understand the holistic view about
advertising during recession from the agency
professionals' perspective. Thus, in-depth
interviews of the respondents, namely the
Managing Directors and Chief Executive Officers
were conducted. The premise of using in-depth
interviews could be attributed to the concepts of
grounding theory in reality (Glaser and Strauss
1967; Strauss and Corbin 1990; Goulding 2000).
Since this was a relatively untouched area, in-depth
interviews would help to develop new, less tested
theories by collecting data first and then drawing
the embedded theory from the data itself.
Initial in-depth interviews were conducted with
advertising professionals from three advertising
agencies based in India. The objective of this
exercise was to create the interview protocol based
on which the main study was conducted. The
information gathered from the preliminary
interviews were then juxtaposed with the research
questions and advertising literature that included
objectives of advertising, type of advertisement, ad
appeal, type of media for different products and
different geographical areas. Sector specific
questions that were related to advertising
expenditure were also included in the interview.
The main study was conducted on Managing
Directors and Chief Executive Officers of major
advertising agencies of India. These agencies were
selected on the basis of the number of clients
handled by their agency. This criterion was used for
3.1 Study Design
the study on the premise that if the agency has more
clients from different sectors, it can offer a holistic
view about advertising pertaining to these sectors.
Thus, the top 25 advertising agencies of India were
short listed out of which 23 agreed to take part in the
study. Twenty seven respondents (all belonging to
the top management) from the 23 advertising
agencies were interviewed. In some cases, a total of
more than one division of one agency was covered
so that more clarity could be achieved pertaining to
the agency's perspective of advertising during
recession. The researchers themselves conducted
the interviews to avoid dilution of vital information
due to third party interviewers. The interviews
were recorded and the interviewer occasionally
wrote down information which he/she thought
required special mention. Each interview lasted for
1 to 1.5 hours and the entire process of data
collection was completed in a span of 45 days.
All the recorded interviews were first transcribed
and then the content was analyzed. The four
research questions guided the analysis. In this
regard, procedures of coding and concept and
theme generation based on the data were
conducted following some of the steps suggested in
the Grounded Theory framework (Strauss and
Corbin 1990). Since there were no studies using the
same methodology, there was no chance of using an
'a-priori' coding scheme. Thus the codes were based
on the terms used by informants (in vivo codes). The
interview process helped generate around 200
codes including the semantically similar ones. Two
researchers independently conducted the open
coding procedure. Once it was carried out, the
results were matched with each other and most
disagreements were resolved. The inter coder
reliability thus was found to be 92%. Thereafter the
3.2 Data Analysis
Advertising during Recession: An Agency Perspective from India

81ISSN: 0971-1023NMIMS Management ReviewVolume XXII October - November 2012
codes were categorized and organized into tree
diagrams. At this stage, conceptualization of the
open codes was performed in conjunction with
prior literature. A sample of the codes and the
encompassing concept is provided in Table 1.
Table 1: Sample Concept and Category from Coding
Category Concept Codes
Internal
Strategy in
Recession
Internal Structure
Client Interface
Internal Strategy
Low agency cost, research, multi-tasking, cross functional
work, specialized training.
Low budget, minimum expenditure, bargain, media cost.
Unaffected products, short term projects, alternate media
plans, public relations.
The next step was Axial coding (Strauss and Corbin 1990) in which the concepts were aggregated under
broader categories. The findings from such categorizations are given in the next section.
4. Findings and Discussions
Overall findings suggested that recession was
perceived as a dreaded phase that changed various
aspects of an industry, including advertising
expenditure. The findings of the study suggest that
recession does affect the advertising efforts of
various companies as well as sectors. A change in
the objectives of advertising during recession was
also observed. The type of advertising for different
product categories was also found to undergo
alteration. Effects of media and advertising appeals
specific to product categories were found to change.
Geographical areas too were found to have an
impact on the change in advertising strategies
during recession. The following subsections discuss
the major findings from the study. Following the
Glaserian (Glaser and Strauss, 1967; Strauss &
Corbin, 1990) approach, the findings and
discussions have been integrated into the same
subsections.
4.1 Effect of Recession on Industries/Sectors
According to the findings of the study, recession
affected various sectors like FMCG, Luxury, and
Information Technology, etc. In some sectors, this
effect is positive whereas in others it is negative or
absent. The findings of the study supported studies
conducted earlier that have also shown the effect of
recession on advertising efforts. For luxury
products, advertising reduced during recession as
one respondent opined,
“
.”
Therefore, sectors like FMCG, consumer products,
education, public service units, government sector
and personal care products were found to increase
Consumers can reduce the spending on luxury
products but not on daily need products.
Fundamental utilities and basic necessities are
a part of fast moving consumer goods and do
well even during recession as people need these
goods for survival
Advertising during Recession: An Agency Perspective from India

82ISSN: 0971-1023NMIMS Management ReviewVolume XXII October - November 2012
their ad expenditure in recession. Similar
phenomenon was observed in companies like P & G
and Kellogg in the western context during recession
(Grande, 2008).
Sectors like Information Technology, Business
Process Outsourcing, Telecom, Real Estate,
Consumer Durables, and Service sector that
includes Financial Services and Hospitality were
found to have decreased their advertising budget
during recession. Previously conducted studies
have also shown that sectors like information
technology, business process outsourcing, telecom,
and real estate have decreased their advertising
budget during recession (Pinto, 2006; Goorha,
2009; Bhushan, 2008; Kannan, 2009; Chatterjee,
2008). Banking and financial sectors were also
major sufferers in terms of decrease in ad spend due
to recession; a fact which also has previous support
from literature ( , 2008).
There were sectors which were unaffected by
recession such as Health Care Products, Television
Channels, Matrimonial Sites, Job-Related Websites
and Hospitals. The education sector was perceived
to be very important for individuals at every phase
of life, even during recession. One respondent
quoted,
“
”
In the same way, Health sector advertising too was
found to be unaffected by recession, supporting
earlier research (Bali, 2009).
The Economic Times
See, you do not stop studying during recession.
On the contrary you look for opportunities for
higher studies during recession; say if you had
a graduate degree and lost a job. What do you
do? Study!
4.2 Effect of Recession on Objectives of
Advertising
The findings of the study suggested that there was a
change in the objective and reason for advertising
during recession. Various studies conducted prior
to this study supported this aspect of advertising
during an economic slowdown. Recession is a good
time to advertise as the ad clutter is less thereby
increasing visibility (Hillier, 1999). In the present
study, it was found that during recession the prime
focus of the agencies was to increase sales and
create visibility for the brand in the market (Refer to
Table 2). Both these objectives have been found in
prior studies (Werner, 1991).
Table 2: Advertising Objectives
during Recession
OBJECTIVE MODE/RANK
Increase Sales 1
Creating Visibility 2
Creating Awareness 3
Refresh the Brand 4
This study also observed that advertising could be
used to maintain the market share of the clients.
Moreover, some respondents opined that recession
was also a good time to increase market share by
increasing advertising.
The respondents opined that different types of
advertising were required for different product
categories during recession. Rational and
interactive advertising gained more prominence
during recession, in both high and low involvement
products. On the other hand, usage of celebrity and
animated characters were least preferred by
advertising agencies.
4.3 Effect of Recession on Type of Advertising
Appeals
Advertising during Recession: An Agency Perspective from India
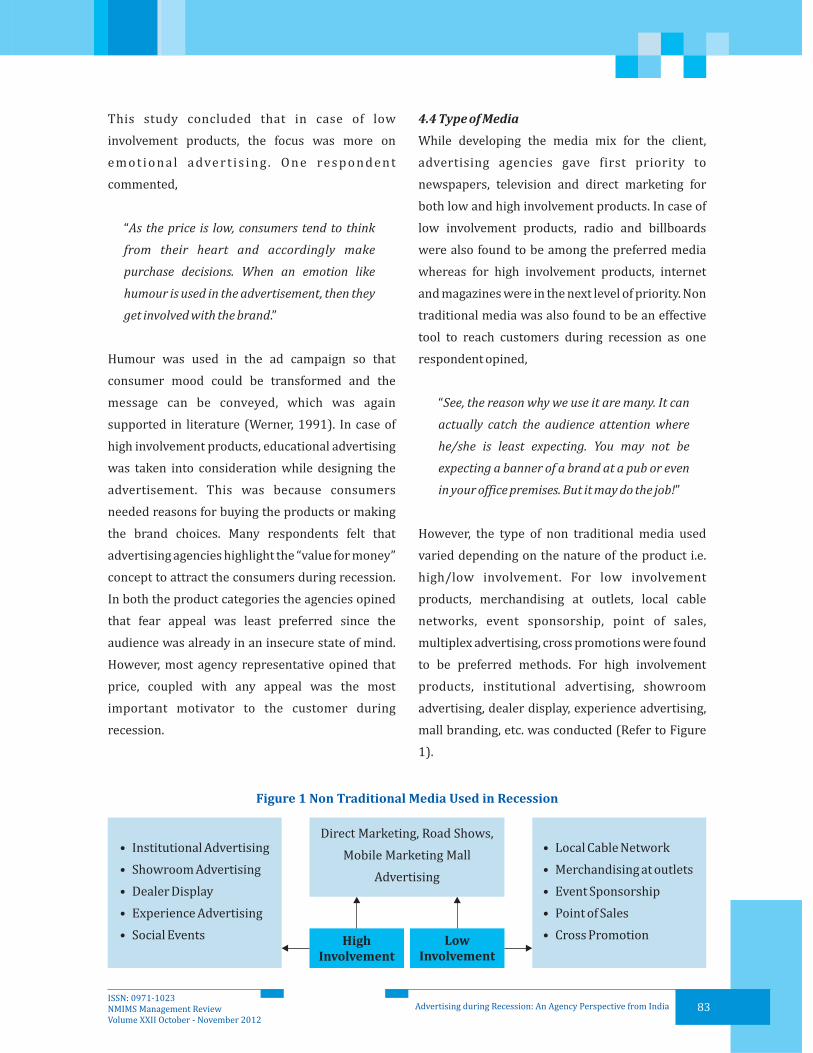
83ISSN: 0971-1023NMIMS Management ReviewVolume XXII October - November 2012
This study concluded that in case of low
involvement products, the focus was more on
e m o t i o n a l a dve r t i s i n g . O n e re s p o n d e n t
commented,
“
.”
Humour was used in the ad campaign so that
consumer mood could be transformed and the
message can be conveyed, which was again
supported in literature (Werner, 1991). In case of
high involvement products, educational advertising
was taken into consideration while designing the
advertisement. This was because consumers
needed reasons for buying the products or making
the brand choices. Many respondents felt that
advertising agencies highlight the “value for money”
concept to attract the consumers during recession.
In both the product categories the agencies opined
that fear appeal was least preferred since the
audience was already in an insecure state of mind.
However, most agency representative opined that
price, coupled with any appeal was the most
important motivator to the customer during
recession.
As the price is low, consumers tend to think
from their heart and accordingly make
purchase decisions. When an emotion like
humour is used in the advertisement, then they
get involved with the brand
4.4 Type of Media
While developing the media mix for the client,
advertising agencies gave first priority to
newspapers, television and direct marketing for
both low and high involvement products. In case of
low involvement products, radio and billboards
were also found to be among the preferred media
whereas for high involvement products, internet
and magazines were in the next level of priority. Non
traditional media was also found to be an effective
tool to reach customers during recession as one
respondent opined,
“
”
However, the type of non traditional media used
varied depending on the nature of the product i.e.
high/low involvement. For low involvement
products, merchandising at outlets, local cable
networks, event sponsorship, point of sales,
multiplex advertising, cross promotions were found
to be preferred methods. For high involvement
products, institutional advertising, showroom
advertising, dealer display, experience advertising,
mall branding, etc. was conducted (Refer to Figure
1).
See, the reason why we use it are many. It can
actually catch the audience attention where
he/she is least expecting. You may not be
expecting a banner of a brand at a pub or even
in your office premises. But it may do the job!
Figure 1 Non Traditional Media Used in Recession
Direct Marketing, Road Shows,
Mobile Marketing Mall
Advertising
• Institutional Advertising
Showroom Advertising
Dealer Display
Experience Advertising
Social Events
•
•
•
•
• Local Cable Network
Merchandising at outlets
Event Sponsorship
Point of Sales
Cross Promotion
•
•
•
•High
Involvement
Low
Involvement
Advertising during Recession: An Agency Perspective from India
84ISSN: 0971-1023NMIMS Management ReviewVolume XXII October - November 2012
4.5 Geographical Area and its Impact on
Advertising Strategies
4.6 Issues Faced by Agencies during Recession
The study findings also suggested that the type of
advertising approach differed depending on the
demographics of an area. In rural areas, wall
painting, network marketing, road shows, radio
advertising, road painting, street plays, small pack
promotions and transit media particularly buses
were utilized. In the urban scenario, value for
money was the prime motive of advertising
agencies. In order to achieve this, agencies did event
marketing, reference marketing, mobile marketing,
mall advertising and engagement advertising.
The study also enlightened on the various issues
faced by the advertising agencies during recession
from the internal perspective. Clients preferred to
hold money in crisis and offered low budgets for
advertisements. They give bare minimum
expenditure to the agencies for advertisement.
Moreover media bargain was very easy during
recession. Thus, during recession advertising
agencies in India tended to focus on those products
that are unaffected by recession. They even
considered small projects of mid sized or small
companies as the focus was on the short term goal as
compared to long term. They designed retention
programs where rewards were given to loyal
customers, worked on the database of customers,
did rigorous research, developed alternate media
plans for best solutions and built brands through
public relations. They operated at a low agency cost.
Data analytics was used within the agencies and
skills were developed among the employees so that
one employee could handle different activities.
There was a question on retrenchment of agency
staff during recession, but most of the respondents
avoided the question replying that it was a sensitive
question.
5. Managerial Implications
The present study has brought a fresh perspective
from the agency side of advertising during
recession. The overall findings suggested that
recession affected both the advertising agency and
the clients. From the client's side the most
important change that took place was the reduced
budget. As a result the clients were ready to accept
shorter length commercials but those with more
impact. The clients also expected the agencies to
identify advertising opportunities and spot the
changes in consumer needs. The clients became
very result oriented during recession as they
wanted their money's worth. For an advertising
agency the main aim was to provide sensible
solutions to the clients where the emphasis was on
value-based campaigns. Advertising agencies
considered small and mid sized project to focus on
short term goals rather than on the long term goals.
They operated at a very low cost and encouraged
their employees to work on different projects. New
technology and media can be used by these agencies
through which costs can be saved and a wider
exposure can be obtained. Moreover, they need to
consolidate their divisions and business and they
need to integrate specialized units so that they can
work together (Refer Figure 2).
Advertising during Recession: An Agency Perspective from India

85ISSN: 0971-1023NMIMS Management ReviewVolume XXII October - November 2012
Figure 2 Advertising Approach during Recession from Indian Agency Perspective
- Lower Budget
- Short Length Commercial
- New Technology
- Strong Monitoring
- Change In Buying Decision
- Integration of Units
- Consolidation of Division
- More Flexibility
- Focus on Short Term Objective
Recession
AdvertisingEfforts
External
Client
Internal
Agency
6. Scope of Future Research
The present study was qualitative in nature. Similar
studies can be carried out that could be quantitative
in nature. In order to have more clarity about
recession and its impact on the advertising function,
research could be conducted including other
stakeholders' views such as consumers, clients and
policy makers. This would enable to develop a
holistic view of the impact of recession on
advertising. Similar studies can be conducted in
other countries of Asia to understand the difference
in advertising approach. Comparison of these
approaches could be made to understand the cross
cultural effect of recession on advertising and new
dimensions could be identified.
Advertising during Recession: An Agency Perspective from India

86ISSN: 0971-1023NMIMS Management ReviewVolume XXII October - November 2012
• Aikara, A. (2008, November 23). Outdoor advertising companies hit by recession. . Available online
at: http://220.225.146.34/cgi-bin/wwwi32.exe/[in=genisis0.in]/ (accessed on 5 May 2009).
Agarwal, S. (2008, November 30). Leading advertising agencies renew faith in Indian market.
. Available online at: http://www.business-standard.com/india/news/leading-advertising-
agencies-renew-faith-in-indian-market/00/15/341708/ (accessed on 2 December 2008).
Bali, V. (2009, April 20). Role of sentiment in a recession. , pp. 11.
Baxter, M. (1999, July). Advertising and profitability: the long-term returns.
Available online at: http://www.warc.com/ArticleCenter/Default .asp?CType=A&AID=
WORDSEARCH9751&Tab=A (accessed on 9 April 2009).
Biel, A. and King, S. (1985). Advertising during a recession. In Patrick Barwise eds.
. (1990). NTC Publications.
Bhushan, R. (2008, November 20). Slowdown stalls blockbuster ad deals.
pp. 1.
Carter, S. (2009). How to get your brand heard in a recession and boost your ROI. 44
(501) pp. 24-27.
Chandran, A. (2009, February 13). As advertisers delay payments, ad industry feels the pressure.
Available online at: (accessed on 6 April 2009).
Chatterjee, P. (2008, December 30). Ad industry thrives on spends from telecom, FMCG sectors.
. Available online at: http://www.blonnet.com/2008/12/30/stories/2008123050801600.htm
(accessed on 21 April 2009).
Defining the R-word. (2002, September 28). (8292), pp. 8.
Deleersnyder, B.; Dekimpe, M. G.; Steenkamp, J. E. M.; and Leeflang, P. (2009). The role of national culture
in advertising's sensitivity to business cycles: An investigation across continents.
, 46(5), 623-636.
Dyson, P. (2008, March). Cutting adspend in a recession delays recovery. Available online
at: http://www.warc.com/ArticleCenter/Default.asp?CType=A&AID=WORDSEARCH87700&Tab=A
(accessed on 9 April 2009).
Elliott, S. (2009). Now, angry ads seek to channel consumer outrage. , March-April. pp. 12.
Frankenberger, K. D., & Graham, R. C. (2003). Should firms increase advertising expenditures during
recessions?
DNA
Business
Standard
The Economic Times
Admap Magazine.
Advertising in a
recession
The Economic Times
Ahmedabad,
Admap Magazine,
,
Business
Line
The Economist, 364
Journal of Marketing
Research
WARC Exclusive.
DNA
Marketing Science Institute. Working Paper No. 03-003.
•
•
•
•
•
•
•
•
•
•
•
•
•
•
References
Advertising during Recession: An Agency Perspective from India

87ISSN: 0971-1023NMIMS Management ReviewVolume XXII October - November 2012
•
•
•
•
•
•
•
•
•
•
•
•
•
•
Glaser, B. G., & Strauss, A. L. (1967).
New York: Aldine Publishing Company.
Grande, C. (2008b, ). Different approaches to recession advertising and marketing.
Goorha, P. (2009, January 2). Exchange4media.com: Dialogue. Available online at:
http://www.exchange4media.com/e4m/interview/dialogue_print.asp?id=401 (accessed on 21 April
2009).
Goulding, C. (2000).
. , 27 (1), 261-266.
Hillier, T. (1999). Successful competitive strategies for recession & recovery. 28-
32.
Kamber, T. (2002). The brand manager's dilemma: Understanding how advertising expenditures affect
sales growth during a recession. , (2), 106–120.
Kannan, S. (2009, February 5). Critical to get consumption back. . Available online at:
http://www.thehindubusinessline.com/todays-paper/tp-brandline/article1083492.ece (accessed on
22 April 2009).
Kijewski, V. (1982). Media Advertising When Your Market is in a Recession. Available online at:
http://www.landesassociates.com/pdfs/MediaAdvDuringRecession-color.pdf (accessed on 6 May
2009).
McGraw Hill Research. (1986). , New York: McGraw
Hill Inc.
ABP/Meldrum and Fewsmith. (1979). . American
Business Press.
Mohanty, M. (2008, August 21). Dealing with the slowdown. Available online at:
http://www.blonnet.com/catalyst/2008/08/21/s ories/2008082150010100.htm (accessed on 22
April 2009).
Strauss, A., & Corbin, J. (1990).
Newbury Park, Ca: Sage Publications.
Tellis, G. J., & Tellis, K. T. (2009). Research on advertising in a recession: A critical Review and Synthesis
, (3), 304-327.
The Economic Times. (2008, November 25). OECD warns of worst recession since early 1980s. Available
The Discovery of Grounded Theory: Strategies for Qualitative Research.
February WARC
Exclusive. Available online at: http://www.warc.com/ArticleCenter/Default.asp? CType=A&AID=
WORDSEARCH87598&Tab=A (accessed on 12 December 2009).
Grounded theory methodology and consumer behaviour: Procedures, practice and
pitfalls Advances in Consumer Research
Market Leader, Spring, 4,
Journal of Brand Management 10
Business Line
Laboratory of Advertising Performance Report 5262
How Advertising in Recession Periods Affects Sales
Basics of Qualitative Research: Grounded Theory, Procedures and
Techniques.
Journal of Advertising Research 49
.
Advertising during Recession: An Agency Perspective from India

88ISSN: 0971-1023NMIMS Management ReviewVolume XXII October - November 2012
online at: http://economictimes.indiatimes.com/oecd-warns-of-worst-recession-since-early-
1980s/articleshow/3756407.cms?curpg=2 (accessed on 23 April 2009).
Trivedi, D. (2008, October 21). Slowdown has ad agencies revisiting strategy. Available online at:
http://www.blonnet.com/2008/ 10/21/stories/2008102150850500.htm (accessed on 22 April 2009).
Werner, L. R. (1991). Marketing strategies for the recession. (8), 29-30.
Vaile, R. S. (1927, April). The use of advertising during depression 323-330.
•
•
• .
Management Review, 80
Harvard Business Review,
Dr. Varsha Jain is an Assistant professor in integrated marketing communication at the Mudra Institute
of Communications Ahmedabad (India). She has over 26 publications in international, national and
trade journals and book chapters such as International Journal of Mobile Marketing (US), Young
Consumers (Emerald, UK), Vikalpa (IIM-A Journal), Media Asia (NTU, Singapore), WARC (World
Advertising Research Council, UK), etc. to her credit over the last four years.
Dr. Subhadip Roy is an Associate Professor of Marketing at IBS Hyderabad. His research interests are in
the areas of Brand Management, Advertising and Research Methods.
Ms. Aarzoo Daswani is a Research Associate (Integrated Marketing Communication) at Mudra Institute
of Communications Ahmedabad. She holds a Post Graduate Diploma in Business Management (majored
in Marketing).
Ms. Mari Sudha serves as a Sr. Business Analyst at TCS. She holds a Bachelors and Masters Degree in
Statistics from St. Xavier's College, Ahmedabad and School of Sciences, Ahmedabad, India.
Advertising during Recession: An Agency Perspective from India
89ISSN: 0971-1023NMIMS Management ReviewVolume XXII October - November 2012
1Babita Kumar is the corresponding author,
She can be reached at [email protected]
Perception and Attitude of Farmers andAgri Firms Towards Commodity Finance
Abstract
Commodity financing is financing against the
pledge of warehouse receipts of Central
Warehousing Corporation (CWC) / State
Warehousing Corporation (SWC) and private
warehouses / cold storages / godowns. The goal of
financing against the warehouse receipt is to enable
small farmers to access finance against their
commodities at competitive rates using a process
that is fairly simple to execute. Such post-harvest
financing will give farmers the option to wait during
the usually low prices offered immediately after
harvest, and sell at a later time, when prices tend to
rise. Commodity finance is getting popular all over
India. States like Punjab, Haryana and Uttar Pradesh
are pioneers in commodity finance in agri
commodities as major crops like wheat, paddy and
cotton are grown in large quantities in these states.
In Punjab where wheat, rice and cotton are the
major crops grown, banks have started providing
commodity finance on these crops. The present
study was undertaken to understand the perception
and attitude of farmers and agri firms of Punjab
towards commodity finance. A list of farmers and
agri firms availing commodity finance in Amritsar
and Bathinda was obtained from financial
institutions providing commodity finance to them.
Out of this list, 50 farmers and 30 agri firms availing
commodity finance were chosen on the basis of
random sampling technique. Commodity finance is
availed by large farmers and this facility has still not
percolated to small farmers. Majority of the farmers
(82%) borrow less than Rs 5 lakhs, and 18% borrow
between Rs 5 – 10 lakhs on a per annum basis. Most
farmers (65.79%) arrange their money from banks,
and 34.21% from middlemen. Most of the
respondents are charged between 12-13% rate of
interest. The agri firms feel that commodity finance
is safe and more beneficial from other means of
finance. Commodity finance has more benefits, but
it is not easily available and it depends on the
availability of warehouses. Farmers and agri firms
who avail of commodity finance are overall satisfied
with the services and dealings with banks.
Attitude (M-31), Perception (M-31),
Commodity Finance (G-10), Farmers (Q). Agri Firms
(Q-13)
Keywords:
Babita Kumar
Gagandeep Banga
Ajay Jindal
1

90ISSN: 0971-1023NMIMS Management ReviewVolume XXII October - November 2012
Perception and Attitude of Farmers and Agri Firms Towards Commodity Finance
Introduction
Commodity Finance has been described as short
term financing provided to international multi
commodity trading companies, commodity
producers in industrialised countries and market
players involved in oil and gas, metals and minerals,
and agri-commodities by Rabo Bank (Trade and
commodity finance, 2012). According to a study
conducted by UNCTAD Secretariat in 2001,
structured finance/ commodity finance is the art of
transferring risks in trade financing from parties
less able to bear those risks to those more equipped
to bear them in a manner that ensures automatic
reimbursement of advances from the underlying
assets which are in the form of oil in the ground,
plantations to produce cocoa or coffee, even fields to
produce annual crops such as cotton or wheat etc.
Structuring techniques make it possible to raise
funds on the basis of this wealth, funds that can then
be used to access this wealth and convert it into
ready money. Structured commodity finance is
particularly relevant for commodity companies in
countries that are considered as risky by financiers.
Structured finance allows many of these companies
to obtain finance at reasonable terms. But there are
a number of obstacles to structured finance which
do not exist in the case of more traditional forms of
financing. In many countries, the understanding
and awareness of structured financing techniques
and modalities are quite weak, and this has often
resulted in legal and policy barriers to this form of
finance.
Facilitating access to finance and increasing
investment is of the essence for commodity
production and trade; it is crucial to the livelihoods
of the most vulnerable producers and exporters
within the commodity supply chain. Together with
the emergence of newer threats bearing directly on
the commodity sector (i.e. food and energy security
and climate change), the global crisis has
underscored a crucial need to understand the
problems faced by small-scale producers and
exporters of commodities, and to scale up the
financial resources required in commodity-
dependent developing countries. The need to
design appropriate policies and mechanisms to
enhance access to commodity finance in low income
commodity-dependent developing countries has
never been more urgent. IFC (International Finance
Corporation) launched the Critical Commodities
Finance Program (CCFP) to channel funds to
support the global trade of commodities. Through
this innovative public-private partnership, IFC will
maintain credit for traders and intermediaries that
move food and agricultural products in and out of
low-income countries. By supporting commodity-
backed finance and in partnerships with banks, the
CCFP will promote commodities as an asset class
and encourage local and regional banks to
participate in funding critical economic sectors,
which will ultimately help increase access to finance
and develop local markets (International Finance
Corporation, 2012). Many international agencies
like EBRD (European Bank for Reconstruction and
Development) are actively involved in evolving
loans against warehouse receipts in developing
legislations and institutions for adequate
warehouse licensing, inspection, insurance systems
and performance guarantee systems to support the
agri business sector throughout Central and Eastern
Europe and CIS (Commonwealth of independent
states). To make this facility a success, EBRD worked
extensively with the Government of Romania to
amend the existing warehouse receipt law. The
Angolan Government and companies are trying to
strengthen the system of commodity finance.
Hence, experiences of different countries in the
91ISSN: 0971-1023NMIMS Management ReviewVolume XXII October - November 2012
Perception and Attitude of Farmers and Agri Firms Towards Commodity Finance
world show that this system is likely to stay and
work.
A note by UNCTAD Secretariat in 2010 states that
more than 50 developing and least developed
countries (LDCs) depend on three or fewer
commodities for at least half of their export
earnings. As this commodity trade is highly credit
dependent, inadequate access to finance has usually
constrained the development of the sector in many
developing countries, particularly the least
developed, which tend to have more limited access
to credit and often face more onerous conditions.
Commodity financing is financing against pledge of
warehouse receipts of Central Warehousing
Corporation (CWC) / State Warehousing
Corporation (SWC) and financing against pledge of
warehouse receipts / storage receipts of private
warehouses/cold storages / godowns. In case of
agricultural commodities, at the time of harvesting,
farmers usually sell a substantial quantity of
produce at lower prices or resort to distress sales
throughout the world. In India, farmers, especially
small and medium farmers, are engaged in distress
sales to repay loans taken from money lenders from
time to time (Adhikary,2009). For instance, farmers
in North-Karnataka have resorted to distress sales
of cattle as they were unable to feed them; absence
of cold storage and lack of government
patronization has forced farmers producing
cauliflower and cabbage in Keonjhar district to go
for distress sales of vegetables; potato farmers in
West Bengal and Punjab, Jaipur rice farmers and
Orissa cotton farmers resorted to distress sales of
their produce (Pattanayak, 2012; Karchalli and
Naik, 2012; Ghosal, 2011 and NDTV, 2002). Farmers
across the world resort to such measures in the
absence of structured finance especially in
developing countries. Farmers, who cultivate crops
by taking loans, are especially vulnerable. However,
price tends to rise as the season progresses. If
farmers keep their goods in warehouses and use
them as collateral to avail of credit facility, they
would be better placed to meet their immediate
credit requirements and take advantage of the
benefits of higher price. Lenders can mitigate credit
risk by using the stored commodity as collateral.
This form of collateral (crop) is more readily
available from rural producers and may be less
difficult to liquidate than most assets traditionally
accepted as collateral. The Warehouse Receipts
system will also make it less necessary for lenders to
monitor a large number of small borrowers as a few
warehouse operators assure loan performance.
This will reduce monitoring costs and encourage
commercial lending to the rural sector, helping to
capitalise the rural trade. A lender holding a
Warehouse Receipt has a claim against the issuer
(the warehouse company) as well as the borrower
in the event of the non-existence or unauthorised
release of the collateral. The risk of loss of value of
the collateral can be reduced by monitoring
movements in its market value as well as by
margining and the use of price risk management
instruments (Lacroix and Varangis, 1996; Bass and
Henderson, 2000).
Lack of access to credit is a severe constraint for
many farmers. A standard warehouse receipt is
typically used only by traders in market places
(mandis) and affluent farmers as a tool for financing
(Jindal, 2010). Warehouse receipt finance has thus
become an exclusive product that is perceived to be
non applicable to the small and marginal farmer.
The same was experienced in Zambia and Ghana
(Onumah, 2003; Mor and Fernandes, 2009). The
Commodity Financing in India

92ISSN: 0971-1023NMIMS Management ReviewVolume XXII October - November 2012
apparent barriers to the farmer in participating in
such a product are observed as non availability of
reliable price information leading to information
asymmetry, lack of storage space (curtailing the
holding capacity of the small farmer), no fixed
parameters of judging quality, multiple layers of
intermediaries, hidden charges, documentation
challenges, high transport cost, etc. Warehouse
receipts are an important and effective tool for
creating liquidity and easing access to agriculture
credit. Such schemes also offer additional benefits
such as providing storage to smoothen the supply
and prices in the market, improving grower
incomes, and reducing food losses (Giovannucci et
al 2000). If agriculture is to contribute to the
development of the economy, and farmers are not to
be left behind, then agriculture needs a proper
credit system. According to a Report of Expert group
on agricultural indebtedness by Banking Division,
Department of Economic Affairs, Ministry of
Finance, Government of India in 2007, innovative
alternatives are needed to provide them with better
institutional credit support. Post-harvest credit, in
the form of warehouse receipt finance, has proven
to be a critical component for agricultural sector
growth in emerging economies. It would allow
farmers to place their material in warehouses and
raise finances as they are tradable instruments,
would increase liquidity, allow participants to hold
material, not indulge in distress sales, facilitate
integration with future market exchanges and
reduce dependence on local markets (Hollinger and
Rutten, 2009).
The Forward Markets Commission, Government of
India and the World Bank instituted a consultancy
assignment on Warehouse Receipts in the year
2000. The consultant concluded that there is scope
for massive expansion in the use of Warehouse
Receipts due to several advantages. The institution
of an electronic warehouse receipt system with a
central registry was recommended to enable small
farmers to access finance against their commodities
(up to 75% of the value of produce) at competitive
rates using a process that is fairly simple to execute.
In order to address many of these issues, IFMR Trust
(Institute of Financial Management and Research
Trust) has entered into a collaboration with
National Spot Exchange Limited (NSEL) in line with
which ITGC (Information Technology General
Controls) has structured a warehouse receipt
finance product to leverage the warehouse receipt
as a liquidity smoothing financial instrument, by
riding on a warehouse linked electronic market.
With the combination of ITGC warehouse receipt
finance and NSEL's warehousing and electronic
price discovery, many of the issues faced by the
small and marginal farmers would be resolved. It is
felt that these would still not be sufficient to clinch
the issue and catalyze the farmer to move out of the
traditional mandi system into a contemporary
electronic mandi. The alliance will create a seamless
process for providing finance to farmers and traders
against commodity warehouse receipts for the
commodities deposited in NSEL approved
warehouses. The pilot for this financing model is to
be launched shortly at Kadi, Gujarat. Under the
partnership, IFMR Trust will provide loans to
farmers against agricultural commodities
deposited in NSEL approved warehouses, by way of
warehouse receipts issued for these deposits. Such
post-harvest financing will give farmers the option
to wait out the usually low prices offered
immediately after harvest, and sell at a later time,
when prices tend to rise. It will also allow farmers to
take advantage of changing market prices rather
than being burdened by them. The loans backed by
Perception and Attitude of Farmers and Agri Firms Towards Commodity Finance

93ISSN: 0971-1023NMIMS Management ReviewVolume XXII October - November 2012
warehouse receipts will be pooled and repackaged
into securities. ITGC will structure, arrange and sell
these commodity loan-backed securities in the
capital market.
Outside of the ports, the Central and State
Governments dominate the warehousing industry,
both as client and as service provider. Government
warehouses can be used to further the employment
of warehouse receipts. Government warehouses are
present across the country. They have developed
homogeneous storage and quality practices, and
their warehouse receipts are accepted by banks.
Warehousing facilities owned by the central and the
state governments account for about 66 million tons
of warehousing capacity. About 46 million tons of
capacity is owned or leased by the Food Corporation
of India and the State Food and Civil Supplies
Corporations. The storage capacity that can be
made available by state-owned warehousing
corporations is about 20 million tons.
According to the report of the Planning Commission
in 2011, the Government of India has introduced a
negotiable warehouse receipt system in the country.
The Warehousing (Development and Regulation)
Act, 2007 had been made effective from 25th
October, 2010. As provided in the Act, the
Warehousing Development and Regulatory
Authority has been set up by the Government from
26th October, 2010. With a view to reduce storage
and transit losses (about 6.0% to 10% of total
production) of food grains at the farm and
commercial level, the Government of India had
approved a National Policy on Handling, Storage
and Transportation in June, 2000. Under the policy,
integrated bulk grain handling, storage and
transportation facilities to the tune of 5.5 lakh MTs
had been created through private sector
participation on Build-Own-Operate (BOO) basis.
The Centre has set up a “Grameen Bhandaran
Yojana” program for construction of rural godowns
by entrepreneurs. These are located near farm
lands. These warehouses have defined guidelines,
which makes them eligible for pledge finance,
provided that the material quality is certified.
The Working Group on warehousing studied the
various initiatives taken for the development of the
warehousing sector. These include the Private
Entrepreneurs Godown (PEG), 2008 Scheme. The
Government had formulated this scheme for
creation of additional storage capacity for food
grains through private sector participation in 2008.
Under the scheme, there is a proposal for creation of
15.29 million MTs storage capacity in 19 States
through private sector participation and
CWC/SWCs. The Working Group observed that the
Government of India should formulate a
comprehensive Post Harvest Scheme for the
farmers at the national level.
India should use warehouse receipts to make it
more attractive for banks to lend to the agricultural
sector, to reduce the cost of public support for
agricultural marketing, to reduce transaction costs
and to improve price-risk management .
Commercial banks normally honour receipts made
by CWC or SWC. Private receipts (as in case of rural
private godowns) are not sufficient collaterals,
unless a credible accreditation process is put in
place. In the absence of quality certification of
material, banks can and do provide "lock and key"
financing, wherein the material remains in the
bank's possession. However, this can be used by
large farmers only since a typical godown will have a
capacity of 100-150 tons.
Perception and Attitude of Farmers and Agri Firms Towards Commodity Finance

94ISSN: 0971-1023NMIMS Management ReviewVolume XXII October - November 2012
In MP and Karnataka, the states have made certain
reforms under which private warehouses are
licensed to issue warehouse receipts. Thus rural
godowns are beneficial for producers, though it is
still early days and the penetration is not large. The
licensing authority is SWC and for other states to
implement this, they also need to take similar
regulatory measures. Random regular checks
(audits) are conducted by SWC in MP on rural
godowns licensed to issue WR receipts. There are
guidelines on storage and fumigation.
At the state level, there are similar warehousing
acts, which need to be amended to allow SWC to play
the same role. The commodity business accounts for
between 35%-40% of our GDP (Anonymous, 2004).
In 2001-02, the volume of trade was just Rs 35,000
crore; it was around Rs 100,000 crore in 2002-03.
Loans against commodities were just Rs 23,240
crore in 2001-02 which accounted for less than 2%
of total credit. The reason for this could be that
'futures trading' was not allowed in most
commodities and to the extent that it existed, the
exchanges were localised with little banking
interest. This explains why commodity finance was
higher in case of banks like State Bank of Indore,
State Bank of Saurashtra, Punjab National Bank,
Oriental Bank of Commerce, UCO Bank and Indian
Overseas Bank among others where they tended to
have strong 'regional' presence. Further, such
finance came from local money lenders who were
not answerable to the system. Recently commodity
trading through future contracting has been
beneficial for the Indian economy in a number of
ways. Commodity trading in the futures market
comes in handy to minimize the risks arising out of
fluctuations in demand and supply conditions. It
also helps to preserve the benefits derived from
profitable economic activities.
However, with the springing up of new multi-
commodity exchanges in the country, lending
perception has changed and now commodity
finance is no longer a risky venture. It will directly
help the farmers by providing additional cover and
once we have the banking sector taking informed
business decisions in this area, the government
could gradually withdraw subsidies for agriculture,
as farmers can hedge against bad harvests on the
exchange with banks providing necessary finance.
Commodity finance is becoming popular all over
India; states like Punjab, Haryana and Uttar Pradesh
are pioneers in commodity finance where wheat,
paddy and cotton are grown in large amounts. In
Punjab where wheat, rice and cotton are the major
crops grown, banks have started providing finance
on these crops.
The government had decided to promote the
Warehousing (Development and Regulation) Act,
2007, which entails that farmers can store their
grains in central and state warehouses. The
warehouse receipts, which mention the quantity,
quality and cost of food grains, can then be used as
negotiable instruments to avail bank loans. When
wheat prices soar in October, the farmers can later
sell their produce, stocked safely in the warehouses.
Official sources said they were planning to create
awareness about the Act by holding farmers'
meetings, so they could get better prices for their
produce (Khanna, 2008). Over the past three years,
it has been observed that the prices of wheat shoot
up by 10- 15% before the onset of winters.
Generally, farmers hold back their stocks and store
food grains on their premises, to sell these at
remunerative prices later. Under this scheme, the
farmer can get some loan at the time of harvest,
which will see him through till he decides to sell his
produce.
Scenario of commodity finance in Punjab
Perception and Attitude of Farmers and Agri Firms Towards Commodity Finance
95ISSN: 0971-1023NMIMS Management ReviewVolume XXII October - November 2012
Though the Act has been in place for a long time, it
has had few takers in Punjab. In the past, as the price
of wheat remained almost stable throughout the
year, farmers in Punjab preferred to sell their
produce after harvest, and have not been availing
themselves of the benefits of this scheme. The Act
was amended last year to allow for warehouse
receipts to be granted the status of a fully negotiable
instrument and increase liquidity in rural areas.
This means that a farmer can sell his warehouse
receipt to a private party as and when required. A
farmer can get around 70-75% of the crop value as
loan from the bank. With the new amendments, no
bank can refuse to grant loans on the warehouse
receipts. Another benefit of the scheme is that food
grains are stored in a scientific manner in the 27
central warehouses and 114 state warehouses and
are also insured against calamities. In Ludhiana, rice
and wheat are grown, Bathinda is a cotton belt and
Amritsar is a paddy belt. The takers of commodity
finance are the farmers and industries like rice
mills, cotton factories, spinning units, etc.
Hence, a holistic approach towards commodity
finance will bring out the total benefits of
commodity finance. The stakeholders like the
government, warehouses, banks, traders and
private companies need to be strengthened by way
of strong policy reforms and financial support so
that the agri business chain is strengthened and it
withstands the external and internal shocks.
With this background, the study of attitude and
perception of farmers and industries towards
commodity finance by banks in Bathinda and
Amritsar belts was envisaged with the following
specific objectives:
To study perception and attitude of farmers and
agri firms of Punjab towards commodity
finance.
Research Methodology
Commodity finance is a new concept in India. It
provides credit to farmers and industries, hedges
against risk, provides security, and increases the
investment which will also lead to overall economic
growth. Punjab being a major producer of food
grains like wheat, rice and cash crops like cotton, the
concept of commodity financing is catching up fast.
Banks which are looking for new avenues to extend
credit have started tapping agricultural
commodities as a base for extending credit.
Commodity finance in Punjab is done for wheat, rice
and cotton in some areas like Ludhiana, Bathinda
and Amritsar. Hence, the present study was
conceptualized and conducted in 2010 (January-
May) with the idea of understanding the perception,
attitude and problems faced by farmers and agri
firms towards commodity finance.
An exploratory type of research design is followed
to carry out the research. The population of the
study consists of all the farmers and agri firms of
Punjab who are availing the facility of commodity
finance from financial institutions. A list of farmers
and agri firms availing commodity finance in
Amritsar located in northern Punjab and Bathinda
located in Southern Punjab was obtained from
financial institutions providing commodity finance
to them. Out of this list, 50 farmers and 30 agri firms
availing commodity finance were chosen on the
basis of random sampling technique from Bathinda
and Amritsar. Data was collected through two non
disguised structured questionnaires, one for
farmers and the other for industries. Data was
collected from farmers on behaviour, knowledge
and amount of finance on commodity taken, etc. to
understand the perception and attitude of farmers
towards commodity finance and from owners/
senior managers of agri firms on duration,
Perception and Attitude of Farmers and Agri Firms Towards Commodity Finance

96ISSN: 0971-1023NMIMS Management ReviewVolume XXII October - November 2012
knowledge and amount of finance taken to
understand the perception and attitude of agri firms
towards commodity finance. Responses were
obtained on a 5 point Likert Scale ranging from very
important to not important and from strongly agree
to strongly disagree.
After collection of data, master tables were
constructed and analysis of the collected data was
done by constructing various tables and applying
suitable statistical tools like percentage, mean
scores and Z test.
Frequencies were multiplied with their respective
weights and aggregate values found out. Weighted
average or mean scores were found out using the
formula:
Mean score = Sn * Fn / N
Where,
Sn = Score
Fn = Frequency
N = Sample size
Other statistical tools used for analysis included z-
test that helped in checking the significance of the
mean of the sample chosen. The formula used was-
∑
Z-test
If the calculated value of z exceeds the table value at
5% level of significance, we say the difference
between X and µ is significant.
Double mean z-test was used to find if there were
significant differences in the mean values of two
samples of farmers and agri firms on various
considerations The formula used was-
Two mean Z-test
If the calculated value of z exceeds the table value at
5% level of significance, we say the difference
between samples is significant.
Findings
Perception and attitude of farmers and agri firms
towards commodity finance has been analysed and
compared in this section.
Profiling of the farmers according to their age,
education level, land holding, and annual income
has been done. Analysis of Table 1 clearly indicates
that majority of the respondents i.e. 34% are in the
age group of 28-37, 24% are in the age group of 18-
27 and 22% are in the age group of 38-47. It is clear
that 80% of the respondents are below 47 years of
age. In terms of education, majority of the
respondents i.e. 44% are 10+2, 28% are graduates
Profile of the farmers
Perception and Attitude of Farmers and Agri Firms Towards Commodity Finance
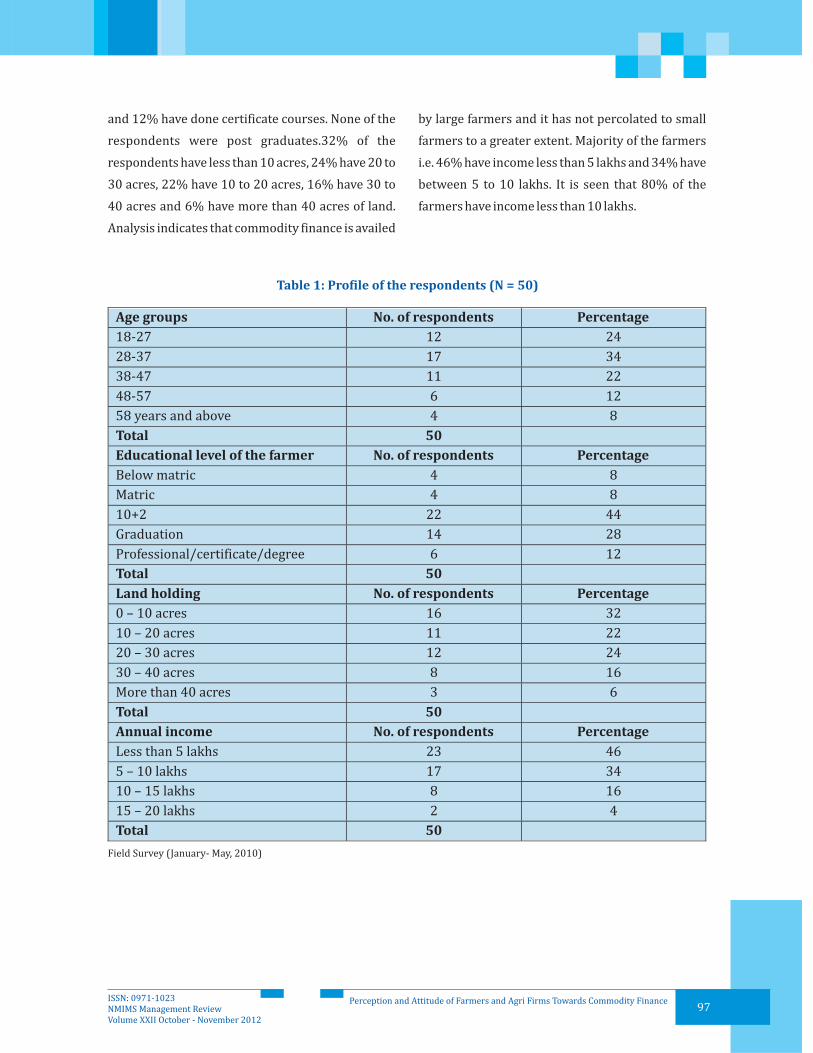
97ISSN: 0971-1023NMIMS Management ReviewVolume XXII October - November 2012
and 12% have done certificate courses. None of the
respondents were post graduates.32% of the
respondents have less than 10 acres, 24% have 20 to
30 acres, 22% have 10 to 20 acres, 16% have 30 to
40 acres and 6% have more than 40 acres of land.
Analysis indicates that commodity finance is availed
by large farmers and it has not percolated to small
farmers to a greater extent. Majority of the farmers
i.e. 46% have income less than 5 lakhs and 34% have
between 5 to 10 lakhs. It is seen that 80% of the
farmers have income less than 10 lakhs.
Table 1: Profile of the respondents (N = 50)
Field Survey (January- May, 2010)
Perception and Attitude of Farmers and Agri Firms Towards Commodity Finance

98ISSN: 0971-1023NMIMS Management ReviewVolume XXII October - November 2012
Annual income v/s land holding
A comparison of the annual income and land holding of the farmers is given in Table 2.
Table 2: Annual income v/s land holding (N = 50)
Source: Same as Table 1
From Table 2, it is clear that 80% of the respondents have income less than 10 lakhs and their land holding is
less than 30 acres.
Profile of agri firms according to their current annual turnover, type of the enterprise, investment in plant
and machinery and number of employees in the enterprise are enumerated in Table 3.
Profile of agri firms
Table 3: Profile of agri firms (N = 30)
Source: Same as Table 1
Perception and Attitude of Farmers and Agri Firms Towards Commodity Finance
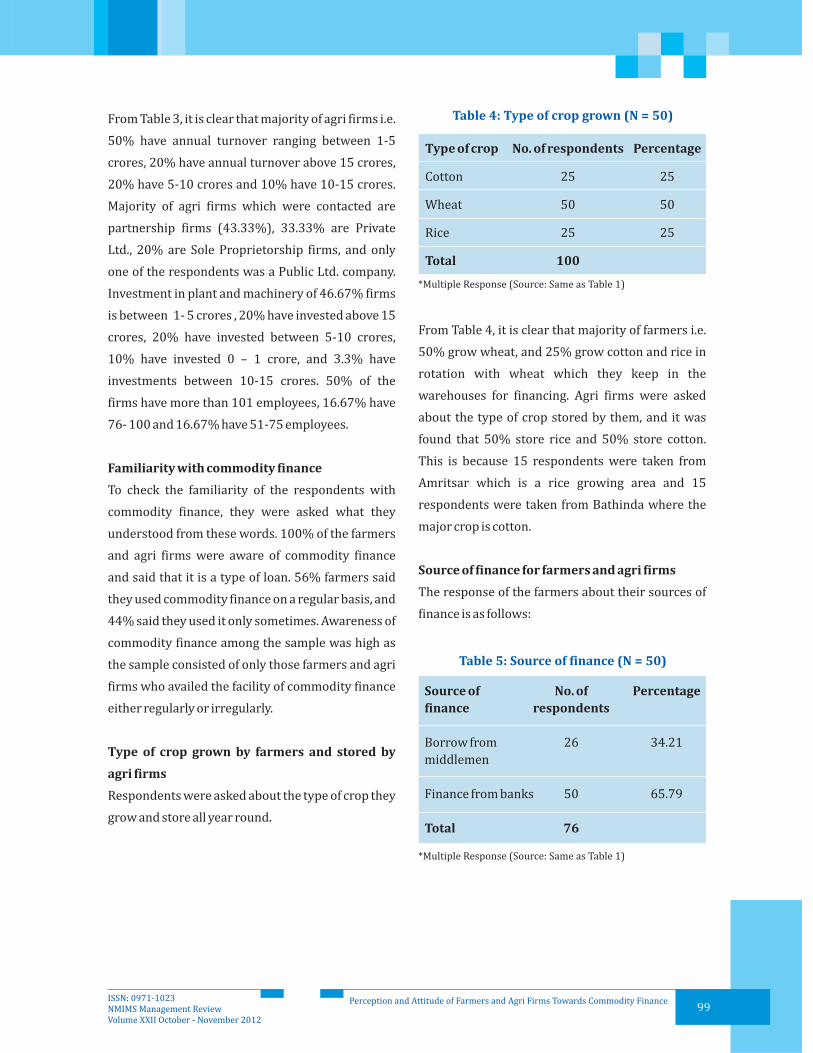
99ISSN: 0971-1023NMIMS Management ReviewVolume XXII October - November 2012
From Table 3, it is clear that majority of agri firms i.e.
50% have annual turnover ranging between 1-5
crores, 20% have annual turnover above 15 crores,
20% have 5-10 crores and 10% have 10-15 crores.
Majority of agri firms which were contacted are
partnership firms (43.33%), 33.33% are Private
Ltd., 20% are Sole Proprietorship firms, and only
one of the respondents was a Public Ltd. company.
Investment in plant and machinery of 46.67% firms
is between 1- 5 crores , 20% have invested above 15
crores, 20% have invested between 5-10 crores,
10% have invested 0 – 1 crore, and 3.3% have
investments between 10-15 crores. 50% of the
firms have more than 101 employees, 16.67% have
76- 100 and 16.67% have 51-75 employees.
To check the familiarity of the respondents with
commodity finance, they were asked what they
understood from these words. 100% of the farmers
and agri firms were aware of commodity finance
and said that it is a type of loan. 56% farmers said
they used commodity finance on a regular basis, and
44% said they used it only sometimes. Awareness of
commodity finance among the sample was high as
the sample consisted of only those farmers and agri
firms who availed the facility of commodity finance
either regularly or irregularly.
Respondents were asked about the type of crop they
grow and store all year round.
Familiarity with commodity finance
Type of crop grown by farmers and stored by
agri firms
Table 4: Type of crop grown (N = 50)
Type of crop No. of respondents Percentage
Total 100
Cotton 25 25
Wheat 50 50
Rice 25 25
*Multiple Response (Source: Same as Table 1)
From Table 4, it is clear that majority of farmers i.e.
50% grow wheat, and 25% grow cotton and rice in
rotation with wheat which they keep in the
warehouses for financing. Agri firms were asked
about the type of crop stored by them, and it was
found that 50% store rice and 50% store cotton.
This is because 15 respondents were taken from
Amritsar which is a rice growing area and 15
respondents were taken from Bathinda where the
major crop is cotton.
The response of the farmers about their sources of
finance is as follows:
Source of finance for farmers and agri firms
Table 5: Source of finance (N = 50)
Source of No. of Percentage
finance respondents
Total 76
Borrow from 26 34.21
middlemen
Finance from banks 50 65.79
*Multiple Response (Source: Same as Table 1)
Perception and Attitude of Farmers and Agri Firms Towards Commodity Finance

100ISSN: 0971-1023NMIMS Management ReviewVolume XXII October - November 2012
Table 5 shows that majority of farmers i.e. 65.79% arrange their money from banks, and 34.21% obtained
finance from arhtiyas / middlemen. Banks are now being visualized by the farmers as an alternative for
obtaining finances. A clear shift from arhtiyas (middlemen) to banks was noticed for financing purpose. All
the agri firms approach banks for their financing needs.
Respondents were asked about the percentage of total quantity of produce against which commodity finance
is taken from banks.
Quantity financed through commodity finance by farmers
Table 6: Quantity of produce financed through commodity finance by farmers (N = 50)
Source: Same as Table 1
From Table 6, it is clear that majority of the farmers
i.e. 38% get 20 – 30 % of the produce financed, 24%
get 30 – 40%, 20% get more than 50% and 18% get
40 – 50% of their produce financed through
commodity finance. 62% of the farmers get less
than 40% produce financed. Agri firms (100%) get
more than 50% of their commodity financed from
banks.
Out of the total value of commodity stored in the
warehouse by the customer, banks provide 75%
finance. So the respondents were asked about the
Financing obtained through commodity finance
by farmers
value of the commodity stored in warehouses each
year by the farmers and it was found that majority of
farmers i.e. 70% stored commodities worth less
than 5 lakhs and 30% stored commodities worth 5 –
10 lakhs. They were also asked about the amount
they borrow on a per annum basis and it was found
that 82% borrow less than Rs 5 lakhs, and 18%
borrow between Rs 5 – 10 lakhs on a per annum
basis.
Agri firms were asked about the investments they
make in storing commodity and the amount they
borrow on a per annum basis.
Perception and Attitude of Farmers and Agri Firms Towards Commodity Finance

101ISSN: 0971-1023NMIMS Management ReviewVolume XXII October - November 2012
Table 7: Investment made in storing crop and amount borrowed
on an annual basis by agri firms (N = 30)
Source: Same as Table 1
From Table 7, it is clear that majority of agri firms i.e. 50% invest 1 – 5 crores, 30% invest 5 – 10 crores, 10%
invest less than 1 crore and 10% invest more than 10 crores in crop storage. Majority of the respondents i.e.
50% borrow 1 – 5 crores, 26.67% borrow 5 – 10 crores, 16.67% borrow less than 1 crore, and 6.67% borrow
more than 10 crores.
Commodity financing is done for 1 year as it is a short term loan. The respondents (farmers and agri firms)
were asked about the duration within which they repay their loan taken from the bank.
Duration of finance
Table 8: Duration of finance
Source: Same as Table 1
Perception and Attitude of Farmers and Agri Firms Towards Commodity Finance
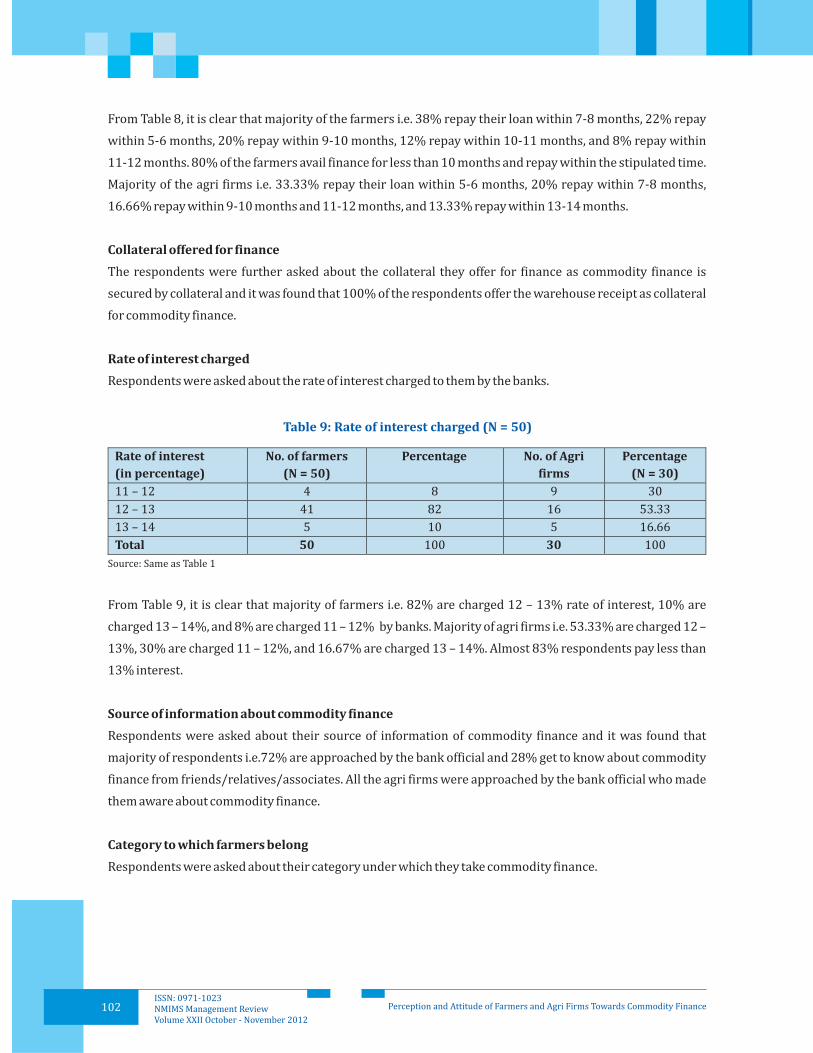
102ISSN: 0971-1023NMIMS Management ReviewVolume XXII October - November 2012
From Table 8, it is clear that majority of the farmers i.e. 38% repay their loan within 7-8 months, 22% repay
within 5-6 months, 20% repay within 9-10 months, 12% repay within 10-11 months, and 8% repay within
11-12 months. 80% of the farmers avail finance for less than 10 months and repay within the stipulated time.
Majority of the agri firms i.e. 33.33% repay their loan within 5-6 months, 20% repay within 7-8 months,
16.66% repay within 9-10 months and 11-12 months, and 13.33% repay within 13-14 months.
The respondents were further asked about the collateral they offer for finance as commodity finance is
secured by collateral and it was found that 100% of the respondents offer the warehouse receipt as collateral
for commodity finance.
Respondents were asked about the rate of interest charged to them by the banks.
Collateral offered for finance
Rate of interest charged
Table 9: Rate of interest charged (N = 50)
Source: Same as Table 1
From Table 9, it is clear that majority of farmers i.e. 82% are charged 12 – 13% rate of interest, 10% are
charged 13 – 14%, and 8% are charged 11 – 12% by banks. Majority of agri firms i.e. 53.33% are charged 12 –
13%, 30% are charged 11 – 12%, and 16.67% are charged 13 – 14%. Almost 83% respondents pay less than
13% interest.
Respondents were asked about their source of information of commodity finance and it was found that
majority of respondents i.e.72% are approached by the bank official and 28% get to know about commodity
finance from friends/relatives/associates. All the agri firms were approached by the bank official who made
them aware about commodity finance.
Respondents were asked about their category under which they take commodity finance.
Source of information about commodity finance
Category to which farmers belong
Perception and Attitude of Farmers and Agri Firms Towards Commodity Finance

103ISSN: 0971-1023NMIMS Management ReviewVolume XXII October - November 2012
Table 10: Category of farmer for commodity finance (N = 50)
Source: Same as Table 1
From Table 8, it is clear that majority of the farmers i.e. 60% avail finance as individual farmers, 24% avail
finance under joint liability groups and 16% farmers are commission agents also.
Farmers were asked if the bank issued the loan once, in instalments, or as per convenience of the customer.
According to 66% farmers, banks issued the loan once and 34% said that banks issued the loan as per
convenience of the customer. Majority of the agri firms i.e. 86.67% said that banks issue loan as per
convenience of the customer, and 13.33% said that banks issue loan once.
Respondents were asked about the time taken by the bank to issue the loan.
Regularity of payment of loan
Time taken to issue the loan
Table 11: Time taken to issue the loan
Source: Same as Table 1
Table 11 shows that majority of farmers i.e. 56% said that banks issued the loan in less than 2 weeks, 30%
said banks issued the loan in 2 to 3 weeks, and 14% said that banks issued loan in 3 to 4 weeks. Middlemen
also take around 5 to 10 days for providing finance to farmers. So commodity finance is a fast means of
finance provided by banks as 86% respondents said banks take less than 3 weeks to issue the loan. Majority
of the agri firms i.e. 70% said that banks take less than 2 weeks to issue the loan and 30% said that banks take
2 to 3 weeks.
Farmers and agri firms were asked about the follow up taken up by bank for repayment of loan.
Follow up by bank
Perception and Attitude of Farmers and Agri Firms Towards Commodity Finance
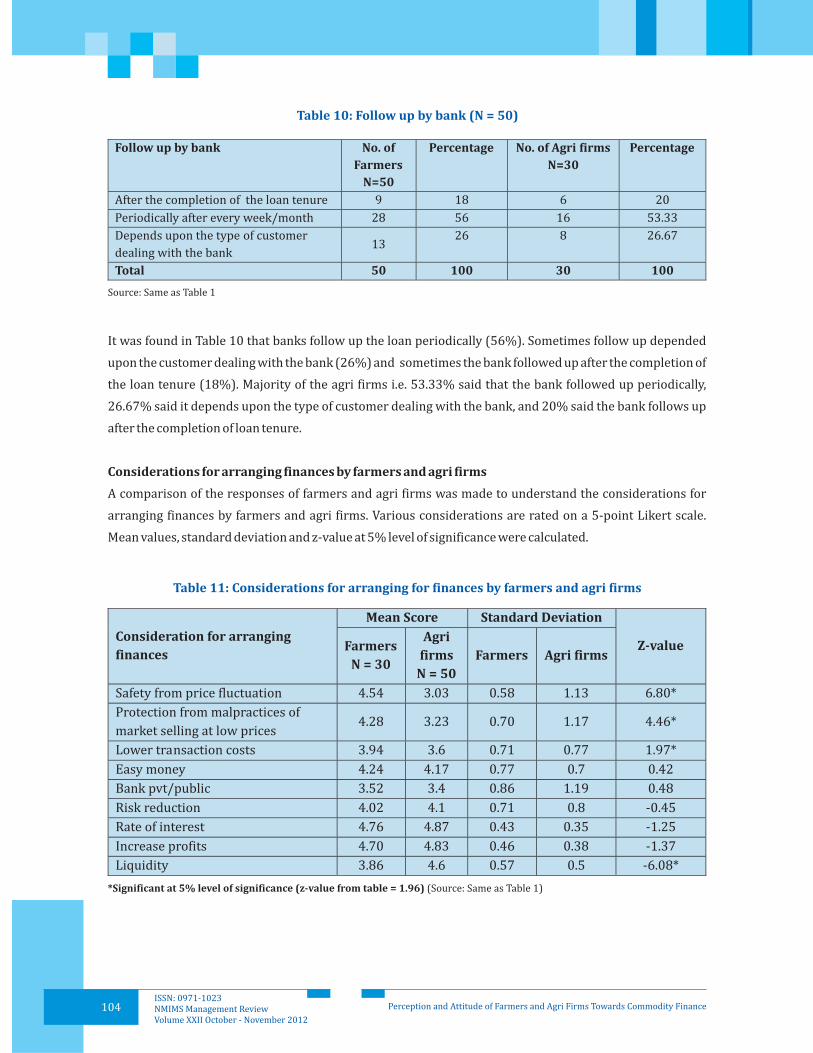
104ISSN: 0971-1023NMIMS Management ReviewVolume XXII October - November 2012
Table 10: Follow up by bank (N = 50)
Source: Same as Table 1
It was found in Table 10 that banks follow up the loan periodically (56%). Sometimes follow up depended
upon the customer dealing with the bank (26%) and sometimes the bank followed up after the completion of
the loan tenure (18%). Majority of the agri firms i.e. 53.33% said that the bank followed up periodically,
26.67% said it depends upon the type of customer dealing with the bank, and 20% said the bank follows up
after the completion of loan tenure.
A comparison of the responses of farmers and agri firms was made to understand the considerations for
arranging finances by farmers and agri firms. Various considerations are rated on a 5-point Likert scale.
Mean values, standard deviation and z-value at 5% level of significance were calculated.
Considerations for arranging finances by farmers and agri firms
Table 11: Considerations for arranging for finances by farmers and agri firms
*Significant at 5% level of significance (z-value from table = 1.96) (Source: Same as Table 1)
Perception and Attitude of Farmers and Agri Firms Towards Commodity Finance

105ISSN: 0971-1023NMIMS Management ReviewVolume XXII October - November 2012
From Table 11, it is clear that for farmers, the rate of
interest (4.76) and increase in profits (4.70) are the
major considerations while arranging finances
followed by the safety from price fluctuations
(4.54), lower post harvest losses due to storage
(4.52) and protection from malpractices of market
selling at low prices (4.28). Easy money (4.24),
liquidity (3.86), risk reduction (4.02) and lower
transaction costs (3.94) came next. All the factors
were found to be significant at 5% level of
significance.
For agri firms, the rate of interest (4.87) and the
increase in profits (4.83) are the major
considerations, then comes the liquidity (4.60)
followed by risk reduction (4.10) and lower
transaction costs (3.60). It is also seen that price
fluctuation is least important as the commodity is
available in season in bulk and agri firms buy them
in the season. Also the protection from malpractices
of market selling at low prices, easy money and type
of bank i.e. private or public are not very important
considerations for the agri firms. Factors like rate of
interest, increase in profits, liquidity, risk reduction,
and lower transaction costs were found to be
significant at 5% level of significance.
The responses of farmers and agri firms about
commodity finance were compared and found to be
significantly different in their views about safety
from price fluctuation, practices from malpractices
of market selling at low prices, and lower
transaction costs. Farmers and agri firms do not
differ significantly on the parameters of easy money,
bank pvt/public, risk reduction, rate of interest,
higher profits and liquidity.
In this part, respondents were asked to compare
commodity finance with other sources of finance on
a 5-point Likert scale. The mean score and z-value of
various considerations were calculated and z-value
of two mean scores were calculated at 5% level of
significance to compare the responses of farmers
and agri firms.
Comparison of other sources of finance with
commodity finance by farmers and agri firms
Table 12: Various considerations for comparison of other sources of finance
with commodity finance by farmers and agri firms
*Significant at 5% level of significance (z-value from table = 1.96) (Source: Same as Table 1)
Perception and Attitude of Farmers and Agri Firms Towards Commodity Finance

106ISSN: 0971-1023NMIMS Management ReviewVolume XXII October - November 2012
Table 12 shows that farmers felt that commodity
finance is secured by collateral as compared to other
sources of finance (4.66). Commodity finance is safe
as compared to other means of finance. Commodity
finance has more benefits (4.38), is safer (4.32), but
is not easily available (2.90) and it depends on the
availability of the warehouse (4.46). Commodity
financing did not require a large number of
formalities (1.98). All the factors except easy
availability were found to be significant at 5% level
of significance.
Agri firms also felt that commodity finance is
secured by collateral (4.83) as compared to the
other sources of finance. Commodity finance is safer
as compared to other means of finance (4.57).
Commodity finance has more benefits (4.17), is
easily available (3.87) and it depends on the
availability of the warehouse (4.30) but compared
to other sources of finance, commodity finance
requires a large number of formalities (2.30). All the
considerations were found to be significant at 5%
level of significance.
Farmers and agri firms are significantly different in
their views about easy availability of commodity
finance. There is no significant difference in the
view of farmers and agri firms regarding the
remaining parameters.
Respondents were asked whether warehouses for
availing commodity finance were easily available; it
was found that majority of farmers i.e. 70% said that
warehouses were not easily available, and 30% said
warehouses were easily available. All the agri firms
said that warehouses were easily available.
The respondents were asked to rate their
satisfaction level on a 5-point Likert scale. The mean
score and z-value were calculated at 5% level of
significance to compare the responses of farmers
and agri firms.
Availability of warehouse
Satisfaction with commodity finance by farmers
and agri firms
Table 13: Satisfaction with commodity finance by farmers and agri firms
*Significant at 5% level of significance (z-value from table = 1.96) (Source: Same as Table 1)
Perception and Attitude of Farmers and Agri Firms Towards Commodity Finance

107ISSN: 0971-1023NMIMS Management ReviewVolume XXII October - November 2012
From Table 13, it is clear that farmers are mostly
satisfied by the knowledge and guidance provided
by bank officials (4.10) and also satisfied from their
dealings with bank officials (4.20). All the factors
are found to be significant at 5% level of
significance. On the whole, 44% respondents were
found to be somewhat satisfied, 40% were very
satisfied and 16% were extremely satisfied from the
services of the bank.
Agri firms are mostly satisfied from their dealings
with bank officials (4.30) and from easy, clear
information about commodity finance (4.17). Agri
firms feel that the time taken to issue the loan is long
(4.20). They also feel that it is easy to understand
and complete formalities for commodity finance
(3.97). Agri firms are also satisfied with the
knowledge and guidance provided by the bank
official (4.13). All the factors are found to be
significant at 5% level of significance.
Responses of farmers and agri firms are
significantly different in their views on time taken to
issue loans, easy to understand and complete
formalities, and ease/clarity of information
provided by the banks.
Importance given to various considerations
while availing commodity finance by farmers
and agri firms
Table 14: Importance given to various considerations while
availing commodity finance by farmers and agri firms
*Significant at 5% level of significance (z-value from table = 1.96) (Source: Same as Table 1)
Perception and Attitude of Farmers and Agri Firms Towards Commodity Finance

108ISSN: 0971-1023NMIMS Management ReviewVolume XXII October - November 2012
From Table 14, it is clear that respondents feel that
financing from banks requires too many formalities
and paperwork (4.02). Also they feel that they have
difficulty in providing the collaterals (3.56) for
commodity finance as the warehouses are not easily
available. High rate of interest (3.58), difficulty in
providing the required documents (3.36) and
insufficient amount of finance (3.30) are other
important considerations. Farmers gave little
consideration to the delays in disbursement of loans
(2.54) due to long processing time (2.50) and
unwillingness of bank officials to sanction loans
without approach (1.82) and unaccounted
expenses like bribe which is involved in getting
commodity finance. Analysis indicates that
commodity finance is easily available and without
much hassles. All the constraints were significant at
5% level of significance.
Agri firms feel that financing from banks requires
too many formalities and paperwork (3.57). The
rest of the factors were not very important for agri
firms. All the constraints were significant at 5%
level of significance.
Farmers and agri firms are significantly different in
their views about difficulty in providing collaterals,
difficulty in providing required documents,
insufficient amount of finance, high rate of interest,
delay in sanctioning loan, and too many formalities
and paperwork involved.
Respondents were asked based on their experience
about commodity finance if they will recommend
commodity finance to others.
Recommend to others
Table 15: Recommend to others
Source: Same as Table 1
From Table 15, it is clear that majority of farmers i.e.
56% will probably recommend it to others, 30% will
definitely recommend, and 14% are not sure.
Farmers were further asked whether they would
like to move back to old financing methods. More
than half i.e. 56% are unlikely to move back to old
financing methods whereas 32% are very unlikely,
and 12% are somewhat unlikely to move back to old
financing methods.
Majority of agri firms i.e. 43.33% will probably
recommend commodity finance to others, 40% said
they will definitely recommend, 10% said probably
they will not recommend, and 6.67% were not sure
about whether they will recommend or not. 83%
respondents will recommend commodity finance to
others. Further agri firms were asked about their
likeliness to move back to old financing methods
and it was found that 90% are very unlikely to move
back to old financing methods and 10% were likely
to move.
Agri firms were asked about their satisfaction with
the services they get from the bank regarding
commodity finance. The distribution is given in the
following table.
Satisfaction with the services of the bank
Perception and Attitude of Farmers and Agri Firms Towards Commodity Finance

109ISSN: 0971-1023NMIMS Management ReviewVolume XXII October - November 2012
Table 16: Satisfaction with the services of the bank (N = 30)
Source: Same as Table 1
From Table 16, it is clear that majority of the farmers i.e. 76.67% are very satisfied, 13.33% are somewhat
satisfied, and 10% are extremely satisfied with the services of the bank.
Commodity finance in case of agricultural
commodities is a short term finance provided by
banks to the farmers backed by the warehouse
receipt which the bank uses as a collateral. The loan
is self liquidating in nature. The study reveals that
the facility of commodity finance is better than the
traditional financing facilities and farmers and agri
firms who are availing this facility are overall
satisfied with it as they get 75% value of the
commodity as finance. This has brought them out of
the vicious cycle of local moneylenders. Farmers
need not resort to distress sale of their produce. But
the interest presently charged (12-13%) on the
finance should be reduced to make it more
beneficial for the farmers. Sometimes the problem
of warehouse is faced by the farmers and agri-firms.
The warehousing policy of the government needs to
readjust with the changed requirements of farmers.
New facilities need to be created for warehousing.
But it has been felt that there is a lack of awareness
among the small farmers and firms regarding
commodity finance. There is also lack of initiative on
the part of most banks to provide this facility. Only a
few banks have entered this field.
Conclusion
The landscape of commodity finance has changed
radically over the past decade. Companies involved
in commodity trade have changed, the regulatory
regime under which they operate has seen a far-
reaching liberalization, borders between banks,
investment funds, insurance companies and
international traders have opened up and
Government controls have reduced. Commodity
financing in Asia is evolving rapidly (Bell, 2007).
Warehouse receipt financing is, however, a
speculative activity and farmers have to be educated
on the market's behaviour and given adequate tools
to ensure that their profits are not lost as a result of
speculation. Other factors critical to successful
warehouse receipt systems are, building discipline
and trust in the warehouse, operations on a large
scale, appropriate product pricing, adequate
regulation and supervision of the sector.
Perception and Attitude of Farmers and Agri Firms Towards Commodity Finance

110ISSN: 0971-1023NMIMS Management ReviewVolume XXII October - November 2012
• Adhikary M and Pal M (2009). Response of marketed surplus: A case study of paddy in Burdwan district,
, 41(1): 79-90.
Anonymous (2004). Rediscovering commodity finance http://www.financialexpress.com/printer/
news/86105/
Bass J and Henderson K (2000). . Pp 9 MBP Research
Publications, USA.
B e l l J ( 2 0 0 7 ) . A s i a n c o m m o d i t y f i n a n c e r e m a i n s o n t h e g r o w t h c u r v e
http://www.tradefinancemagazine.com/Article/2135900/Search/Results/Asian-commodity-finance-
remains-on-the-growth-curve.html?Keywords=commodity+finance
Department of Economic Affairs, Ministry of Finance, Government of India (2007). Report of Expert
group on agricultural indebtedness by Banking Division www.igidr.ac.in/pdf/publication/PP-059.pdf
Ghosal S (2011). Potato farmers in West Bengal go in for distress sales. December 14,
2011.
Giovannuci D, Varangis P and Larsen D F (2000). Warehouse receipts: facilitating credit and commodity
markets. . PP 1-8.
Hollinger F and Rutten L (2009). The use of warehouse receipt finance in agriculture in ECA countries
http://www.eastagri.org/publications/pub_docs/FAO_EBRD%20Warehouse%20Receipt%20Financi
ng.pdf
International Finance Corporation (2012). Opportunities in Financial markets: critical commodities
Finance programme. www.ifc.org
Jindal A (2010).
Research Project Report. Department of Business Management, PAU, Ludhiana
Karchalli R and Naik M (2012). Farmers resorted to distress sale of cattle in North Karnataka.
July 24, 2012.
Khanna R M (2008). Poll code comes in way of price plan for wheat farmers:
http://www.tribuneindia.com/2008/20080313/punjab1.htm
Lacroix R and Varangis P (1996). Using warehouse receipts in developing and transition economies.
: 36-39.
Mor N and Fernandes K (2009). Warehouse receipt finance for farmers-A glimpse.
PP 42-47. MCX and PWHC.
Indian Journal of Regional Science
Warehouse receipts: Financing agricultural producers
The Economic Times
Paper: A guide to developing agricultural markets and agro-enterprise
A study of perception and attitude of farmers and agri firms of Punjab towards commodity
finance.
The Times of
India, Hubli
The Tribune
Journal of Finance & Development
Commodity Insights
Year Book 2009
•
•
•
•
•
•
•
•
•
•
•
•
•
33
References
Perception and Attitude of Farmers and Agri Firms Towards Commodity Finance

111ISSN: 0971-1023NMIMS Management ReviewVolume XXII October - November 2012
•
•
•
•
•
•
•
•
NDTV(2002). Orissa cotton farmers forced into distress sales. , December 29,
2002.
Onumah G E (2003). Improving access to rural finance through regulated warehouse receipt systems in
Africa.
, Washington, USA.
Pattanayak N C (2012). Keonjhar farmers face distress sale of vegetables. ,
, Feb. 2012.
Planning Commission, Government of India (2011). Report of Working Group on Warehousing
Development and Regulation for the Twelfth Plan Period (2012-17).
Trade and Commodity Finance (2012) www.robobank.com
UNCTAD Secretariat (2001). Potential Applications of Structured Commodity Financing Techniques for
Banks in Developing Countries.
Trade Finance Infrastructure Development Handbook for
Economies in Transition pp 37-47. www.unescap.org/tid/publication/tipub2374_chap4.pdf
Trade and Development Board, Trade and Development Commission, UNCTAD Secretariat (2010).
Access to Commodity Finance by Commodity Dependent Countries.
Info change food security
Paper presented at conference on Paving the way forward for rural finance: An international
conference on best practices
The Times of India
Bhubaneswar
Structured trade and commodity financing.
A note by UNCTAD Secretariat, Item 6,
Second session, Geneva.
Dr. (Mrs) Babita Kumar is Associate Professor with Department of Business Management PAU, Ludhiana.
Mrs Gagandeep Banga is Associate Professor with Department of Business Management PAU, Ludhiana.
Mr Ajay Jindal is an MBA student in the Department of Business Management, PAU Ludhiana.
Perception and Attitude of Farmers and Agri Firms Towards Commodity Finance

112ISSN: 0971-1023NMIMS Management ReviewVolume XXII October - November 2012

NMIMS is starting two additional high-quality scholarly journals. They are:
Pharmacy in Multi-disciplinary Journal of Pharmacy, Science, Engineering and
Technology, and Journal of Economic and Public Policy.
We are soliciting manuscripts for publication in these journals which will
follow the tradition of double-blind review.
Please see the following URL for more details.
Dean, Research
NMIMS University
Dr. Gurumurthy Kalyanaram
www.nmims.edu

V. L. Mehta Road, Vile Parle (W), Mumbai-400 056 INDIA • Tel: +91-22-4235 5555
Telefax : 26114512 • Email: [email protected] • Visit us at www.nmims.edu
(Declared as Deemed-to-be University under Section 3 of the UGC Act, 1956)
Narsee Monjee Institute of Management StudiesSVKM’s
Mosaic
Desig
n Ideas: +
91-2
2-6
4509021