Management Quality and Carbon Performance of cement ...
11
Simon Dietz, Dan Gardiner, Glen Gostlow, Margarita Grabert, Michal Nachmany, Rory Sullivan, Emily van der Merwe Management Quality and Carbon Performance of cement producers: update September 2018
Transcript of Management Quality and Carbon Performance of cement ...

Simon Dietz, Dan Gardiner, Glen Gostlow, Margarita Grabert, Michal Nachmany, Rory Sullivan, Emily van der Merwe
Management Quality and Carbon Performance of cement producers: update
September 2018

2
Disclaimer
1. All information contained in this report and on the TPI website is derived from
publicly available sources and is for general information use only. Information can change without notice and The Transition Pathway Initiative does not guarantee the accuracy of information in this report or on the TPI website, including information
provided by third parties, at any particular time.
2. Neither this report nor the TPI website provides investment advice and nothing in
the report or on the site should be construed as being personalised investment advice for your particular circumstances. Neither this report nor the TPI website takes account of individual investment objectives or the financial position or specific needs
of individual users. You must not rely on this report or the TPI website to make a financial or investment decision. Before making any financial or investment decisions, we recommend you consult a financial planner to take into account your personal
investment objectives, financial situation and individual needs.
3. This report and the TPI website contain information derived from publicly available
third party websites. It is the responsibility of these respective third parties to ensure this information is reliable and accurate. The Transition Pathway Initiative does not warrant or represent that the data or other information provided in this report or on
the TPI website is accurate, complete or up-to-date, and make no warranties and representations as to the quality or availability of this data or other information.
4. The Transition Pathway Initiative is not obliged to update or keep up-to-date the information that is made available in this report or on its website.
5. If you are a company referenced in this report or on the TPI website and would like further information about the methodology used in our publications, or have any concerns about published information, then please contact us. An overview of the
methodology used is available on our website.
6. Please read the Terms and Conditions which apply to use of the website.
RESEARCH FUNDING PARTNERS:
We would like to thank our Research Funding Partners, Aberdeen Standard Investments, BNP Paribas Asset Management and Legal & General Investment Management, for their ongoing support to the Transition Pathway Initiative and their enabling the research behind this report and its publication.
3
1. Introduction
About the Transition Pathway Initiative
The Transition Pathway Initiative (TPI) is a global initiative led by asset owners and supported by asset managers. Established in January 2017, TPI investors now collectively represent over UK£7/US$9 trillion of assets under management.1
TPI assesses the progress of large public companies on the transition to a low-carbon economy. These assessments are updated annually and published through an open access online tool.
The tool, together with further details of how investors can use the data, can be found at: www.transitionpathwayinitiative.org.
This report
This latest TPI report assesses 21 of the world’s largest publicly listed cement producers,2 updating and extending our previous analysis of the sector from September 2017.[1]
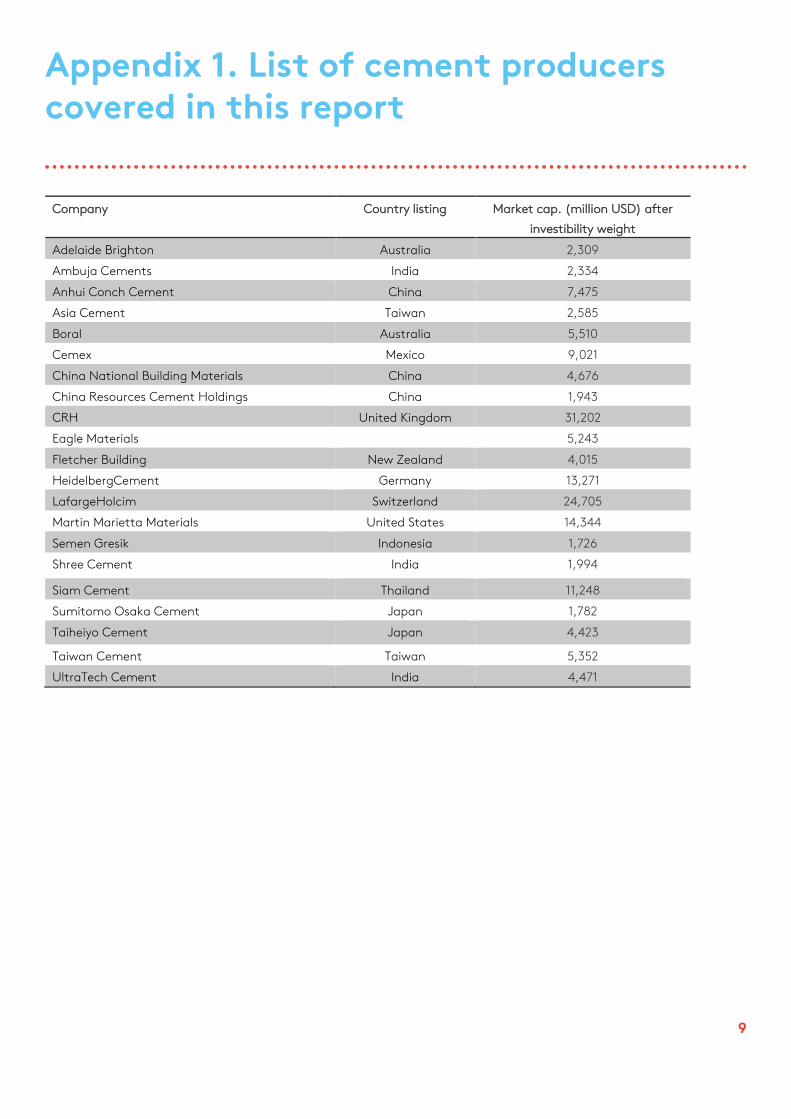
Full details of the companies assessed can be found in Appendix 1.
Brief overview of methodology
TPI’s assessment is divided into two parts:
1. Management Quality covers companies’
management/governance of greenhouse gas
emissions and the risks and opportunities arising
from the low-carbon transition.
2. Carbon Performance assessment involves
quantitative benchmarking of companies’
emissions pathways against the international
targets and national pledges made as part of the
2015 UN Paris Agreement.
We assess Management Quality and Carbon
Performance separately, because research shows
the relationship between them is by no means clear
cut. Management Quality assessment focuses on
processes, while Carbon Performance focuses on
outcomes. Together they are intended to provide a
holistic view of companies’ progress on the low-
carbon transition. The framework is aligned with
recommendations of the FSB Taskforce on Climate-
1 As of 5 June 2018.
related Financial Disclosures (TCFD), tracking
companies in relation to TCFD’s four
recommendation areas: governance, strategy, risk
management, and metrics and targets.
Management Quality
TPI’s Management Quality framework comprises five levels:
Level 0 – Unaware of (or Not Acknowledging)
Climate Change as a Business Issue;
Level 1 – Acknowledging Climate Change as a
Business Issue;
Level 2 – Building Capacity;
Level 3 – Integrating into Operational Decision
Making;
Level 4 – Strategic Assessment.
Companies are allocated to a level based on how they perform against 16 indicators, each of which tests whether a company has implemented a particular carbon management practice. The data underpinning the indicators are provided by FTSE Russell.
Carbon Performance
In this report we benchmark the emissions intensity of cement production against three scenarios that are derived from modelling by the International Energy Agency (IEA):
Paris Pledges, consistent with the emissions
reductions pledged by countries as part of the
Paris Agreement in the form of Nationally
Determined Contributions or NDCs.
2 Degrees, consistent with the overall aim of the
Paris Agreement to hold “the increase in the
global average temperature to well below 2°C
above pre-industrial levels and to pursue efforts
to limit the temperature increase to 1.5°C above
pre-industrial levels”, albeit at the low end of
the range of ambition.
Below 2 Degrees, consistent with a more
ambitious interpretation of the Paris
Agreement’s overall aim.
Further details on methodology can be found in our latest Methodology and Indicators Report.[2]
2 This is a version of December 2018 correcting some inaccuracies in the initial September 2018 release.
4
2. Management Quality
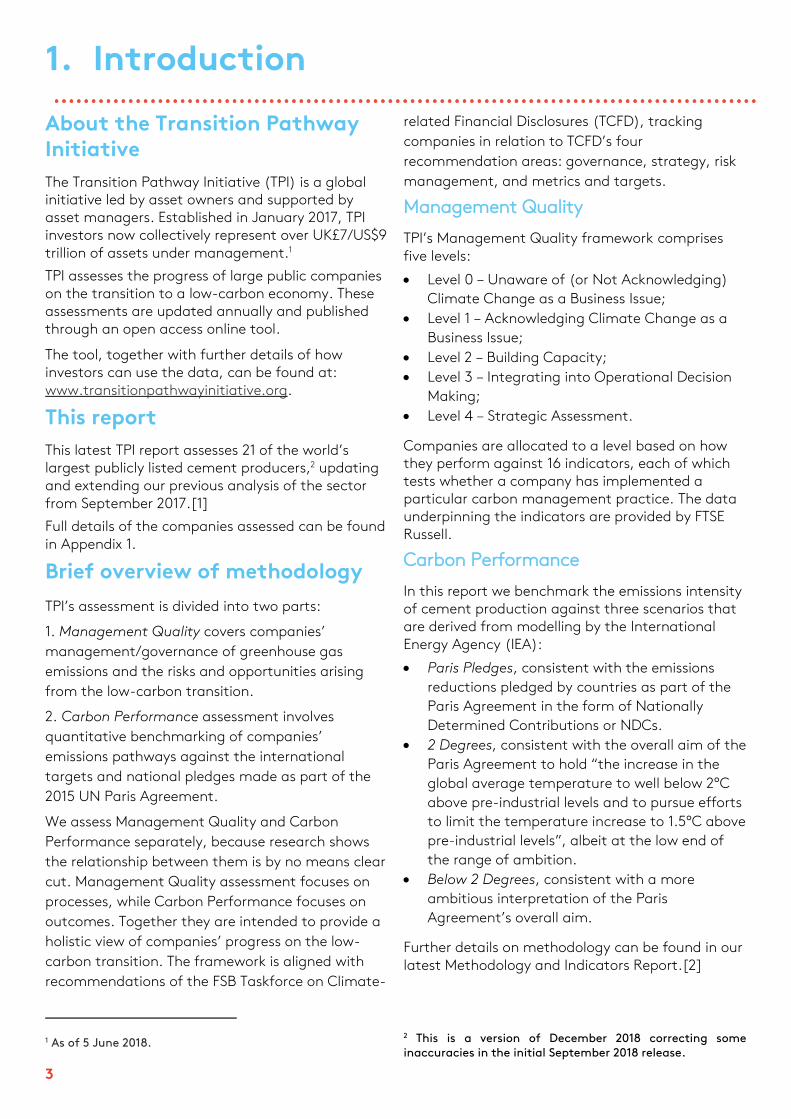
Overview
Figure 1 shows the number of cement producers on each Management Quality level.
As in some other industries, there is a cluster of leaders on Level 4 and laggards on Level 1. Seven companies are on Level 1 – Acknowledging Climate Change as a Business Issue. Six of the seven companies on this level have a climate change policy in place, but do not explicitly recognise climate change as a relevant risk and/or opportunity for the business. The exception is Eagle Materials, which does the opposite.
Eight companies have made it to Level 4 – Strategic Assessment. These companies satisfy all TPI’s indicators on Levels 0-3 and are undertaking some, but not all, of the following: setting quantitative, long-term emissions targets; incorporating ESG issues into executive remuneration; incorporating climate change risks and opportunities in company strategy; undertaking climate scenario planning; disclosing their internal carbon price.
The average level score of the 21 cement producers assessed here is 2.3, which corresponds with Level 2 – Building Capacity.
Figure 1. Management quality of the world’s top cement producers
Level 0
Unaware
Level 1
Awareness
Level 2
Building capacity
Level 3
Integrating into
operational decision
making
Level 4
Strategic
assessment
Ambuja Cements↑1
Asia Cement↑1
Cemex↔
CRH↑1
HeidelbergCement↔
LafargeHolcim↑1
Shree Cement↔
UltraTech Cement↔
Siam Cement↑2
Taiheiyo Cement↔
Boral↔
Fletcher Building↑1
Adelaide Brighton↔
China National
Building Materials↑1
China Resources
Cement HoldingsNEW
Eagle MaterialsNEW
Semen Indonesia↔
Sumitomo Osaka
CementNEW
Taiwan Cement↓1
––Anhui Conch
Cement↔
Martin Marietta
Materials↔

Trends in Management Quality
In terms of the sector average, there is only a slight change in the performance of cement producers since they were first assessed by TPI in September 2017. At that time, the average level score was 2.1. This contrasts with other sectors recently assessed by TPI, which did show more improvement on last year (i.e. coal mining, electricity, and oil and gas).[3]
Additionally, we see individual companies moving up and down levels compared with 2017 (Figure 2). Of the 18 companies assessed both last year and this, seven companies move up at least one level, while one company moves down at least one level.
Siam Cement progresses from Level 1 to Level 3 by explicitly recognising climate change as a relevant risk and/or opportunity for the business.
Figure 2. Companies that have moved up or down levels since the TPI 2017 assessment
Indicator by indicator
When companies’ Management Quality is viewed indicator by indicator (Figure 3), we see, as usual, a greater proportion of companies carrying out the basic carbon management practices associated with Levels 0 to 2, and fewer companies implementing the more advanced practices associated with Levels 3 and 4.
Seven criteria are satisfied by a majority of the 21 cement producers: (Q1) acknowledgement of climate change as a significant business issue; (Q2) explicit recognition of climate change as a business risk/opportunity; (Q3) having a policy commitment to act; (Q5) disclosure of operational (i.e. Scope 1
and 2) emissions; (Q8) disclosure of some Scope 3 emissions; (Q9) having operational emissions verified; and (Q11) having a process to manage climate-related risks.
In 2017, nine criteria (out of only 14 in total) were satisfied by a majority of companies. One reason for the worse performance this year is that the three companies newly assessed – China Resources Cement Holdings, Eagle Materials and Sumitomo Osaka Cement – all perform poorly on Management Quality.
Relatively few companies satisfy any of the Level 4 criteria and none at all are assessed as undertaking climate scenario planning.
0 1 2 3 4
Ambuja Cements
Asia Cement
China National Building Materials
CRH
Fletcher Building
LafargeHolcim
Siam Cement
Taiwan Cement
Level
Fall
Rise

6
Figure 3. Number of companies scoring Yes (blue) against individual criteria, and No (red)
0 1 2 3 4 5 6 7 8 9 10 11 12 13 14 15 16 17 18 19 20 21
L0|1. Acknowledge?
L1|2. Explicitly recognise as risk/opportunity?
L1|3. Policy commitment to act?
L2|4. Emissions targets?
L2|5. Disclosed Scope 1&2 emissions?
L3|6. Board responsibility?
L3|7. Quantitative emissions targets?
L3|8. Disclosed any Scope 3 emissions?
L3|9. Had operational emissions verified?
L3|10. Support domestic and intl. mitigation?
L3|11. Process to manage climate risks?
L4|12. Disclosed use of product emissions?
L4|13. Long-term emissions targets?
L4|14. Incorporated ESG into executive…
L4|15. Climate risks/opportunities in strategy?
L4|16. Undertakes climate scenario planning?
L4|17. Discloses an internal price of carbon?
Not applicable
7
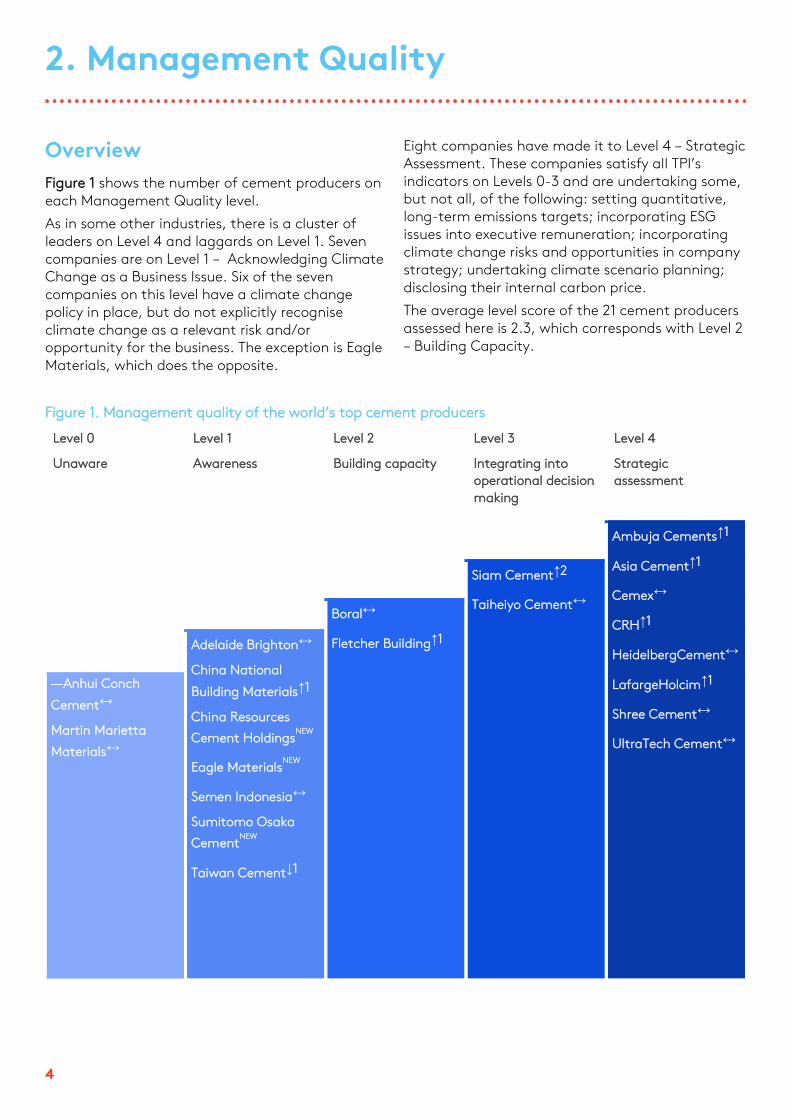
3. Carbon Performance
Table 1 summarises Carbon Performance data for
the 21 cement producers covered by this report.
The traffic light scheme indicates that a
company with an emissions intensity of cement
production that is below the benchmarks can be
said to be aligned with those benchmarks and
therefore with the international commitments
underpinning them. A company whose emissions
intensity is above the benchmarks is not aligned.
Table 1. Company emissions intensity pathways and cement sector benchmarks,
2014-2030
Company Emissions intensity of cement production (tCO2 / t cementitious product)
2014 2015 2016 2017 2020 2025 2030
Adelaide Brighton 0.831 0.737 0.781 0.762
Ambuja Cements 0.554 0.545 0.543 0.550 0.517 0.490 0.463
Anhui Conch Cement
Asia Cement
Boral
Cemex 0.613 0.630 0.642 0.636 0.603
China National Building Materials
China Resources Cement Holdings
CRH 0.624 0.573 0.578 0.572 0.571
Eagle Materials
Fletcher Building
HeidelbergCement 0.603 0.595 0.598 0.609 0.593 0.567 0.540
LafargeHolcim 0.579 0.582 0.585 0.581 0.516 0.485 0.462
Martin Marietta Materials
Semen Indonesia 0.696 0.695 0.708
Shree Cement 0.555
Siam Cement 0.629 0.643 0.641 0.651 0.619
Sumitomo Osaka Cement
Taiheiyo Cement 0.692 0.692 0.683 0.681 0.674 0.662
Taiwan Cement
UltraTech Cement 0.644 0.633 0.632 0.615 0.563
Below 2 Degrees 0.534 0.528 0.522 0.516 0.498 0.471 0.408
2 Degrees 0.534 0.535 0.535 0.535 0.537 0.539 0.497
Paris Pledges 0.534 0.537 0.539 0.542 0.549 0.560 0.540
Key Aligned with Below 2°C Aligned with 2°C Aligned with Paris Pledges Not aligned
TPI’s Carbon Performance assessment is based on
companies’ public disclosures of their historical
emissions, as well as quantitative targets they have
set to reduce their emissions in the future.
Historical Carbon Performance data are available
for 11 out of 21 companies (52%), the same
proportion as last year. Eight companies have also
set company-wide, quantitative targets for their
future emissions, which we can use to estimate
Carbon Performance in 2020. Three companies
have useable targets extending to at least 2030,
one more than last year (Ambuja Cements is the
new company with a 2030 target).

8
An important feature of this year’s assessment,
compared with last year’s, is that the benchmark
emissions intensities have fallen. This is due to
revisions to the cement sector modelling done by
the IEA, which underpins the benchmarks.[4] On
the 2 Degrees benchmark, for example, the
emissions intensity of cement production is now
0.537 tonnes of CO2 per tonne of cementitious
product in 2020, compared with 0.589 tCO2 / t
cementitious product in last year’s TPI assessment
(i.e. the 2 Degrees benchmark in 2020 has been
revised down by 9%).
This downward shift in the benchmarks means that
all companies with data are now out of alignment
in the historical period.
In 2020, seven out of the 10 companies with
performance data will not be aligned with any of
the Paris Agreement benchmarks. Only Ambuja
Cements and Lafarge Holcim will be in alignment.
They will be aligned with the 2 Degrees benchmark,
but not the Below 2 Degrees benchmark.
Of the three companies with 2030 targets, Ambuja
Cements and Lafarge Holcim stay aligned with the
2 Degrees benchmark, while HeidelbergCement
becomes aligned with the Paris Pledges benchmark.
9
Appendix 1. List of cement producers covered in this report
Company Country listing Market cap. (million USD) after
investibility weight
Adelaide Brighton Australia 2,309
Ambuja Cements India 2,334
Anhui Conch Cement China 7,475
Asia Cement Taiwan 2,585
Boral Australia 5,510
Cemex Mexico 9,021
China National Building Materials China 4,676
China Resources Cement Holdings China 1,943
CRH United Kingdom 31,202
Eagle Materials 5,243
Fletcher Building New Zealand 4,015
HeidelbergCement Germany 13,271
LafargeHolcim Switzerland 24,705
Martin Marietta Materials United States 14,344
Semen Gresik Indonesia 1,726
Shree Cement India 1,994
Siam Cement Thailand 11,248
Sumitomo Osaka Cement Japan 1,782
Taiheiyo Cement Japan 4,423
Taiwan Cement Taiwan 5,352
UltraTech Cement India 4,471
10
Bibliography
[1] S. Dietz et al., “Management Quality and Carbon Performance of Cement Pproducers: a Commentary,” London, 2017.
[2] S. Dietz, C. Garcia-Manas, W. Irwin, B. Rauis, and R. Sullivan, “Methodology and Indicators Report: Version 2.0,” London, 2018.
[3] S. Dietz et al., “The State of Transition in the Coal Mining, Electricity and Oil and Gas Sectors: TPI’s Latest Assessment,” London, 2018.
[4] International Energy Agency, Energy Technology Perspectives 2017. International Energy Agency, 2017.

The Transition Pathway Initiative (TPI)
c/o UNPRI PRI Association
5th Floor, 25 Camperdown St
London, E1 8DZ, UK
T +44 (0)20 3714 3141
transitionpathwayinitiative.org
@tp_initiative