Management of the London Basin Chalk Aquifer · the London Clay Formation as a result of these...
38
Management of the London Basin Chalk Aquifer Status Report – 2018 August 2018
Transcript of Management of the London Basin Chalk Aquifer · the London Clay Formation as a result of these...
Management of the London Basin Chalk Aquifer
Status Report – 2018
August 2018

Foreword
We are the Environment Agency. It's our job to look after your environment and make it a better place - for you, and for future generations.
Your environment is the air you breathe, the water you drink and the ground you walk on. Working with business, Government and society as a whole, we are making your environment cleaner and healthier.
The Environment Agency. Out there, making your environment a better place.
Environment Agency Management of the London Basin Chalk Aquifer Status Report 2018 i
Contents
Introduction ........................................................................................................................... 1
1 Overview of the London Basin Aquifer ........................................................................... 1
2 Why we need to manage groundwater levels ................................................................. 5
3 How we manage groundwater levels .............................................................................. 6
4 Recent abstraction trends .............................................................................................. 9
5 Groundwater levels for January 2017 ........................................................................... 12
Recent Changes in Groundwater Levels ......................................................................... 13
Long Term Changes in Groundwater Levels.................................................................... 13
6 Current licensing strategy ............................................................................................ 20
7 Open loop ground source heating and cooling (GSHC) schemes status ...................... 26
8 Conclusions ................................................................................................................. 30
9 References .................................................................................................................. 31
Environment Agency Management of the London Basin Chalk Aquifer Status Report 2018 ii
Figures
Figure 1 Area of the London Basin ....................................................................................... 1
Figure 2 Bedrock Geology and faults of the London Basin ................................................... 4
Figure 3 Observation Borehole Network in the London Basin .............................................. 7
Figure 4 Active and Historic Key Wells in the London Basin................................................. 8
Figure 5 Total Annual Water Company Abstraction in 2017 ............................................... 10
Figure 6 Water Company Licensed Abstraction from the London Basin Chalk Aquifer ....... 10
Figure 7 Difference between Water Company Total Abstractions 2016-2017 ..................... 11
Figure 8 Recharge Scheme Operation ................................................................................ 11
Figure 9 Monitored Groundwater Levels for January 2000 ................................................. 15
Figure 10 Monitored Groundwater levels in January 2017 ................................................. 16
Figure 11 Groundwater Level Contours for January 2018 .................................................. 17
Figure 12 Change in Groundwater Levels between January 2018 and January 2017 ........ 18
Figure 13 Change in Groundwater Levels between January 2018 and January 2000 ........ 19
Figure 14 Watertable Geology Maps for 1965, 2000, 2017 and 2018 .................................. 23
Figure 15 London Licensing Policy Map 2018 ..................................................................... 24
Figure 16 Hydrographs from Key Wells at different Areas in London. ................................ 25
Figure 17 London Open-loop Ground Source Heating and Cooling Systems Status 2017 . 28
Figure 18 Temperature Monitoring within the Chalk of Central London from 2010 to 2017 . 29
Environment Agency Management of the London Basin Chalk Aquifer Status Report 2018 1
Introduction
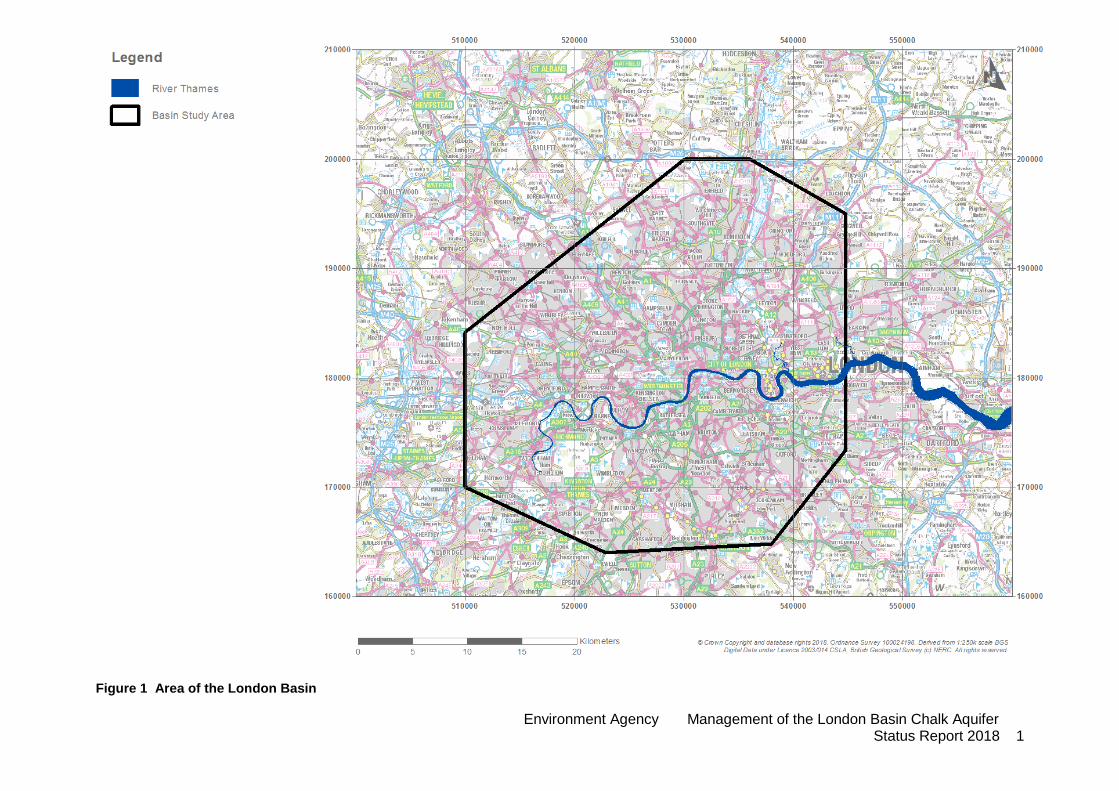
The Environment Agency produces an annual report on the state of groundwater levels in the
Chalk aquifer beneath London. This is the twenty-seventh such report (previously called
‘Groundwater Levels in the Chalk-Basal Sands Aquifer of the London Basin’). The study area
for this report is shown in Figure 1.
The reports were started in the 1990s to record the rise in groundwater levels, resulting from
a significant reduction in groundwater abstraction from the Chalk aquifer since the mid-1960s.
In the early 2000s the rising groundwater level trend slowed and the levels stabilised in many
parts of London. Since then it is observed that Chalk groundwater levels are again locally
falling, owing to increased abstraction and dewatering pressure. Parts of Chalk at the centre
of the London Basin also remain unsaturated. The recent reports aim to report the changes to
the abstraction regime and its influence on groundwater levels in the past year using
monitoring data, and review and update the London groundwater abstraction licensing
strategy.
Groundwater levels in the London Basin Chalk Aquifer need careful management to safeguard
the aquifer as a sustainable, secure and high quality water resource, and to protect
infrastructure from flooding and potential structural damage. Details of our management
approach for the London Basin aquifer are included in Chapters 0 and 3. Chapters 4 and 5
summarise the recent changes in abstraction volume and groundwater level, and discuss
areas where significant changes have been observed. Chapter 6 then sets out the licensing
strategy. Chapter 7 discusses our approach to manage impacts of Ground Source Heating
and Cooling (GSHC) schemes in the London Basin.
Environment Agency Management of the London Basin Chalk Aquifer Status Report 2018 1
Figure 1 Area of the London Basin
Environment Agency Management of the London Basin Chalk Aquifer Status Report 2018 1
1 Overview of the London Basin
Aquifer
The structure and hydrogeology of the London Basin Aquifer are subjects to a large volume
of studies and are well reported. This chapter provides a brief synthesis of the features integral
to our groundwater management approach. A list of references for further reading is included
at the end of this report.
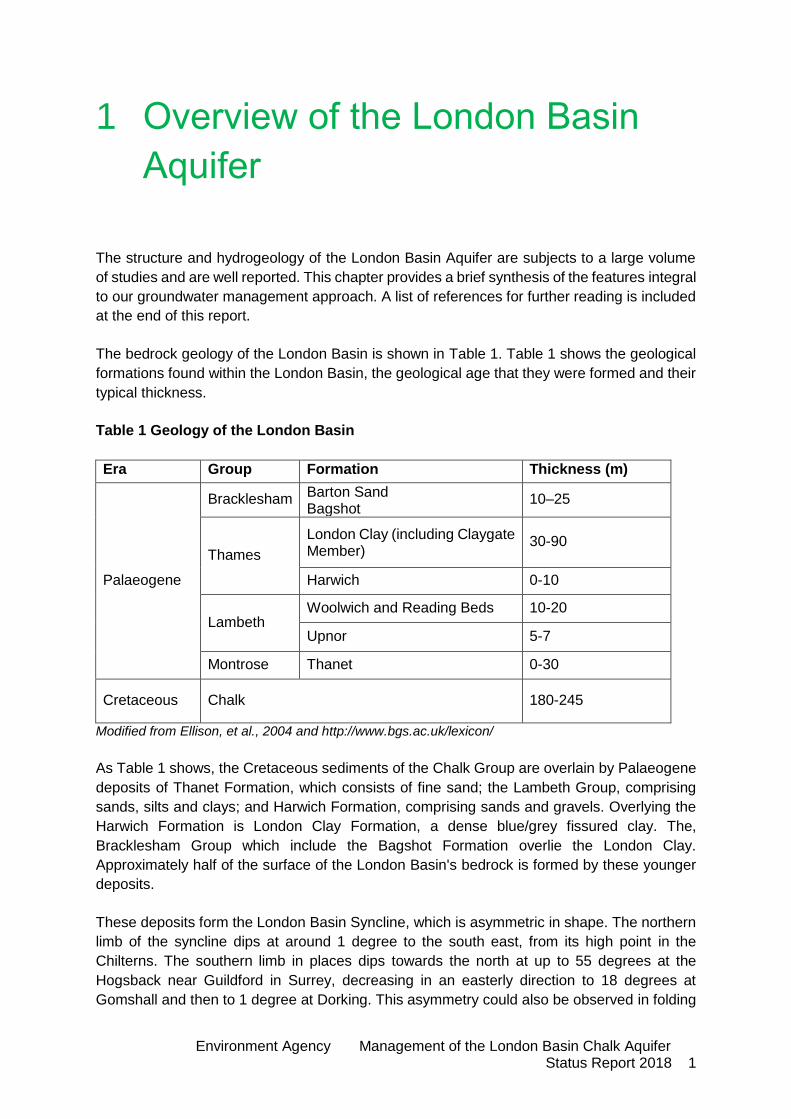
The bedrock geology of the London Basin is shown in Table 1. Table 1 shows the geological
formations found within the London Basin, the geological age that they were formed and their
typical thickness.
Table 1 Geology of the London Basin
Era Group Formation Thickness (m)
Palaeogene
Bracklesham Barton Sand Bagshot
10–25
Thames
London Clay (including Claygate Member)
30-90
Harwich 0-10
Lambeth Woolwich and Reading Beds 10-20
Upnor 5-7
Montrose Thanet 0-30
Cretaceous Chalk 180-245
Modified from Ellison, et al., 2004 and http://www.bgs.ac.uk/lexicon/
As Table 1 shows, the Cretaceous sediments of the Chalk Group are overlain by Palaeogene
deposits of Thanet Formation, which consists of fine sand; the Lambeth Group, comprising
sands, silts and clays; and Harwich Formation, comprising sands and gravels. Overlying the
Harwich Formation is London Clay Formation, a dense blue/grey fissured clay. The,
Bracklesham Group which include the Bagshot Formation overlie the London Clay.
Approximately half of the surface of the London Basin's bedrock is formed by these younger
deposits.
These deposits form the London Basin Syncline, which is asymmetric in shape. The northern
limb of the syncline dips at around 1 degree to the south east, from its high point in the
Chilterns. The southern limb in places dips towards the north at up to 55 degrees at the
Hogsback near Guildford in Surrey, decreasing in an easterly direction to 18 degrees at
Gomshall and then to 1 degree at Dorking. This asymmetry could also be observed in folding
Environment Agency Management of the London Basin Chalk Aquifer Status Report 2018 2
structure: in the northern part of the basin structural contours indicate gentle, low amplitude
and long wavelength folding, whilst in the south folding is more numerous, higher in amplitude
and shorter in wavelength. The depth to chalk varies significantly across the London Basin:
The Chalk is buried deep under high ground such as Hampstead, Highgate, Wimbledon and
Blackheath, but is brought to shallow depths within the basin in the Lee Valley, or to outcrop
at Deptford, Lewisham, and near the River Thames from Greenwich to Woolwich.
The Chalk, combined with the Thanet Formation and the Upnor Formation, make up the Chalk-
Basal Sands aquifer of the London Basin. As the main groundwater storage unit, the Chalk is
a low storage, high transmissivity aquifer comprising dual porosity, with flow and storage
occurring both in the fractures and in the matrix. Most flow occurs in the fractures with storage
in the matrix, released to the fractures as the groundwater level falls.
Variation in burial depth described earlier is an important control of the hydraulic properties of
the Chalk in the London Basin. In the southwest part of the London Basin where depth to
Chalk is often in excess of 100 m from surface, the Chalk has much lower transmissivity, whilst
under the valleys of the rivers Thames and Lee, where the Chalk is at shallow depth, or at
surface, high transmissivity corridors are present.
The Chalk is concealed in the basin by the overlying Tertiary formations, which means
recharge largely occurs in areas of outcrop: the Chilterns to the north and northwest, and the
North Downs to the south (Figure 2). The natural areas of groundwater discharge near the
centre of the Basin would be areas of chalk outcrop, such as in the River Thames area from
Greenwich to Woolwich, and where chalk groundwater could discharge through the Lambeth
Group sediments to the surface, such as in Hackney and the Lee Valley. However, as a result
of historic and current abstraction, the reduction in groundwater levels means that there is no
longer a significant natural groundwater outlet in the centre of the London Basin. Instead,
saline river water from the tidal Thames interacts with Chalk groundwater at the outcrop from
Greenwich to Woolwich, leading to risk of saline intrusion.
The London Clay Formation confines the Chalk and Lower Palaeogene Formations when
these are fully saturated and the groundwater is flowing under pressure. As groundwater
pressure increases on the London Clay Formation, it is slowly saturated, and unevenly
deforms. The London Clay Formation is also extensively fissured locally, and rapid ingress of
groundwater at higher elevations is possible on a small scale (CIRIA, 1989). Re-saturation of
the London Clay Formation as a result of these mechanisms could affect the stability of certain
foundations and deep basements, and cause ingress of water into buried service tunnels and
underground lines (CIRIA, 1989). On the other hand, further abstraction from the Chalk may
lead to repeated aerating and rewetting of the Sandy deposits in the Lower Palaeogene
Formations, either by seepage from consolidation of the London Clay (Rainey and
Rosenbaum, 1989), or fluctuating watertable between the top of the Chalk and Basal Sands
(Kinniburgh et al., 1994). This creates favourable conditions for pyrite oxidation, which
releases sulphate-rich, acidic groundwater (Bierens de Haan et al., 1994; Kinniburgh et al.,
1994), and has led to incidents of corrosion to tunnel linings (Rainey and Rosenbaum, 1989).
There is also concern over the impact of such acidic drainage to the Chalk groundwater quality
and the integrity of the Chalk matrix, although this is an area where further research is
required.
Environment Agency Management of the London Basin Chalk Aquifer Status Report 2018 3
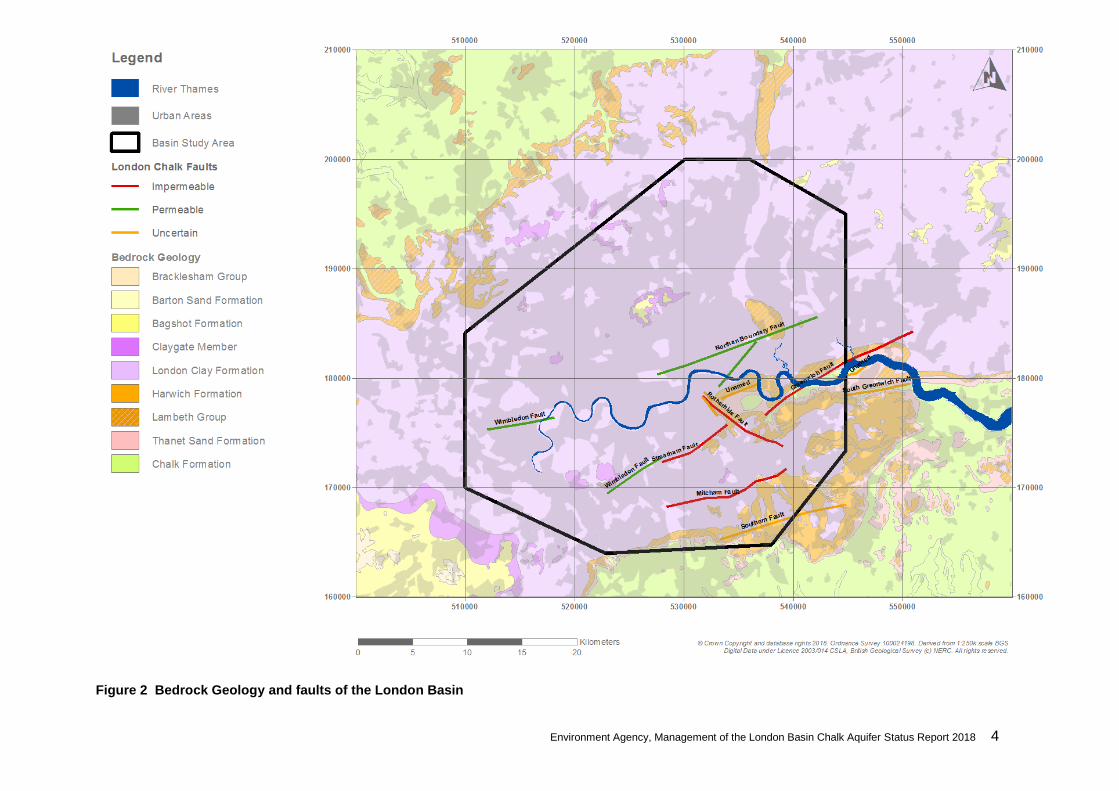
In 2008 the British Geological Survey (BGS) completed a geological study of the London Basin
for the Environment Agency (Royse, 2008). In the central basin area the study proposed a
new interpretation of the fault pattern (Figure 2). Faulting often alters the hydraulic properties
of Chalk: both to increase and decrease permeability. Where boreholes with groundwater level
data were present either side of the major faults identified in the BGS study, these were
analysed to confirm whether these faults act as groundwater flow barriers (Figure 2).
This analysis suggests that:
Greenwich Fault, Rotherhithe Fault and Mitcham Fault at the centre of the Basin are
likely flow barriers.
Whilst there is no evidence for Wimbledon and Streatham to impede the groundwater
flow, flow barrier exists along the Streatham Fault towards the east.
For the Northern Boundary Fault, hydrographs on either side of the fault show similar
trends and water levels, suggesting that the fault may not act as a barrier. However,
the lack of a steep horizontal hydraulic gradient across the western part of this fault
may be a result of the local direction of groundwater flow, and flow across this fault
may be restricted here. Nevertheless, the small faults branching to the south of the
main Northern Boundary Fault appear to act as barriers.
The Sutton Fault has been inferred on the basis of a large difference in groundwater
levels over a small area at the southern boundary of the confined Basin, and does
not feature in the interpretation of the BGS Chalk model. The steep hydraulic
gradient across the Sutton fault appears to suggest that it acts as a barrier.
Environment Agency, Management of the London Basin Chalk Aquifer Status Report 2018 4
Figure 2 Bedrock Geology and faults of the London Basin
Environment Agency, Management of the London Basin Chalk Aquifer Status Report 2018 5
2 Why we need to manage
groundwater levels
During the 19th century and first part of the 20th century, the Chalk aquifer had been
increasingly exploited, as a result of increased industrialisation and the associated
development of groundwater sources. At the peak of abstraction in the 1960s, groundwater
levels beneath central London had dropped to 88 metres below sea level, creating a large
depression in the water table.
Since the mid-1960s industries in central London relocated or were closed down and business
turned more to commerce than heavy industry. The subsequent reduction in abstraction
resulted in a gradual rebound of the water table as groundwater levels recovered. The
continuous rise of groundwater levels posed threat to structures in the London Basin, such as
London Underground and building foundations. In response, the General Aquifer Research,
Development and Investigation Team (GARDIT) implemented a strategy to control water
levels in 1992. Numerous large public water supply abstractions were licensed to Thames
Water under the strategy, in order to slow the rise in groundwater levels and eventually
stabilise them. These additional abstractions came into operation in the late 1990s with further
abstractions developed through until 2004.
The GARDIT strategy did result in significant additional abstraction volumes to assist with the
management of groundwater levels. We have observed that since 2000 groundwater levels
have become more stable; where the deep cone of depression from historic abstraction has
recovered, groundwater gradient has reduced, and the rate of groundwater level rise in key
well hydrographs slowed. However, monitoring data also suggest that in parts of London
groundwater levels are falling again. In the centre of the basin, where recharge takes very
long to reach and is often intercepted in its path, a few areas of deep groundwater depression
also persist, with potential issues described in Chapter 1. These observations led us to restrict
further abstraction using new abstraction licensing strategies for London, which became an
integral part of this report (Chapter 6).
As water levels in most areas have stabilised, the London Basin Chalk aquifer has become
an entity that is artificially managed by changes in abstraction. The great advantage of
controlling this confined aquifer is that there are no negative environmental implications. No
ecosystems depend on a specific groundwater level under London, and therefore, provided
that levels are kept below that which is required to protect structures, the aquifer presents a
very secure, stable and sustainable water resource. Our role is to continue to monitor levels
and advise the major abstractors on the current situation so that abstraction can slowly be
adjusted to achieve the required balance.
Environment Agency, Management of the London Basin Chalk Aquifer Status Report 2018 6
3 How we manage groundwater
levels
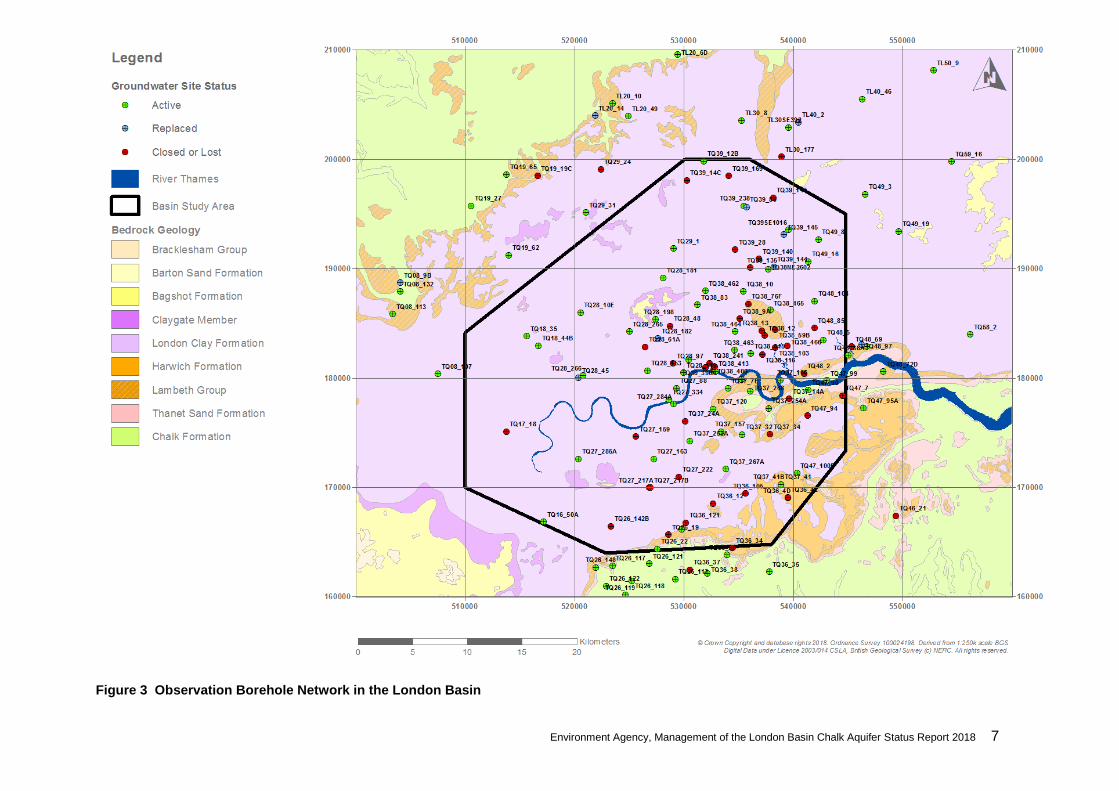
The Environment Agency has a long-term commitment to monitor and report on the state of
groundwater levels beneath London. This is done through an observation borehole network,
which is used to monitor absolute groundwater levels and rates of change of levels in the
Chalk-Basal Sands aquifer of the London Basin. Observation boreholes are chosen on the
basis of achieving a good spatial distribution across London, and boreholes with long data
history of consistent quality are chosen as "key wells" to assess long term groundwater level
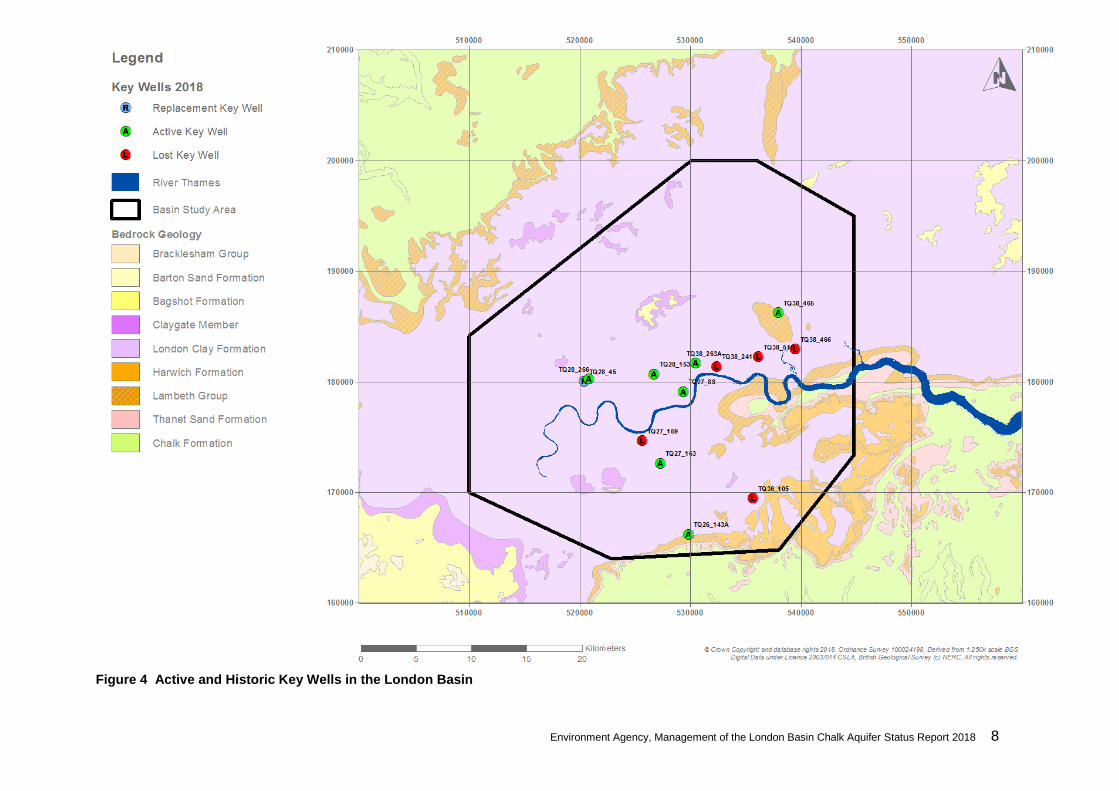
trend. Over time some observations are no longer monitored and new observations need to
be chosen for a given area. There are currently 86 live observation boreholes available for the
purpose of this report, of which 82 produced data this year. This is down from nearly 200
observation boreholes in the early 2000's. Figure 3 shows the distribution and change in the
observation borehole network, including those that we used to monitor in the past but have
since lost or have had recent access issues. Figure 4 shows similar changes amongst the key
wells.
We also obtain data from other organisations, particularly water companies, and the
availability of these data could be compromised in the future by modifications to these
monitoring networks and by previously monitored boreholes becoming unavailable. Several
longstanding observation boreholes have been lost in central London in recent years and any
knowledge of, or data from, alternative boreholes would be very helpful to the Environment
Agency. Similarly, where redevelopment and ground investigations offer the opportunity of
obtaining one-off or short-term groundwater datasets, these data will be utilised wherever
possible.
The Water Information Management System Kisters (WISKI) database is the Environment
Agency’s hydrometric archiving, analysis and reporting system. Groundwater level data for all
boreholes within the London Basin is stored within this system. We use this database to extract
groundwater levels for our review.
Abstraction data, both licensed and actual volumes, is stored in the Environment Agency’s
National Abstraction Licensing Database (NALD), and includes returns data from all large
abstractions such as from water companies. Thames Water and Sutton and East Surrey (SES)
Water also operate Artificial Recharge schemes in this aquifer: the North London Artificial
Recharge Scheme (NLARS) run by Thames Water; and the Wandle Artificial Recharge
Scheme (WARS) operated by SES Water. Abstraction and recharge data for these schemes
are also stored and compared to data from previous years.
Environment Agency, Management of the London Basin Chalk Aquifer Status Report 2018 7
Figure 3 Observation Borehole Network in the London Basin
Environment Agency, Management of the London Basin Chalk Aquifer Status Report 2018 8
Figure 4 Active and Historic Key Wells in the London Basin
Environment Agency, Management of the London Basin Chalk Aquifer Status Report 2018 9
4 Recent abstraction trends
New abstraction licence applications or changes to existing licences are handled by the
National Permitting Service (NPS) of the Environment Agency. The NPS is also charged with
collating licence returns data. As water company returns make up the bulk of consumptive
abstraction this report only describes the recent abstraction trends for water company
abstractions, which form around 80% of abstraction in the study area.
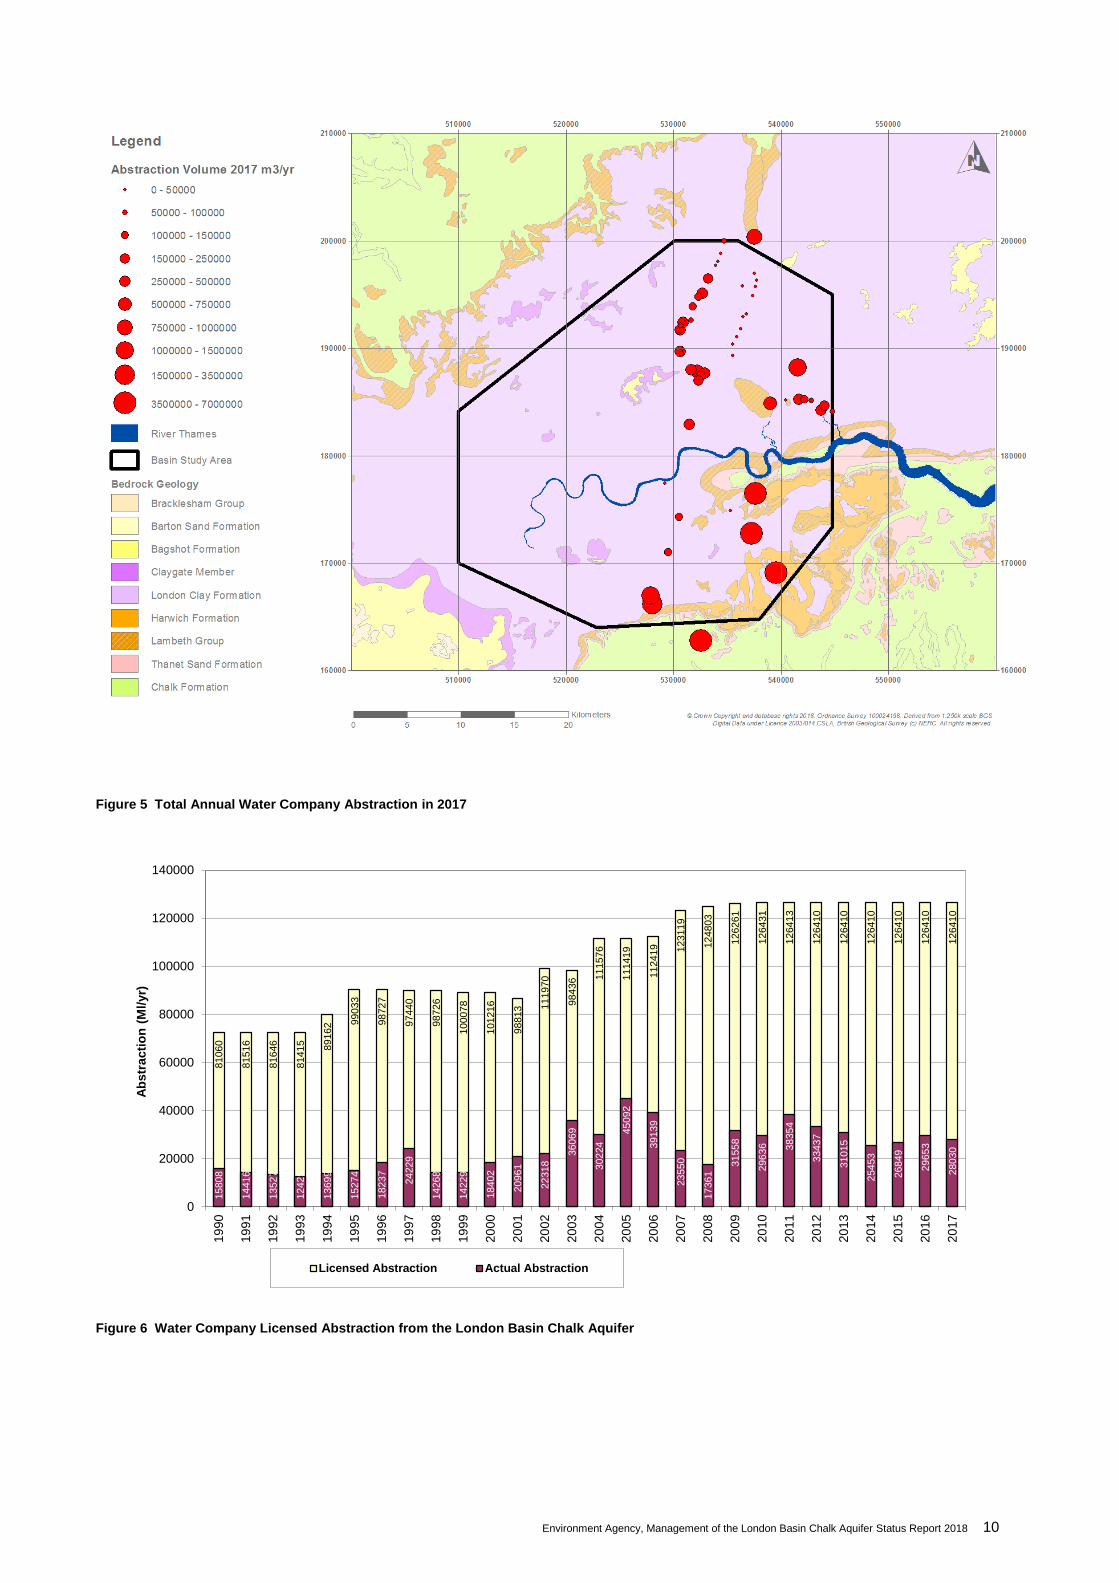
Figure 5 shows the distribution of total actual water company annual abstraction over the
course of 2017 in the London Basin. In 2017 the largest abstractions in south London
continued to be at Deptford, Bell Green, Catford and Shortlands, as well as Brantwood Road,
Hackbridge and Goatbridge in Surrey. In north London, significant abstraction continues to
take place at Waltham Abbey in the North London Artificial Recharge Scheme (NLARS) well
field, as well as at Wanstead Avenue in east London. The Windmill Lane and East Ham
abstractions in the East London Resource Development (ELReD) well field are also notable
in size.
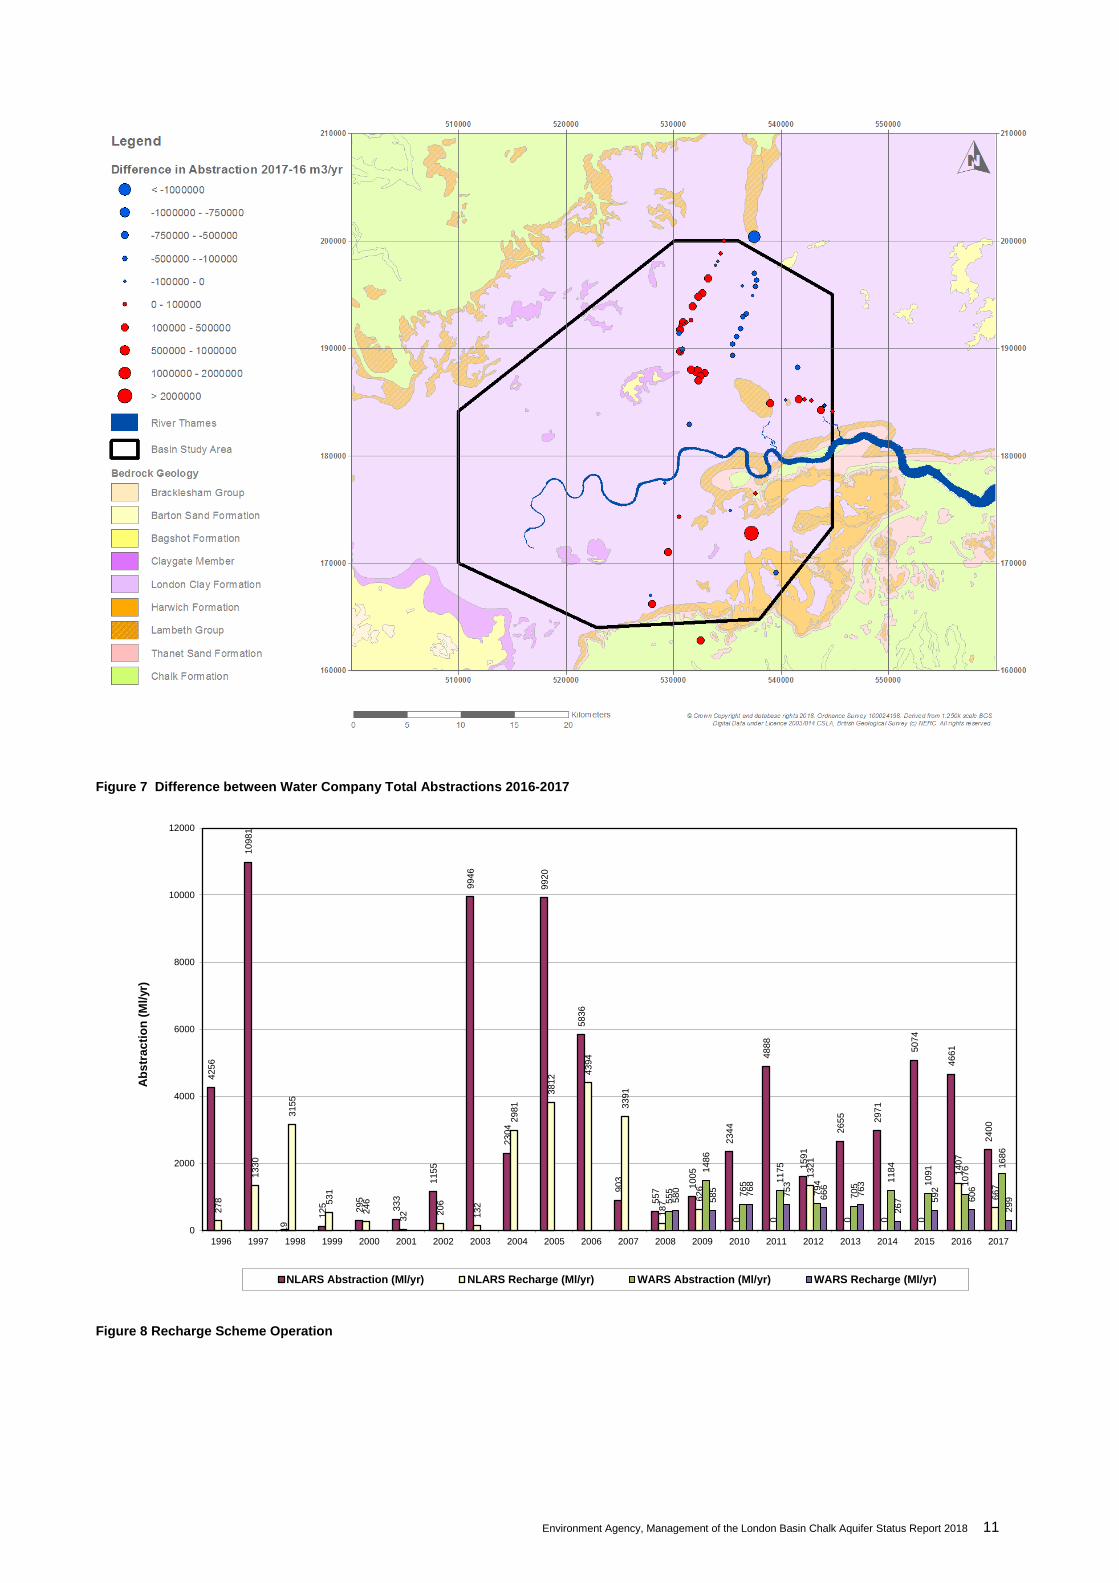
Figure 6 shows the variation in annual licensed and actual abstraction since 1990. Abstraction
quantities licensed to Water companies have not changed since 2009. Actual quantity
abstracted from water company licences in 2017 decreased 5.5% from the previous year.
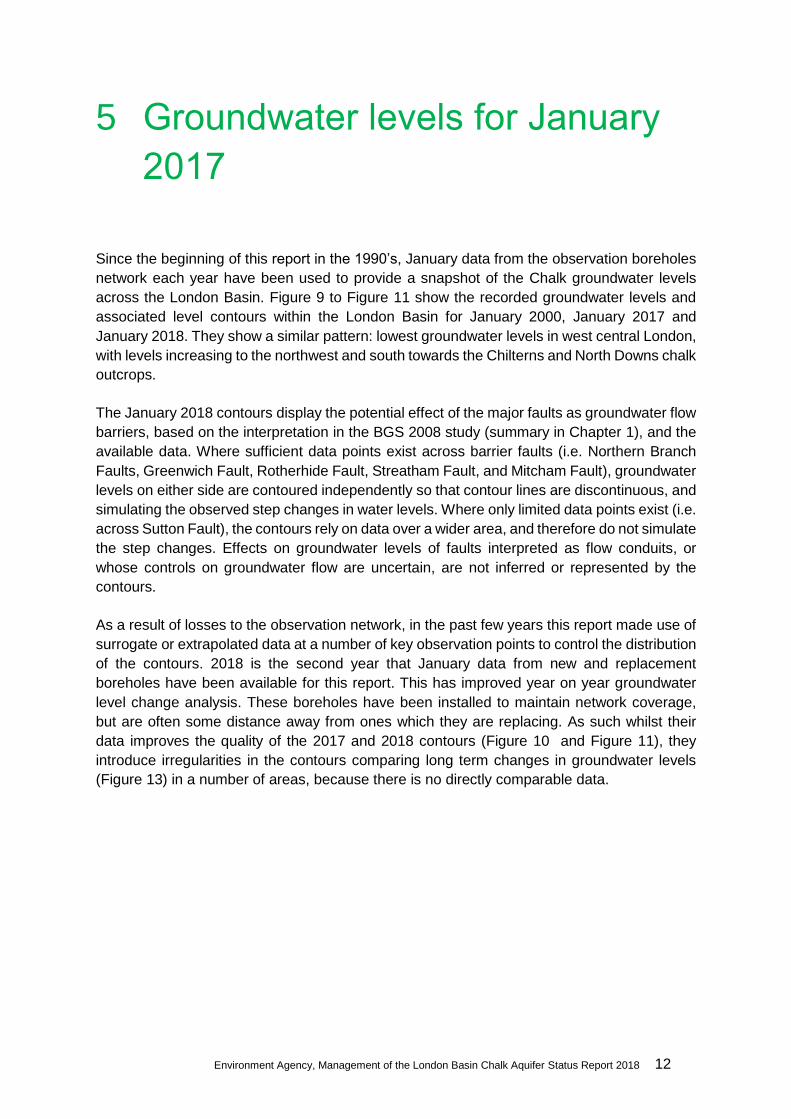
Figure 7 shows the spatial change in actual abstraction between 2016 and 2017. Increases in
abstraction occurred in East and South London, with largest increases in South London at
Catford, Brixton, Bell Green and Brantwood Road. The reductions were mostly concentrated
along the Lower Lee corridor (NLARS) with a significant reduction at Eade Road. However, a
very large reduction occurred at Shortlands.
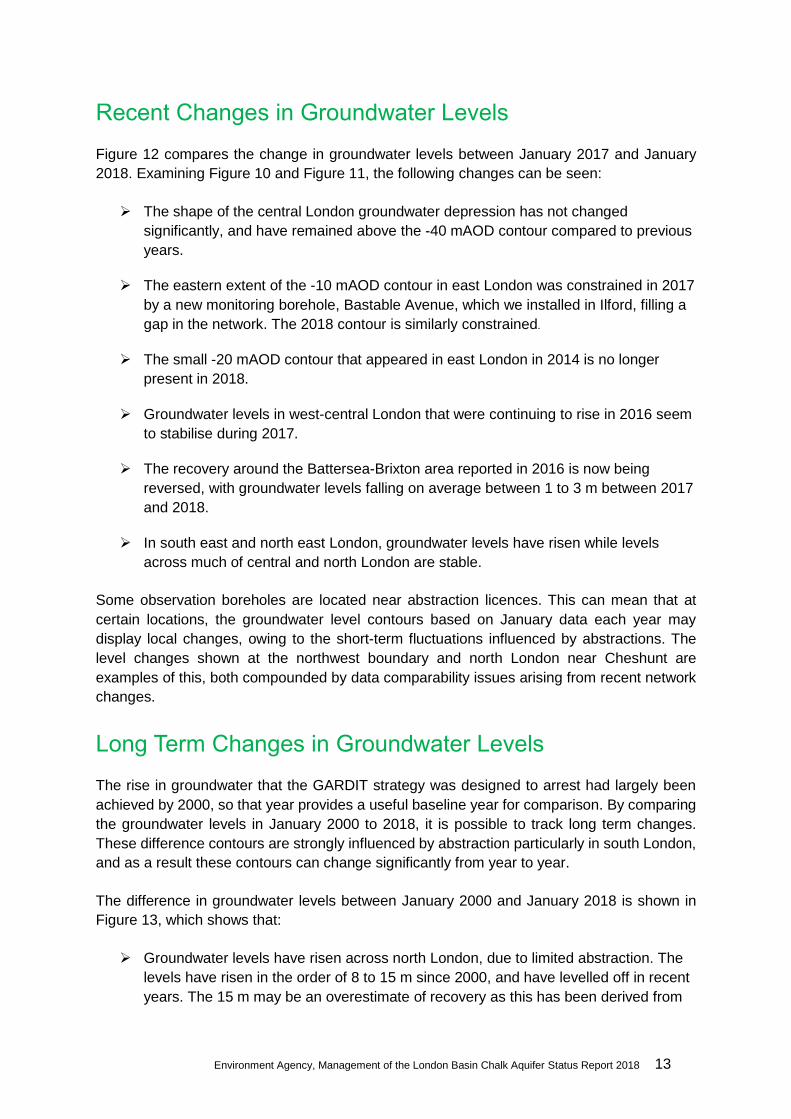
Abstraction from the North London Artificial Recharge Scheme (NLARS) in 2017 was 49%
lower than the abstraction volume in 2016. Totals were 2400 ML in 2017 compared to 4661
ML in 2016, as shown in Figure 8. In NLARS, a total of 667 ML was re-injected in 2017,
representing 28% of NLARS abstraction.
The Wandle Artificial Recharge Scheme (WARS) shows increased abstraction (1686 ML)
since 2016 because historically, Goatbridge abstraction was incorrectly used instead of
Hackbridge (Figure 8). Recharge during the winter was 51% lower than recharge in 2016, at
299 Ml one of the lowest annual totals since recharge began in 2008.
Environment Agency, Management of the London Basin Chalk Aquifer Status Report 2018 10
Figure 5 Total Annual Water Company Abstraction in 2017
Figure 6 Water Company Licensed Abstraction from the London Basin Chalk Aquifer
81060
81516
81646
81415 89162 9
9033
98727
97440
98726
100078
101216
98813 1
11970
98436 1
11576
111419
112419 123119
124803
126261
126431
126413
126410
126410
126410
126410
126410
126410
15808
14416
13527
12425
13699
15274
18237
24229
14268
14229
18402
20961
22318
36069
30224
45092
39139
23550
17361
31558
29636 38354
33437
31015
25453
26849
29653
28030
0
20000
40000
60000
80000
100000
120000
140000
19
90
19
91
19
92
19
93
19
94
19
95
19
96
19
97
19
98
19
99
20
00
20
01
20
02
20
03
20
04
20
05
20
06
20
07
20
08
20
09
20
10
20
11
20
12
20
13
20
14
20
15
20
16
20
17
Ab
str
acti
on
(M
l/yr)
Figure 7 Water Company Licensed Abstraction from the London Basin Chalk Aquifer
Licensed Abstraction Actual Abstraction
Environment Agency, Management of the London Basin Chalk Aquifer Status Report 2018 11
Figure 7 Difference between Water Company Total Abstractions 2016-2017
Figure 8 Recharge Scheme Operation
4256
10981
19
125
295
333
1155
9946
2304
9920
5836
903
557
1005
2344
4888
1591
2655
2971
5074
4661
2400
278
1330
3155
531
246
32 2
06
132
2981
3812 4
394
3391
187
626
0 0
1321
0 0 0
1407
667
555
1486
765 1
175
794
705
1184
1091
1076 1
686
580
585 768
753
666
763
267 5
92
606
299
0
2000
4000
6000
8000
10000
12000
1996 1997 1998 1999 2000 2001 2002 2003 2004 2005 2006 2007 2008 2009 2010 2011 2012 2013 2014 2015 2016 2017
Ab
str
ac
tio
n (
Ml/
yr)
Figure 9 Recharge Scheme Operation
NLARS Abstraction (Ml/yr) NLARS Recharge (Ml/yr) WARS Abstraction (Ml/yr) WARS Recharge (Ml/yr)
Environment Agency, Management of the London Basin Chalk Aquifer Status Report 2018 12
5 Groundwater levels for January
2017
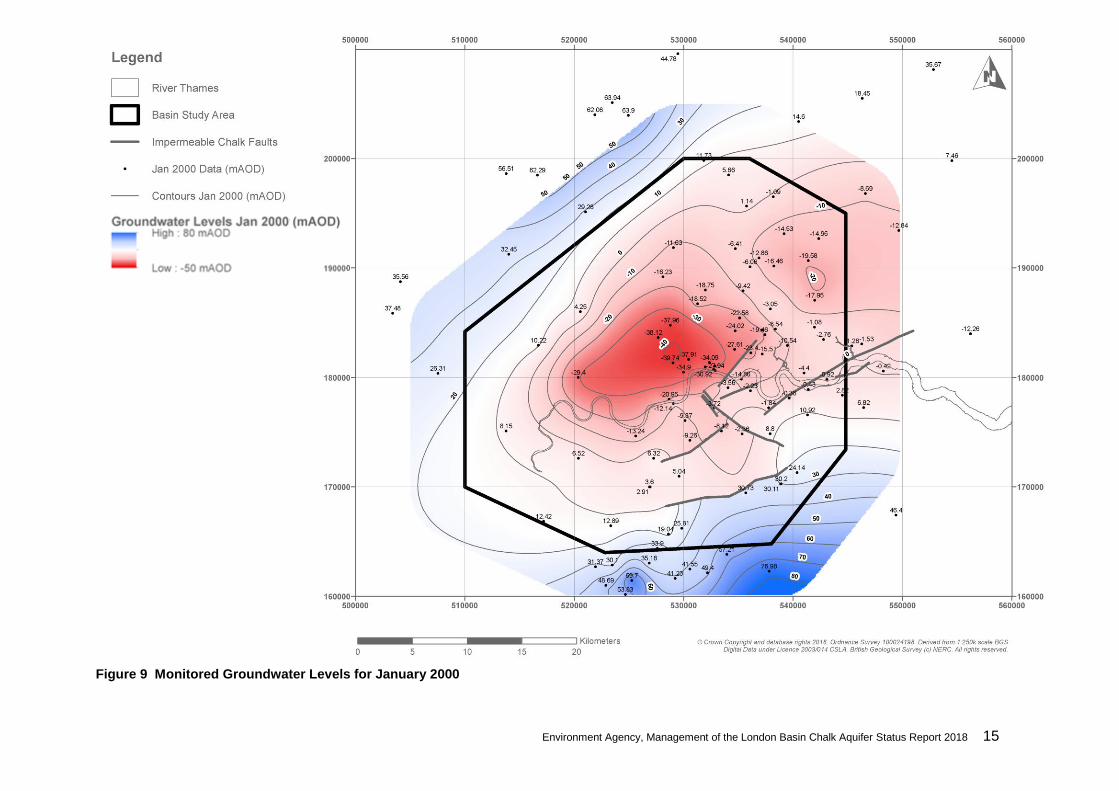
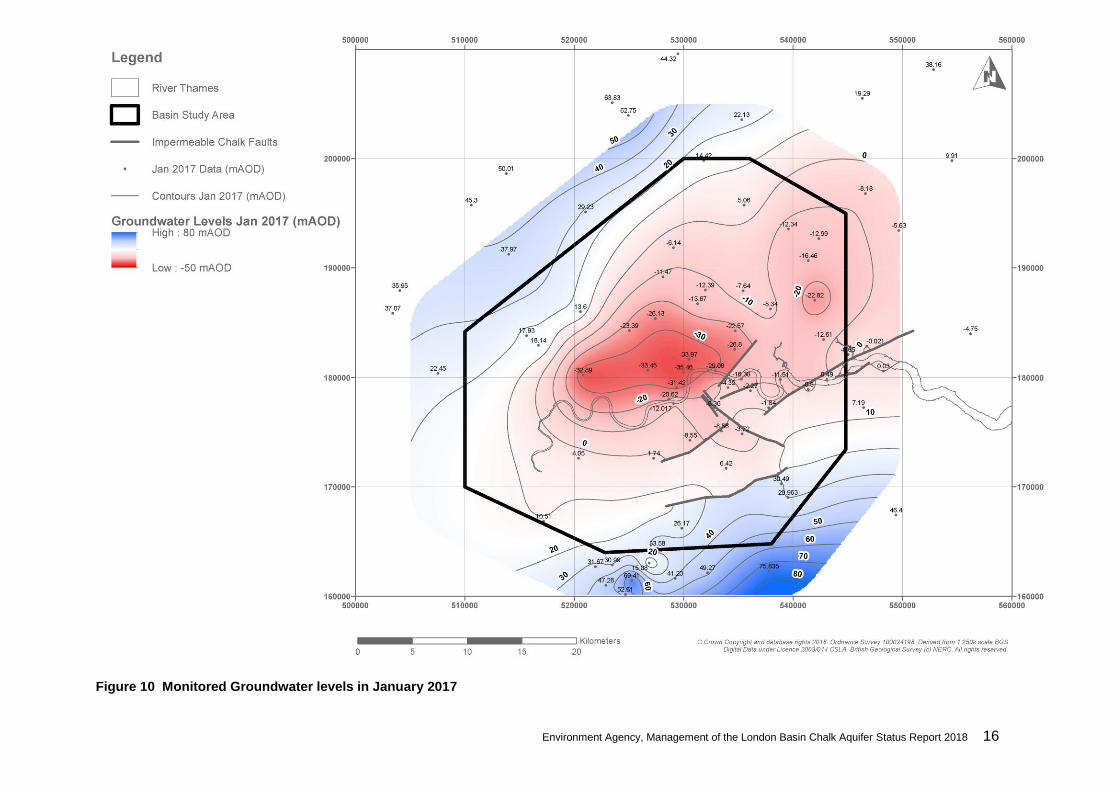
Since the beginning of this report in the 1990’s, January data from the observation boreholes
network each year have been used to provide a snapshot of the Chalk groundwater levels
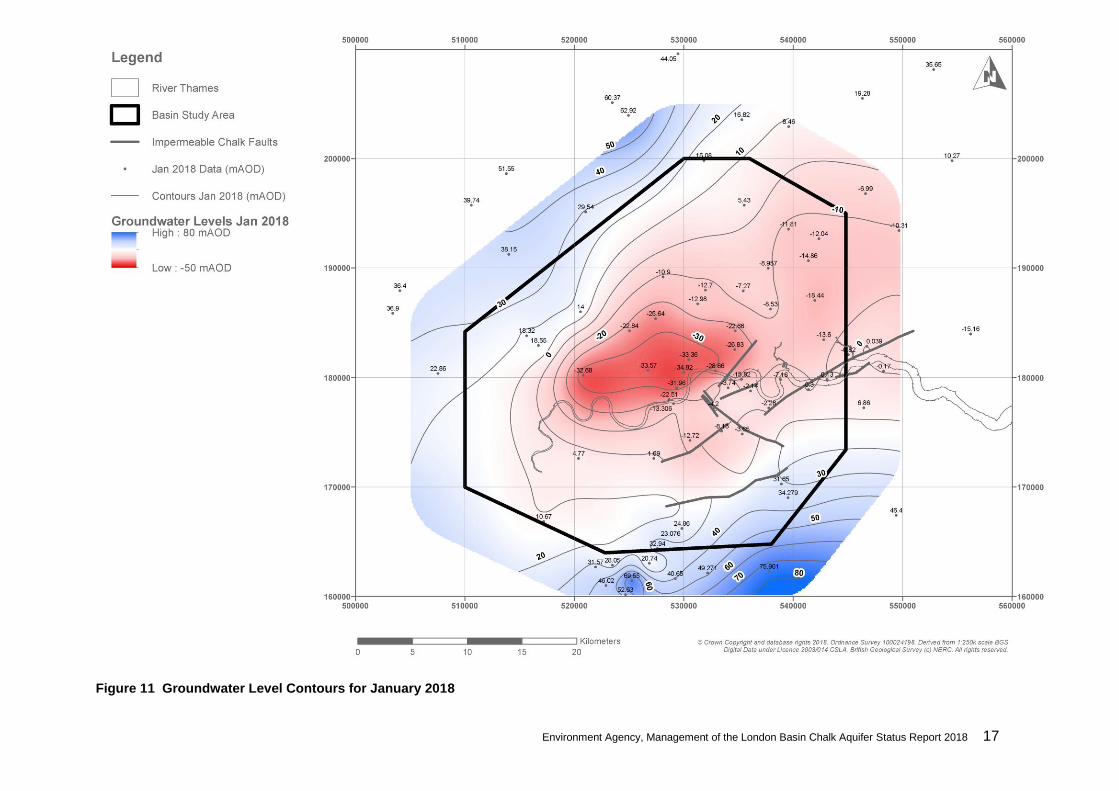
across the London Basin. Figure 9 to Figure 11 show the recorded groundwater levels and
associated level contours within the London Basin for January 2000, January 2017 and
January 2018. They show a similar pattern: lowest groundwater levels in west central London,
with levels increasing to the northwest and south towards the Chilterns and North Downs chalk
outcrops.
The January 2018 contours display the potential effect of the major faults as groundwater flow
barriers, based on the interpretation in the BGS 2008 study (summary in Chapter 1), and the
available data. Where sufficient data points exist across barrier faults (i.e. Northern Branch
Faults, Greenwich Fault, Rotherhide Fault, Streatham Fault, and Mitcham Fault), groundwater
levels on either side are contoured independently so that contour lines are discontinuous, and
simulating the observed step changes in water levels. Where only limited data points exist (i.e.
across Sutton Fault), the contours rely on data over a wider area, and therefore do not simulate
the step changes. Effects on groundwater levels of faults interpreted as flow conduits, or
whose controls on groundwater flow are uncertain, are not inferred or represented by the
contours.
As a result of losses to the observation network, in the past few years this report made use of
surrogate or extrapolated data at a number of key observation points to control the distribution
of the contours. 2018 is the second year that January data from new and replacement
boreholes have been available for this report. This has improved year on year groundwater
level change analysis. These boreholes have been installed to maintain network coverage,
but are often some distance away from ones which they are replacing. As such whilst their
data improves the quality of the 2017 and 2018 contours (Figure 10 and Figure 11), they
introduce irregularities in the contours comparing long term changes in groundwater levels
(Figure 13) in a number of areas, because there is no directly comparable data.
Environment Agency, Management of the London Basin Chalk Aquifer Status Report 2018 13
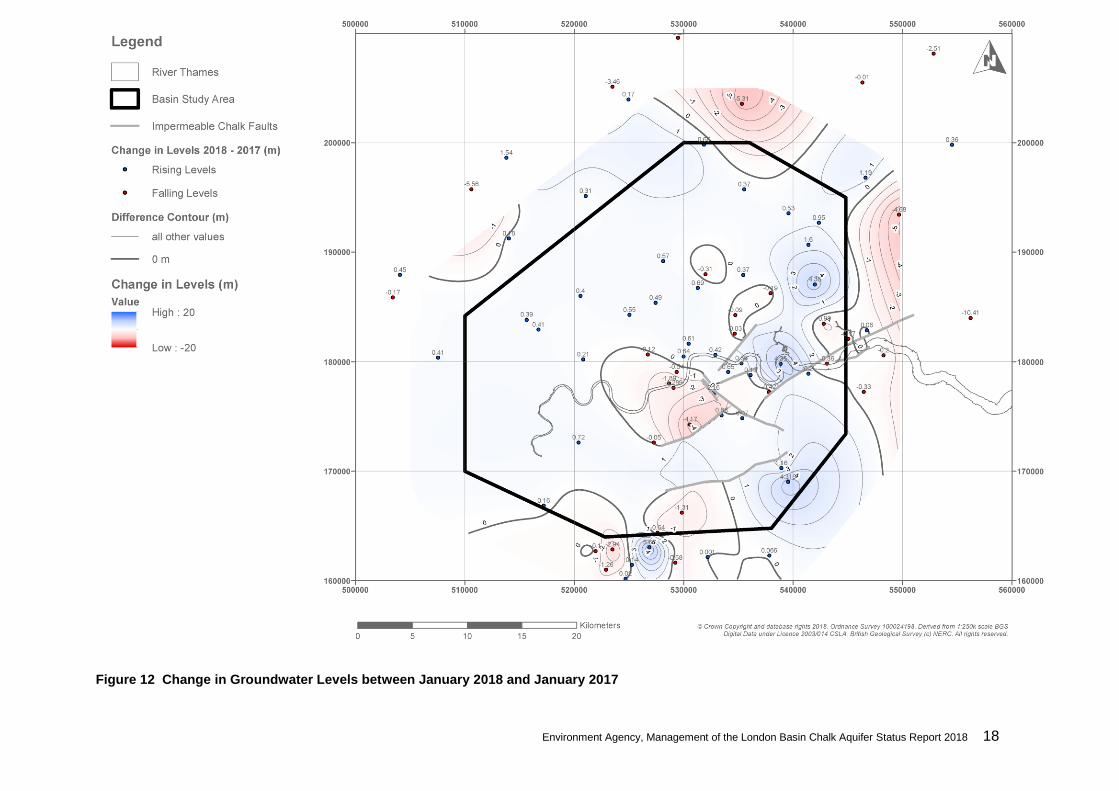
Recent Changes in Groundwater Levels
Figure 12 compares the change in groundwater levels between January 2017 and January
2018. Examining Figure 10 and Figure 11, the following changes can be seen:
The shape of the central London groundwater depression has not changed
significantly, and have remained above the -40 mAOD contour compared to previous
years.
The eastern extent of the -10 mAOD contour in east London was constrained in 2017
by a new monitoring borehole, Bastable Avenue, which we installed in Ilford, filling a
gap in the network. The 2018 contour is similarly constrained.
The small -20 mAOD contour that appeared in east London in 2014 is no longer
present in 2018.
Groundwater levels in west-central London that were continuing to rise in 2016 seem
to stabilise during 2017.
The recovery around the Battersea-Brixton area reported in 2016 is now being
reversed, with groundwater levels falling on average between 1 to 3 m between 2017
and 2018.
In south east and north east London, groundwater levels have risen while levels
across much of central and north London are stable.
Some observation boreholes are located near abstraction licences. This can mean that at
certain locations, the groundwater level contours based on January data each year may
display local changes, owing to the short-term fluctuations influenced by abstractions. The
level changes shown at the northwest boundary and north London near Cheshunt are
examples of this, both compounded by data comparability issues arising from recent network
changes.
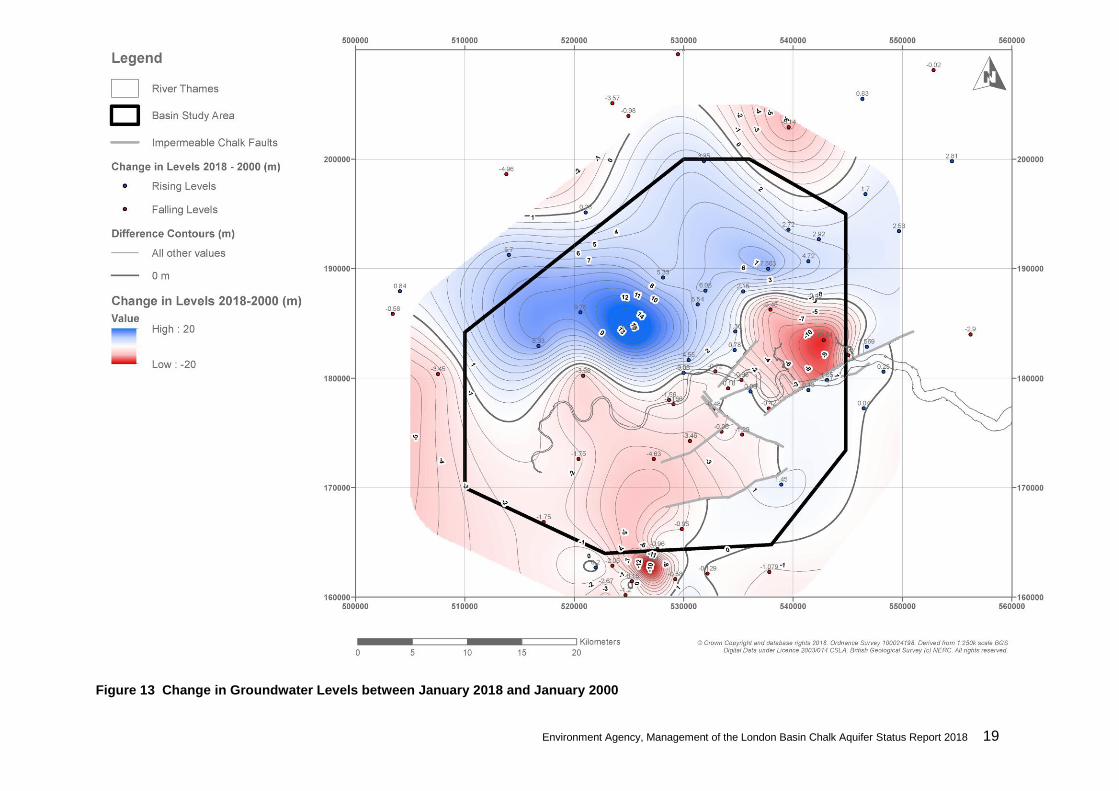
Long Term Changes in Groundwater Levels
The rise in groundwater that the GARDIT strategy was designed to arrest had largely been
achieved by 2000, so that year provides a useful baseline year for comparison. By comparing
the groundwater levels in January 2000 to 2018, it is possible to track long term changes.
These difference contours are strongly influenced by abstraction particularly in south London,
and as a result these contours can change significantly from year to year.
The difference in groundwater levels between January 2000 and January 2018 is shown in
Figure 13, which shows that:
Groundwater levels have risen across north London, due to limited abstraction. The
levels have risen in the order of 8 to 15 m since 2000, and have levelled off in recent
years. The 15 m may be an overestimate of recovery as this has been derived from
Environment Agency, Management of the London Basin Chalk Aquifer Status Report 2018 14
comparing historic record at Barrow Hill, which ceased in 2012 with its replacement
3site of Kilburn Grange, where monitoring started in March 2017, located
approximately 2 km west of Barrow Hill.
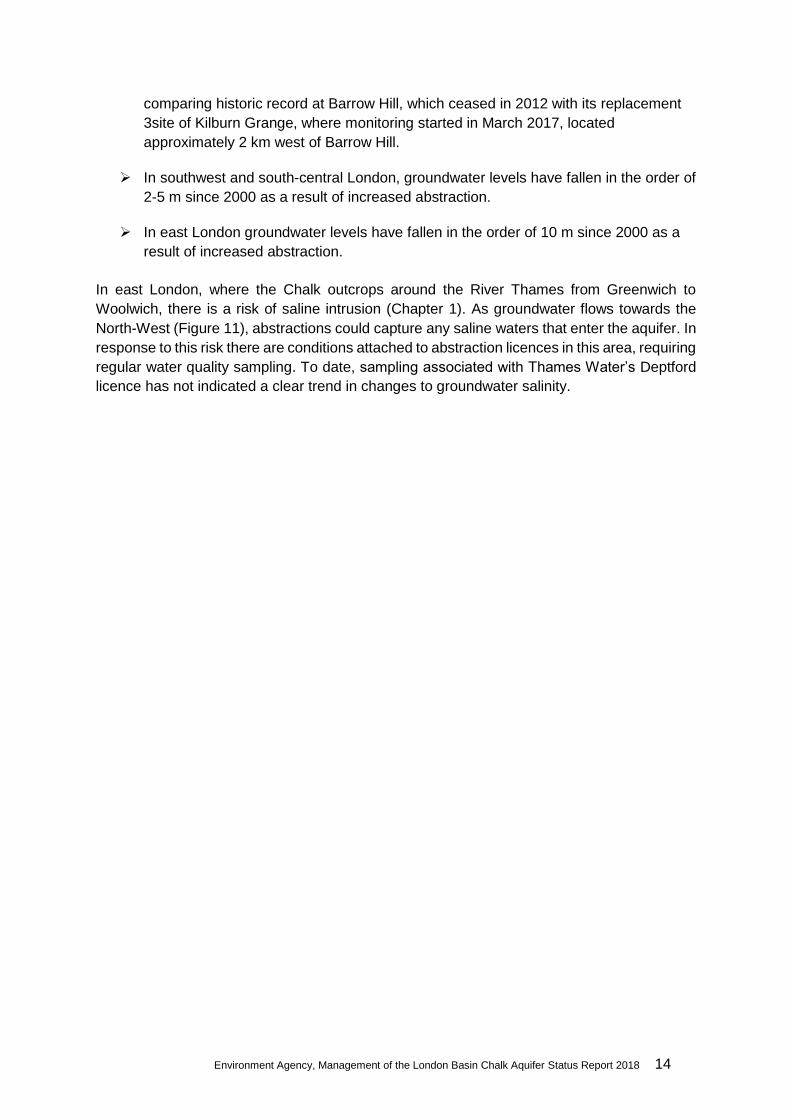
In southwest and south-central London, groundwater levels have fallen in the order of
2-5 m since 2000 as a result of increased abstraction.
In east London groundwater levels have fallen in the order of 10 m since 2000 as a
result of increased abstraction.
In east London, where the Chalk outcrops around the River Thames from Greenwich to
Woolwich, there is a risk of saline intrusion (Chapter 1). As groundwater flows towards the
North-West (Figure 11), abstractions could capture any saline waters that enter the aquifer. In
response to this risk there are conditions attached to abstraction licences in this area, requiring
regular water quality sampling. To date, sampling associated with Thames Water’s Deptford
licence has not indicated a clear trend in changes to groundwater salinity.
Environment Agency, Management of the London Basin Chalk Aquifer Status Report 2018 15
Figure 9 Monitored Groundwater Levels for January 2000
Environment Agency, Management of the London Basin Chalk Aquifer Status Report 2018 16
Figure 10 Monitored Groundwater levels in January 2017
Environment Agency, Management of the London Basin Chalk Aquifer Status Report 2018 17
Figure 11 Groundwater Level Contours for January 2018
Environment Agency, Management of the London Basin Chalk Aquifer Status Report 2018 18
Figure 12 Change in Groundwater Levels between January 2018 and January 2017
Environment Agency, Management of the London Basin Chalk Aquifer Status Report 2018 19
Figure 13 Change in Groundwater Levels between January 2018 and January 2000
Environment Agency, Management of the London Basin Chalk Aquifer Status Report 2018 20
6 Current licensing strategy
Our data show that piezometric levels of the Chalk aquifer vary significantly across the London
Basin. The levels also respond more to changes in local abstraction intensity than the overall
balance between abstraction and recharge, because of the distance and long travel time for
the recharge to reach the centre of the Basin, and the level of abstraction which intercepts the
recharge in its path. As such we need different policies for different areas of London to manage
the available resource. The abstraction regime is also dynamic and changes year by year
depending on the actual, rather than the licensed volume of abstraction, which means
groundwater levels will never actually stabilise. Any strategy for the London Basin aquifer
needs to be flexible, and regularly reviewed and updated.
The principle of the licensing strategy is to maintain groundwater levels below an upper level
needed to protect underground structures, and above a lower level, which prevents the Chalk
aquifer from being dewatered to an unacceptable level.
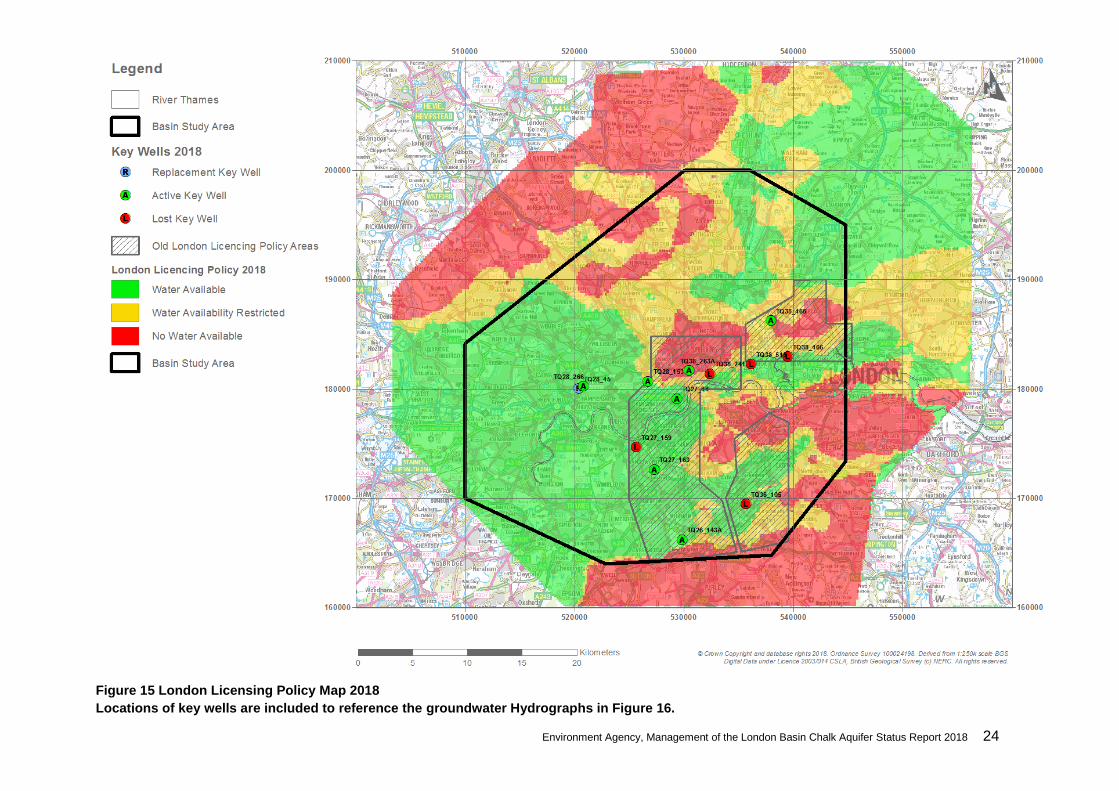
In 2006, we put into practice a principle to restrict further abstraction in areas that may be
approaching their sustainable limit. It is considered that areas where there is a large volume
of actual abstraction, or where groundwater levels are near the top of the Chalk, are unlikely
to be able to support significant further abstraction. Three areas were defined where further
consumptive abstraction needed to be restricted (Figure 15).
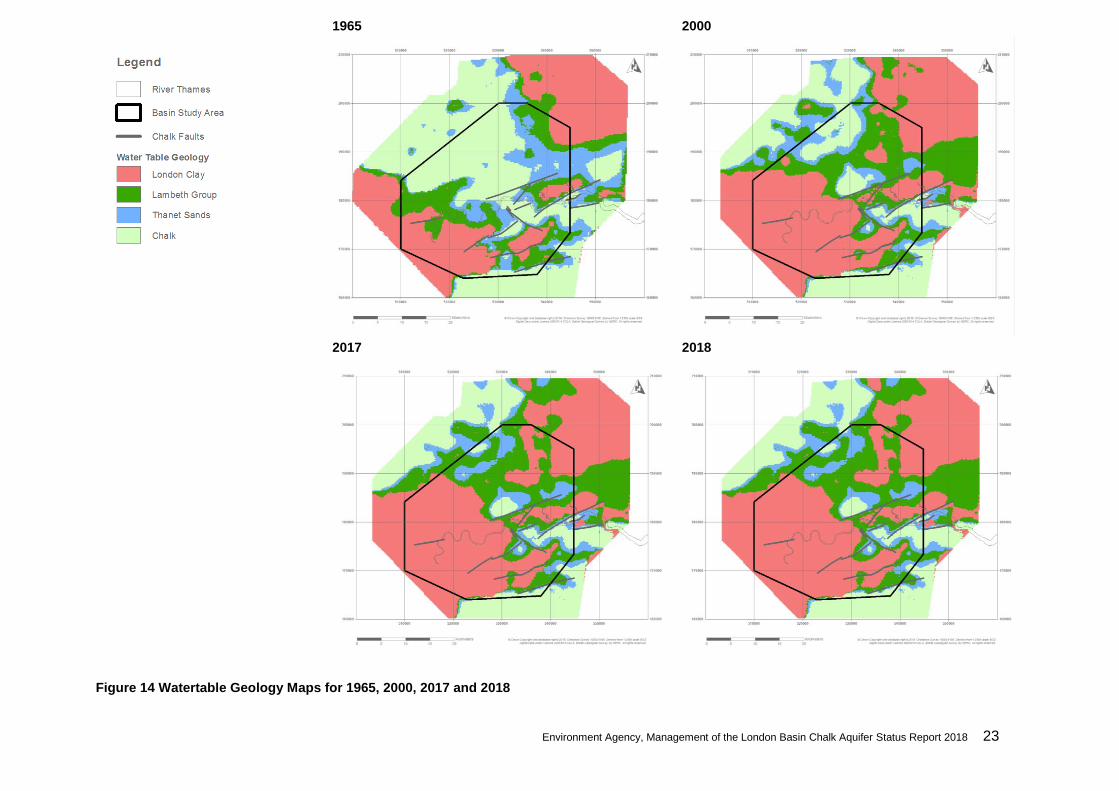
Model development for the London Basin Aquifer has enabled us to better interpret
groundwater level changes with respect to the aquifer units. Since 2011, this report has
included watertable geology maps (Figure 15), which are calculated by comparing each year's
groundwater level contours against the elevation of aquifer units, using high resolution
stratigraphic data from the BGS Geological Model (Royse, 2008; ESI, 2010 and 2013). These
maps therefore estimate which geological unit the watertable or piezometric level resides in
across the study area, to the resolution of the available monitoring data. When compared over
the years (Figure 14), they provide clear visual displays of the extent of dewatering of the
Chalk and Thanet Sand, as well as areas of water level recovery, for both the EA and the
wider users of the report. As such we decided to adopt the watertable geology map method to
guide the spatial application of the licensing strategy for the London Basin aquifer.
Where groundwater levels are below the top of the confined chalk, there is considered to be
no water available as the aquifer is being dewatered. Similarly where Thanet Formation is
being dewatered there will be no water available, as the objective for a sustainable resource
is to have water levels at the top of these aquifer units. Where the pressure head of these
aquifers is in the Lambeth Group there will be some water availability. Abstraction in these
areas will cause drawdown that may start to dewater the Thanet Formation, and therefore
water is available but the sustainable quantity to maintain water levels at the top of the aquifers
may be restricted. Water is available where the aquifer pressure head is in the London Clay,
and in order to protect infrastructure, the London Licensing Strategy encourages abstraction
in these areas.
Environment Agency, Management of the London Basin Chalk Aquifer Status Report 2018 21
The watertable geology map method enables areas of different water availability status to be
updated annually in this report. When dewatered areas become re-saturated they will change
to the ‘water availability restricted’ status, and no new abstraction will be allowed in this area
that may cause new dewatering. Renewals of licences in the 'No Water Available' area may
need to include a ‘hands-off groundwater level’ to prevent further dewatering. Where possible
we would like abstractions in this area to reduce to facilitate re-saturation of the aquifers.
There will be flexibility in the system. Potential applicants for a licence to abstract groundwater
in the London Basin Aquifer are advised to look at the availability map (Figure 15) in the first
instance. In the ‘No Water Available’ Areas, small abstractions may be allowed if the applicant
can convincingly demonstrate that the drawdown caused by the abstracted volume does not
jeopardise the long term water balance in London. In the 'Water Availability Restricted' Areas,
applicants are encouraged to speak to Environment Agency hydrogeologists, who can review
the current water level headroom down to the top of the Thanet Formation. This preliminary
review will be used to inform the detail of the local assessment (see below) and potential
viability of the proposal.
Local assessment are used to confirm if water is deemed to be available for licensing from the
confined Chalk. These assessments take into account the local groundwater availability
outcome maps and take into account the following bullet points:
Has there been any long-term (several years) downward trend in the groundwater
level in the vicinity of the application?
What are groundwater levels in relation to the base of the London Clay Formation? If
the groundwater level is already below the base of the London Clay Formation, then
it is likely that the licence application requires specific hydrogeological impact
assessment to proceed. We will use discretion if there is a significant thickness of the
Lambeth Group below the London Clay, but the aim is to manage abstraction to keep
groundwater levels above the Thanet Formation.
Is there any recent abstraction development in the same area? If groundwater levels
have not yet responded to a recent change in abstraction, we may not grant further
licences in that area.
Are there other proposals in the area that have been refused for water resource
reasons in the last five years?
What is the proximity of the proposal to an existing or proposed Artificial Recharge
Scheme? Artificial Recharge scheme proposals will be treated as a special case as
they involve the management of groundwater levels to provide additional resource to
the scheme operator.

Environment Agency, Management of the London Basin Chalk Aquifer Status Report 2018 22
The above criteria are used to carry out a local assessment of new and variation of existing
abstraction proposals, using the monitoring data and interpretation described in previous
chapters, to consider if the proposal is acceptable. All renewal applications will also need to
consider these criteria, and the implications of changing conditions will be discussed with
licence holders. Figure 14 shows watertable geology maps for what is considered the low point
of water levels in the London Basin, 1965; the peak level in central London before GARDIT
effects were measurable, 2000; and the latest water levels for January 2018 with a comparison
to last year. It is worth noting that the change of watertable geology in a large area of east
London between 2017 and 2018 is the result of a new observation borehole in Ilford installed
by the EA, which improved the monitoring network and therefore the accuracy of the
groundwater level contour in that area.
Environment Agency, Management of the London Basin Chalk Aquifer Status Report 2018 23
1965
2000
2017
2018
Figure 14 Watertable Geology Maps for 1965, 2000, 2017 and 2018
Environment Agency, Management of the London Basin Chalk Aquifer Status Report 2018 24
Figure 15 London Licensing Policy Map 2018
Locations of key wells are included to reference the groundwater Hydrographs in Figure 16.
Environment Agency, Management of the London Basin Chalk Aquifer Status Report 2018 25
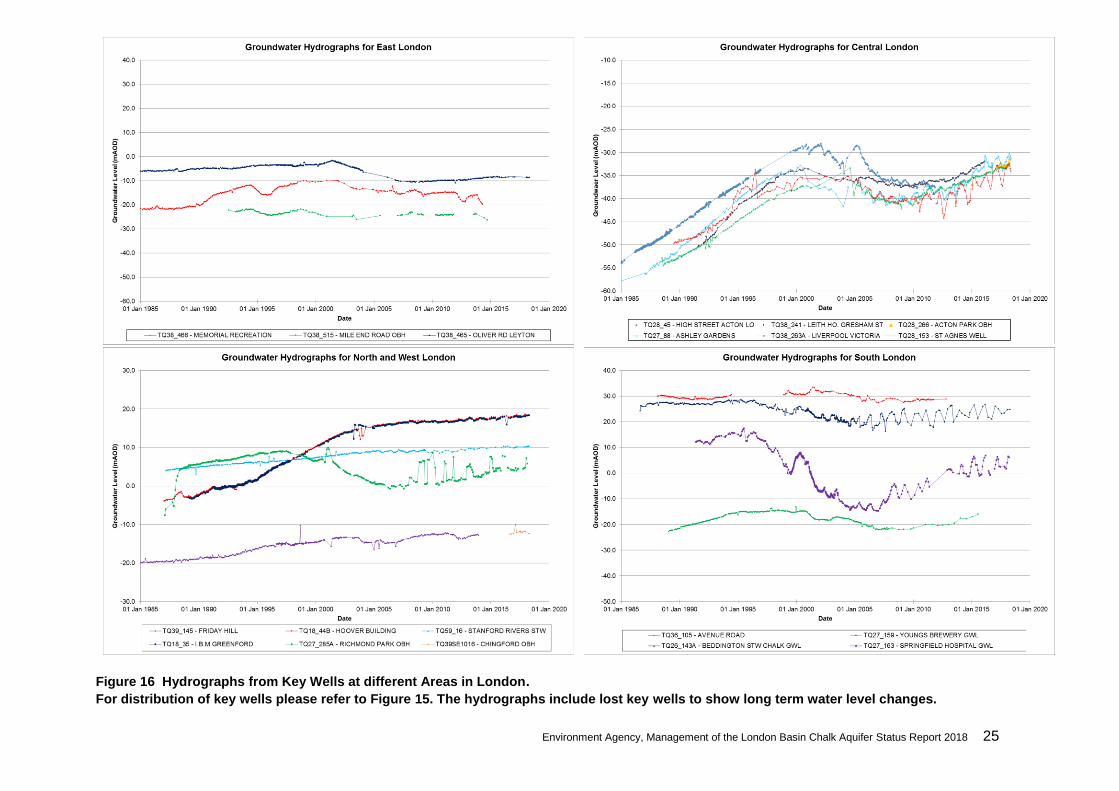
Figure 16 Hydrographs from Key Wells at different Areas in London.
For distribution of key wells please refer to Figure 15. The hydrographs include lost key wells to show long term water level changes.
Environment Agency, Management of the London Basin Chalk Aquifer Status Report 2018 26
7 Open loop ground source heating
and cooling (GSHC) schemes
status
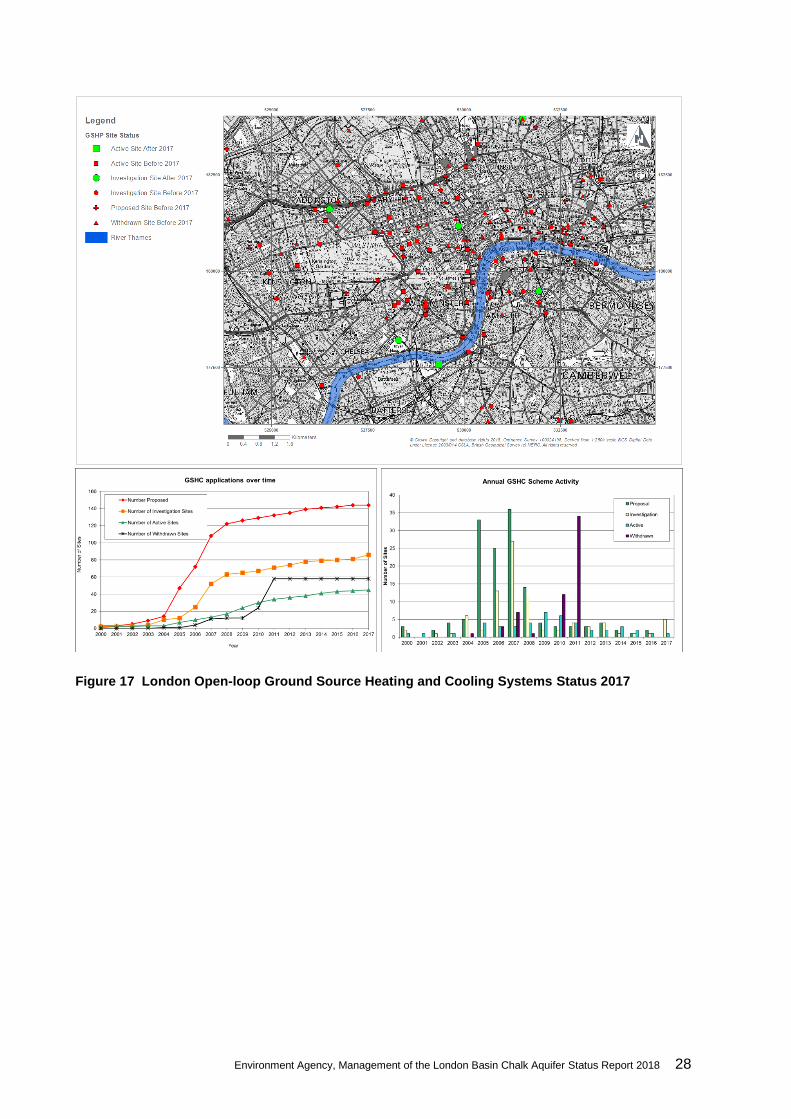
In 2016, there were 2 new proposals recorded for open loop GSHC systems in central London and
1 scheme became active. If you are considering a GSHC scheme you should contact us as there
may be additional sites on our records since this report was published.
It can be seen that GSHC schemes can take several years to set up, reflected by the number of
proposal and investigation sites being significantly larger than the number of schemes that become
active. Figure 17 shows the trends in applications, investigations and active schemes, and the
locations of schemes proposed, investigative and becoming active in 2016 in relation to existing
schemes (active, investigative, or proposed).
Abstractions for GSHC are subject to the London Licensing Strategy. Overall, only non-consumptive
schemes will be licensed in an area with “No water available” status. We will also only consider non-
consumptive schemes in central London to the North of the River Thames, because of the particular
concentration of open loop GSHC schemes in this area, and the potential impact on the recovery of
the central London groundwater depression.
For GSHC to function effectively, groundwater temperatures need to be kept inside practical limits.
We have received reports of active schemes that have been experiencing increased abstraction
temperatures, making their schemes less efficient, or inoperable. The Environment Agency
continues to raise these concerns to operators, that for sustainable operation they should seek to
balance heating and cooling, or design the scheme to remove excess heat before discharge back to
the aquifer.
A further complication is that groundwater in the London Basin has no natural outlet, with flow inward
to the centre of the depression, and removed by abstraction. This means within the area of
approximately the -30 mAOD contour on Figure 11, there is little groundwater through-flow to allow
heat to quickly dissipate away from the aquifer mass immediately around GSHC schemes, thus
increasing the probability of higher than designed abstraction temperatures in this area. Applicants
need to carefully assess the risks and long term sustainability of installing GSHC schemes in areas
where groundwater temperatures may be rising, or where there is a high concentration of existing
schemes.
As part of the licence provisions, all new GSHC schemes are advised to monitor water temperature
at the point of abstraction, and at the point of discharge before the spent water is returned to the
aquifer. As a guideline, temperature of the discharge water should not be higher than 25 degrees
Celsius, or be more than 10 degrees Celsius different (either higher or lower) to that measured at
the point of abstraction. Operators that consider their schemes at risk of breaching these guidelines
Environment Agency, Management of the London Basin Chalk Aquifer Status Report 2018 27
are encouraged to contact the Environment Agency at an early opportunity to discuss possible
mitigating options.
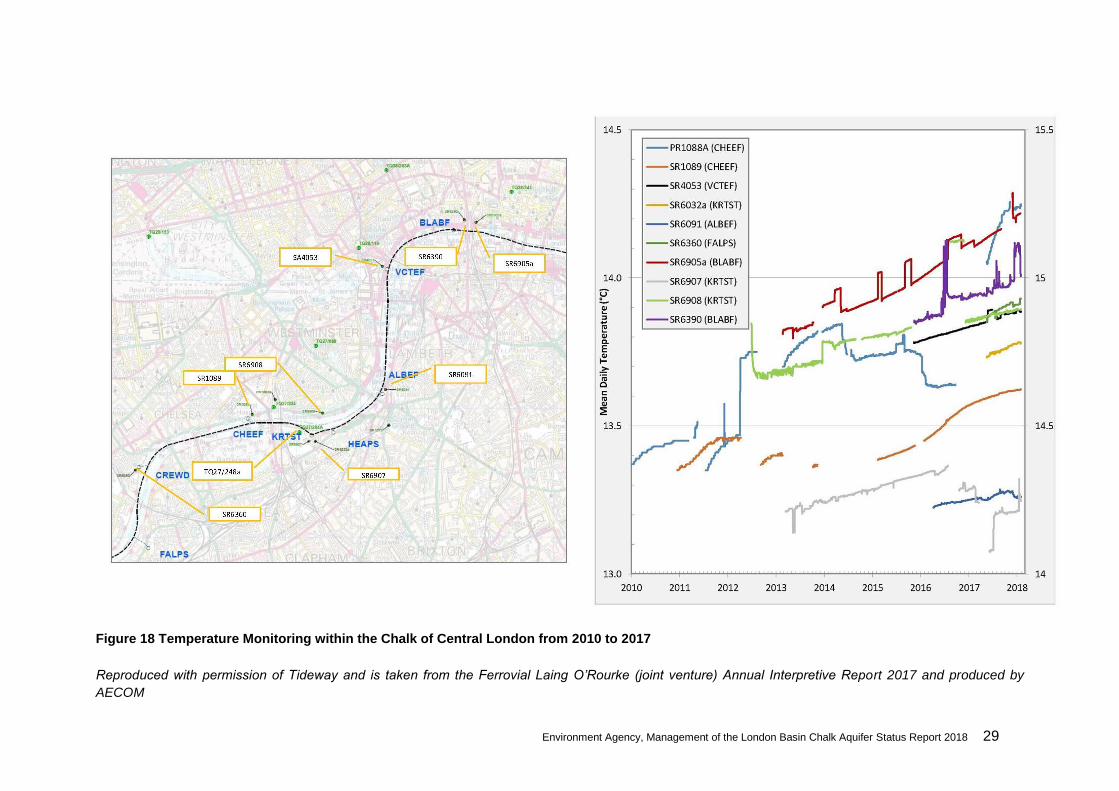
Groundwater temperature data has been gathered at several central London observation boreholes
in recent years. We aim to create a dataset of baseline groundwater temperature so that long term
trends can be observed. Temperatures have risen approximately 3 degrees Celsius from 2005 to
2009 in central London. Since 2010 the rate of increasing temperature has slowed, with
temperatures currently at around 2 degrees higher than the pre-2005 level.
Figure 18 presents temperature monitoring within the Chalk of central London as collected by the
Tideway Project. It is observed that near Battersea, temperatures have experienced a slight fall in
2016 (of less than 1 degree Celsius). Local variations will reflect local groundwater fluxes, proximity
of GSHC to monitoring points, and whether these schemes are balanced or predominantly re-
injecting warmer water.
Environment Agency, Management of the London Basin Chalk Aquifer Status Report 2018 28
Figure 17 London Open-loop Ground Source Heating and Cooling Systems Status 2017
Environment Agency, Management of the London Basin Chalk Aquifer Status Report 2018 29
Figure 18 Temperature Monitoring within the Chalk of Central London from 2010 to 2017
Reproduced with permission of Tideway and is taken from the Ferrovial Laing O’Rourke (joint venture) Annual Interpretive Report 2017 and produced by
AECOM
Environment Agency, Management of the London Basin Chalk Aquifer Status Report 2018 30
8 Conclusions
Between 2016 and 2017 the volume of licensed groundwater abstraction for water companies in the
London Basin was unchanged, while actual abstraction decreased by 5.5%. Increases in abstraction
occurred in East and South London and decreases were mostly concentrated along the Lower Lee
corridor and at Shortlands.
NLARS abstraction in 2017 was 49% less than that in 2016, with re-injection for storage at 28% of
abstraction. In south London, WARS abstraction has increased since 2016, and re-injection has
decreased by 51% to a historically low level.
The shape of the central London groundwater depression has not changed significantly between
2017 and 2018. In east London, the -10 mAOD contour has retreated westward, and a small -20
mAOD contour which appeared in 2014 has now disappeared.
In 2017, 1 new GSHC scheme became active and 2 new schemes were proposed.
The area of dewatered aquifer in central and east London, as well as in south London is little changed
from last year. Consequently, the areas of aquifer with water available for licensing continue to be in
west, southwest and northeast London.
The watertable geology map will continue to be used as the basis for the Licensing Strategy for the
London Basin Chalk Aquifer.
Environment Agency, Management of the London Basin Chalk Aquifer Status Report 2018 31
9 References
A summary of the development of London groundwater level management:
http://www.groundwateruk.org/Rising_Groundwater_in_Central_London.aspx (Accessed August
2017)
Adams, B (editor). 2008. The Chalk aquifer of the North Downs. British Geological Survey
Research Report RR/08/02.
Allen, D.J., Brewerton, L., Bloomfield, J., Coleby, L.M., Gibbs, B.R., Lewis, M.A., MacDonald, A.M.,
Wagstaff, S.J., Williams, A.T.P. and Robinson, V.K., 1997. The Physical Properties of Major
Aquifers in England and Wales. British Geological Survey Technical Report WD/97/24.
Environment Agency R&D Publication 834.
Bierens de Haan, S., Rae, J.E. and Parker, A., 1994. Pyrite oxidation in the tertiary sands of the
London Basin aquifer. Applied Geochemistry 9, 161-173
Chandler, R.J. and Apted, J.P., 1988. The effect of weathering on the strength of London Clay.
Quarterly Journal of Engineering Geology and Hydrogeology 21, 59-68.
Construction Industry Research and Information Association, 1989. The Engineering Implications
of Rising Groundwater Levels in the Deep Aquifer Beneath London, Special Publication 69, CIRIA,
London, UK.
Ellison, R.A., Woods, M.A., Allen, D.J., Forster, A., Pharaoh, T.C. and King, C., 2004. Geology of
London. Memoir of the British Geological Survey, Sheets 256 (North London), 257 (Romford), 270
(South London, 271 (Dartford) (England and Wales).
ESI, 2010. London Basin Aquifer: Conceptual Model Report. Report reference 60121R1.
ESI, 2013. London Basin Aquifer: Numerical Model Report. Report reference 60121R2.
Fry, V., 2009. Lessons from London: regulation of open-loop ground source heat pumps in central London. Quarterly Journal of Engineering Geology and Hydrogeology 42, 325-334.
Hamilton, A., Riches, J., Realey, G. and Thomas, H., 2008. ‘ELRED’: New water for London from
old assets. Proceedings of ICE, Civil Engineering 161, 26-34.
Hargreaves, T.R (AECOM), Tideway, Contractor’s Annual Interpretative Report 2017, Report
Refrence 4602-FLOJV-TTCEN-491-NZ-RG-010017, 08 May 2018
Harris, S.J., Adams, M. & Jones, M.A., 2005. NLARS: Evolution of an artificial recharge scheme.
In: “Recharge systems for protecting and enhancing groundwater resources”. Proceedings of the
5th International Symposium on Management of Aquifer Recharge, ISMAR5, Berlin, Germany, 11-
16 June 2005.
Environment Agency, Management of the London Basin Chalk Aquifer Status Report 2018 32
Kinniburgh, D.G., Gale, I.N., Smedley, P.L., Darling, W.G., West, J.M., Kimblin, R.T., Parker, A.,
Rae, J.E., Aldous, P.J. and O’Shea, M.J., 1994. The effects of historic abstraction of groundwater
from the London Basin aquifers on groundwater quality. Applied Geochemistry 9, 175-195
Rainey, T.P., and Rosenbaum, M.S., 1989. The adverse influence of geology and groundwater on
the behavior of London Underground railway tunnels near Old Street Station. Proceedings of the
Geologists’ Association 100, 123-134
Royse, K.R., 2008. The London Chalk model. British Geological Survey. Commissioned Report
CR/08/125.