
MANAGEMENT OF NON- PERFORMING ASSETS OF...
39
MANAGEMENT OF NON- PERFORMING ASSETS OF ANDHRA BANK AND ICICI BANK
Transcript of MANAGEMENT OF NON- PERFORMING ASSETS OF...

MANAGEMENT OF NON- PERFORMING ASSETS OF
ANDHRA BANK AND ICICI BANK

INTRODUCTION
After the introduction'of structural reforms, through the announcement of New
Economic Policy in the early 90s, several measures have been initiated to strengthen
the banking industry. For instance banking institutions have been allowed to raise
capital, no distinction has been made between private and public sector banks, interest
rates on fixed deposits are decontrolled, international norms on assets classification
have been emphasized and so on. he most important indicator which measures the
efficiency of the banking industry is the level of the Non-Performing Assets (NPAs).
The higher the level of non-performing assets, thc lower will be the profitability of
banks, as there will not be any interest income and there is a need to incur operational
and recovery cost. Moreover, it affects the irnage of thc bank'.
A loan given by the bank to the customer turns into a Non-Performing Asset
(NPA) when it ceases to generate regular income such as interest and the like for the
bank. In other words, when a bank lends a loan and that loan does not get back
principal and interest on time, the loan is said to have turned into an NPA. NPAs are a
natural fall-out of banking business undertaking and, hence, cannot be completely
avoided, High levels of NPAs can severely erode the banks profits, its capital and
ultimately its ability to lend funds further to potential borrowers. Similarly, at the
macro level, a high level of non-performing assets means choking off credit to
potential borrowers, thus lowering capital formation and economic activity. So thc
challenge of the bankers is to keep tho growth of NPAs under control. Clmly, it is
important to have a robust appraisal of loans, which can reduce the chances of loan
twning into an NPA. If once a loan starts facing difficulties, it is important for the
bank to take remedial action.
CONCEPT AND DEFINITION OF NPAs
Non-performing assets are those assets that cease to generate income for
banks. In common parlance a non-performing asset can be defined as a credit fecility
in respect of which the interest andlor installment of principal has remained past due
for a specified period of time. The specified period of time was r e d u d in a phased
m m e r over the years. The Securitization and Reconstruction of Financial Assets and
Enforcemeat of security' Interest (SARFAESI) act, 2002 defined noll-performing
assets W A S ) as" an asset or account of a borrower, which has bear classified by a

bank or financial institution as sub-standard, doubthl, and loss asset in accordance
with the direction and guidelines relating to w e t clasifiution issucd by the RBI".'
An asset is classified 4 non-performing if the bomwer does not pay dues in
the form of principal and interest for a period of 180 days. However, with effect from
march2004, default-status will be given !o a borrower account if dues are not paid for
9Odays. If any advance or credi facility granted to a bomower becomes non- 1 performing, the bank will have to treat all the advanccdcredit facililies granted to that
borrower as non-performing without having any regard to the fact that there may still
exist certain advancesiaedit facilities having perfming status,'
PRUDENTIAL NORMS
The introduction of prudential norms to strengthen thc banks balance sheet
and enhance transparency is considered as a tnilcsto~lc in the financial sector reforms.
The prudential norms, which relate to ir~come recognition, asset classification,
provisioning and capital adequacy, serve three great purposes. Firstly, the income
recognition nonns reflect a true picture of the income and expenditure of the bank.
Secondly, the asset classification and provisioning nonns help in assessing the quality
of the asset portfolio of the bank and finally, capital adquocy that is based on the
classification of assets suggests whether the bank is in a viable position to meet m y
adverse situations due to a decline in the quality of the assets."
The prudential norms that are implemented from thc financial year 1992- 1993
as per recommendation of the Narasimham committee primarily include three
principles viz.
a. Income ;ecognition
b. Classification of Accounts
c. Provisioning
The feahues of the prudential norms and their effects on the profit and balance
sheet prepared by banks are given below.
a. Income recognition
According to ~ e s & e Bank of India guidelines on prudential norms of income
recognition, inter& should not be charged and taken to lnoorne account on all non-

performing assets. In other words, income should hot be recognized on non-
performing assets (NPAs) on accrual basis but should be book4 only when it is
actually realized in respect of.such accounts. Income recognition policy is based on
the record of recovery. The re'cord of recovery is established by ensuring that m y
commitment due, may be, installment of principal or interest or both from a borrower
does not remain uncollected or remain past due for one quarter or more ( 4 quarters
6mn 1992-93 and 3 quarter fmmJ 1993-94 and 2 quaden for 1994-2004) r horn
2004.
Further, it has been decided that the banks should not charge and take into
income account interest, on all non-performing assets and the asset(s) idare classified
borrower wise and not account wise. hat means if a borrower has more than one
account and one of the accounts is classified as NPA, then all the accounts of the
same borrower will be classified as NPA.'
b. Assets Classification on NPAs in Banks
The loan accounts are requircd to be classified into four categories to assess
the general quality of portfolio and also for making provision against loan losses. The
assets are classified as follows:
i. Standard Assets
Standard assets are those which do not disclose any problem and which do not
carry more than normal risk attached .to the business. Such an asset is not a non-
performing asset. However, government guaranteed advances, although categorized
as NPA for the purpose of income recognition, are to be treated as standard assets.
ii. Sub-standard Assets
Sub-standard assets are those assets which have been classified as non-
pdorming assets for a period not exceeding two years. With effect from 3Im March
2001, in such cases, the net worth of the borrower account or the current market value
of security charged is not enough to ensure recovery of the dues to the bank in 111.
Such an asset will have credit weaknesses that jeopardize the liquidation of debts and
the banks will sustain some losses if deficiencies are not corrected. With effect from
31' March 2005, Sub-standard assets are those assets which have remained NPAs

I / i. Secured I
10%
Table 7.1 Provisioning Nor'ms against asset classification in percentage terms
Sl. No 1.
2.
3.
iv. Unsecured portion ------~-Gw~
Assets classification
Standard Asset - .- --
i. General A/c
ii. Direct Agriculture & SME-
iii. Housing Loans ~ b b v e Rs.20 Lakh
iv. Credit cards, personal loans and the like
Sub-standard .
i. Upto 12 months
ii. Between 12 months and 3 years
iii. More than 3 years
Percentage
0.20%
0.25%
1.00%
2.00Y0
ii. Unsecured
Doubtful
20%
30%
100%
assessed. b. Loss category- where the realizable value of the security is legs than 10 per cent of the
20%
I I
outstanding in the account.
Management of NPA
100% 4.
The success of banks in the current context is contingent on its ability to manage the
Source: Hand Book of Banking Information, N.S.Toor, p.2.32 Note: a. Doubtful category-where realizable value of the security is less than 50 per cent of the value
Loss Asset Account
NPA portfolio which adversely affects the profitability.
P Banks need to pay h d i n g costs for blocked up loans and, consequently, funds
availability for recycling for productive uses is a casualty.
P This money earns no interest as interest on NPA cannot be recognized as
income.
5, Income from performing assets is diverted for building up provisions for bad
loans.
b Banks are forced to increase the price of their loan products. Thc prudent
management of NPA-should reflect in the following:
i. Slashing do& the NPAs to a minimum level through; concerted recovery
drives.'
ii. Prevention of accretion of fresh NPAs thhn,ugh efficiwrt management of
loan portfolios.
iii. Fine tuning of assetp (security) for reducing provisional raquirements.
iv. A transparent negotiated settlement system.
Efficient recovery of NPAs would undoubtedly release funds for fnsh
profitable lending, recognition of incomes and reversal of provisions, thereby helping J to improve margins. Branches at the beginning of every half year should identify and
single out probable NPAs and adopt strategies to prevent them from turning into NPA
category.
This requires the constitution of t'mk force or setting up Asset Recovery cell at
the branch level to identify loan recovery drive. The bank should adopt the strategiw
such as loans rescheduling, timely sanction order for extension of adhoc limits,
repayment holidays and so on to prevent accretion of fresh NPAS.'
GUIDELINES FOR EFFECTIVE NPA MANAGEMENT
To quote from the Narasimham Committee Report, 1998, NPAs constitute a
real econorflic loss to the nation in that they reflect the application of sowe capitd
and credit funds to unproductive uses. The money locked up in NPAs is not available
for productive use and to the extent that banks seek to make provisions for NPAs or to
write them off. NPAs, in short, are not just a problem for the banks. They are bad for
the economy. Here are therefore some guidelines for the effective management of
NPAs.
P Early warning signals for incipient sickness have to be identified and proactive
remedial action initiated
9 Attention has to be paid to high value NPAs.
9 Close monitoring is to be made of sub-standard and doubtful assets to pmveoft
the t rans fmt ion of these accounts into loss assets.
B Banks have to takeup the rehabilitation of deserving wits d y
9 To deal with chmnic NPAs, the RBI has inhodud the i a f e of
Settlement Advisory Committees (SACS) for Cumuradng amicaMs
settlements

P The success of SACS depends to a large extent on the attitudes of bankers and
borrowers
P fkcurihies are to be ass9sse.d at regular intervals for the proper provisioning of
doubtful and loss assets:
9 New additions to NPAs can be presented with a sound &it sanctioning
process that includes pre-sanctiohing and post-sanctionine: processes.
9 Post-sanctioning consists of a detailed appraisal of the bomww. Assessment
includes a detailed scrutiny of the different financial statements and
sanctioning as per the-bank lending policy
b The post-sanctioning process includes follow-up, supewision, monitoring and
control regarding the performance of the units. Lack of appraisal vd poor
monitoring lead to an increase in NPA.'
IMPACT OF NPA
If a banking institution wants to survive and grow, it has no option but to
recover the interest and principal in accordance with the t m s of sanction. In case,
income is not received as per prudential norms, the loan will become a non-
performing, asset with all its necessary consequences. NPA affects advmely the
health of the banlang institution in the following ways:
9 Potential interest inborne is derecognized. As a result, profit of the banking
institution gets depleted.
+3 Depending upon the categorization of NPA i.e, sub-standard, doubtll or loss
assets, the banking institution will have to make provision against such loam
ranging from 10 per cent to 50 per cent or even 100 per cent in the cam of
some assets.
+3 In case the banking institution fails to upgmdc the NPA into prfonning
assets, it may be forced to incur legal expenses by going to a court or
Recovery Tribunal and the like.
Q, As a r d t , profit and profitability of the banking institution am d e p l d , cnd
it may face problems in maintaining the required cepitaf adequacy norm.
9 Inadequate capital adequacy nonn may downgrade the banking inotitdm's
rating and dvase ly affect its growth and survivd?

Chart 7.1: Impact of NPAs on the Banking Sector
9 Lower ROE and ROA *$ Lowar image and rating of b& $ Disclosure reduces investors .
confidence 9 Increasing costs / difficulties in
raising capital
+ They require provisioning 9 Borrowing cost of resources locked in
non-pnforming assets 8 Opportunity loss due to non-recycling
of funds 6 100 per cent risk weight on net NPAs
for CRAR.
7
J 9 Capital gets blocked in NPAs *:* Utilized capital in performing assets
does not generate sufficient income to sustain the capital locked in NPAs
9 Recapitalization by Government comes with savings
I O Administration and recovery costs of
non-performing assets *3 Legal costs *:* AdvuSc effect on employee morale
and decision making
Source: www.euroioumals.com
LATEST INSTITUTIONAL MECHANISMS AND INTERNVENTIONS FOR
NPA MANAGEMENT
Of late, several institutional mechanisms have been developed to d d with
NPAs in addition to the tightening of legal provisions and interventions by the
Government of India and the central bank of the country. Following are soma of the
major efforta in this direction.
A. Credit Information Bureau
Credit Information Bureau (India) Limited (CIBIL) was inoorporatsd in
January 2001 with the objective of sharing of credit information on bornwas and
potential borrowers among banks and Fls to mitigate the credit risk and was setup on
the recommendation of Siddiqui committee. CIBIL now has 87 memba and data
sharing is based an the principle of miprodty. Only thok mkn who m i dl the r0quim-i data on all their bonowers to CIBIL will be eli#ble to ace48 Ilbportr.

At present CIBIL is maintaining a database on suit Filed Aavrunts ($?A) of
Rs.one crore and above ahd SFA (will defaulters) of Rs.25 lakh aml above.
The utilization of the services.of CIBIL will help the commercial bnnks to minimize
adverse selection at the appraisal stage itself which will go a long way in amsting tht
creation of NPA at a later stage.
B; W i u l defaulters
As per RBI guidelines a willful default occurs when a borrower defaults in
meeting his obligations to the lender when he has capacity to honour the obligations
or when funds have been utilized for purposes other than those for which finance waa
granted. The list of willkl defaulters is required to be submitted to RBI. Such an
arrangement of sharing of information helps banks in avoiding financing
unscrupulous elements.
C. Legal and regulatory measures
i. Debt Recovery Tribunals @RTs)
To speed up the process of recovery under the judicial system so as to avoid
the deterioration of the securities and other assets of the defaulting borrower, DRTs
were setup under the recovery of debts due to Banks and Financial institutions Act,
1993. The advances of Rs.one million and above can be settled through DRT process.
Appeal can be filed against the order passed by DRT at DRAT, by depositing 75 per
cent of the amount due. Appellate ~ribunal may reduce or waive such r o q h e n t s
to deposit 75 per cent for satisfactory reasons to be recorded in writing. The tribunals
have adopted a summary procedure for the purpose of enabling speedy recovery and
functioning of such tribunals has now been stabilized. The tribunals are now-a-day
deciding cases of recovery in about a year's time as against the avtrage time of 2 to 5
years by civil courts.
ii. Compromise settlements
The process of recovery through negotiated settlements, by which the
borrowers agree to pay a certain amount as full settlement by availing mncatin I
waiva of a portion of the ducq has gained sipificancc of I&, mmp the bPhn. ~ h c ~ ~ c m e n t ~ s h r ~ n p p o l a d b y t b s l l B I I W ~

through the a n n o u n c e ~ t of various "One Time Settlement Schemtsn annound targeting various p u p s of customers. This step has received very positive mqxme
both from the banks as well as from the defaulted borrowers and banks could show considerable improvement in th'eir NPA reduction efforts.
Lok Adalats constituted unber the Legal Services Authorities Act, 1987 help
resolving disputes by conciliation, mediation, or compromise. The award of the Lok
Adalats shall be deemed to be a decree of a Civil Court and no appeal can lie to any
court against the award made by the Lok Adalats. Generally banks do not get the full
advantage of the Lok Adalats due to the difficulty in organizing the conseat of all
parties to the loan transaction to go in for the compromise on the day when the Lok
Adalat meets." Lok Adalats is a convenient method for settlement of disputes
between banks and small borrowers. The RBI has issued guidelines to cornmarcia1
banks and financial institutions advising them to make increasing use of Lok Adalats.
Government has recently revised the monetary ceiling of cases to be referral to Lok
Adalats organized by civil courts from Rs.5 lakh to Rs.20 lakh.
iv. Asset Reconstruction Companies (ARCs)
To solve the problem of bad loans, several institutions have initiated &pa
towards establishment of ARCs, which takeover non-performing loans of banka and
financial institutions at a discounted rate, and manage and dispose of such assob. The
RBI has granted certificate of registration (COR) to three ARCs. The setting up of the
Asset Reconstruction Company (India) Limited (ARCIL) provided a major boost to
banks efforts to recover their NPAs. Here again weak banks normally pnfog not to sell NPAs as it takes a toll on their profits, as the assets arc quoted for ~ W ~ W S C at
heavy discounted values. It is hoped that these guidelints would opan up the industry
in India by developing a secondary market for NPAs.
v. Sartaeei ACT 2002
Securitization and Reconstruction of Financial Assets and E n f m c n t of Security Inkre& Act, 2002 plrovides, inter alia, for mforcanent of securi
dimtion of dues without the intervention of courts W tn'b&. 'ffso
the to a secured creditor (I-) to take
268

assets (securities) in the event of default and sell such 'btia for the purpose of
recovery of the loan.
The constitutional vdiduy ofthe SARFAESl A* 2002 hma ken confinmi by the supreme court in its judgment in the case of Mardia Chemicals Vs, Union Bank of
India, except one provision which mandated deposit of 75 per cent of the claim
aniount by the borrower as a pre-quisite for him to file an appeal against the action
of the bank in taking possession of the securities. This Act has strengthened the rights
of the lenders and they are now in a better position with regard to recovery of the
NPAs.
vi. Corporate Debt Restructuring
The scheme of Corporate Debt Restructuring (CDR) started in 2001 witb a
view to put in place a mechanism for timely and transparent reshucnrring of corporate
debts of viable entities facing problems, outside the purview of Board for Industries
and Financial Reconstruction (BIFR), DRT and other legal proceedings, RBI
constituted a special group for reviewing the corporate debt restructuring system on
September 2004. Based on the recommendations of the special group, RBI hued
guidelines for their comments and implications. Based on the feed back received from
the drafl guidelines, final guidelines on corporate debt restructuring system wm
issued to all commercial banks, financial institutions and RRBs on November 2005.
The major beneficiaries were iron q d steel, refinery, fertilizer and tdecolslmu-
nications industries, accounting for more than two-thirds share of value of assets
restructured. ' ' FACTORS RESPONSIBLE FOR AN ACCOUNT BECOMING AN N P h
Tqere are several factors responsible for an account beamhg NPAs. Thm
factors broadly classified as: a. External factors and b, lntemal factors.
a. External Factors
The external factors include the following.
i. Sluggish legal systems
Long legal tangle, changes that have tnken place in lpb0tP' law and lack of sincere ctTorts by'the banks.,
ii. Scarcity of raw-materials, power and other resources
Due to shortage of the productive resources, the financm by borrowers could
not be productively used.
iii, Industrial wession
Since 1990, there has been a decline in the industrial output due to recession.
The result was the unproductive use of loan amount by the borrowing units. J
iv. Natural calamities like floods, draught, accidents and the like have been
responsible for wastage q d unproductive use of resources by the borrowing units.
v. Failures, non-payment and overdues in other countries, recession in other
countries, external problems, adverse exchange rates and the like arc the factors
responsible for increasing NPAs in the banks. The recent changes in the world
economic orders due to liberalization and globalization have made the problans
more serious.
vi. Government policies like excise duty changes, import duty changes and the like
were also potential factors responsible for NPAs accounts in the banks.
b. Internal Factors
The int&al factors include the following
i. Funds diversification by borroweis
The funds borrowed for a particular purpose but not used for that purpose.
Generally, the fimds borrowed were used for unproductive purpose by the bortowm,
particularly in the case of priority sector lending by the banks.
ii. Time-escalation in project implementation
The bo&ower units normally take more time to implement the project. This
results in escalation of project costs and the increasing possibility of un-recovery or
under recovery of project loans.
iii. Poor recovery of receivables
The b w e r s in the differential schemes provide sacurity which may not ba
recovered in time.

iv. Excessive capacities
The borrowing units'create excessive capacities of the project. The cxccss
capacities are created on non-economic costs. This results in increasing costs of the
1 projects and then, the accounts become NPAs.
v. Difficulties in raising capital
The corporate borrowers f&l to raise capital through the issue of equity or
other debt instruments from capital markets.
vi. Business failure
The business failure in corporate sector has become the order of the day due to
competition in the market, exploitation of market situation and the like.
vii. Diversion of funds for expansion or modernization and the like are helping or
promoting other concerns in the market.
viii. Willful defaults, siphoning of funds, frauds disputes, misappropriation and the
like.
ix. ~efidiencies on the part of the banks, viz., credit appraisal, monitoring and
follow-up are also the factors responsible for accounts banning NPAS."

Table 7.2 shows the classification of loan assets given by Andhra Bank and
ICICI Bank into standard assets, sub-standard assets, doubtful assets, loss assets and
NPAs. The gross advances iqclude standard assets and NPAs. In turn the NPAs
include sub-standard assets, dbbbtful assets, and loss assets. The standard assets of
Andhra Bank in absolute terms have increased significantly h m year to year over a
period of ten years continuously. The growth of standard assets in Andhra Bank in
percentage terms has also been shohing a continuous increase from year to year over
the said period except in 2009-10. The standard assets of Andhra Bank in 2001-02
were Rs.9437.80 more and have increased to Rs.71158.81 crore in 2010-1 1 whmd
the increase in the standard assets of ICICl Bank in absolute terms is continuous from
2001-02 to 2010-1 1 except in 2009-10. he standard assets of ICICI Bank in 2001-02
were Rs.43986.97 crore and have increased to Rs.159147.50 crore in 2010-11. The
growth in the standard assets of ICICI Bank in percentage terms has also shown an
increasing trend from 2001-02(89.77 per cent) to 2005-06(98.49 per cent). Thereafter
from 2006-07 to 2009-10 the growth in the standard assets of ICICI Bank in
percentage terms declined. In 2010-1 1 the growth in the said assets of ICICI Bank in
percentage terms was impressive.
The sub-standard assets of Andhra Bank in absolute terms dmeased from
Rs.180.54 crore in 2001-02 to Rs.116.68 more in 2002-03. In 2003-04 the sub-
standard assets of Andhra Bank increased. In 2004-05 and 2005-06 the said assets of
Andhra Bank decreased. In 2006-07 a@ 2007-08 the substandard assets of Andlua
Bank increased. In 2008-09 the sub-standard assets of Andbra Bank substantially
increased. The growth in the sub-standard assets of Andhra Bank in percentage tams
is also showing more or less the same trend. The substandard assets of ICICI Bank in
absolute terms decreased from Rs.2180.00 crore in 2001-02 to Rs.613.00 crom in
2004-05. From 2005-06 to 2008-09 the sub-standard assets of IClCI Bank
substantially increased. In 2009-10 and 2010-11 they decreased significantly. The
growth in the increase of sub-standard assets of ICICI Bank in percentage terms
showed a declining trend from 2001-02 (4.44 per cent) to 2005.06 (0.59 pes a t ) ,
From 2006-07 (1.23 per cent) to 2009-10 (3.53 per mt) the p H t h in the
subsward assets revealed an increasing trend and in 2010-1 1 the growth in the mid
assets of ICICI Bank decli~ied.

Time series data pertaining to doubtful assets of ~ndhra bank and ICICI Bank
reveals that the doubtful assets of Andhra Bank increased from Rs.320.77 more in
2001-02to Rs.449.62 more in.2002-03. Thereafter from 2003-04 (Rs.403.19 mre) to
2007-08 (Rs.184.59 wore) 'the doubtful assets of Andhra Bank have declined
gradually. In 2008-09 the said assets of Andhra Bank increased. The doubtful assets
of the said bank decreased in 2009-10 'and increased in 2010-1 1. The doubtful assets
share of Andhra Bank in its grosb advances in 2001-02 was 3.22 per cent and has
increased to 3.78 per cent in 2002-03. From 2003-04 (3.02 per cent) to 2009-10 (0,28
per cent) the said share of Andhra Bank has gradually decreased. In 2010-1 1 it is
increased. The doubtful assets of ICICI Bank decreased from Rs.1257.03 m r e in
2001-02 to Rs.1252.02 more in 2002-03'. In 2003-04 and 2004-05 the doubtful assets
of the said bank increased. In 2005-06 the said assets of ICICI Bank decreased. From
2006-07 (Rs.1528.81 crore) to 2010-1 1 (Rs.7400.14 crore) the doubtful assets of
ICICI Bank have increased significantly. The increase / decline in the share of the
doubtll assets of ICICI Bank in its gross advances reveals that there is a declining
trend from 2001-02 (2.57 per cent) to 2005-06 (0.75 per cent). In 2006-07 the
doubtful assets share of Andhra Bank in its gross advances showed an upward trend
and has continued to increase till 201 0-1 1.
The loss assets of Andhra Bank decreased from Rs.22.83 crore in 2001-02 to
Rs.5.69.crore in 2003-04. Ih 2004-05 and 2005-06 the loss assets of An& Bank in
absolute terms increased. In 2006-07 .and 2007-08 the said assets of Andhra Bank
decreased. In 2008-09 the loss assets of Andhra Bank increased tmmendously. In
2009-10 there was no incidence of loss assets in Andhra Bank. However, in 2010.1 1
these were Rs.8.34 more. The loss assets of ICICI Bank increased from Rs.1576.00
crore in 2001-02 to Rs.1785.32 more in 2002-03. From 2003-04(Rs.863.08 mrt) to
2006-07 (Rs.163.72 crore) the loss assets of ICICI Bank gradually deareased, In
2007-08 the loss assets of ICICI Bank i n ~ e ~ s e d . In 2008-09 the loss assets of ICE1 Bank decreased. In 2009-10 and 2010-11 the loss assets of ICICl Bank increased
significantly. The share of loss assets of ICICI Bank in its gross advmw of ten year
pkod has declined from 3.22 per cent in 2001-02 to 0.17 per cent in 2008-09, In
2009-10 and 2010-1 1 the shqe of loss assets of ICICI Bank hcneasad.

The position of Andhra Bank over a ten year period reveals that the
WAS of Andhra Bank inaeased from Rs.524.14 m r e in 2001-02 to Rs.615.37 ~ o r a
in 2003-04. The NPAs of AnW Bank decreased from 2004-05 (Rs.440,93 crore) to
2008-09 (Rs.368.14 more). In 2009-10 and 2010-1 1 the NPAs of Andhm Bank in
absolute terms increased. The share of NPAs of Andhra Bank in its gross advances
has been showing declining trend from 5.26 per cent in 2001-02 to 0.83 per cent in
2008-09. Thereafter in 2009-10 thd 2010-11 the NPAs share of Andhra Bank has
increased. The NPAs of ICICI Bank increased from Rs.5013.03 crore in 2001-02 to
Rs.5027.38 crore in 200203. From 2003-04 (Rs.3047.59 mre) to 2005-06
(Rs.2222.59 crore) the NPAs of ICICI Bank were decreased. From 2006-07
(Rs.4126.06 crore) to 2008-09 (~~9649 .31 crore) the NPAs of ICICl Bank have
increased significantly. In 2009-10 the NPAs of the said bank decreased slightly. In
201 0-1 1 the NPAs of the said bank increased. The NPAs share of ICICI Bank in its
gross advances has decreased from 10.23 per cent in 2001-02 to 1.51 per cent in
2005-06. The said share of ICICI Bank has increased from 2.08 per cent in 2006-07 to
6.67 per cent in 2009-10. In 2010-11 the NPAs share of ICICl Bank has decreased.
Though the quanhun of NPAs of ICICI Bank in absolute terms h q increased from
2009-10 to,2010-11, the share of ICICI Bank in percentage terms has decreased,
From the foregoing analysis one can infer that the size in the standard assets,
doubtful assets, loss assets and NPAs of ICICI Bank is heavier than the size in the
standard assets, doubtfit1 assets and NPAs in Andhra Bank. The standard assets of
Andhra Bank in absolute terms have increased from year to year over the entire study
period. The standard assets share of Andhra Bank in its gross advances has dm
increased fiom year to year from 2001-02 to 2009-10. But the said share of Andhfa
Bank declined in 2010-1 1, whereas in the case of ICICI Bank such an increase is not
observed in absolute terms as well as in percentage terms. The progress in sub-
standard assets, doubtful assets, loss assets and NPAs of Andhrti B d and ICICI
Bank has been fluctuating from time to time.
The CV ratio f%r the time series data of ICIC Bank on standard assets, loss
assets and gross advances is smaller. Therefore, the growth in the standard assets, loss
assets and gross advan- is bore consistent whereas the growth in the stdad
assets, loss assets and gross advances of Andhra Bank. The CV ratio for the time

series data of Andbra Bank on sub-standard assets, doubtful assets and NPAs is
smaller. Therefore, the *OVA in the sub-standard assets, doubtful assets and NPAs is
more consistent than the growth in the sub-standard assets, doubtful assets and NPAs
of ICICI Bank.

Table 7.3 Sector-Wise Spread of NPAs of Andhra Bank and ICICI Bank over a ten year veriod from 2001-02 to 2010-11

. . - . . . - - b
I - , -
1 I . .
, . , . . , , , , , , , ,
- : . . , :.. , ,
, ) . - ' - ' . , ... : . - . - . 'L . 1 '
I : . " , , . - - - . . . ,. , , , , , i>!,! , , ,,
- , ,
, , ,, -
, -
. , ..
. ."I, , : , . , . . , .. > '
. , . . . . . ., _, . ., I .. . . . ' , ,
. , , - , , . ., ."- , , . . , , .
d '
2 8 6 k L ' , . . H , ,
Q CI
I
. f r4
I .
, > .
1 . , . , . ,
. . i '
8 - 4
' C d" -
B 0 P1
. a , - ,- ,,.- , ,
.,., ',, ; ,;:. QI ' . 7 , , ,d. -a,
4 &-I h :,:;, .,.I , :,:, .,,; , : ,; !,,/<- , ., , .
, , , - . . .,.- : . . $ ,- .
8

Table 7.3 explains the spread of NPAs of Andhra Bank and ICICI Bank from
2001-02 to 2010-1 1 over different sectors. The total NPAs of Andhra Bank have
incr&ed in the initial three years of the study period from 2001-02 to 2010-11 and
thereafier the NPAs of Andhri Bank have decreased fiom Rs.440.93 crore in 2004-05
to Rs.368.00 crore in 2008-09. In 2009-10 and 2010-11 the NPAs of Andhra Benk
increased substantially.
The NPAs of Andhra Bank in priority sector increased in the initial three years
of ten year study period. The NPAs of Andhra Bank in priority sector decreased fiom
2004-05 to 2007-08. From 2008-09 to 2010-11 the NPAs of the said bank in the
priority sector increased. Almost the same trend is observed in the growth of NPAs of
Andhra Bank in percentage terms over the entire study period except in 2002-03.
The size of the NPAs of Andhra Bank in public sector is relatively small when
compared to the size of the NPAs of Andhra Bank in priority sector and non-priority
sector. The NPAs of Andhra Bank in public sector were low at the beginning of the
study period fiom 2001-02 to 2010-1 1 and there is no incidence of NPAs in the public
sector in 2002-03. Thereafter, from 2003-04 to 2007-08, the NPAs of the said bank in
the public ,sector have increased. In 2008-09 the NPAs of Andhra Bank in public
sector were minimal. There is no incidence of NPAs in the public sector in 2009-10
and 2010-1 1.
The growth in the NPAs of hdh ra Bank in non-priority sector in absolute
t m s has been fluctuating from year to year. That means to say that &ere is no
consistent growth in the NPAs of Andhra Bank in non-priority sector except in 2002-
03, 2003-04 and 2010-1 1. The growth in the NPAs of Andhra Bank in non-priority
sector in percentage terms has also been showing a f l w t i n g trend except in 2006-
07 and 2007-08.
The total NPAs of ICICI Bank in 2001-02 were Rs,5013.03 crorc and have
increased to Rs.5027.38 crore in 2002-03. The total NPAs of ICICI Bank have
decreased fiom Rs.3047.59 crow in 2003-04 to Rs.2222.59 more in 2005-06,
Thereafter, firm 2006-07 to 2008-09, the NPAs of ICICI Bank have i n d
significantly. In 2009-10 the WAS of the said banks d d to Rs.9267.00 moreCIWC
In 2010-1 1 they increased.

The NPAs of ICICI Bank are more in non-priority sector than in public sector
and priority sector. Th; inddence of NPAs of IClCI Bank in no~priority sector is
high when compared to other two sectors viz., priority sector and public sector. The
growth of NPAs of ICICI Bank in absolute terms in non-priority sector has been
showing a declining trend fram 2001-02 to 2005-06 and, thereafter, from 2006-07 to
2010-1 1 it is observed that the there i s a tremendous growth in the increase of NPAs
of ICICI Bank in non-priority setor. In percentage terms, the growth of NPAs of
ICICI Bank in non-priority sector has been showing a declining trend from 2001-02 to
2002-03. From 2003-04 to 2005-06 the growth in NPAs of ICICI Bank in priority
sector in percentage terms has been constantly rising. In 2006-07 the growth of NPAs
of ICICl Bank in percentage terms decreased. In 2007-08 and 2008-09 the growth in
the NPAs of the said bank in non-priority sector in percentage terms increased. A
decreasing trend is observed in the growth of NPAs of ICICI Bank from 2009.10 to
2010-11.
The NPAs of ICICI Bank in public sector were very less in 2001-02. The
volume of NPAs of ICICI Bank in public sector in absolute terms was very high from
2003-04 to 2005-06. The NPAs of ICICI Bank in public sector bank have decreased
and beconie constant in 2006-07 and 2007-08. There is no incidence of NPA in public
sector from 2008-09 to 201 0-1 1.
The NPAs of ICICI Bank in priority sector increased from Rs.291.59 crore in
2001-02 to Rs.344.46 crore in 2002-03. From 2003-04 to 2005-06 the NPAs of ICICI
Bank in priority sector in absolute terms have decreased. The NPAs of ICICI Bank
increased h m Rs.983.83 more in 2006-07 to Rs.1946.00 crore in 2009-10. In 2010-
11 the NPAs of the said bank in absolute terms increased. The growth in the N P h of
ICICI Bank in'priority sector has been showing a fluctuating trend from year to year.
Ffom the foregoing analysis one can infer that the incidence of NPAs of
Andhra Bank in priority sector is considerably high whereas the incidence of N P h of
ICICI Bank in non-priority sedor is significantly high.
The results obtained for some of the statistics such as Mean, SD, CV, LOR
and CGR rev& that the incidence of NPAs of Andhn Bank pniority sactor is bigha
than the incidence of NPAs of Andhra Bank in non-priority scator and vice vewa in
the case of ICICI Bank. Fig. 7.1 ~ t p l ~ d 3 the data given in M e 7.3.

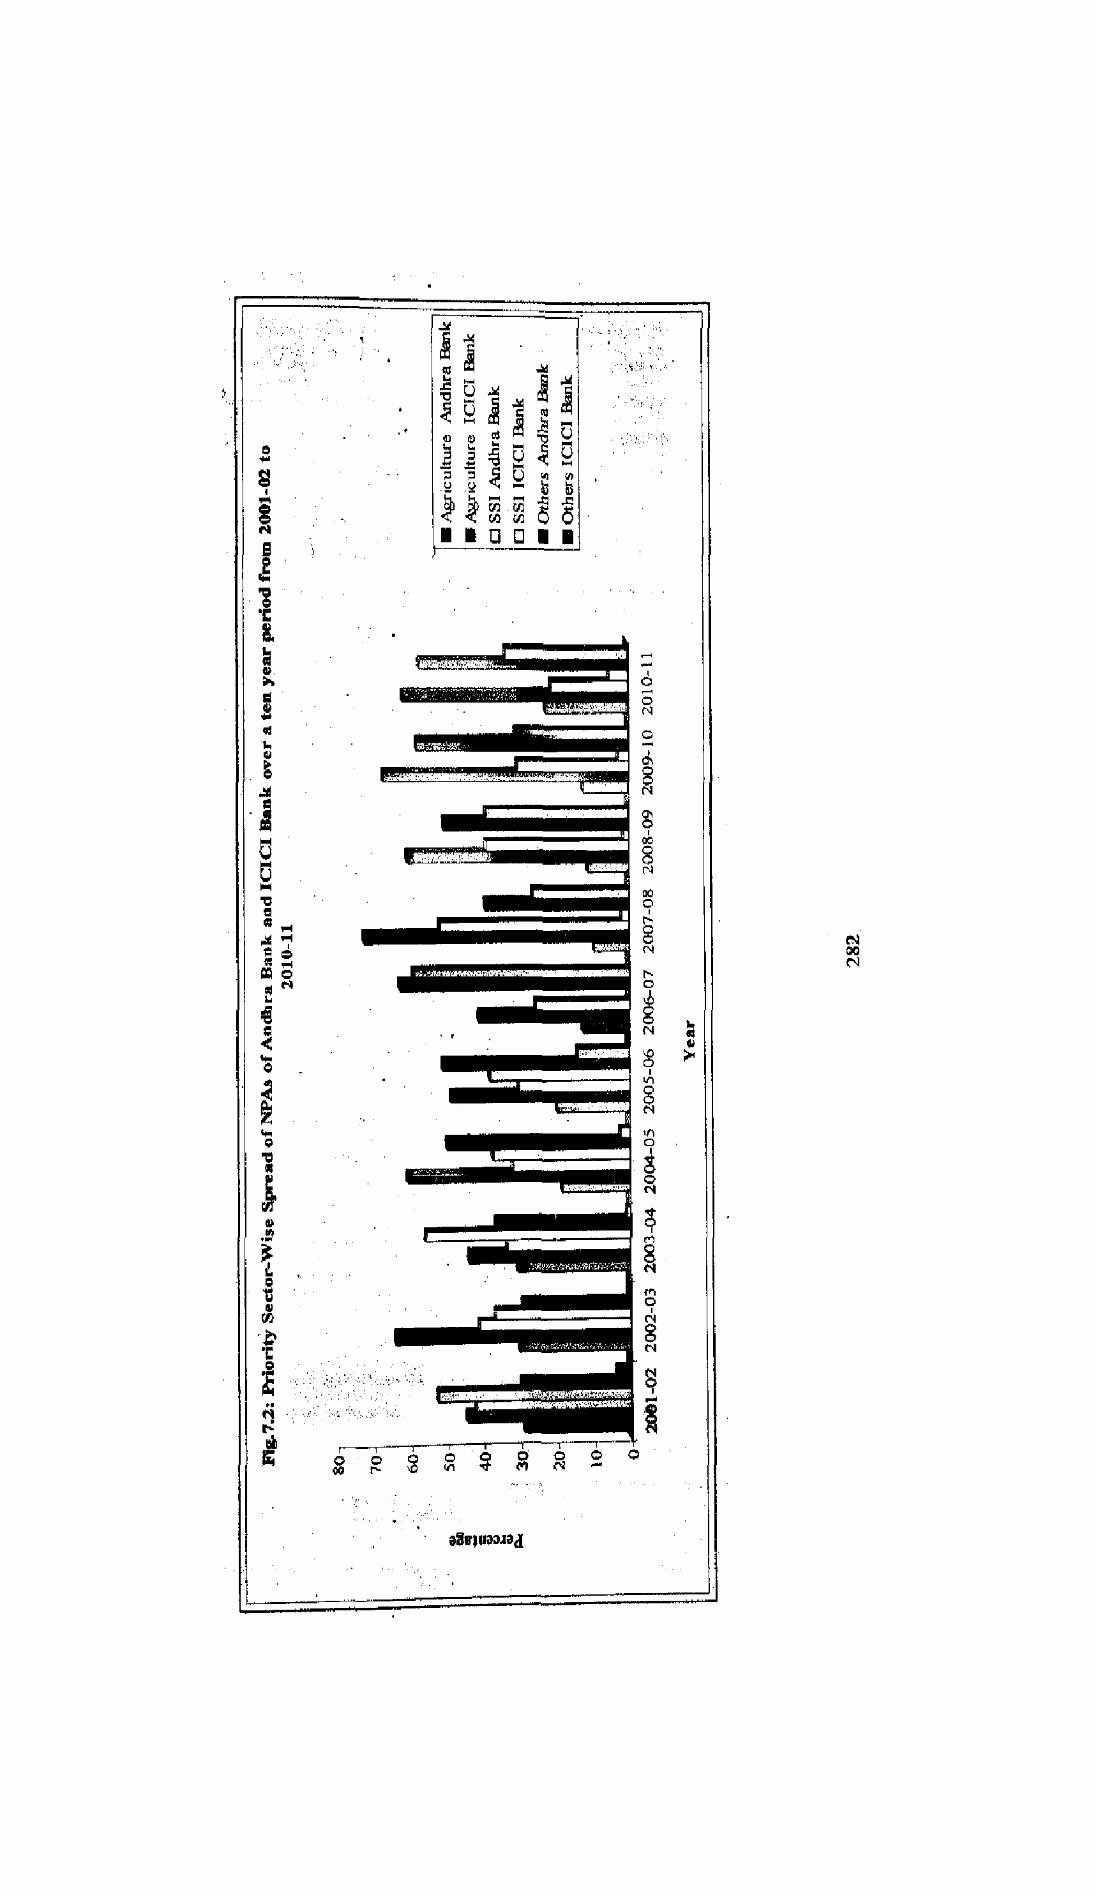

Table 7.4 shows the distribution of priority sector NPAs of Andhra Bank and
ICICI Bank over different years and sectors. It is understood from the above table that
the priority sector NPAs were spread over different sectors viz., agriculture, SSI and
others. The NPAs of ICICI Brink in priority sector are more than the NPAs of Aadhra
Bank. The accumulated NPAs of ICICI Bank over a ten year period were Rs.85918
crore whereas the accumulated NPAs df Andhra Bank in priority sector over the said
period were Rs.26 11 1 crore. Thid indicates that the size of the NPAs of ICICl Bank
in priority sector was higher than the size of the NPAs of Andhra Bank in priority
sector. The NPAs of ICICI Bank in priority sector increased from Rs.291.59 more in
2001-02 to Rs.344.46 crore in 2002-03. Thereafter from 2003-04 (Rs.179.28 crore) to
2005-06 (Rs.94.30 crore) the NPAs bf lCICl Bank in priority sector gradually
decreased. The NPAs ICICI Bank in-absolute terms increased fiom Rs.983.83 crore in
2006-07 to Rs.1808.00 crore in 2010-1 1. The NPAs of Andhta Bank in priority sector
have increased from Rs.304.42 crore in 2001-02 to Rs.350.87 more in 2003-04.
Thereafter, fiom 2004-05 (Rs.240,39 crore) to 2007-08 (Rs.136.57 mre), the NPAs
of Andhra Bank in priority sector have decreased significantly. The NPAs of Andhra
Bank in total priority sector increased tremendously fiom Rs.157.00 crore in 2008-09
to Rs.522.90 crore in 2010-1 1.
The incidence of NPAs of Andhra Bank in others is higher than in SSI and
agriculture. The NPAs of'Andhra Bank in others increased from Rs.89.29 crore in
2001-02 to Rs.127.93 crore in 2003-04 and, thereafter, from 2004-05 to 200748 the
same decreased significantly. From 2008-09 (Rs.79.00 crore) to 2010-11 (Rs.297.00
crore) the WAS of Andhra Bank in others increased. The growth in tha NPAs of
Andhra Bank in others has increased significantly from 2003-04 (36.47 per cant) to 20
10-1 1 (56.90 per cent) except in 2007-08.
The NPAs of Andhra Bank in agriculture in absolute terms i n c d from
Rs.87.57 m r e in 2001-02 to Rs.106.47 crore in 2003-04. ThereaRer, from 2004-05 to
2007-08 them decreased. From 2008-09 to 2010-11 the N P h of Andhra Baak in
agriculture increased tremendously. The growth in the share of agriculture NPAs in
the NPAs of total priority sector of Andhra Bank fluctuated from 2001-02 to 2007-08
and from 2008-09 to 201 pi l the NPAs growth in agriculture is q i d . The mngnitudo
of NPAs of ICICI Bank is more in agriculture thaa in SSI s&or and o&w, The

NPAs of ICICI Bank in agriculture increased from Rs.129.43 wre in 2001-02 to
Rs.219.14 more in 2002-03. Thereafter, from 2003-04 (Rs.78.30 mre) to 200546
(Rs.45.66 mre) the NPAs of ICICI Bank in agriculture decreased significantly. Tbe
NPAs of ICICI Bank in agriculture increased from Rs.403.83 crore in 2006.07 to
Rs.981 .85 crore in 2007-08. In 2008-09 the NPAs of ICICI Bank in agriculture
decreased. In 2009-1 0 and 20 10-1 1 the NPA~ of lC1CI Bank in agriculture drastically
increased.
The NPAs of Andhra Bank in SSI increased from Rs.127.56 crore in 2001-02
to Rs.127.94 crore in 2002-03. The NPAs of Andhra Bank in SSI sector d e d
from 2003-04 (Rs.116.47 more) to 2006-07 (Rs.38.43 crore). In 2007-08 the NPAs of
Andhra Bank increased. From 2008-09 (Rs.61 .OO crore) to 2010-1 1 (Rs.109.00 crore)
the NPAs of Andhra Bank increased tremendously. The growth in the NPAs of
Andhra Bank in SSI sector in percentage terms has declined from 41.90 per cent in
200 1-02 to 25.33 per cent in 2006-07. In 2007-08 the growth in the NPAs of Andhra
Bank in SSI sector increased. Thereafter, from 2008-09 (38.85 per cent) to 2010.1 1
(20.88 per cent) the growth in the NPAs of Andhra Bank has declined gradually.
The growth in the NPAs of IClCI Bank in absolute terms in others has been
showing a declining trend from 2001-02 to 2002-03 and, thereafter, from 2003-04 to
2006-07 the NPAs of ICICl Bank increased significantly. In 2007-08 the same
decreased. From 2008-09 to 2010-1 1 the NPAs of lCICI Bank in absolute terms in
others have increased significantly. The growth in the NPAs of ICICI Bank in othera
in percentage terms has been showing an increasing trend from 2001.02 to 2006.07
except in 2002-03. The trend in the growth of NPAs of ICICI Bank in othsrs
fluctuates, .
Erom the foregoing analysis one can infer that the NPAs of ICICI Bank are
more voluminous in priority sector than the NPAs of Andhra Bank. The inawing
growth in the NPAs of ICICI Bank and Andhra Bank is significant in the recent past
in all the sub-sectors of priority sector. The incidence of NPAs of Andhra Bank in
others is higha in agriculture and SSI, whereas in the incidence of NPAs of ICICl
Bank in agriculture is higher @an in others and SSI sector.
The results obtained for some of the statistics aiso reveal that the growth in the
NPAs of ICICI Bank is more positive in agriculture thm in others and SSI sectors.
The &owth in the NPAs of Andhra Bank is more consistent in others than the p w t h
in the NPAs of ICICI Bard( in different sectors viz., agriculture, SSI and others
because the CV value is less for the time series data. Fig.7.2 further shows similar
inference.
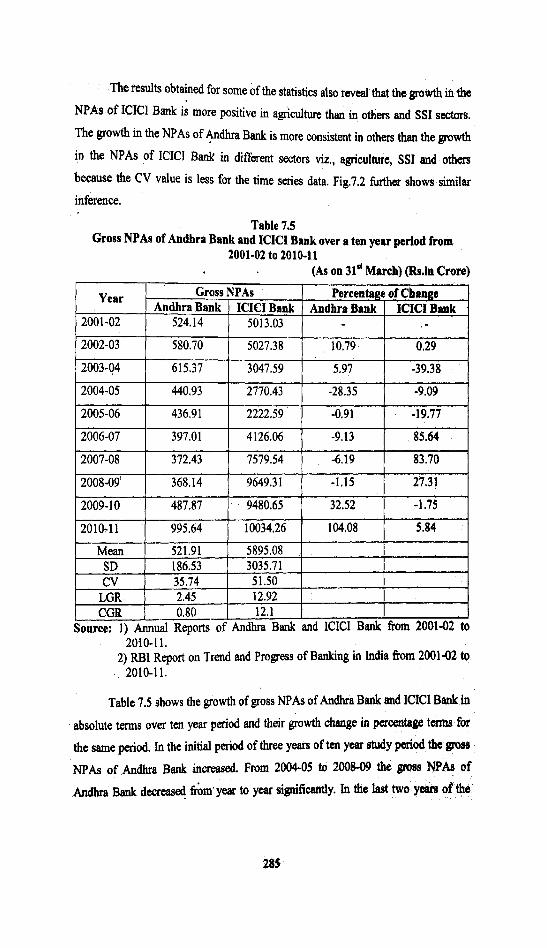
Table 7.5 Gross NPAs of Andhra Bank and ICICl Bank over a ten year period from
2001-02 to 2010-11 (As on 31" March) (%.in Crom)
2010-11. 2) RBI Report on Trend and Progress of Banking in India from 2001-02 to
2010-1 1.
Table 7.5 shows the growth of gross NPAs of Andhra Bank and ICECI Bank in
absolute terms over tm year period and their growth change in permtap terms for
the same period. In the initial period of three years of ten year study period the gross
NPAs of Andhra Bank increased. From 2004-05 to 2008-09 the gross N P h of
A n h Bsnk decreased firbm* year to year significantly. In the last two yeere of tha

study period of 2001-02 to 2010-1 I the gross NPAs of the said bank have increased
substantially.
The gross NPAs of ~CICI Bank increased in the initial period of two years.
Thereafter, from 2003-04 to 2005-06 the gross NPAs of the said bank decreased.
From 2006- 07 to 2010-1 1 there is an increasing trend in the gross NPAs of ICICI
Bank except in 2009-10. Percentage change from year to year in respect of gross I
NPAs of Andhra Bank reveals that the change in NPAs of Andhra Bank is positive in
2002-03,2003-04,2009-10 and 2010-1 1, whereas in the remaining years of ten year
study period h r n 2001-02 ;o 2010-1 1 &e change is negative. The percentage chmic
in the gross NPAs of ICICI Bank is negative from 2003-04 to 2005-06 and in 2009.
10. In the remaining years of a ten year study of period the percentage change in the
gross NPAs of ICICI Bank is positive and the magnitude of NPAs of ICICI Bank
from 2006-07 to 201 0-1 1 has decreased gradually except in 2009- 10.
From the foregoing analysis one can infer on the basis of the size of the gross
NPAs in absolute terms that the quantum of gross NPAs in ICICI Bank is more than
the quantum of gross NPAs in Andhra Bank. Andhra Bank could keep the NPAs low
for a considerable period of time whereas in the ICICI Bank its management could not
keep its NPAs at low level.
The statistical results obtained for various statistics such as Mean, SD, CV,
LGR and CGR reveal that the incidence of gross NPAs in Andhra Bank is higher than
the incidence of NPAs in ICICI Bank because the CV value is less for the time series
data on gross NPAs in Andhra Bank.

Table 7.6 . Net WAS of Andhra Bank and ICICI Bank over a ten year period from
. 2001-02 to 2010-11 (As on 31" Marcb) (R8.in C m l
2010-1 1. 2) RBI Report on Trend and Progress of Banking in India from 2001-02 t6
Year
2001 -02
Table 7.6 depicts the growth of net NPAs of Andhra Bank and ICICI Bank in
absolute terms and the change in their growth in percentage terms in the case of both
Net NPAs Andhra Bank I ICICI Bank
237.23 1 2581.83
Andhra ~ank'and ICICI Bank during the study period of 2001-02 to 2010-1 1. It is
Percentage of Change Andhra Bank 1 ICICl Bank
I
interesting to note that the net NPAs of Andhra Bank in absolute terms have
decreased from year to year from Rs.237.23 crore in 2001-02 to R9.48.97 more in
2004-05. In 2005-06 the net NPAs of Andhra Bank increased. From 2006.07 to 2010-
11 the net NPAs of Andhra Bank increased from year to year and reached Rs.273.68
a r e in 2010-1 1.

The growth in the net NPAs of ICICl Bank in absolute terms increased from
Rs.2581.83 crore in 2001-02 to Rs.2823.77 crore in 2002-03 Fmm 21003-04 to 2005-
06 the growth in the net NPAs of ICICI Bank has been showing a fluctuating trend.
Thereafter, fiom 2006-07 to 2008-09, the net NPAs of the said bank tremendously
increased. In 2009-10 and 2010-11 they were decreased significantly. The growth in
the net NPAs of Aodhra Bank in percentage terms, from year to year, showed a
fluctuating trend. The growth in khe net NPAs of Andhra Bank is showing negative
growth from 2002-03 to 2004-05 and in 2006-07. Thereafter, from 2007-08 to 2010-
11 the growth in the net NPAs of Andhra Bank is positive but in 2009-10 the net
NPAs of the said bank decreased. The growth in the net NPAs of Andhra Bank both
in absolute terms as well as in percentage terms is tremendous. The negative growth is
observed in the net NPAs of ICICI Bank in some years i.e., in 2003-04, 2005-06,
2009-10 and 2010-1 1. In the remaining years of ten year period of study, the growth
in the NPAs is positive but the growth gradually decreased from year to year from
2006-07 to 2008-09.
From the foregoing analysis one can infer that the growth in the net NPAs of
Andhra Bank shows a declining trend from 2001-02 to 2004-05. But from 2007-08 to
2010-1 1 h e growth in the net NPAs of Andhra Bank is rapid. The growth in the net
NPAs of ICICI Bank showed a fluctuating trend from 2001-02 to 2005-06 even in
absolute terms. From 2006-07 to 2008-09 there is a tremendous growth in the net
NPAs of ICICI Bank. Thereafter, in 2009-10 and 2010-1 1, the net NPAs in absolute
terms decreased.
The statistical results obtained for various statistics such as Mean, SD, CV,
LGR and CGR reveal that the magnitude of NPAs in ICICI B d is higher than in
Andhra Bank because the value obtained for CV on time series data of ICICl Bank is
less. The results of LGR and CGR are indicated by negative sign.

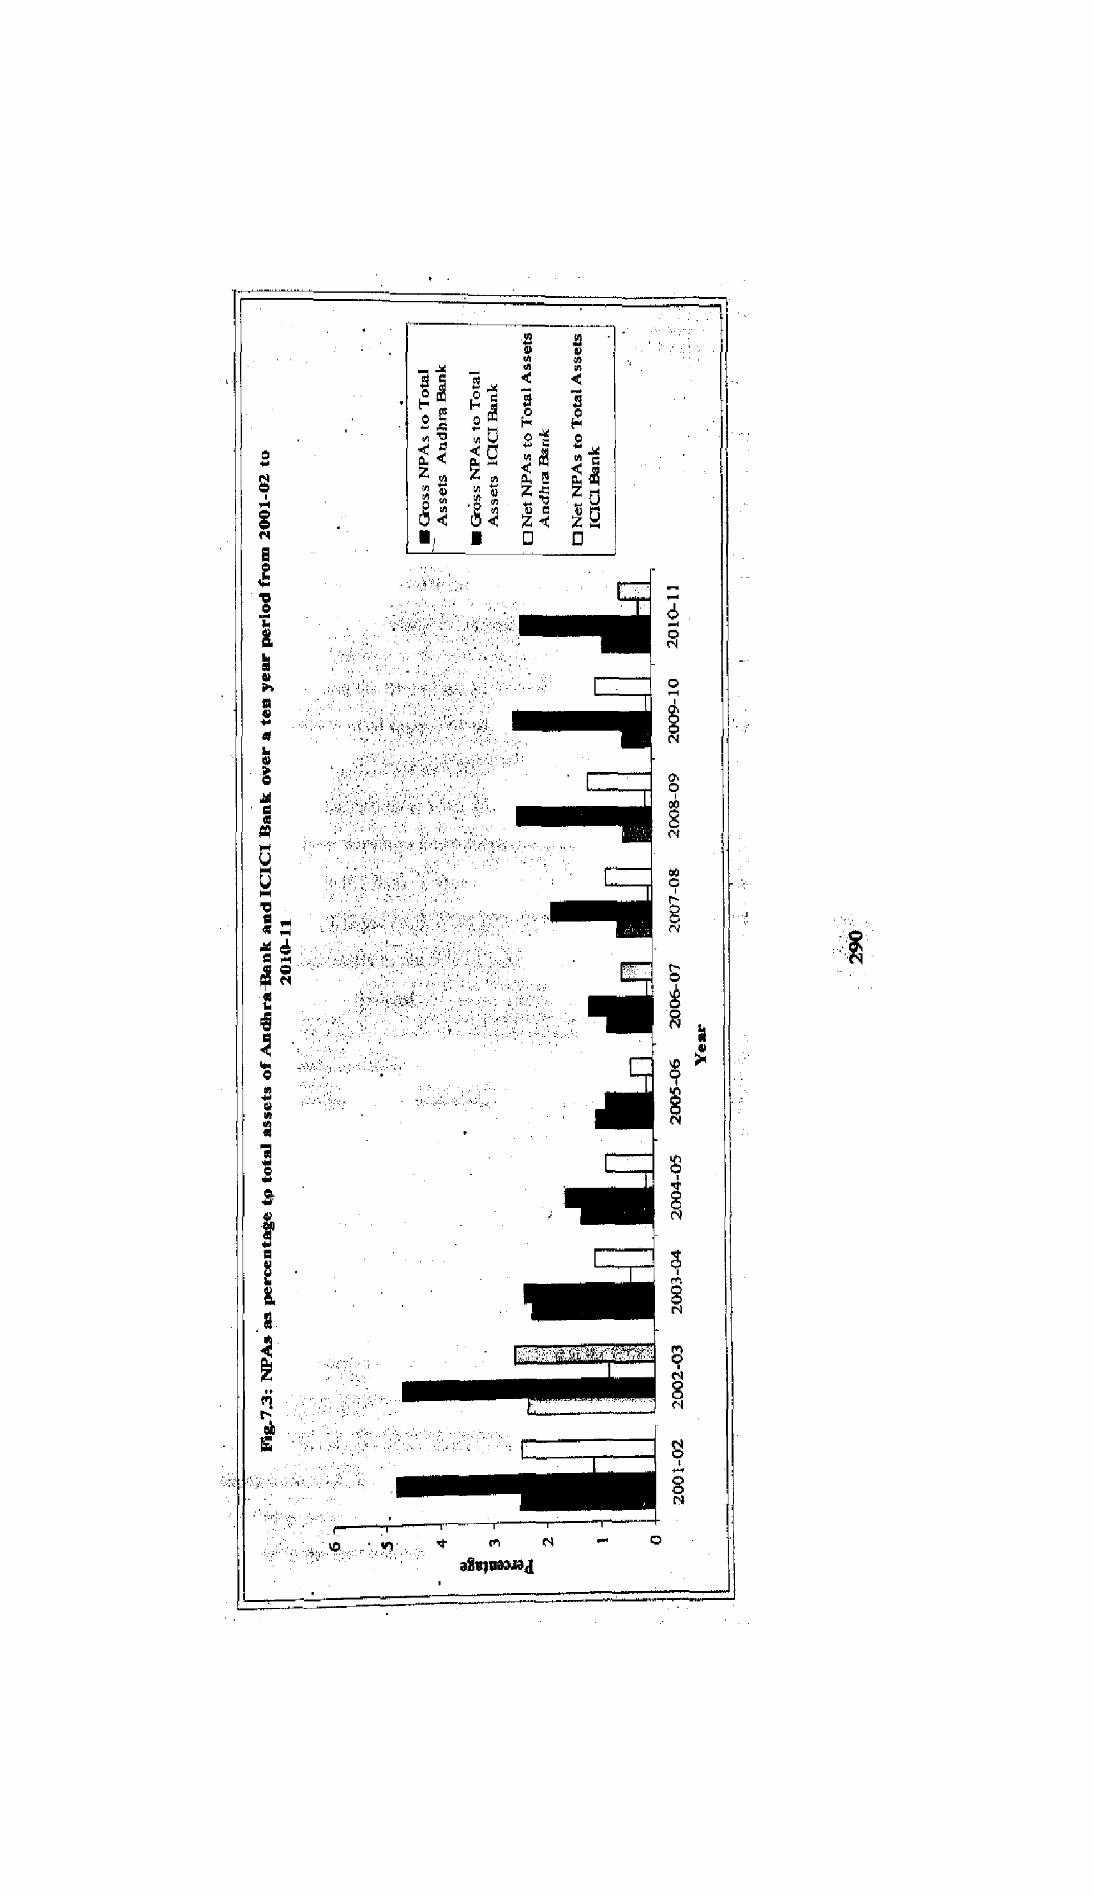
Table 7.7 NPAs as percentage to total assets of Andhra Bank and ICICI Bank over a ten year period from 2001-02 to 2010-11
-
Ekmrce: 1) AZglual Reports of Aodhra Bank a d ICICI Bank fi-om 2001-02 to 2010-11.
& 4 , , , . ' , - " ,=, .,:! ,::, - ;,: .',. -':,-,.;: :, , ::,,,- ,,, ,, , , n " ,, -,;;:?;::;;:,! i;; ,;:\::L,,;<, ,-:;;',,i,[, , 1. ,,I,- 1 .<>, , ,
1, ,, . .. .;':.,I:>.,:'
ryi W - - - " '
: , - ' . - , . , , ; , , ,,;, I , . "I., ,
, , - ' , I : ' , - , :,;',.i,, : ' - . -. , .,I.: , i,, . :, , : , , , - , . : - >
;; , L ', i , ,,, , -$ . . , ," - . , , , ,fi,-:y ,,:..-;- yp>> ,-,; ' n . ' . ,.,.I., ,,,., - , ,. ,!;:', ' . . , , . , . -::>, . , . ., ,. ;:. . . '
:,: *;.;
, ' I , . . ' I . I . , . : , , '.' . , , , ,
'I..,. ' . ' . > ., ,',; : . , , m :,. .,.,.','I - , , , < ":. '
, .'.,., ' ? , , ' , . ' , ' > . .; ." \ <. > ' ,.,?
,; _ . . , , I . . . I , . , , . ,, , " , ' ! , . - , '
. ,
.''I ' ' . ' :. .., ., '.. y . . .:,. ' . ;',. .':. : . .: :. .., . ' . 3 . m . , , ,
, , . , . . , ,
, , , , . .
4 . - . - , , , - . , , - , - 4

Table 7.7 describes the gross NPAs, the ratio of gross NPAs to totel wets, net
NPAs and the ratio of net NPAs to total assets. It is clearly underst& from the above
table that the total assets of hdh ra Bank in absolute terms have increased fim year
to year for the entire ten ye& period of study. The total assets of Andhra Bank in
2001-02 were Rs.20937 crore and have increased to Rs.lO8901 crore in 2010-1 1,
whereas the growth in the total assets of ICICI Bank in absolute terms also started
increasing from 2001-02 but the bpeed in the increase of total assets went on only till
2007-08. Thereafter, in 2008-09 and 2009-10, the total assets of ICICI Bank
decreased. In 2010-1 1 the volume in the assets of ICICI Bank increased.
The growth in the ratio of net NPAs to total assets in Andhra Bank has been
showing a declining trend from 2001-02 to 2007-08. The ratio of net NPAs to total
assets in 2001-02 was 1.13 per cent and it has moved down to 0.09 per cent in 2007-
08. Thereafter, in the next three years from 2008-09 to 2010-1 1, the same ratio of the
same bank has been showing a fluctuating trend. The growth in the ratio of net NPAs
to total assets in ICICI Bank is showing a declining trend from 2001-02 (2.48 per
cent) to 2005-06 (0.42 per cent). From 2006-07 to 2008-09 the growth in the ratio of
net NPAs to total assets in the ICICI Bank increased significantly. In 2009-10 and
2010-1 1 h e said ratio declined.
The growth in the.ratio of gross NPAs to total assets in the Andhra Bank has
been declined gradually from year to year from 2.50 per cent in 2001-02 to 0.54 per
cent in 2009-10 and in 2010-llthe'said ratio of the above bank s increased. The
growth in the ratio of gross NPAs to total assets in ICICI Bank has declined from 4.82
per cent in 2001-02 to 0.88 percent in 2005-06. From 2006-07 (1.20 per cent) to 2009-
10 (2.61 per cent) the ratio of gross NPAs to total assets in ICICI Bank has inoreased
significantly. In 2010-1 1 the said ratio in the said Bank declined.
From the foregoing analysis one can infer that the ratio of gross NPAs to total
assets has declined gradually from year to year from 2001-02 to 2008-09 and became
constant in 2009-10. The ratio of net NPAs to total assets has also been showing a
declining trend for a considerable period of time and, thcfeak, it fluctuated whereas
the ratio of gross NPAs to tqtal assets in ICICI Bank has dm& for half of the
decade and in the next 'four years the ratio i n c r d . The ratio of ae4 NPAs to total

assets in ICICI Bank has also declined in the fint six years of the study period. It
increased in 2007-08 and declined gradually, thereafter, in three years.
The results of statistics reveal that the growth in the ratio of gross NPAs to
total assets and net NPAs to total assets in ICICI Bank is more significant than in
Andhra Bank because the value obtain& for CV is less for ICICI Bank. The CGR and
LGR for both the banks are negatp. Fig.7.3 still supports the data given in table 7.7.

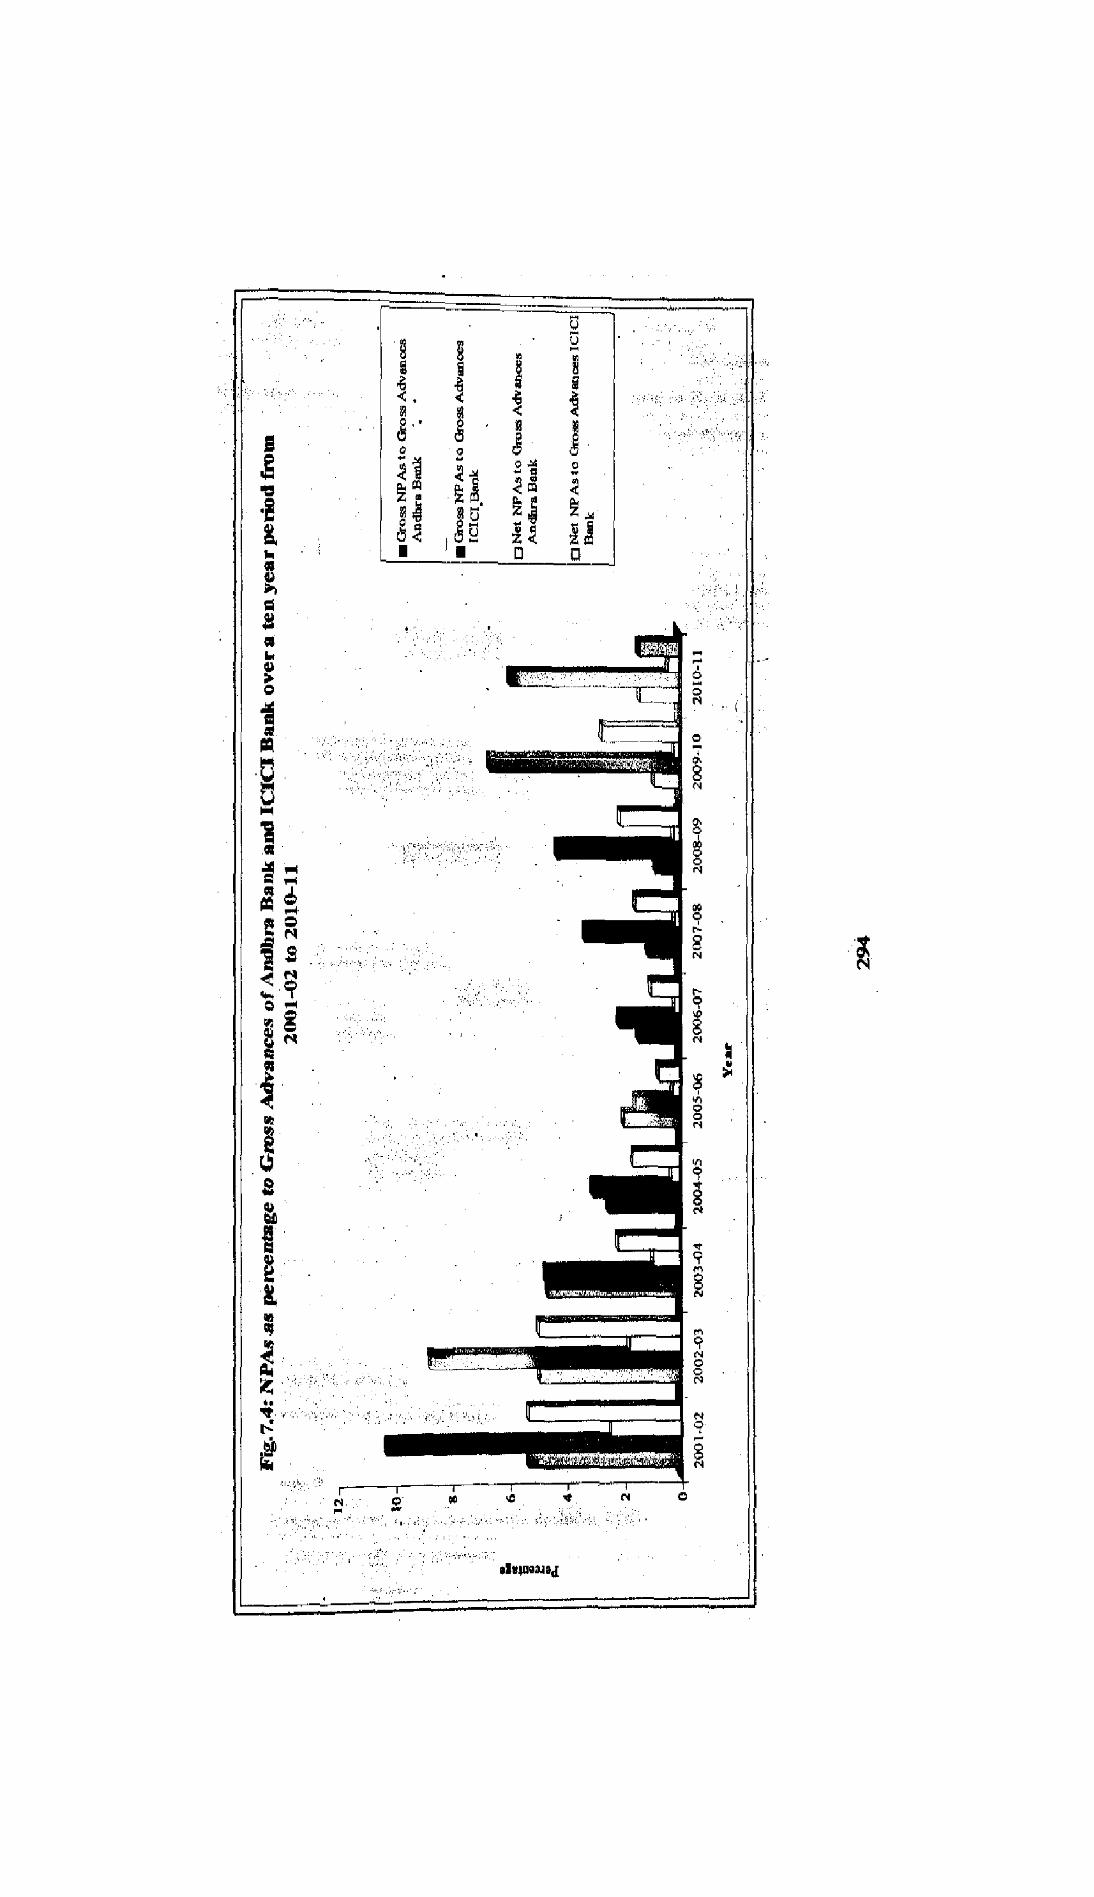
Table 7.8 NPAs as percentage to Gross Advances of Andhra Bank and ICICI Bank over a ten year period from
2001-02 to 2010-11
-: 1) lQlmnrai Reports of Andhra Bank sn& ICZCI Bank f?om 2001-02 to 2010-1 1. 2 ) R B L ~ o n T r e n d a n d P r o ~ o f ~ g i n India fium 2001-02 to20t0-11.
, , , , , , , " ' . . ' - ' . - , . , -. . , , . < , ,
,, , , . . . , . , , , , , ,
I . . - , . - . ,.1'.: . , -; -,, , / , , : - w , , ~ , . , , - , . , ,. . .
I . ' I ' m.; , . . , , . " ' . '
, , c ~ w w W ~ ~
. 'at N

Table 7.8 explens the gross NPAs, the ratio of gross NPAs to gross advances,
net NPAs, the ratio of net NPAs to gross advances and gross advanw over a period
of tkn years f h n 2001-02 to 2010-1 1. The analysis pertaining to gross advan* of
Andhra Bank and ICICI Babk reveals that the gross advances of Andhra Bank in
absolute terms have increased continuously from year to year, The gross advances in
2001-02 were Rs.9961.94 crore and have increased to Rs.72154.45 cros in 2010-11.
The gross advances of ICICI Bdnk have increased from year to year for a period of
seven years and they decreased in 2008-09. In 2009-10 and 2010-1 1 the gross
advances of ICICI Bank increased once again. The gross advances of ICICI Bank in
2001-02 were Rs.49000 crore and have increased to Rs.229892 crore in 2007-08. In
2008-09 the same decreased slight$;. In 2009-10 and 2010-11 they increased
significantly.
The ratio between gross NPAs to gross advances in Andhra Bank has
decreased gradually from year to year from 2001-02 to 2008-09. In 2001-02 the ratio
of gross NPAs to gross advances in Andhra Bank was 5.26 per cent and it has
decreased to 0.83 per cent in 2008-09. In 2009-10 and 2010-11 the said ratio
increased. The ratio between gross NPAs to gross advances in ICICI Bank has
decreased from 10.23 per cent in 2001-02 to 1.51 per cent in 2005-06. From 2006-07
to 2009-10 the said ratio increased from 2.08 per cent to 6,67 per cent rcspeotively. In
2010-11 the ratio between the gross NPAs to gross advances in ICICI Bank
decreased.
The growth in the ratio of net NPAs to gross advances in Andhra Bank has
decreased from 2,38 per cent in 2001-02 to 0.16 per cent in 2007-08. From 2008-09 to
2010-11 the ,growth in the said ratio has been fluctuating from year to year. The
growth in the ratio of net NPAs to gross advances in the ICICI Bank demased h m
5.27 p; cent in 2001-02 to 0.71 per cent in 2005-06. From 2006-07 to 2009-10 tho
said ratio in ICICI Bank has increased from year to year from 1.00 per cent to 2.70
per cent. In 2010-1 1 the ratio between net NPAs to gross advmceg decreased.
From the foregoing analysis it is understood that the ratio of gross
gross advances in Andhra Bat$ is showing a declining trend but in the
the study period the said ratio i n d . The growth
advances in Andhra Baak has also d~l insd from
295

period of time. In the recent past the growth in the said ratio shows a fluctuating trend.
The gross NPAs to gross advances ratio of ICICI Bank has declined from year to year
for a period of five years from 2001-02 to 2005-06. In the rest of the five years of the
study period for four years; the gross NPAs to gross advances ratio has increased
gradually from year to year. In the recent past the said ratio in ICICI Bank decreased.
The same trend has been observed even in the case of net NPAs to gross advances of
ICICI Bank.
For the time series data on gross NPAs to gross advances and net NPAs to
gross advances Mean, SD, CV, LGR, CGR are computed for the period from 200.1-02
to 201 0-1 1. I t is observed from the results obtained that there is a significant increase
in both the banks, Andhra Bank and ICICI Bank, with reference to gross NPAs to
gross advances and net NPAs to gross advances. The results of the LGR and CGR are
negative. The CV is less for ICICI Bank in both the cases viz., gross NPAs to gross
advances and net NPAs to gross advances. Fig.7.4 still supports the data given in
table 7.8.

REFERENCES
Amilan, S and Patimalam, K. "NPA Malaise in Indian Commercial Banksn,
Factors for you, August 2007, p.38.
Ramakrishnaiah, d and Chengalrayulu, P. "Non-performing assets in public
sector banks-an analysis", Banking Finance, Vol.XXV, No.2, February, 2012,
pp.5-6.
Vahsamma Antony, hon-performing assets: A menace to the banking
industry", southern economist, January, 2004, p.20.
Robert M, "Prudential Norms for Commercial Banks and Transparency in
Bank Accounts". Journal of Accounting and Finance, Vol. X, No.2, Sep temk
1996, P. 291.
Usha Arora D, "NPA management in the Indian Environment". The Banker
vol. 47, No. 2, April 2004-05, P. 27.
RBI monthly bulletin, October, 2007, pp.83-85.
Sundar K, "Profit Banking- Strategies and Implications", Banking Finance,
vol. XX, No.8, August 2007, Pp. 10-1 1.
Tirurnalaiah, G. "Performance Evaluation of Indian B& (Lead Bank)", Ph.D
Thesis, S.V.University, July 2009.
Noronha, M.R, "Non-performing Asset Management-key to robust banking
system", Banking Finance, VolXIX, No.8, August 2006, pp.5-6.
10. Gupta, V.K, "GA Management in Banks-the challenges ahead", strack
business of future, pnb instikte of information technology. April-Septanbar,
2006, Vol.11, No.2 & 3, p.12.
11. Vasam Anand Kumar, "Trend in Net NPAs in banking industry 1996-2005",
southem economist, February, 2006, p.15.
12. ~d .~a izanuddin and Mishra, R.K, "Non-performing assets in Indian Banks,
@H publishing corporation, New Delhi, 2012, pp.66-67.