Management of Mineral Bone Disease in Dialysis …nwrenalaudit.org/downloads/audit/Bone Chemistry...
46
Management of Mineral Bone Disease in Dialysis Patients Regional Clinical Audit Report February 2011 Authors: Dr Helen Eddington, Salford Royal Hospital Clinical Audit Lead Tracey Powell, Regional Renal Audit Coordinator, MRI Nora Kerigan, Specialist Nurse, Royal Preston Hospital Contact Address: NW Renal Audit Programme Renal Department Manchester Royal Infirmary Oxford Road Manchester M13 9WL Telephone Number: 0161 27 64224 Web Address: www.nwrenalaudit.org
Transcript of Management of Mineral Bone Disease in Dialysis …nwrenalaudit.org/downloads/audit/Bone Chemistry...
Management of Mineral Bone Disease in Dialysis Patients
Regional Clinical Audit Report February 2011
Authors: Dr Helen Eddington, Salford Royal Hospital Clinical Audit Lead Tracey Powell, Regional Renal Audit Coordinator, MRI Nora Kerigan, Specialist Nurse, Royal Preston Hospital Contact Address: NW Renal Audit Programme Renal Department Manchester Royal Infirmary Oxford Road Manchester M13 9WL Telephone Number: 0161 27 64224 Web Address: www.nwrenalaudit.org

NW Renal Audit Programme Management of bone mineral disease in dialysis patients
Version 1.0 February 2011 Page 1
CONTENTS
Contributors
2
Executive Summary
3
1. Introduction and Background
5
2. Aims and Objectives
5
3. Evidence Base
6
4. Standards
7
5. Methodology
8
6. Results Summary 6.1 Demographic
6.1.2 Diabetes Status 6.2.3 Transplant Status
6.2 Calcium 6.2.1 Results for RA standard for corrected calcium 6.2.2 Results for KDOQI standard for corrected calcium 6.2.3 Comparison with previous audit calcium results 6.2.4 Benchmarking local data against national data collected by the Renal
Registry 6.3 Phosphate
6.3.1 Results for RA standard for serum phosphate 6.3.2 Evaluation of change since the previous audit 6.3.3 Benchmarking local data against national data collected by the UK Renal
Registry 6.4 Calcium Phosphate Product 6.5 Parathyroid Hormone and incidence of parathyroidectomy
6.5.1 RA Standard for parathyroid hormone 6.5.2 Change since last report 6.5.3 Median/benchmarking 6.5.4 Patients undergoing parathyroidectomy
6.6 Percentage of patients meeting all Renal Association and KDOQI targets 6.7 Phosphate Binders
6.7.2 Change in use of binders since 2002 6.7.3 KDOQI Calcium load 6.7.4 Patients with high Calcium >2.5mmol/l
6.8 Alphacalcidol 6.9 Cinacalcet 6.10 10
th patient drug data 6.10.1 Dialysate used
6.11 Patient contact with dietetic service 6.12 Drug data recording
9
10 11
11 13 14
15
17 18
19 20
21 22 23 24 24 25 26 29 30 31 32
32 33 34
7. Discussion of Results 36 8. Conclusions 38 9. Recommendations 38
Appendix 1 Glossary of Terms and Abbreviations Appendix 2 Audit Plan Appendix 3 Data Collection Parameters Appendix 4 NW Region Unit Target ranges
NW Renal Audit Programme Management of bone mineral disease in dialysis patients
Version 1.0 February 2011 Page 2
CONTRIBUTORS
The following adult renal dialysis units took part in the bone chemistry audit:
� Aintree University Hospital
� Countess of Chester
� Manchester Royal Infirmary
o including satellite units at North Manchester General Hospital, Macclesfield ,
Prestwich, Tameside and Wythenshawe
� Royal Preston Hospital
o including satellite units - Accrington, Clifton Hospital - Blackpool, Westmoreland
Hospital - Kendal, Burnley, Chorley and Furness
� Salford Royal Hospital
o including satellite units at Bolton, Wigan and Rochdale
Data collection for the regional audits is generally undertaken within the individual units with
occasional direct assistance from NWRA audit staff. Data was collected by the following:
� Ros Adams, data collection for Salford Royal Hospital and facilitated data collection from
satellite units.
� Jovi Diaz, Rochdale Infirmary
� Christopher Goldsmith, data collection for Aintree and satellite units
� Dr Prasad Rajendran, SpR, data collection for Aintree and satellite units,
� Sak Kee Gee , North Manchester General Hospital
� Odette Holmes, Royal Bolton Hospital
� Nora Kerigan, Royal Preston Hospital and satellite units
� Michelle Marshall, Wigan
� Tracey Powell, data collection at Wythenshawe, Tameside, North Manchester General
Hospital, MRI PD, HD and HHD patients
� Diane Sanders, MRI PD patients
� Vivien Lloyd, Countess of Chester
� Abigail Price, Countess of Chester

NW Renal Audit Programme Management of bone mineral disease in dialysis patients
Version 1.0 February 2011 Page 3
EXECUTIVE SUMMARY
The total number of patients audited in 2009/2010 was 1703; this is compared to 1670 patients
in 2002. However we do not currently have data from Liverpool and some of its satellites
therefore this report only includes data available at time of completion of the report.
Serum Calcium:
Regionally 66.9% reached the renal association target of 2.2-2.5mmol/l and this percentage has
only minimally changed since 2002. A slight decrease since 2002 is seen in all the unit results
apart from MRI which has increased since 2002 (54.9%) and (60%) in 2009. However many
units in this region now have a laboratory lower limit of normal less than 2.2mmol/l and this may
explain the large proportion of patients with a low calcium according to targets.
The regional median for corrected calcium was below the renal registry England and Wales
median 2008 data for both haemodialysis and peritoneal dialysis patients.
Serum Phosphate:
Regionally 60.7% patients reached the target of 1.1-1.8mmol/l; this shows a slight improvement
from 59.9% from 2002. All units improved their phosphate control except Salford Royal Hospital
who fell from 66.8% within target in 2002 to 51.7% in 2009.
The regional median is comparable to the renal registry England and Wales median data from
2008, though a wide variation is seen in phosphate results.
Calcium and Phosphate product
Overall there is high achievement (84.1%) across the region of a calcium phosphate product
<4.8 with 70.7% achieving a product <4.2.
Parathyroid Hormone
Due to the differences in assay used across the region we have only analysed iPTH across the
region. As tighter guidelines were introduced between 2002 (<4x upper limit of normal) and
2009 (2-4x upper limit of normal) the percentage of patients reaching target has reduced
markedly to 35.4%. However the KDIGO guidelines have been released since this audit was
undertaken and if these were used 53.9% would reach target.
The median iPTH for the region is lower than the median iPTH for England and Wales renal
registry 2008 data; however it must be stressed that iPTH assays from different companies
cannot be compared accurately.
Parathyroidectomy
The data suggests that there has been a drop in the number of parathyroidectomies performed.
This could be due to the introduction of cinacalcet since the previous audit. It is important to
note that due to variations in recording this data is difficult to collect accurately.

NW Renal Audit Programme Management of bone mineral disease in dialysis patients
Version 1.0 February 2011 Page 4
Percentage reaching all 4 targets
A drop from 33% to 12% was seen in patients achieving all 4 renal association targets. This is
mainly due to the change of iPTH target between 2002 and 2009. There was an increase in
patients achieving all 4 KDOQI targets from 1.4% in 2002 to 7% in 2009.
Change in use of phosphate binders
As a region we are using much less calcium carbonate and more calcium free binders. Calcium
acetate use has increased in the region probably secondary to its lower calcium content and
price.
The use of phosphate binders varies widely across units. The 2 hubs with the best phosphate
control (A and RPH) use differing prescription strategies with <40% on calcium free binders at
RPH compared to >60% at A.
As a region 31% of patients with a serum calcium >2.5mmol/l were prescribed a calcium binder
As a region 14% of patients with a low calcium and high phosphate were not prescribed any
binder
As a region 50% of patients with an iPTH <2x upper limit of normal were prescribed vitamin D
(though this was not adjusted for previous parathyroidectomies).
Contact with Dietetic service
81% of patients within the region were seen by a dietician within the last 6 months. This varied
from 100% at A and COCH to 77% at SRH.

NW Renal Audit Programme Management of bone mineral disease in dialysis patients
Version 1.0 February 2011 Page 5
1.0 INTRODUCTION
Established in 1992, the North West Renal Audit Programme is a standards based programme
of continuous quality improvement through clinical audit. The programme is directed by the
North West Renal Audit Steering Group and the daily management carried out by the North
West Renal Audit Team with support from Renal Nurse Audit Facilitators.
2.0 AIMS AND OBJECTIVES
The aims and objectives for this audit include:
For whole dialysis population
� To measure achievement of the Renal Association standards and compliance with the
KDOQI guidelines for calcium, phosphate, calcium phosphate product and serum PTH.
� To assess compliance with the K/DOQI guideline for calcium load.
� To compare prescribing practice for phosphate binders and vitamin D
� To measure the incidence of parathyroidectomy
� To quantify the use of cinacalcet for the treatment of patients with secondary
hyperparathyroidism
� To compare the commercial machines and assays used by the hospital laboratories for the
measurements above.
For 10% sample of dialysis population
� To note the systems used to track drug information and assess the accuracy of these
systems.
� To quantify use of IV Vitamin D
� To compare dietetic contact between the units
Proposed Health Benefits
� To reduce the risk of renal bone disease
� To reduce the risk of hyperparathyroidism

NW Renal Audit Programme Management of bone mineral disease in dialysis patients
Version 1.0 February 2011 Page 6
3.0 EVIDENCE BASE
� Young EW, Albert JM, Satayathum S, Goodkin DA, Pisoni RL, Akiba T, Akizawa T,
Kurokawa K, Bommer J, Piera L, Port FK. Predictors and consequences of altered mineral
metabolism: the Dialysis Outcomes and Practice Patterns Study. Kidney Int 2005 Mar;
67(3):1179-87.
� Block GA, Klassen PS, Lazarus JM, Ofsthun N, Lowrie EG, Chertow GM. Mineral
metabolism, mortality and morbidity in maintenance hemodialysis. J Am Soc Nephrol 2004
Aug; 15(8):2208-182).
� London GM; Guerin AP; Marchais SJ; Metivier F; Pannier B; Adda H. Arterial media
calcification in end-stage renal disease: impact on all-cause and cardiovascular mortality.
Nephrol Dial Transplant 2003 Sep; 18(9):1731-40.
� Lepage R, Roy L, Brossard J-H, Rousseau L, Dorais C, Lazue C, D’Amour P. A non-(1–84)
circulating parathyroid hormone (PTH) fragment interferes significantly with intact PTH
commercial assay measurements in uremic samples. Clinical Chemistry 1998; 44:805-
809.
� Block, GA, Hulbert-Shearon, TE, Levin, NW, Port, FK. Association of serum phosphorus
and calcium phosphate product with mortality risk in chronic hemodialysis patients: A
national study. Am J Kidney Dis 1998; 31:607.
� The importance of dietary calcium and phosphorous in the secondary hyperparathyroidism
of patients with early renal failure. Am J Kidney Dis 1997; 29:496-502.
� Foley RN, Parfrey PS, Harnett JD, Kent GM, Hu L, O'Dea R, Murray DC, Narre PE.
Hypocalcaemia, Morbidity and Mortality in End-Stage Renal Disease. Am J Nephrol 1996:
16: 386-393.
� Dawson-Hughes B, Heaney RP, Holick MF, Lips P, Meunier PJ, Vieth R. Estimates of
optimal vitamin D status. Osteoporosis Int 2005; 16: 713-716.
� Bischoff-Ferrari HA, Willett WC, Wong JB, Giovannucci E, Dietrich T, Dawson-Hughes B.
Fracture prevention with vitamin D supplementation: a meta-analysis of randomized
controlled trials. JAMA 2005; 293(18): 2257-2264.
� Zitterman A. Vitamin D in preventive medicine: are we ignoring the evidence? Br J
Nutr 2003; 89: 552-572.
� Lips Vitamin D Deficiency and secondary hyperparathyroidism in the elderly:
consequences for bone loss and fractures and therapeutic implications. Endocr Rev 2001;
22: 477-501. Tsuchihashi K, Takizawa H, Torii T et al.
� Hypoparathyroidism potentiates cardiovascular complications through disturbed calcium
metabolism: possible risk of vitamin D(3) analog administration in dialysis patients with
end-stage renal disease. Nephron 2000; 84:13–20.
� Thomas MK, Lloyd-Jones DM, Thadhani RI, Shaw AC, Deraska DJ, Kitch BT, Vamvakas
EC, Dick IM, Prince RL, Finkelstein JS: Hypovitaminosis D in medical inpatients. N Engl J
Med 1998; 338:777-783.
� Bouillon RA, Auwerx JH, Lissens WD, Pelemans WK: Vitamin D status in the elderly:
Seasonal substrate deficiency causes 1,25-dihydroxycholecalciferol deficiency. Am J Clin
Nutr 1987; 45:755-763.

NW Renal Audit Programme Management of bone mineral disease in dialysis patients
Version 1.0 February 2011 Page 7
4.0 STANDARDS
Regional Association Clinical Practice Guidelines. Clinical Practice Guidelines
Committee Renal Association Clinical Practice Guidelines 4th Edition 2007
www.renal.org/guidelines
Phosphate Serum phosphate should be maintained between 1.1 and
1.8mmol/l
Calcium Serum calcium, adjusted for albumin concentration should
be maintained within the normal reference range for the
laboratory used and ideally between 2.2 and 2.5mmol/L
Serum calcium phosphate product The serum albumin corrected calcium phosphate product
should be kept below 4.8 mmol2/L2 and ideally below 4.2
mmol2/L2
Serum parathyroid hormone The target range for parathyroid hormone measured using
an intact PTH assay should be between 2 and 4 times the
upper limit of normal for the intact PTH assay used. The
same target range should apply when using the whole
molecule PTH assay.
K/DOQI Clinical Practice Guidelines for Bone Metabolism and Disease in Chronic Kidney
Disease www.kidney.org/professionals/kdoqi/guidelines_bone/index.htm
Phosphate 1.13 – 1.78 mmol/l
Calcium 2.10 – 2.37 mmol/l
Calcium Phosphate Product CAXP should be less than 4.4 ng/l
Serum parathyroid hormone iPTH concentration in range 150 – 300 ng/l

NW Renal Audit Programme Management of bone mineral disease in dialysis patients
Version 1.0 February 2011 Page 8
5.0 METHODOLOGY
The patient population audited included patients in the North West Region who had been
dialysing for a least 3 months at time of data collection.
For whole dialysis population
� For HD and PD patients serum albumin corrected calcium, phosphate and iPTH was
collected from the monthly blood test that includes iPTH measurement in either November,
October or September 2009 ensuring calcium, phosphate and iPTH are taken from the
same blood test. If no iPTH was available in this time frame the most recent corrected
calcium and phosphate (HD and PD patients) was recorded.
� If iPTH was not collected with monthly bloods within the time frame above then the iPTH
result was taken from the most recent iPTH measurement taken in the past 6 months. If
the results were not available, the patient was excluded from that part of the analysis.
� Use of phosphate binders and vitamin D and the prescribed dose, and the source of this
information were recorded.
� Use of cinacalcet was recorded.
� The number of patients who had a parathyroidectomy was recorded.
� The machines and assays used by the hospital laboratories to measure the biochemical
variables were recorded.
For 10% sample of dialysis population
A 10% sample of dialysis population was selected by taking every 10th patient on a list of
patients ordered by hospital number, at each unit. Additional information was collected on
these patients:
� IV Vitamin D and dialysate used recorded from the hospital drug cardex.
� The hospital systems used to track drug information was recorded and a GP record of the
patients’ drug prescription requested.
� Contact with dietitians was recorded from dietetic records.

NW Renal Audit Programme Management of bone mineral disease in dialysis patients
Version 1.0 February 2011 Page 9
6.0 RESULTS SUMMARY
6.1 Demographics
6.1.1 The total number of data sets for this audit was 1703. A breakdown of the numbers is
given in Figure 6.1 below (Please note there are no results for RLH for 2009). The
gender split is generally around 60% male to 40% female as shown in Figure 6.2.
Figure 6.1: Number of patient data sets for 2002 and 2009 (individual units).
0
50
100
150
200
250
300
A H
D
CO
CH
MR
I -
HD
MR
I -
HH
D
MR
I -
PD
Ma
ccle
sfie
ld
NM
GH
Ta
me
sid
e
Wyth
ensh
aw
e
RLH
RL
H P
D
Bro
ad
gre
en
Wa
terl
oo
Wa
rrin
gto
n
Wh
isto
n
RP
H H
D
RP
H H
HD
RP
H P
D
Accrin
gto
n
Bla
ckp
ool
Bu
rnle
y
Ch
orle
y
Fu
rness
Ke
nd
al
SR
H H
D
SR
H H
HD
SR
H P
D
Bo
lto
n
Ro
ch
dale
Wig
an
A AP MRI RLH RPH SRH
No. of patients (2002) No. of patients (2009)
Figure 6.2: Gender split (2009)
0%
10%
20%
30%
40%
50%
60%
70%
80%
90%
100%
A COCH MRI RPH SRH Region
Females
Males

NW Renal Audit Programme Management of bone mineral disease in dialysis patients
Version 1.0 February 2011 Page 10
There are regional differences in the recording of ethnicity between individual units
(Figure 6.3). As a region the breakdown is white (70.5%), asian (13.4%), black (3.7%),
chinese, mixed and other (2.4%) and not stated (9.9%).
Figure 6.3: Ethnicity breakdown (2009)
0%
10%
20%
30%
40%
50%
60%
70%
80%
90%
100%
A COCH MRI RPH SRH Region
White Asian Black Chinese Mixed Other Not stated
6.1.2 Diabetic status
Regionally just over 30% of dialysis patients are diabetic (Figure 6.4). There is some
variation between the units with 27% at MRI and up to 40% at A and COCH (this may
reflect differences in methods of recording this data).
Figure 6.4: Diabetic status of patients (2009).
52 30
134 159172
547
79 45
361373
2731131
10 3 9 22
0%
10%
20%
30%
40%
50%
60%
70%
80%
90%
100%
A COCH MRI RPH SRH Region
Diabetes No diabetes Unknown

NW Renal Audit Programme Management of bone mineral disease in dialysis patients
Version 1.0 February 2011 Page 11
6.1.3 Transplant Status
Transplant status data was not provided by A and COCH. The percentage of patients
who have received a transplant within the region is 9% (Figure 6.5). There is variation
regionally with the highest of 15% at MRI and the lowest of 4% at SRH (again this may
be a reflection on the way data has been collected and details are recorded at individual
units).
Figure 6.5: Percentage of patients who have received a previous kidney transplant. (2009)
0%
2%
4%
6%
8%
10%
12%
14%
16%
MRI RPH SRH Region
6.2 Serum Calcium (corrected for albumin)
6.2.1 2009 Results
Serum calcium, adjusted for albumin concentration, should be between 2.2 and
2.5mmol/l, in HD and PD patients. Regionally 66.9% of patients met the RA standard for
corrected calcium. In the hub units Aintree (77.1%) had the highest proportion of
patients meeting the standard and MRI the lowest (53.1%). In the satellite units COCH
had the highest proportion of patients meeting the standard (89.3%) and Chorley the
lowest (54.8%). Regionally, there was little difference between the number of HD/HHD
patients (61.3%) and the number of PD patients (60.9%) who met the standard.
However, if this is analysed further taking HD and Home HD patients separately there is
greater variation in the calcium control with HD patients 68%, PD patients (61%) and
HHD patients (62%).
The lower proportions of patients meeting the RA standard may be partly explained by
differing normal ranges of serum calcium in each hospital. MRI and SRFT have a lower

NW Renal Audit Programme Management of bone mineral disease in dialysis patients
Version 1.0 February 2011 Page 12
5 2
130
34
1423 51
922
14
24
05
90
9 6
22
433
10167
155
1334
51
53135
4457
50
34
5
49
164
5449
35
1150
25
67
7
9
3 2 8 4 69
4
3
2 17 3 50
120
0%
20%
40%
60%
80%
100%
A
CO
CH
MR
I
Maccle
sfie
ld
NM
GH
Tam
esid
e
Wyth
enshaw
e
RP
H
Accringto
n
Bla
ckpool
Burn
ley
Chorley
Furn
ess
Kendal
SR
H
Bolto
n
Rochdale
Wig
an
Regio
n
E,W
& N
I
(2008)
A AP MRI RPH SRH
No. of patients w ith calcium < 2.2 No. w ithin guideline range of 2.2 - 2.5 No. of patients w ith calcium >2.5
normal range of calcium of 2.1mmol/l and RPH of 2.15mmol/l. This may explain the
larger proportion of patients with a lower calcium (Figure 6.6) at these centres.
Figure 6.6: Graph showing percentage of patients within RA guideline range for calcium
(2.2 - 2.5mmol/L) for regional units.
5 2
173125 127 432
10167
305
370296 1139
256 27 40 31 129
0%
10%
20%
30%
40%
50%
60%
70%
80%
90%
100%
A COCH MRI RPH SRH Region
No. of patients with calcium < 2.2 No. within guideline range of 2.2 - 2.5
No. of patients with calcium >2.5
Figure 6.7: Graph showing percentage of patient within RA guideline range for calcium
(2.2 - 2.5mmol/L) ( individual units).
NW Renal Audit Programme Management of bone mineral disease in dialysis patients
Version 1.0 February 2011 Page 13
Figure 6.8: Graph showing percentage of patients within range for calcium (2.2 -
2.5mmol/L) for individual units.
Chart 2 % patients within standrd for Ca
0.0
10.0
20.0
30.0
40.0
50.0
60.0
70.0
80.0
90.0
100.0
A
CO
CH
MR
I
Maccle
sfie
ld
NM
GH
Tam
esid
e
Wyth
enshaw
e
RP
H
Accringto
n
Bla
ckpool
Burn
ley
Chorley
Furn
ess
Kendal
SR
H
Bolto
n
Rochdale
Wig
an
Regio
n
6.2.2 KDOQI standard for Calcium
Regionally over 50% of patients have results within the KDOQI calcium target; with
variation between individual units with the highest of 70.2% at Wigan and the lowest of
25% at Furness (Figure 6.9).
Figure 6.9: Percentage of patients reaching KDOQI guideline calcium target of 2.1 - 2.37
mmol/L
% of patients reaching KDOQI guideline 1.1 - 2.37 mmol/L
0%
10%
20%
30%
40%
50%
60%
70%
80%
A
CO
CH
MR
I
Maccle
sfield
NM
GH
Tam
esid
e
Wyth
enshaw
e
RP
H
Accringto
n
Bla
ckpool
Burn
ley
Chorley
Furn
ess
Kendal
SR
H
Bolton
Rochdale
Wig
an
Regio
n

NW Renal Audit Programme Management of bone mineral disease in dialysis patients
Version 1.0 February 2011 Page 14
Despite the RA targets being broader than KDOQI a few units, namely MRI, Chorley and
Wigan had a greater percentage of patients within the KDOQI target.
Figure 6.10: Comparison of patients reaching RA Standard and KDOQI guidelines.
0%
10%
20%
30%
40%
50%
60%
70%
80%
90%
100%
A
CO
CH
MR
I
Maccle
sfie
ld
NM
GH
Tam
esid
e
Wyth
ens
haw
e
RP
H
Accri
ngto
n
Bla
ckpool
Burn
ley
Chorley
Furn
ess
Kenda
l
SR
H
Bolto
n
Ro
chdale
Wig
an
Regio
n
Percentage within guideline range of 2.2 - 2.5 (2009)
% of patients reaching KDOQI guideline 2.1 - 2.37 mmol/L
6.2.3 Comparison with previous Calcium results
Regionally the proportion of patients meeting the RA standard for corrected calcium
increased between 2000 (63%) and 2002 (67.9%) and decreased slightly in 2009
(66.9%) A slight decrease since 2002 is seen in all the unit results apart from MRI which
has increased since 2002 (54.9%) and (60%) in 2009 (Figure 6.11)
Regionally, the proportion of HD/HHD patients meeting the 2002 RA standard increased
between 2000 (60%) and 2002 (69%) but reduced significantly in 2009/2010 (61.3%).
This is likely to be a reflection of a change in the standard where the guideline range has
narrowed slightly from 2.2 - 2.6mmol/L to 2.2 - 2.5mmol/L. The biochemical lower level of
normal has also changed in some hospitals to 2.1mmol/l leading to patients with a
‘normal’ calcium not reaching the renal association standards.
Regionally, there was little change in the proportion of PD patients meeting the 2002 RA
standard between 2000 (67%) and 2002 (66%); however there has been a significant
reduction meeting the standard in 2009/2010 (60.9%). However, this was not the case
separately. Between 2000 and 2002 and 2009, the proportion decreased at MRI (77%
to 56% to 52%) but the proportion increased at RPH between 2000 and 2002 (47% to
67%) but reduced in 2009/2010 (60%), SRH (60% to 77% between 2000 and 2002 but
reduced again in 2009/2019 -60.7%).

NW Renal Audit Programme Management of bone mineral disease in dialysis patients
Version 1.0 February 2011 Page 15
Figure 6.11: Graph showing percentage of patients meeting RA standard for corrected
calcium in 2002 and 2009.
0%
10%
20%
30%
40%
50%
60%
70%
80%
MRI RPH SRH Region
-2002 -2009
Figure 6.12 Percentage of patients within normal calcium range for individual units.
0%
10%
20%
30%
40%
50%
60%
70%
80%
90%
100%
A (2.18 -
2.62)
COCH (2.1 -
2.7)
MRI (2.1 -
2.55)
RPH (2.15 -
2.55
SRH (2.1 -
2.6mmol/L)
Region
6.2.4 Benchmarking local data against national data collected by the UK Renal Registry
There is variation between all the units; but all medians fall within the guideline range of
2.2 - 2.5 mmol/L (Figure 6.13) apart from Furness which is just over the target at 2.56
mmol/L.

NW Renal Audit Programme Management of bone mineral disease in dialysis patients
Version 1.0 February 2011 Page 16
Figure 6.13: Median corrected calcium in dialysis patients (2009)
1
1.5
2
2.5
3
3.5
A
CO
CH
MR
I
Maccle
sfield
NM
GH
Tam
esid
e
Wyth
enshaw
e
RP
H
Accringto
n
Bla
ckpool
Burn
ley
Chorley
Furn
ess
Kendal
SR
H
Bolton
Rochdale
Wig
an
Regio
n
Calcium (Lowest)
Calcium Highest)
Median Calcium
The regional median for corrected calcium for HD patients was 2.31 mmol/L (Renal
Registry data for 2008 was 2.35 mmol/L); the regional median corrected calcium for PD
patients was 2.31 (Renal Registry data for PD patients in 2008 for England, Wales and
NI was 2.39) (Figure 6.14).
Figure 6.14: Median corrected calcium for North West Regional HD and PD patients (2009)
compared to Renal Registry 2008 data for HD and PD patients.
11.11.21.31.41.51.61.71.81.9
22.12.22.32.42.52.62.72.82.9
33.13.23.33.43.5
All PD All HD + HHD ALL REGION E,W & NI (2008) HD E,W &NI (2008) PD
Calcium (Lowest) Calcium Highest) Median Calcium

NW Renal Audit Programme Management of bone mineral disease in dialysis patients
Version 1.0 February 2011 Page 17
6.3 Phosphate
6.3.1 Results for RA standard for serum phosphate
Regionally 61.1% of patients met the RA standard for phosphate of 1.1 to 1.8 mmol/L.
In the hub units Aintree had the highest proportion of patients meeting the standard
(67.9%) and SRH the lowest (51.7%) (Figure 6.15). In the satellite units Furness (a RPH
satellite) had the highest proportion of patients meeting the standard (100%) and Bolton
(an SRH satellite) the lowest (53%) (Figure 6.16).
Figure 6.15: Percentage reaching RA standard for phosphate 1.1 to 1.8 mmol/L
0%
10%
20%
30%
40%
50%
60%
70%
80%
A COCH MRI RPH SRH Region
Figure 6.16: Percentage reaching RA standard for phosphate 1.1 to 1.8 mmol/L (individual units
0%
10%
20%
30%
40%
50%
60%
70%
80%
90%
100%
A
CO
CH
MR
I
Maccle
sfie
ld
NM
GH
Tam
esid
e
Wyth
enshaw
e
RP
H
Accringto
n
Bla
ckpool
Burn
ley
Chorley
Furn
ess
Kendal
SR
H
Bolto
n
Rochdale
Wig
an
Regio
n

NW Renal Audit Programme Management of bone mineral disease in dialysis patients
Version 1.0 February 2011 Page 18
Regionally, there was little difference between the number of HD patients (60.7%) and
the number of PD patients (60.6%) who met the standard (Figure 6.16)
Figure 6.17: Percentage of HD and PD patients achieving target for phosphate (2000, 2002
and 2009).
6.3.2 Evaluation of change since the previous audit
Generally there has been an increase in patients reaching targets in all units accept for
SRH where the percentage has decreased from 66.8% in 2002 to 51.7% in 2009
Regionally the proportion of patients meeting the RA standard for phosphate has
continued to increase since 2000; 56% in 2000, 59.9% in 2002 and 60.7% in 2009
(Figure 6.16).
0%
10%
20%
30%
40%
50%
60%
70%
80%
Aintree
Arrowe MRI RPH SRH Region MRI RPH SRH Region
Percentage patients - 1.1 to 1.8 (2000) Percentage patients - 1.1 to 1.8 (2002) % of patients - 1.1 to 1.8 (2009)
Haemodialysis Patients Peritoneal Dialysis Patients

NW Renal Audit Programme Management of bone mineral disease in dialysis patients
Version 1.0 February 2011 Page 19
Figure 6.18: Percentage of patients achieving target for phosphate in 2002 and 2009.
0%
10%
20%
30%
40%
50%
60%
70%
80%
A COCH MRI RPH SRH Region
Percentage patients - 1.1 to 1.8 (2002)
% of patients - 1.1 to 1.8 (2009)
6.3.3 Benchmarking local data against national data collected by the UK Renal Registry
Regionally and individually all units median phosphate fall within the guidelines of the
Renal Association (1.1. to 1.8 mmol/L); there are quite large variations in the range of
figures (Figure 6.19)
Figure 6.19: Median phosphate for NW Region units (2009).
0
0.2
0.4
0.6
0.8
1
1.2
1.4
1.6
1.8
2
2.2
2.4
2.6
2.8
3
3.2
3.4
3.6
3.8
4
4.2
4.4
A
CO
CH
MR
I
Maccle
sfield
NM
GH
Tam
esid
e
Wyth
enshaw
e
RP
H
Accringto
n
Bla
ckpool
Burn
ley
Chorley
Furn
ess
Kendal
SR
H
Bolton
Rochdale
Wig
an
Regio
n

NW Renal Audit Programme Management of bone mineral disease in dialysis patients
Version 1.0 February 2011 Page 20
Figure 6.20: Median phosphate for PD, HD, all NW Region (2009) compared to Renal
Registry (2008) data for HD and PD patients
0.000.200.400.600.801.001.201.401.601.802.002.202.402.602.803.003.203.403.603.804.004.204.404.60
All PD All HD + HHD REGION E, W & NI (2008
data) HD
E, W & NI (2008
data) PD
Phosphate (lowest) Phosphate (highest) Median Phosphate
6.4 Calcium Phosphate product
Regionally 84.1% of dialysis patients meet the Renal Registry target of <4.8 and 70.7%
a target of <4.2 (Figure 6.21). Achievement of the <4.8 target is marginally better in HD
patients (84.4%) then PD patients (82.45); this is true for the <4.2 ng/L target also with
HD patients with 71.1% and PD patients with 68.5% meeting targets. As a region 76.2%
of patient results meet the KDOQI target of < 4.4 ng/L with HD patients again marginally
better than PD with 76.4% (HD) compared to 75.4% (PD)
Figure 6.21: Calcium Phosphate product
0%
10%
20%
30%
40%
50%
60%
70%
80%
90%
100%
A AP MRI RPH SRH Region
Percentage patients below target (4.8) Percentageof patients above 4.8 Percentage of patients below 4.2

NW Renal Audit Programme Management of bone mineral disease in dialysis patients
Version 1.0 February 2011 Page 21
6.5 Parathyroid hormone and incidence of parathyroidectomy
6.5.1 RA Standard for parathyroid hormone
Units use different biochemistry laboratories and consequently different assays. To
analyse the data regionally, the RA standard was therefore interpreted on a regional
basis.
Regionally 26.1%% of patients met the regional interpretation of the RA standard for
PTH (Figure 6.22). In the hub units RPH (33%) had the highest proportion of patients
meeting the standard and both A and MRI had the lowest at 22.9%. In the satellite units
Furness (a satellite of RPH) had the highest proportion of patients meeting the standard
with 50% and Tameside (a satellite of MRI) the lowest with14.7% (Table 1, Figure 6.23).
Table 1: Assays for individual NW Region units together with the percentage of patients
reaching Renal Association target. Grouped Assay Unit Upper
Limit of
PTH assay
2x PTH
assay
4x PTH
assay
9x PTH assay Percentage
of patients 2x
- 4x
Abbott architect Bolton 70 140 280 630 31.8
Advia centaur Blackpool 73 146 292 657 22.4
Chester (AP) 66 132 264 594 34.7 Beckman
Tameside 66 132 264 594 14.7
A 65 130 260 585 22.9
Accrington 65 130 260 585 26.3
Burnley 65 130 260 585 34.2
Immulite
Macclesfield 65 130 260 585 43.5
Chorley 65 130 260 585 24.2
Furness 66 132 264 594 50.0
Kendal 66 132 264 594 30.4
MRI 60 120 240 540 22.9
NMGH 65 130 260 585 25.5
Rochdale 65 130 260 585 16.7
RPH 65 130 260 585 33.0
SRH 65 130 260 585 24.0
Wigan 65 130 260 585 29.8
Roche
Wythenshawe 65 130 260 585 23.1

NW Renal Audit Programme Management of bone mineral disease in dialysis patients
Version 1.0 February 2011 Page 22
Figure 6.22 : Graph showing percentages of patients within iPTH ranges <2x, 2x - 4x, 4x - 9x, >9x
49
16 95
142 130432
30
26
117
159 113445
2525
162
133 128473
26
8
111
8079
304
123 21
4 49
0%
10%
20%
30%
40%
50%
60%
70%
80%
90%
100%
A COCH MRI RPH SRH Region
No. of patients < 2x No. of patients 2x - 4x No. of patients within 4x - 9x (KDIGO) No. of patients > 9x No. patients missing results
Figure 6.23: Patients within target (x2,x4)
0%
5%
10%
15%
20%
25%
30%
35%
40%
45%
50%
A
CO
CH
MR
I
Maccle
sfie
ld
NM
GH
Tam
esid
e
Wyth
enshaw
e
RP
H
Accringto
n
Bla
ckpool
Burn
ley
Chorley
Furn
ess
Kendal
SR
H
Bolto
n
Rochdale
Wig
an
Regio
n
6.5.2 Change since last report
Regionally, there has been a significant decrease in the proportion of patients meeting
the audit standard for iPTH since 2002 (33% to 26.1%) though in 2002 the target was
<x4 normal range compared with the current target of 2-4x normal range.
� 2000 (33%)
� 2002 (33%)
� 2009 (26.1%)

NW Renal Audit Programme Management of bone mineral disease in dialysis patients
Version 1.0 February 2011 Page 23
6.5.3 Median/benchmarking
The regional median iPTH for HD patients (193.5pgm/ml) was less than the UK Renal
Registry median for HD dialysis patients in England and Wales of 244.75pgm/ml (pg/ml
x 0.105 = pmol/l). The regional median iPTH for PD patients (246 pgm/ml) was less than
the UK Renal Registry median for PD dialysis patients in England and Wales 249.52
pgm/ml (pg/ml x 0.105 = pmol/l).
Figure 6.24: Median PTH for NW Region Units 2009/2010
0
100
200
300
400
500
600
A COCH MRI RPH SRH Region
1st Quartile Upper Quartile iPTH Median
Figure 6.25: Median iPTH for individual NW Region units
0
100
200
300
400
500
600
700
800
1st Quartile Upper Quartile iPTH Median

NW Renal Audit Programme Management of bone mineral disease in dialysis patients
Version 1.0 February 2011 Page 24
0
5
10
15
20
25
30
A COCH MRI RLH RPH SRH Region
% of patients with parathryoidectomy (2002)
% of patients with parathryoidectomy (2009)
6.5.4 Patients undergoing parathyroidectomy
There is a significant difference in the number of patients undergoing parathyroidectomy
since 2002 (14.6%) and only 6.3% in 2009. This may be attributable to difficulties in
obtaining the data from patients’ notes and IT systems or may reflect better clinical
management of bone mineral disease.
Figure 6.26: Comparison of number of patients undergoing parathyroidectomy in 2002 and 2009.
6.6 Percentage of patients meeting all Renal Association and KDOQI targets
There has been a reduction from 33% of patients reaching all four targets in 2002 to
12% in 2009. The main difference is the percentage reaching iPTH targets where there
has been a significant decrease since 2002 (72% to 26%).

NW Renal Audit Programme Management of bone mineral disease in dialysis patients
Version 1.0 February 2011 Page 25
Figure 6.27: Percentage of patients meeting Renal Association targets
0%
10%
20%
30%
40%
50%
60%
70%
80%
90%
Calcium Phosphate iPTH Calcium Phosphate
product
All four
Percentage reaching target (2002) Percentage reaching target (2009)
The KDOQI targets show a different story with a increase in percentage of patients
meeting all four KDOQI targets from 1.4% in 2002 to 7% in 2009 (Figure 6.28)
Figure 6.28: Percentage of patients meeting KDOQI targets
0%
10%
20%
30%
40%
50%
60%
70%
80%
90%
Calcium Phosphate iPTH Calcium Phosphate
product
All four
Percentage reaching target (2002) Percentage reaching target (2009)
6.7 Phosphate binders
6.7.1 Regionally the most commonly prescribed binder is sevelamer hydrochoride (33.1%);
more or less equal amounts of calcium carbonate (24%), calcium acetate (20%) and
lanthanum carbonate (20%) are prescribed and very little aluminium hydroxide (0.9%)
(Figure 6.29).

NW Renal Audit Programme Management of bone mineral disease in dialysis patients
Version 1.0 February 2011 Page 26
The highest number of patients prescribed calcium carbonate binders are at MRI with
44.6% and the lowest at RPH with 12.5 patients prescribed calcium carbonate. The
highest prescribed calcium acetate is at RPH and none is prescribed at Countess of
Chester. COCH prescribed Sevelamer hydrochoride to the highest percentage of
patients (56%) and Preston the lowest percentage at 20.7%. All units prescribe
lanthanum carbonate, the highest number of patients at COCH and the lowest number at
SRH. The prescribing of aluminium hydroxide is low within the region (highest at COCH
with 5.3% and lowest at MRI with 0.2%). The prescription of the most expensive
medications does not necessarily reflect better phosphate control.
Figure 6.29: Percentage of patients on phosphate binders
6.7.2 Change in use of binders since 2002
There has been a significant increase in the number of patients prescribed phosphate
binders since the last audit data of 2002. Regionally 60.3% were prescribed binders in
2000, 61.5% in 2002 and 80.7% prescribed binders in 2009.
0%
10%
20%
30%
40%
50%
60%
A COCH MRI RPH SRH Region
% Patients on calcium carbonate (2009)
% patients on Calcium Acetate (2009)
% Patients on sevelamar (2009)
% Patients on lanthanum carbonate (Fosrenol) (2009)
% Patients on aluminium hydroxide (2009)
Percentage of patients reaching RA Target for phosphate
67% 60% 59% 67% 54% 61%

NW Renal Audit Programme Management of bone mineral disease in dialysis patients
Version 1.0 February 2011 Page 27
Figure 6.30: Change in use of phosphate binders (2000, 2002 and 2009)
0
10
20
30
40
50
60
70
80
90
100
MRI RPH SRH Region
No. of patients on binder (2000) No. of patients on binder (2002) % patients on binder (2009)
Figure 6.31: Change in use of calcium carbonate binder (2002 and 2009).
0.0
10.0
20.0
30.0
40.0
50.0
60.0
70.0
MRI RPH SRH Region
% Patients on calcium carbonate (2002) % Patients on calcium carbonate (2009)
The reduction in the prescribing of calcium carbonate binders is probably a reflection of
the combination of increasing awareness of higher oral calcium intake and its
association with calcification and other morbidity. As calcium acetate has less calcium
and yet is a similar price this may also explain its increase in use. The highest increase
in use has been seen with Sevelamer hydrochloride. This again is partly explained by
the increasing data regarding high calcium intake and hypercalcaemia. Lanthanum was
not available in 2002 so no comparison can be made.
NW Renal Audit Programme Management of bone mineral disease in dialysis patients
Version 1.0 February 2011 Page 28
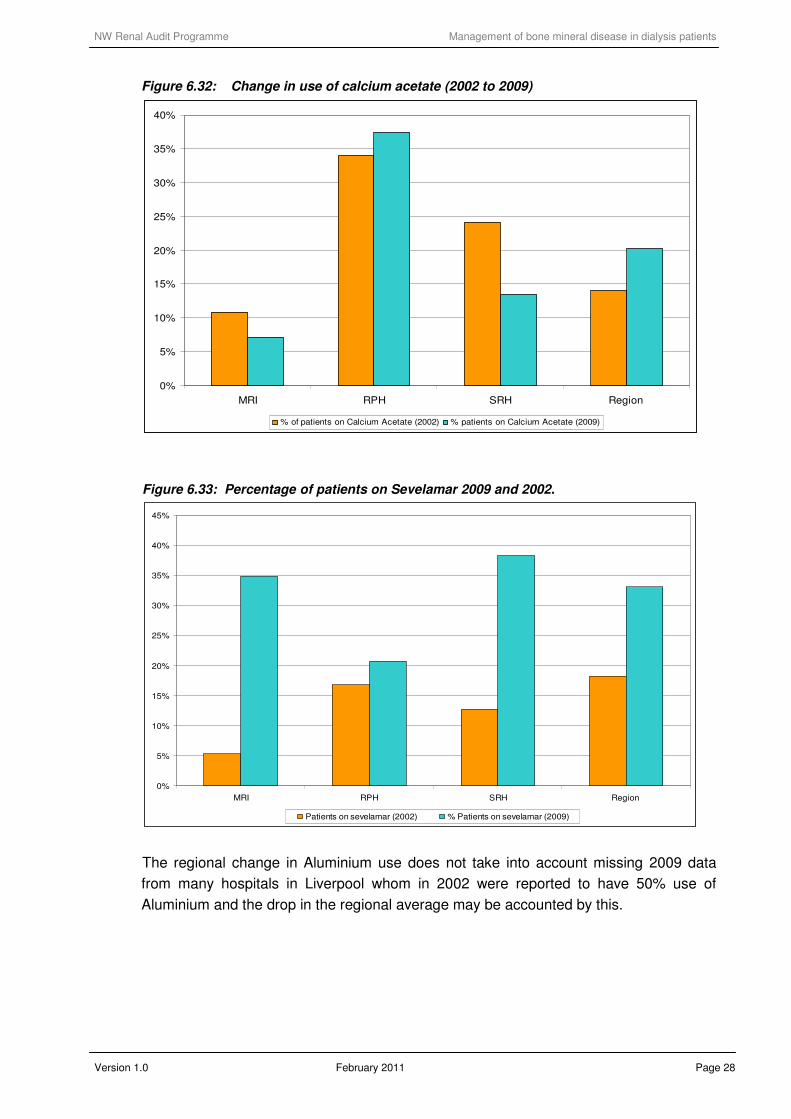
Figure 6.32: Change in use of calcium acetate (2002 to 2009)
0%
5%
10%
15%
20%
25%
30%
35%
40%
MRI RPH SRH Region
% of patients on Calcium Acetate (2002) % patients on Calcium Acetate (2009)
Figure 6.33: Percentage of patients on Sevelamar 2009 and 2002.
0%
5%
10%
15%
20%
25%
30%
35%
40%
45%
MRI RPH SRH Region
Patients on sevelamar (2002) % Patients on sevelamar (2009)
The regional change in Aluminium use does not take into account missing 2009 data
from many hospitals in Liverpool whom in 2002 were reported to have 50% use of
Aluminium and the drop in the regional average may be accounted by this.

NW Renal Audit Programme Management of bone mineral disease in dialysis patients
Version 1.0 February 2011 Page 29
Figure 6.34: Percentage of patients on aluminium hydroxide 2009 and 2002.
0%
5%
10%
15%
20%
25%
MRI RPH SRH Region
Patients on aluminium hydroxide (2002) % Patients on aluminium hydroxide (2009)
6.7.3 KDOQI Calcium load
The total dose of elemental calcium provided by the calcium-based phosphate binders
should not exceed 1,500 mg/day and the total intake of elemental calcium (including
dietary calcium) should not exceed 2,000 mg/day
Figure 6.35: Calcium load for patients 2009
44
8
142
231
81
506
3
4
119
33
77
236
0%
10%
20%
30%
40%
50%
60%
70%
80%
90%
100%
A COCH MRI RPH SRH Region
Patients with calcium load <1.5 Patients with calcium load >1.5

NW Renal Audit Programme Management of bone mineral disease in dialysis patients
Version 1.0 February 2011 Page 30
6.7.4 Patients with high Calcium >2.5mmol/l
Figure 6.36: Percentage of patients with high calcium (> 2.5mmol/L) and percentage of
those on a calcium binder (calcium carbonate/calcium acetate)
6.7.5 Patients with low calcium <2.2 mmol/L
Figure 6.37: Percentage of patients with low Calcium and high phosphate NOT prescribed a binder.
0%
5%
10%
15%
20%
25%
A COCH MRI RPH SRH Region
percentage on a calcium binder (calcium carbonate/calcium acetate)
32%
16%
46%
36% 16% 31%
0%
5%
10%
15%
20%
25%
30%
A COCH MRI RPH SRH Region
NW Renal Audit Programme Management of bone mineral disease in dialysis patients
Version 1.0 February 2011 Page 31
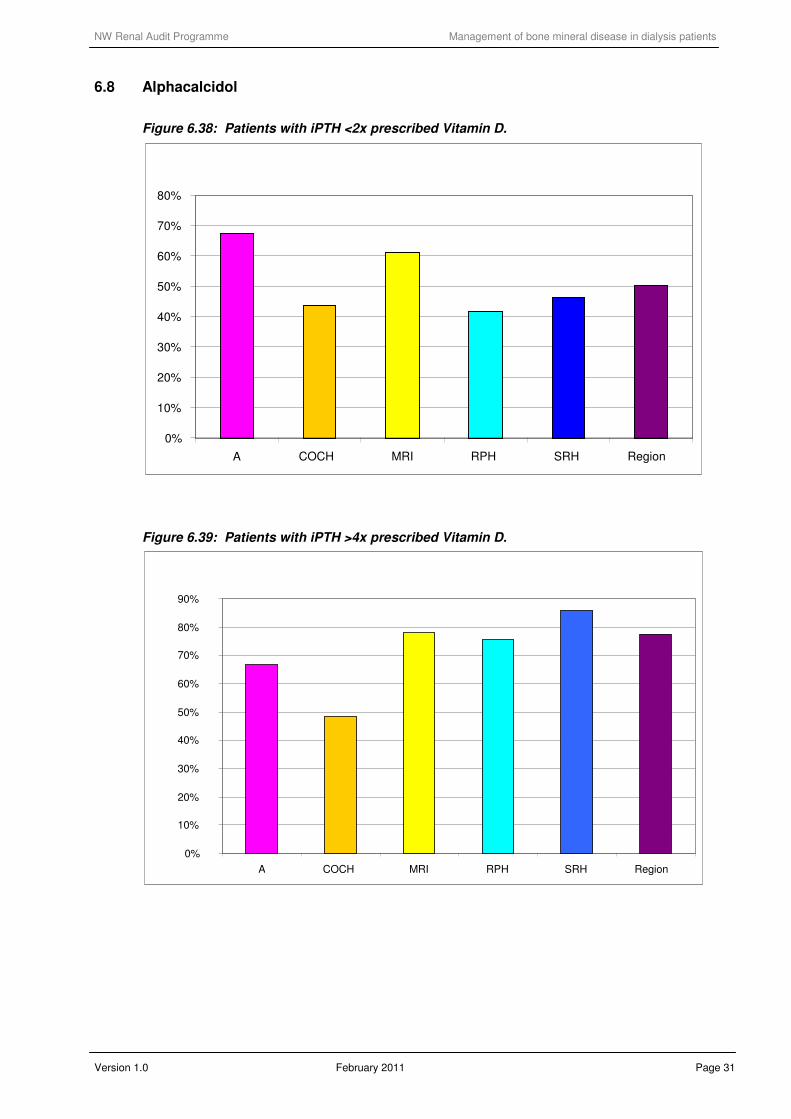
6.8 Alphacalcidol
Figure 6.38: Patients with iPTH <2x prescribed Vitamin D.
Figure 6.39: Patients with iPTH >4x prescribed Vitamin D.
0%
10%
20%
30%
40%
50%
60%
70%
80%
A COCH MRI RPH SRH Region
0%
10%
20%
30%
40%
50%
60%
70%
80%
90%
A COCH MRI RPH SRH Region

NW Renal Audit Programme Management of bone mineral disease in dialysis patients
Version 1.0 February 2011 Page 32
6.9 Cinacalcet
Figure 6.40: Percentage of patients’ receiving/not receiving cinacalcet (2009)
6.4
4
5.65.1
16
17.6
0%
2%
4%
6%
8%
10%
12%
14%
16%
18%
A COCH MRI RPH SRH Region
6.10 10th patient data
6.10.1 Dialysate used
Figure 6.41: Percentage concentration of calcium in dialysate used for patient subset
0%
10%
20%
30%
40%
50%
60%
70%
80%
90%
100%
1 1.25 1.5 1.75 Unknown 1 1.25 1.5 1.75 Unknown
HD Patients PD Patients
Calcium concentration
A COCH MRI RPH SRH

NW Renal Audit Programme Management of bone mineral disease in dialysis patients
Version 1.0 February 2011 Page 33
6.11 Patient contact with dietetic service
The percentage of patients seen by a dietitian in the past six months is fairly consistent
across the units (with A and COCH the highest at 100% and the lowest at SRH with
77%). There are no figures to compare with in 2002.
Figure 6.42: Number of patients seen by a dietitian in past six months (2009 data)
% seen in past six months (2009)
81%78% 77%79%
0%
10%
20%
30%
40%
50%
60%
70%
80%
90%
100%
A COCH MRI RPH SRH Region
As might be expected, Figure 6.43 shows that the patient group least likely to have seen
a dietitian in the past six months are the Home HD and PD patients.
Figure 6.43: Percentage of patients seen by dietitian in previous six month period
0%
10%
20%
30%
40%
50%
60%
70%
80%
90%
100%
A
CO
CH
MR
I - H
D
MR
I - H
HD
MR
I - P
D
Maccle
sfield
NM
GH
Tam
esid
e
Wyth
enshaw
e
RP
H H
D
RP
H P
D
Accringto
Bla
ckpool
Burn
ley
Chorley
Kendal
SR
H H
D
SR
H H
HD
SR
H P
D
Bolton
Rochdale
Wig
an
Regio
n

NW Renal Audit Programme Management of bone mineral disease in dialysis patients
Version 1.0 February 2011 Page 34
Figure 6.44: Reason for referral of 10th
patient subset to dietitian.
2 1
31
7
1253
11 6
9
35
2485
0%
10%
20%
30%
40%
50%
60%
70%
80%
90%
100%
A COCH MRI RPH SRH Region
Routine Review All other reasons
Most dietician reviews are directed rather than routine, and this may reflect different
practices in each dietetic unit or different reporting of referral reason.
6.12 Drug data recording
Reassuringly the percentage of patients prescribed a medication by the GP corresponds
to the number of patients who are thought to be taking the medication by the hospitals.
However the dose differences were not investigated

NW Renal Audit Programme Management of bone mineral disease in dialysis patients
Version 1.0 February 2011 Page 35
Figure 6.45: Graph showing the number of prescriptions for drugs between GP and hospital records.
9289
7 6
33
25 26 28
4846
30 31
2 2
0
10
20
30
40
50
60
70
80
90
100
No. pre
scribed A
lfacalc
idol (H
)
No. pre
scribed A
lfacalc
idol G
P)
No. pre
scribed C
inacalc
et (H
)
No. pre
scribed C
inacalc
et (G
P)
No. pre
scribed (H
)
No. pre
scribed (G
P)
No. pre
scribed (H
)
No. pre
scribed (G
P)
No. pre
scribed (H
)
No. pre
scribed (G
P)
No. pre
scribed (H
)
No. pre
scribed (G
P)
No. pre
scribed (H
)
No. pre
scribed (G
P)
Alfacalcidol Cinacalcet Calcium
Carbonate
binder
Calcium
Acetate
(Phosex)
Sevelemar
Hydrochloride
(Renagel)
Lanthanum
Carbonate
(Fosrenol)
Alucaps

NW Renal Audit Programme Management of bone mineral disease in dialysis patients
Version 1.0 February 2011 Page 36
7.0 DISCUSSION OF RESULTS
7.1 The standards
Two sets of guidelines were looked at during this audit: the Renal Association Guidelines for
calcium, phosphate, calcium-phosphate product and iPTH and KDOQI guidelines for the same.
Table 2: Guidelines ranges for current audit
Renal Association KDOQI
Serum calcium
(corrected for albumin) 2.2 - 2.5 mmol/L 2.10 – 2.37 mmol/l
Serum Phosphate 1.1 - 1.8 mmol/L
1.13 – 1.78 mmol/l
Calcium Phosphate
Product < 5
CAXP should be less than 4.4
ng/l
The target range for parathyroid
hormone measured using an intact
PTH assay should be between 2 and
4 times the upper limit of normal for
the intact PTH assay used. The same
target range should apply when using
the whole molecule PTH assay.
iPTH concentration in range
150 – 300 ng/l
iPTH
to be measured at least every 6
months
The results for each of the standards have been summarised in the table below
Table 3: Summary of results for Renal Association standards (2010 data)
Percentage achieving
target regionally Lowest performing units Best performing units
RA KDOQI RA KDOQI RA KDOQI
Serum calcium
(corrected for albumin) 66.9% 26.8% MRI HD Furness COCH Wigan
Serum Phosphate 61.1% 52.7% SRH HD RPH HHD Furness Furness
Calcium Phosphate Product 89.3% 83.2% MRI HD Macclesfield Furness Furness
iPTH 26.1% 27.8% Rochdale Macclesfield Furness Furness

NW Renal Audit Programme Management of bone mineral disease in dialysis patients
Version 1.0 February 2011 Page 37
7.2 Comparison with previous audit data
The following table gives a breakdown of percentage reaching standards from previous audits.
It should be noted, however, that the standards have changed over this time period so direct
comparison is difficult. Data from 2000 is compared to the standards in The Renal Association.
Treatment of adult patients with renal failure. Recommended standards and audit measures.
Second Edition November 1997; and those in 2002 to The Renal Association. Treatment of
adults and children with renal failure. Standards and audit measures. Third Edition August
2002.
Table 4: Comparison of 2000, 2002 and 2010 data
Regional HD/HHD PD
Standard 2000 2002 2010 2000 2002 2010 2000 2002 2010
Calcium
2000: total calcium within the normal
range. 2002: 2.2 - 2.6 mmol/l
2010: 2.2 - 2.5 mmol/L
63% 68% 66.9% 60% 69% 68.1% 67% 66% 60.9%
Phosphate
2000: < 1.8 mmol/l. 2000: PD
patients 1.1–1.6 mmol/l. 2002: < 1.8
mmol/l. 2010: 1.1 - 1.8 mmol/L.
56% 59.9% 61.2% 60.7% 60.6%
iPTH
2000: iPTH 2 and 3 times the local
normal range (130–210 pg/ml).
2002: iPTH concentration: < x4 upper
limit of normal of the assay used
26.1%
Calcium Phosphate product
2002: Local guidelines
Calcium phosphate product < 5
2010:
67.3% 74.1% 89.3% 84.4% 82.4%
All four targets 33% 12%
Table 5: Results for 2002 and 2010 related to KDOQI guidelines
Regional HD/HHD PD
Standard (same 2002/2010) 2002 2010 2010 2010
2002 Serum phosphate in range 1.13 -
1.78 mmol/l 55% 53% 52.9% 51.6%
2002: Serum calcium (corrected) in range
2.10 - 2.37 mmol/l 25% 52.7% 51.6% 58.1%
2002: Parathyroid hormone (iPTH) iPTH
concentration in range 150 - 300 ng/l 19% 27.8% 27.1% 31.1%
2002: Ca x PO4 should be less than 4.4
ng/l 59% 77% 76.4% 75.4%
Percentage meeting all four targets 1.4% 7%
7.3 Factors influencing the data during the audit period
Data has not been submitted by Royal Liverpool Hospital for this audit period. It is our
intention to pursue data collection at RLH to ensure that we have a full dataset for
comparison when we re-audit in two years (2012).

NW Renal Audit Programme Management of bone mineral disease in dialysis patients
Version 1.0 February 2011 Page 38
8.0 CONCLUSIONS
This audit is a valid audit of bone chemistry metabolism. It encompassed 1703 patients across
the North West but unfortunately this report does not include data from Liverpool and its’
satellite hospitals. This audit did show wide variety of biochemical control and bone chemistry
drug usage across the region also highlighting the difficulties that all clinicians face while
treating this complex condition. The main findings are highlighted below:
• Calcium control has been maintained and is comparable to England and Wales 2008
data.
• Phosphate control is comparable to England and Wales 2008 data. All units improved
except Salford Royal Hospital
• iPTH is comparable to England and Wales 2008 data
• There has been an increase from 1.4% to 7% reaching all 4 KDOQI targets since 2002
• As a region the percentage of patients with a high serum calcium still prescribed a
calcium binder is 31%
• As a region 50% of patients with a low iPTH are prescribed vitamin D analogues.
9.0 RECOMMENDATIONS
• As a region we are comparable to England and Wales from 2008 according to Renal
registry data but there is room for improvement in both satellite units and main hubs. All
units should form, if not in place already, MDT meetings to focus on the outliers at the
minimum but also monitor for trends in biochemical values which cannot be covered in
this audit.
• Regular in-house audit should be maintained to view whether a change of practice has
led to improvement of control. Regional audit still also needs to be maintained to
highlight differences across the region and to drive improvement.
• The recording of medication in all dialysis patients can be poor. Medication and changes
of medication need to be recorded more accurately, thoroughly, and preferably
electronically to allow for easier access to all team members dealing with patients,
including GPs.
• All units need to monitor patients for increasing trends in calcium and if calcium does
become increased then the dose of vitamin D analogues or calcium binders should be
reviewed

NW Renal Audit Programme Management of bone mineral disease in dialysis patients
Version 1.0 February 2011 Page 39
• Though some patients who have had a parathyroidectomy require some vitamin D
analogues this does not account for the large amount of patients who have a low iPTH
according to recommended targets who are still prescribed vitamin D. In view of this all
units should monitor trends in iPTH and adjust medication accordingly to avoid low
levels.
• All units should consider the development of patient education groups with the aim to
improve patients understanding of the importance of diet, phosphate control and the
correct usage of binder therapy. This should have the aim of improving patient
compliance and concordance with drug therapies and diet.
• Future audits should consider the collection of data on 25 hydroxy-vitamin D2 and D3
levels if they have been checked and whether vitamin D2 or D3 replacement has been
prescribed and given in the previous 12 months.
• Future audits should consider collection of details regarding dialysis adequacy, dialysis
length, and more information regarding modality, e.g. haemodialfiltration or
haemodialysis, etc as if this is related to better control, as has been found in other
regions, then this could help target difficult patients for different management or with
future commissioning of services
• Future audits should consider collection of data relating to dialysate calcium as this may
have an impact on calcium control and would benefit from further analyses.
• Future audits should consider ways of collecting data on patient compliance with
medication

NW Renal Audit Programme Management of bone mineral disease in dialysis patients
Version 1.0 February 2011 Page 40
GLOSSARY OF TERMS AND ABBREVIATIONS APPENDIX 1
ACE inhibitors Angiotensin-converting enzyme inhibitors
ACR Albumin : creatinine ratio
APD Automated Peritoneal Dialysis
ARB Angiotensin receptor blocker (antagonist),
BMI Body Mass Index
BP Blood Pressure
CABG Coronary Artery Bypass Grafting
CAPD Continuous Ambulatory Peritoneal Dialysis
CKD Chronic Kidney Disease
CVA Cerebrovascular accident
CVD Cardiovascular Disease
DM Diabetes Mellitus
DOB Date of Birth
eGFR estimated Glomerular Filtration Rate
EPO Erythropoietin
ESA Erythropoietin stimulating agent
Fe Iron
Hb Haemoglobin
HD Haemodialysis
HT Hypertension
IHD Ischaemic Heart Disease
MI Myocardial Infarction
NICE National Institute for Health and Clinical Excellence
NSF National Service Framework
NWRA North West Renal Audit
PCR Protein : Creatinine ratio
PD Peritoneal Dialysis
PTH Parathyroid Hormone
PTH Parathyroid Hormone
PVD Peripheral Vascular Disease
RA Renal Association
RR Renal Registry
Hospital Short Codes
A University Hospital Aintree
AP Arrowe Park Hospital
MRI Manchester Royal Infirmary
RPH Royal Preston Hospital
SRH Salford Royal Hospital

NW Renal Audit Programme Management of bone mineral disease in dialysis patients
Version 1.0 February 2011 Page 41
PROJECT PLAN APPENDIX 2
NORTH WEST RENAL AUDIT PROGRAMME
MANAGEMENT OF MINERAL BONE DISEASE IN DIALYSIS PATIENTS
PROJECT PLANNING GUIDE
AUDIT PROJECT:
Audit leads: � Dr Helen Eddington
Specialist Registrar in Renal Medicine
Salford Royal Hospital NHS Foundation Trust
� Nora Kerigan
Specialist Nurse
Royal Preston Hospital
Audit facilitator: � Tracey Powell
Regional Renal Audit Co-ordinator
REASONS FOR
CHOICE
Aims & objectives: For whole dialysis population
� To measure achievement of the Renal Association standards and compliance
with the KDOQI guidelines for calcium, phosphate, calcium phosphate product
and serum PTH.
� To assess compliance with the K/DOQI guideline for calcium load.
� To compare prescribing practice for phosphate binders and vitamin D
� To measure the incidence of parathyroidectomy
� To quantify the use of cinacalcet for the treatment of patients with secondary
hyperparathyroidism
� To compare the commercial machines and assays used by the hospital
laboratories for the measurements above.
NB Helen Eddington plans to assess the variability of commercial intact PTH assay
measurements across the region as a separate research project.
For 10% sample of dialysis population
� To note the systems used to track drug information and assess the accuracy
of these systems.
� To quantify use of IV Vitamin D
� To assess calcium load
� To compare dietetic contact between the units
Proposed health
benefits:
� To reduce the risk of renal bone disease
� To reduce the risk of hyperparathyroidism
Evidence base: � Young EW, Albert JM, Satayathum S, Goodkin DA, Pisoni RL, Akiba T,
Akizawa T, Kurokawa K, Bommer J, Piera L, Port FK. Predictors and
consequences of altered mineral metabolism: the Dialysis Outcomes and
Practice Patterns Study. Kidney Int 2005 Mar; 67(3):1179-87.
� Block GA, Klassen PS, Lazarus JM, Ofsthun N, Lowrie EG, Chertow GM.
Mineral metabolism, mortality and morbidity in maintenance hemodialysis. J
Am Soc Nephrol 2004 Aug; 15(8):2208-182).
� London GM; Guerin AP; Marchais SJ; Metivier F; Pannier B; Adda H. Arterial

NW Renal Audit Programme Management of bone mineral disease in dialysis patients
Version 1.0 February 2011 Page 42
media calcification in end-stage renal disease: impact on all-cause and
cardiovascular mortality. Nephrol Dial Transplant 2003 Sep; 18(9):1731-40.
� Lepage R, Roy L, Brossard J-H, Rousseau L, Dorais C, Lazue C, D’Amour P.
A non-(1–84) circulating parathyroid hormone (PTH) fragment interferes
significantly with intact PTH commercial assay measurements in uremic
samples. Clinical Chemistry 1998; 44:805-809.
� Block, GA, Hulbert-Shearon, TE, Levin, NW, Port, FK. Association of serum
phosphorus and calcium phosphate product with mortality risk in chronic
hemodialysis patients: A national study. Am J Kidney Dis 1998; 31:607.
� The importance of dietary calcium and phosphorous in the secondary
hyperparathyroidism of patients with early renal failure. Am J Kidney Dis 1997;
29:496-502.
� Foley RN, Parfrey PS, Harnett JD, Kent GM, Hu L, O'Dea R, Murray DC, Narre
PE. Hypocalcaemia, Morbidity and Mortality in End-Stage Renal Disease. Am
J Nephrol 1996: 16: 386-393.
� Dawson-Hughes B, Heaney RP, Holick MF, Lips P, Meunier PJ, Vieth R.
Estimates of optimal vitamin D status. Osteoporosis Int 2005; 16: 713-716.
� Bischoff-Ferrari HA, Willett WC, Wong JB, Giovannucci E, Dietrich T, Dawson-
Hughes B. Fracture prevention with vitamin D supplementation: a meta-
analysis of randomized controlled trials. JAMA 2005; 293(18): 2257-2264.
� Zitterman A. Vitamin D in preventive medicine: are we ignoring the evidence?
Br J Nutr 2003; 89: 552-572.
� Lips Vitamin D Deficiency and secondary hyperparathyroidism in the elderly:
consequences for bone loss and fractures and therapeutic implications.
Endocr Rev 2001; 22: 477-501. Tsuchihashi K, Takizawa H, Torii T et al.
� Hypoparathyroidism potentiates cardiovascular complications through
disturbed calcium metabolism: possible risk of vitamin D(3) analog
administration in dialysis patients with end-stage renal disease. Nephron 2000;
84:13–20.
� Thomas MK, Lloyd-Jones DM, Thadhani RI, Shaw AC, Deraska DJ, Kitch BT,
Vamvakas EC, Dick IM, Prince RL, Finkelstein JS: Hypovitaminosis D in
medical inpatients. N Engl J Med 1998; 338:777-783.
� Bouillon RA, Auwerx JH, Lissens WD, Pelemans WK: Vitamin D status in the
elderly: Seasonal substrate deficiency causes 1,25-dihydroxycholecalciferol
deficiency. Am J Clin Nutr 1987; 45:755-763.
METHODOLOGY
Standards: � Regional Association Clinical Practice Guidelines1
Phosphate
Serum phosphate should be maintained between 1.1 and 1.8mmol/l
Calcium
Serum calcium, adjusted for albumin concentration should be maintained within the
normal reference range for the laboratory used and ideally between 2.2 and 2.5
mmol/L
Serum calcium phosphate product
The serum albumin corrected calcium phosphate product should be kept below 4.8
mmol2/L
2 and ideally below 4.2 mmol
2/L
2

NW Renal Audit Programme Management of bone mineral disease in dialysis patients
Version 1.0 February 2011 Page 43
Serum parathyroid hormone
The target range for parathyroid hormone measured using an intact PTH assay
should be between 2 and 4 times the upper limit of normal for the intact PTH assay
used. The same target range should apply when using the whole molecule PTH
assay.
1Clinical Practice Guidelines Committee Renal Association Clinical Practice
Guidelines 4th Edition 2007 www.renal.org/guidelines
Guidelines:
� K/DOQI Clinical Practice Guidelines for Bone Metabolism and Disease in
Chronic Kidney Disease
www.kidney.org/professionals/kdoqi/guidelines_bone/index.htm
Patients: � All dialysis patients in the North West Region on 1st November 2009.
Methods: For whole dialysis population
� For HD and PD patients serum albumin corrected calcium, phosphate and
iPTH will be collected from the monthly blood test that includes iPTH
measurement in either November, October or September 2009 ensuring
calcium, phosphate and iPTH are taken from the same blood test. If no iPTH
available in this time frame record most recent corrected calcium and
phosphate (HD and PD patients).
� If iPTH has not been collected with monthly bloods within the time frame
above then the iPTH result should be taken from the most recent iPTH
measurement taken in the last 6 months. If the results are not available, the
patient will be excluded from that part of the analysis.
� Use of phosphate binders and vitamin D and the prescribed dose, and the
source of this information will be recorded.
� Use of cinacalcet will be recorded.
� The number of patients who had a parathyroidectomy will be recorded.
� The machines and assays used by the hospital laboratories to measure the
biochemical variables will be recorded.
For 10% sample of dialysis population
A 10% sample of dialysis population will be selected by taking every 10th
patient on
a list of patients ordered by hospital number, at each unit. Additional information will
be collected on these patients
� IV Vitamin D and dialysate used will be recorded from the hospital drug
cardex.
� The hospital systems used to track drug information will be recorded and a GP
record of the patients’ drug prescription will be requested.
� Contact with dietitians will be recorded from dietetic records.
Health disciplines
involved:
� Dietitians Nurses
� Pharmacists Physicians
Timescale: � Start of data collection: November 2009
� Deadline for data collection: Spring 2010
ACTION
Proposed date for
audit presentation:
Presentation Meeting July 2010

NW Renal Audit Programme Management of bone mineral disease in dialysis patients
Version 1.0 February 2011 Page 44
DATA COLLECTION TOOL / DATA PARAMETERS APPENDIX 3
Bone Chemistry Audit Dataset
All patients
Reference number
Unit
Name
DOB
Gender (M/F)
Ethnicity
Diabetes (Y/N)
If yes, insulin (Y/N)
Phosphate
Phosphate date
Calcium
Calcium date
iPTH
iPTH date
Binder (Y/N)
Type binder
Dose of binder
Alphacalcidol (Y/N)
Oral or IV?
Alphacalcidol dose
Source of drug information (Clinic letter, dialysis
folder, IT system)
Cinacalcet (Y/N)
Dose cinacalcet
Has patient had a previous transplant (Y/N)
Parathyroidectomy (Y/N)
Date of parathyroidectomy
Comments
Every 10th patient
Reference number
IV vitamin D (Y/N)
Dose IV vitamin D
Dialysate used
Seen by dietitian (Y/N)
Date last seen by dietitian
Reason seen by dietitian
Date drug list sent
Drug 1
Drug 2
Drug 3
Drug 4
Drug 5
Drug 6
Drug 7
Drug 8
Drug 9
Drug 10

NW Renal Audit Programme Management of bone mineral disease in dialysis patients
Version 1.0 February 2011 Page 45
DATA TABLES APPENDIX 4
Data analysis tables are available on request from the North West Renal Audit office, telephone 0161 276
4224 or via email to [email protected] or [email protected].
Raw data for your unit can also be requested.
Both data types are available in excel spreadsheet format.


